Article

A Lightweight Aerial Power Line Segmentation Algorithm Based on Attention Mechanism

1
Department of Electronic and Electrical Engineering, Wuhan Textile University, Wuhan 430200, China
2
State Grid Information & Telecommunication Group Co., Ltd., Beijing 102211, China
3
State Grid Henan Electric Power Company Xinyang Power Supply Company, Xinyang 464000, China
4
School of Electrical and Automation, Wuhan University, Wuhan 430072, China
*
Author to whom correspondence should be addressed.
Machines 2022, 10(10), 881; https://doi.org/10.3390/machines10100881
Submission received: 26 August 2022 / Revised: 27 September 2022 / Accepted: 28 September 2022 / Published: 1 October 2022

Abstract

:
Power line segmentation is very important to ensure the safe and stable operation of unmanned aerial vehicles in intelligent power line inspection. Although the power line segmentation algorithm based on deep learning has made some progress, it is still quite difficult to achieve accurate power line segmentation due to the complex and changeable background of aerial power line images and the small power line targets, and the existing segmentation models is too large and not suitable for edge deployment. This paper proposes a lightweight power line segmentation algorithm—G-UNets. The algorithm uses the improved U-Net of Lei Yang et al. (2022) as the basic network (Y-UNet). The encoder part combines traditional convolution with Ghost bottleneck to extract features and adopts a multi-scale input fusion strategy to reduce information loss. While ensuring the segmentation accuracy, the amount of Y-UNet parameters is significantly reduced; Shuffle Attention (SA) with fewer parameters is introduced in the decoding stage to improve the model segmentation accuracy; at the same time, in order to further alleviate the impact of the imbalanced distribution of positive and negative samples on the segmentation accuracy, a weighted hybrid loss function fused with Focal loss and Dice loss is constructed. The experimental results show that the number of parameters of the G-UNets algorithm is only about 26.55% of that of Y-UNet, and the F1-Score and IoU values both surpass those of Y-UNet, reaching 89.24% and 82.98%, respectively. G-UNets can greatly reduce the number of network parameters while ensuring the accuracy of the model, providing an effective way for the power line segmentation algorithm to be applied to resource-constrained edge devices such as drones.

1. Introduction

Regular inspection of power lines is an important measure to ensure the safe and stable operation of the power grid. Traditional manual inspections have problems of low efficiency and high safety risks. In recent years, UAV (unmanned aerial vehicle) intelligent inspections have gradually begun to replace manual inspections, and have become a research hotspot in current transmission line inspections [1,2]. Power line segmentation is a key technology in the process of UAV intelligent power line inspection. Accurate extraction of power lines can provide an effective basis for UAV navigation and obstacle avoidance [3].
Aerial power line images often have complex and changeable backgrounds [4], and power lines are quite different from conventional targets with a certain area such as buildings, animals, plants, and people. A large number of linear structures such as roof ridges and road edges in the image background have similar features, and it is challenging to accurately extract them.
The existing power line extraction algorithms are mainly divided into two categories: traditional digital image processing methods and deep learning-based algorithms.
In the traditional digital image processing method, the target line segment is selected and extracted mainly according to the edge characteristics of the image combined with the surrounding environment of the power line; the power line usually presents a straight line amongst other characteristics [5,6,7,8]. In general, it is difficult to maintain the good performance of the algorithm in the face of different scene changes when using traditional digital image processing methods to extract power lines.
The deep learning algorithm has become a research hotspot of power line segmentation algorithms due to its strong feature expression ability. Reference [9] uses CNN (Convolutional Neural Networks) to determine whether the image contains power lines, but it only stays at the classification level, and cannot directly locate the power lines in the image accurately; the reference [10] uses the proposed line segment detector to extract line segments in the image, create a line segment candidate pool, and establish an improved Markov random field model, automatically dividing the line segments in the candidate pool into different categories, and then the envelope-based fitting is used to select the power lines, which can completely extract the power lines. However, the use of context information lacks a certain rationality and the modeling process is complicated; the power line detection algorithm of the weak supervision method proposed in the literature [11] reduces the labeling cost of data set generation, but uses FCN (Fully Convolutional Networks) to segment the power line, and the result of the segmentation is not fine enough; the reference [12] uses the dual-branch Resnet50 as the backbone of the feature extraction network to build a multi-line feature enhancement network so that the false breakpoints in the power line detection image are suppressed, but the network model is large; the reference [13] uses the proposed joint saliency index to sparse and regularize the network, and uses network pruning to lighten the power line segmentation network of the improved U-Net [14,15], reducing the number of parameters of the model. The number of parameters of the model is reduced, but heavy training is required, and the workload is large; the improved U-Net segmentation network proposed in the literature [16] has higher segmentation accuracy in power line extraction, but the improved network model is still large, which creates challenges for edge devices such as drones, with limited storage space.
The introduction and application of inspection drones have brought light to the innovation of power inspection technology; however, the oversized network model is not conducive to deployment on portable devices. In this paper, the improved U-Net segmentation network in the literature [16] is used as the basic network (referred to as Y-Unet in this paper), and the model is lightened and the accuracy of model segmentation is improved to build a lightweight power line segmentation algorithm-A. The main improvements are as follows:
(1)
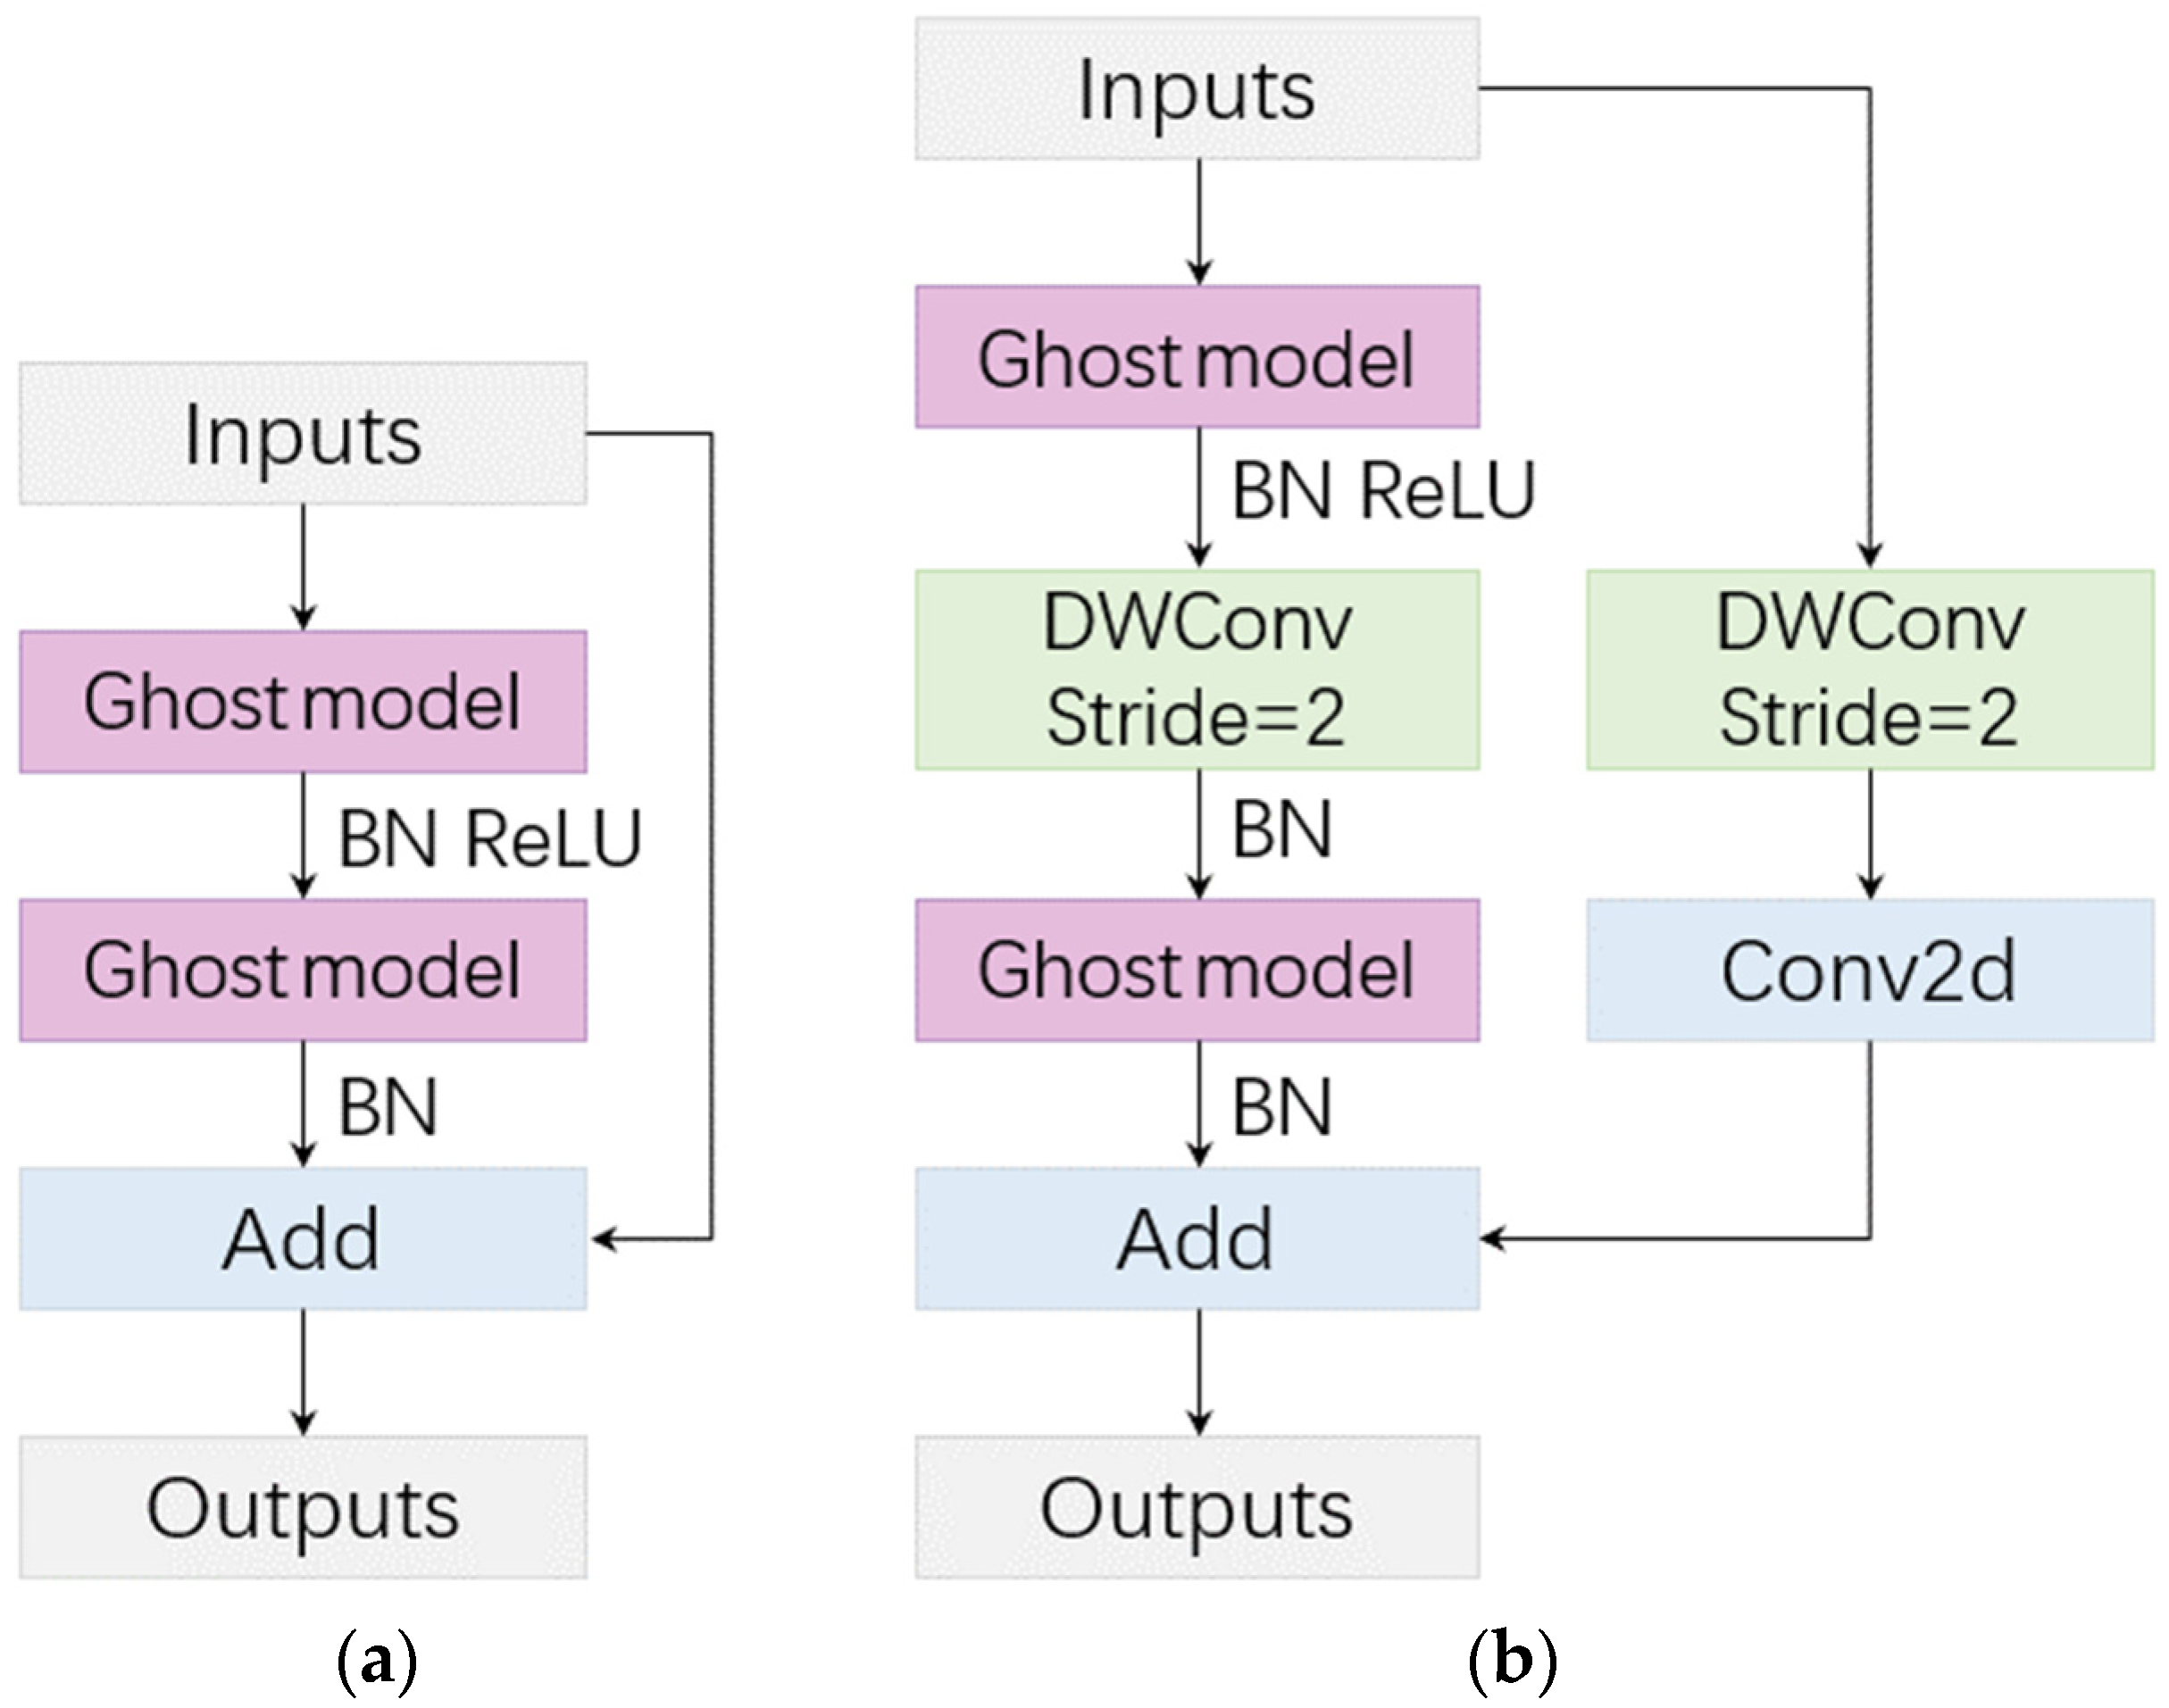
GhostNet [17] proposed by Han et al. is an efficient lightweight network whose main component is the Ghost bottleneck. Therefore, we proposed using a lightweight structure combining traditional convolution with the Ghost bottleneck as the encoder of the model G-UNets to extract power line features. At the same time, in the encoder stage of G-UNets, a multi-scale input fusion strategy was adopted to reduce the loss of context information, which significantly reduces the amount of Y-UNet parameters while ensuring segmentation accuracy.
(2)
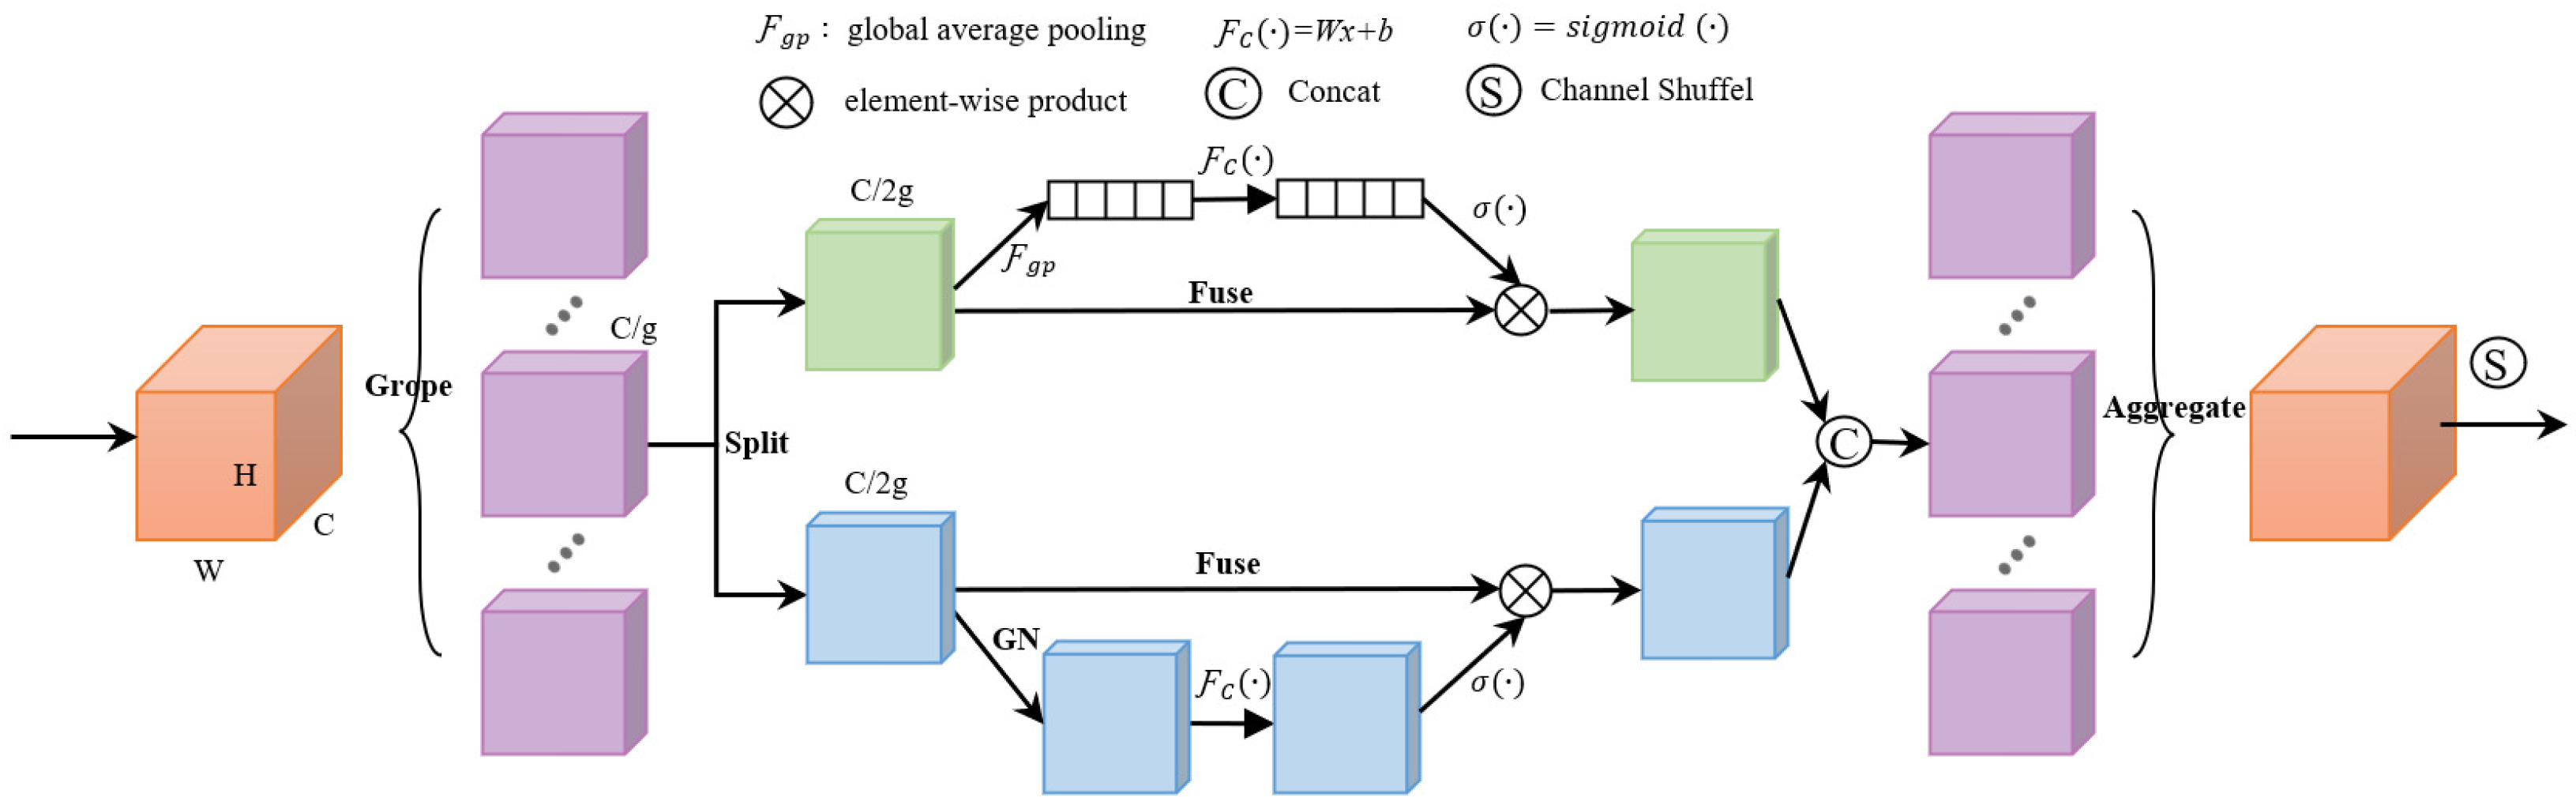
The spatial attention module in the upsampling process of Y-UNet was replaced by permutation attention that effectively combines spatial and channel attention, and the feature map was enhanced from the channel and space dimensions to improve the model segmentation accuracy.
(3)
In order to solve the problem of the distribution of positive and negative samples not being balanced and affecting the performance of the model, a weighted hybrid loss function fused by Focal loss [18] and Dice loss [19] was constructed.

2. Basic Principle of Y-UNet

U-Net has become one of the basic architectures in the field of semantic segmentation due to its good network performance, and its various variants are widely used in medicine, remote sensing, e-commerce, and other fields [20,21,22,23]. The basic network (Y-UNet) used in this paper is a segmentation network proposed by Lei Yang et al. in 2022, combining the characteristics of transmission lines and based on U-Net improvements. The Y-UNet structure is composed of two parts, the main network branch composed of the encoder and the decoder, and the fusion network branch, as shown in Figure 1. The encoder extracts image features through a series of convolutional and pooling layers. The decoder is composed of a series of convolutional layers, upsampling and spatial attention modules. For the class imbalance problem of power lines, an attention block(AM) is embedded to make the segmentation network more accurately locate the target area in the power line image. The structure of the spatial attention module used in the decoder part is shown in Figure 2. A skip connection is used between the encoder and the decoder to reduce information loss. The fusion network branch fuses the feature maps of different scales with different representation capabilities acquired by the decoder through upsampling, convolution, and splicing, and then introduces SENet [24] (squeeze-and-excitation Networks) to the fused feature maps. Channel attention reconstruction is performed, and the reconstructed feature map is passed into two convolutional layers and a convolutional layer containing the sigmoid activation function to achieve multi-scale feature fusion and effectively improve the network’s segmentation effect on power lines.

3. G-UNets

3.1. Overall Structure of G-UNets

The power line extracted by Y-UNet has high accuracy, but the network parameters are large, and the practicability needs to be improved. To reduce the number of parameters of Y-UNet under the premise of ensuring segmentation accuracy and making the network more practical, this paper constructs a lightweight segmentation network (G-Unets) based on an attention mechanism to achieve pixel-level multi-scene power line segmentation. The overall structure of G-UNets is shown in Figure 3.

3.2. Encoder Structure

To make the model easy for embedded deployment, G-UNets draws on the lightweight network GhostNet in the encoder structure and selects the traditional convolution module (Conv2d-M) and Ghost bottleneck (G-bneck) to extract power line features to reduce the number of model parameters. Among them, the traditional convolution module (Conv2d-M) is to add BN (Batch Normalization) and ReLU after convolution to improve the network generalization performance. At the same time, G-Units adopt a multi-scale input fusion strategy in the encoder structure. The implementation method is: in each feature extraction layer, the small-size features of the corresponding size generated by the traditional convolution module are fused with the features generated by the Ghost bottleneck to obtain the fused features, and the fused features are used as the input features of the next feature extraction layer. The multi-scale input fusion strategy is to obtain the multi-scale information of the image by effectively fusing the features of different scales, improving the network feature extraction ability, and making the power line image segmentation results more accurate.
The network parameters of the encoder structure are shown in Table 1. The 2nd, 3rd, and 4th rows of Table 1, respectively, generate the sizes of 256 × 256 × 16, 128 × 128 × 24, and 64 × 64 × 40 after the initial input image of size 512 × 512 × 3 is generated by the traditional convolution module. The add operation in lines 7 and 8, is to fuse the small-size feature generated by the traditional convolution module in the second line with the feature generated by the Ghost bottleneck in the fifth line to obtain the feature. The output features of the extraction layer are the same as the two add operations on lines 11 and 12 and lines 15 and 16.
The Ghost bottleneck used in the G-UNets encoder structure is built based on the Ghost module. The Ghost module generation diagram is shown in Figure 4. For the input feature map H × W × C , the Ghost module first uses traditional convolution to generate a partial feature map H × W × M , then performs a simple linear operation Φ on the feature map generated in the previous step to generate redundant feature maps, and finally splices the feature maps generated in the two steps to get Output feature map H × W × N .
Assuming that the number of linear transformations is s, s C , when the size of the traditional convolution kernel is p × p , and the size of the depthwise separable convolution kernel is d × d , the traditional convolution parameters are:
C t = N × C × p × p
The parameters of the Ghost module are:
C g = N s × C × p × p + ( s 1 ) × N s × C × d × d
Then the parameter compression ratio of traditional convolution and Ghost module is:
R C = C t C g s
It can be seen from the analysis of Equations (1)–(3) that compared with the traditional convolution, using the Ghost module can greatly reduce the number of network parameters.
As shown in Figure 5, Ghost bottleneck is divided into two categories according to the step size. Its essence is a bottleneck structure composed of two stacked Ghost modules. The first is used for channel number expansion, and the second is used for channel number compression. The number matches the shortcut path. The Ghost bottleneck with Strides = 2 inserts a depthwise separable convolution with a step size of 2, which reduces the feature dimension and network scale while performing feature extraction. Compared with Y-UNet, which uses pooling to adjust the feature size, the method of adjusting the output size with a depthwise separable convolution with a stride of 2 reduces the loss of small object information loss.

3.3. Shuffle Attention

The encoder part of Y-UNet adopts the spatial attention module (AM), which aims to improve the feature extraction ability of the network, but it only emphasizes key information or suppresses invalid information in the spatial dimension; without considering the importance of the information contained in the features in the channel, it is easy to ignore the information interaction in the channel.
Shuffle Attention (SA) [25] is a lightweight and comprehensive module that effectively integrates the spatial attention mechanism and channel attention mechanism, and its network structure is shown in Figure 6.
Shuffle Attention divides the input features into G groups according to the channel dimension, and divides each group of features into T g 1 and T g 2 according to the channel. Attention features are learned from two branches, and one branch uses the relationship between feature channels to generate a channel attention map. Another branch exploits the spatial relationship between features to generate spatial attention maps.
For the channel attention branch, the feature T g 1 is first subjected to global average pooling to generate channel statistics S1 to embed global information, then the linear transformation F c is used to scale and translate S1 along the spatial dimension, and finally, it is activated by the sigmoid function and then multiplied by the feature T g 1 to obtain the final output T g 1 of the channel attention branch. This process can be expressed by Formula (4):
T g 1 = σ ( F c ( F g p ( T g 1 ) ) ) T g 1 = σ ( W 1 S 1 + b 1 ) T g 1
In Formula (4): A represents global average pooling, and W 1 and b 1 are linear transformation parameters used for scaling and translation S1.
For the spatial attention branch, first, use Group Norm (GN) to process the feature T g 2 to obtain spatial statistics, then use linear transformation to enhance the feature, and finally activate by the sigmoid function and then multiply by the feature T g 2 to obtain the final output T g 2 of the spatial attention branch. This process can be expressed by Formula (5):
T g 2 = σ ( W 2 G N ( T g 2 ) + b 2 ) T g 2
In Formula (5): W 2 and b 2 are linear transformation parameters.
Then, the outputs T g 1 and T g 2 of the two branches are fused by Concat to obtain the output features of the group. Finally, the channel replacement operation is used to ensure the information interaction between the sub-features of each group, and the final attention map with the same size as the input feature is output.

3.4. Loss Function

In the power line segmentation task, the power line target is small, and the number of power lines and background pixels in the aerial image is seriously unbalanced. For the unbalanced distribution of positive and negative samples, the two loss functions often used in semantic segmentation tasks are Dice loss and Focal loss.
Dice loss [19] is not easily affected by the imbalance of positive and negative samples, and it focuses more on mining the foreground during the training process, but the loss will oscillate violently when small targets are used as positive samples. The definition formula of Dice loss is shown in Formula (6):
L D i c e = 1 2 i = 1 N p i p i i = 1 N p i + i = 1 N p i
In Formula (6): p i and p i are the actual value and predicted value of the ith pixel, respectively, and N is the total number of pixels.
Based on Cross-Entropy loss, Focal loss [18] adds a balance factor α to suppress the problem of sample imbalance, and at the same time, adds a regulation factor γ to reduce the weight of easy-to-classify samples and increase the attention to difficult and misclassified samples. The definition formula is shown in Formula (7):
L F o c a l = { α × ( 1 q ) γ × log q , p = 1 ( 1 α ) × q γ × log ( 1 q ) , p = 0
In Formula (7): p represents the true value of the label category, and q represents the probability value that the sample is positive.
In view of the extremely unbalanced problem of positive and negative samples of power line data, this paper combines the characteristics of Focal loss and Dice loss, scales the two to the same order of magnitude, and constructs a weighted mixed loss function, whose definition is shown in Formula (8):
L = ( 1 a ) L F o c a l a ln ( 1 L D i c e )
In Formula (8): L F o c a l and L D i c e represent Focal loss and Dice loss respectively, a is a weighting coefficient; it is found by experiments that a is optimal when set to 0.1 in this model.
The weighted hybrid loss function that combines Focal loss and Dice loss can combines the advantages of the two, which enables the network to strengthen the mining of foreground regions, and at the same time pay more attention to difficult and difficult samples, which can effectively solve the problem of the imbalance between the number of power line pixels and the number of background pixels when segmenting the power lines in the aerial image, and improve the semantic segmentation performance of the network for aerial power line data.

4. Experiment and Result Analysis

4.1. Experimental Environment Configuration and Data

The deep learning framework used in the experiment is based on the PyTorch1.9.0 environment, Ubuntu18.08 system, Python 3.7.6, CUDA = 11.2, and the training graphics card is configured as one RTX A6000/48G graphics card.
The dataset is derived from images of power lines taken by drones provided by power grid companies. A total of 1040 power line images were screened out, and the resolution of each image was 3840 × 2160 pixels. Labelme was used to label the images, and the data were enhanced and expanded by rotation, flip, brightness, and contrast transformation. The sample images of power lines in the dataset are shown in Figure 7, in which the power line itself has a relatively small target, has a variety of different angles, and its background is diverse, including examples where the power lines have low contrast to the background, and the background has a shape similar to the power lines. The dataset is divided into training set, validation set, and test set according to 8:1:1, and the image size is fixed to 512 × 512 pixels before finally being input to the network for training.

4.2. Evaluation Indicators

In this paper, F1-Score, IoU (Intersection over Union) [26], and parameter quantity (Params) are used as evaluation indicators of network performance. F1-Score and IoU are the evaluation of network segmentation performance. The larger the value, the better the segmentation effect. The parameter quantity is a measure of the model’s lightweight quality. The larger the parameter quantity, the higher the memory requirement of the model on the running platform. The calculation formulas of F1-Score and IoU are shown in Formula (9) and Formula (10), respectively:
F 1 - Score = 2   ×   TP 2   ×   TP + FP + FN
IoU = TP TP + FN + FP
In Equations (9) and (10), TP represents the number of power line pixels that are correctly classified; FP represents the number of background pixels that are wrongly classified as power line pixels; FN represents the number of power line pixels that are wrongly classified as background pixels.

4.3. G-UNets Model Training

The initial learning rate during model training is set to 1 × 10 4 , the batch size is set to 4, and the total number of epochs is 80. The change curve of the loss value during training and testing of the G-UNets model is shown in Figure 8. As can be seen from Figure 8, the training loss of the model is not much different from the validation loss curve. With the increase of epoch, the change of the model loss curve drops sharply to flatten, and the loss value drops sharply in the first 10 epochs. Then it gradually becomes stable. After 55 epochs, the loss curve has remained stable, indicating that the model has reached a good convergence state.

4.4. Exploring the Effectiveness of G-UNets

To verify the effectiveness of the G-UNets network design, an improvement and comparison experiment was gradually carried out on the power line dataset with Y-UNet as the benchmark, and finally the fusion improvement result, that is, the G-UNets network, was tested. Y-UNet_L adopted the network structure of Y-UNet and used a weighted mixed loss function as the model loss. Improvement 1 used the traditional convolution module combined with Ghost bottleneck to realize the feature extraction of the coding part on the structure of Y-UNet, making the network lightweight, and used the weighted hybrid loss function at the same time. Improvement 2 adopted a multi-scale input fusion strategy based on improvement 1. Improvement 3 replaced the attention block(AM) in the decoding stage with Shuffle Attention (SA) based on improvement 1. In addition, the above experimental methods can be compared with the lightweight network DeeplabV3+ [27] with excellent comprehensive performance. The experimental comparison data are shown in Table 2.
It can be seen from the experimental results in Table 2 that:
(1)
Comparing the experimental results of Y-UNet and Y-UNet_L, the F1-Score and IoU of Y-UNet_L using the weighted mixed loss function are improved by 1.12% and 1.31%, respectively.
(2)
Compared with Y-UNet_L, after improvement 1 selects a lightweight structure to extract power line features in the coding stage, its F1-Score and IoU are only slightly reduced, but the amount of network parameters is greatly reduced. This is due to the use of depthwise separable convolutions in the Ghost bottleneck structure, which can trade a small loss of accuracy for a large memory reduction.
(3)
Compared with Y-UNet, the improved methods 1–3 proposed have a certain improvement in F1-Score and IoU evaluation indicators, and compared with the Y-UNet parameter amount reduced by about 73%, indicating that the lightweight feature extraction method combined with the traditional convolution module and Ghost bottleneck, the multi-scale input fusion strategy, the replacement of the attention replacement AM module, and the weighted hybrid loss function is effective in this paper. The proposed improvement method can improve the network. The segmentation accuracy greatly reduces the number of network parameters.
(4)
From the perspective of F1-Score and IoU evaluation indicators, compared with Y-UNet, the improved method and the DeeplabV3+ network, the G-UNets proposed in this paper are the best in both F1-Score and IoU indicators. They reach 89.24% and 82.98%, respectively, which are 2.19% and 2.85% higher than Y-UNet, and far surpass the DeeplabV3+ network. In terms of parameter quantity, G-Unets is 6.808M, which is about 26.55% of Y-UNet and is only slightly larger than the DeeplabV3+ network. To test the model segmentation speed on the power line test set, G-UNets saves about 25% of the time to segment a graph compared to Y-UNet. It can be seen that while improving the accuracy of the model, G-UNets further improves the speed of segmentation, and can efficiently segment power lines in aerial images.

4.5. Comparison of Power Line Splitting Effects

We arbitrarily selected two power line images in the test set, to compare the segmentation effects of different improved models in Table 2 and Y-UNet. The segmentation comparison diagram is shown in Figure 9. Figure 9a is the input power line image, and Figure 9b is the real label image(ground truth). Figure 9c–g are the segmentation results of the input image by Y-UNet, Improvement 1, Improvement 2, Improvement 3 and G-UNets, respectively. Comparing the segmentation results, it can be found that there are obvious missed detections, false detections and power line breaks in the Y-UNet segmentation results. The segmentation results of the improved model are better than the Y-UNet segmentation results, and the missed detection, false detection and breakage of power lines are improved. The G-UNets segmentation effect is the best, with a small gap with the labeled image, showing that it can segment the power line more accurately.

5. Conclusions

In this paper, a lightweight power line segmentation algorithm (G-UNets) is proposed. Based on the improved segmentation network based on U-Net by Lei Yang et al., the amount of network parameters is reduced by combining traditional convolution with Ghost bottleneck to extract features, and the multi-scale input fusion strategy is used to make the model capture richer features. In addition, by changing to Shuffle Attention in the decoding stage and using a weighted mixed loss function that combines Focal loss and Dice loss, the model pays more attention to the power line area and improves the model segmentation performance. The comparative experiments show that G-UNets can achieve a large compression of the parameters, and at the same time can ensure the accuracy of the model, which verifies its high efficiency.
Although the lightweight G-UNets network proposed in this paper has improved the power line segmentation effect, when the power lines overlap or have a high similarity with the background, the segmentation accuracy still needs to be further improved. How to improve the segmentation accuracy and make the model more lightweight will be the focus of follow-up research.

Author Contributions

Conceptualization, G.H. and M.Z.; methodology, G.H.; software, M.Z.; validation, M.Z., L.Z. and T.L.; formal analysis, G.H.; investigation, Q.L. and X.L.; resources, K.L., L.Q. and Q.L.; data curation, Q.L., X.L. and L.Z.; writing—original draft preparation, M.Z.; writing—review and editing, G.H., M.Z. and L.Q.; visualization, T.L.; supervision, K.L. and L.Q. All authors have read and agreed to the published version of the manuscript.

Funding

This research was supported by the National Key R & D Program of China (No. 2020YFB0905900).

Institutional Review Board Statement

Not applicable.

Informed Consent Statement

Not applicable.

Data Availability Statement

Not applicable.

Conflicts of Interest

The authors declare no conflict of interest.

References

  1. Zhang, H.; Wu, L.; Chen, Y.; Chen, R.; Kong, S.; Wang, Y.; Hu, J.; Wu, J. Attention-guided multitask convolutional neural network for power line parts detection. IEEE Trans. Instrum. Meas. 2022, 71, 5008213. [Google Scholar] [CrossRef]
  2. Liu, Z.; Miao, X.; Chen, J.; Jiang, H. Review of visible image intelligent processing for transmission line inspection. Power Syst. Technol. 2020, 44, 1057–1069. [Google Scholar]
  3. Chen, M.; Wang, Y.; Dai, Y.; Yan, Y.; Qi, D. Small and strong: Power line segmentation network in real time based on self-supervised learning. Proc. CSEE 2022, 42, 1365–1375. [Google Scholar]
  4. Xu, C.; Li, Q.; Zhou, Q.; Zhang, S.; Yu, D.; Ma, Y. Power line-guided automatic electric transmission line inspection system. IEEE Trans. Instrum. Meas. 2022, 71, 3512118. [Google Scholar] [CrossRef]
  5. Li, Y.; Zhang, H.; Tong, L.; Cao, Y.; Xue, Z. Automatic power line extraction from high resolution remote sensing imagery based on an improved Radon transform. Pattern Recognit. 2016, 49, 174–186. [Google Scholar]
  6. Tian, F.; Wang, Y.; Zhu, L. Power line recognition and tracking method for UAVs inspection. In Proceedings of the 2015 IEEE International Conference on Information and Automation, Lijiang, China, 8–10 August 2015. [Google Scholar]
  7. Zhao, L.; Wang, X.; Dai, D.; Long, J.; Tian, M.; Zhu, G. Automatic extraction algorithm of power line in complex background. High Volt. Eng. 2019, 45, 218–227. [Google Scholar]
  8. Zhang, Y.; Wang, W.; Zhao, S.; Zhao, S. Research on automatic extraction of railway catenary power lines under complex background based on RBCT algorithm. High Volt. Eng. 2022, 48, 2234–2243. [Google Scholar]
  9. Yetgin, O.E.; Benligiray, B.; Gerek, O.N. Power line recognition from aerial images with deep learning. IEEE Trans. Aerosp. Electron. Syst. 2019, 55, 2241–2252. [Google Scholar] [CrossRef]
  10. Zhao, L.; Wang, X.; Yao, H.; Tian, M.; Jian, Z. Power line extraction from aerial images using object-based Markov random field with anisotropic weighted penalty. IEEE Access 2019, 7, 125333–125356. [Google Scholar] [CrossRef]
  11. Choi, H.; Koo, G.; Kim, B.J.; Kim, S.W. Weakly supervised power line detection algorithm using a recursive noisy label update with refined broken line segments. Expert. Syst. Appl. 2021, 165, 113895. [Google Scholar] [CrossRef]
  12. Chen, X.; Xia, J.; Du, K. Overhead transmission line detection based on multiple linear-feature enhanced detector. J. Zhejiang Univ. Eng. Sci. 2021, 55, 2382–2389. [Google Scholar]
  13. Xu, G.; Li, G. Research on lightweight neural network of aerial powerline image segmentation. J. Image Graph. 2021, 26, 2605–2618. [Google Scholar]
  14. Liu, J.; Li, Y.; Gong, Z.; Liu, X.; Zhou, Y. Power line recognition method via fully convolutional network. J. Image Graph. 2020, 25, 956–966. [Google Scholar]
  15. Ronneberger, O.; Fischer, P.; Brox, T. U-Net: Convolutional Networks for Biomedical Image Segmentation. In Proceedings of the International Conference on Medical Image Computing and Computer-Assisted Intervention(MICCAI), Munich, Germany, 5–9 October 2015. [Google Scholar]
  16. Yang, L.; Fan, J.; Xu, S.; Li, E.; Liu, Y. Vision-Based Power Line Segmentation With an Attention Fusion Network. IEEE Sens. J. 2022, 22, 8196–8205. [Google Scholar] [CrossRef]
  17. Han, K.; Wang, Y.; Tian, Q.; Guo, J.; Xu, C.; Xu, C. Ghost net: More features from cheap operations. In Proceedings of the 2020 IEEE/CVF Conference on Computer Vision and Pattern Recognition (CVPR), Seattle, WA, USA, 5 August 2020. [Google Scholar]
  18. Lin, T.; Goyal, P.; Girshick, R.; He, K.; Dollár, P. Focal Loss for Dense Object Detection. IEEE Trans. Pattern Anal. 2020, 42, 318–327. [Google Scholar] [CrossRef] [Green Version]
  19. Milletari, F.; Navab, N.; Ahmadi, S. V-Net: Fully Convolutional Neural Networks for Volumetric Medical Image Segmentation. In Proceedings of the 2016 Fourth International Conference on 3D Vision (3DV), Stanford, CA, USA, 25–28 October 2016. [Google Scholar]
  20. Yang, Z.; Wang, S.; Zhao, Y.; Liao, M.; Zeng, Y. Automatic Liver Tumor Segmentation Based on Cascaded Dense-UNet and Graph Cuts. J. Electron. Inf. Technol. 2022, 44, 1683–1693. [Google Scholar]
  21. Yuan, H.; Liu, Z.; Shao, Y.; Liu, M. ResD-UNet Research and Application for Pulmonary Artery Segmentation. IEEE Access 2021, 9, 67504–67511. [Google Scholar] [CrossRef]
  22. Wu, Z.; Zhao, L.; Zhang, H. MR-UNet Commodity Semantic Segmentation Based on Transfer Learning. IEEE Access 2021, 9, 159447–159456. [Google Scholar] [CrossRef]
  23. Cui, B.; Chen, X.; Lu, Y. Semantic segmentation of remote sensing images using transfer learning and deep convolutional neural network with dense connection. IEEE Access 2020, 8, 116744–116755. [Google Scholar] [CrossRef]
  24. Hu, J.; Shen, L.; Albanie, S.; Sun, G.; Wu, E. Squeeze-and-Excitation Networks. IEEE Trans. Pattern Anal. 2019, 8, 2011–2023. [Google Scholar]
  25. Zhang, Q.; Yang, Y. SA-Net: Shuffle Attention for Deep Convolutional Neural Networks. In Proceedings of the ICASSP 2021 IEEE International Conference on Acoustics, Speech and Signal Processing (ICASSP), Toronto, ON, Canada, 6–11 June 2021. [Google Scholar]
  26. Jiang, B.; Luo, R.; Mao, J.; Xiao, T.; Jiang, Y. Acquisition of Localization Confidence for Accurate Object Detection. ECCV 2018, 11218, 816–832. [Google Scholar]
  27. Chen, L.; Zhu, Y.; Papandreou, G.; Schroff, F.; Adam, H. Encoder-Decoder with Atrous Separable Convolution for Semantic Image Segmentation. In Proceedings of the 2018 European Conference on Computer Vision(ECCV), Munich, Germany, 8–14 September 2018. [Google Scholar]
Figure 1. Y-UNet structure. Each blue rectangle corresponds to a multi-channel feature map.
Machines 10 00881 g001
Figure 2. The attention block(AM) adopted by Y-UNet. Conv 7 × 7: convolution with kernel size 7 × 7.
Machines 10 00881 g002
Figure 3. G-UNets network structure. Each blue or purple rectangle corresponds to a multi-channel feature map.
Machines 10 00881 g003
Figure 4. Ghost module. Φ represents the cheap operation.
Machines 10 00881 g004
Figure 5. Ghost bottleneck structure. DWConv: depthwise separable convolution; BN: batch normalization. (a) Strides = 1; (b) Strides = 2.
Machines 10 00881 g005
Figure 6. Shuffle Attention network structure. The input features are divided into G groups of sub-features according to the channel dimension, and then each group of sub-features is divided into two branches; channel and spatial attention are performed on the two branches, respectively, and then the two branches are concat to achieve information fusion within the group, and finally channel shuffle is used to realize the information interaction between different sub-features.
Machines 10 00881 g006
Figure 7. Sample images from the power line dataset. Power lines in different directions and backgrounds.
Machines 10 00881 g007
Figure 8. G-UNets loss value change curve.
Machines 10 00881 g008
Figure 9. Power line segmentation comparison chart. (a) Input image; (b) Ground truth; (c) Y-UNet; (d) Improvement 1; (e) Improvement 2; (f) Improvement 3; (g) G-UNets.
Machines 10 00881 g009
Table 1. Encoder structure network parameters.
InputOperatorExpansionOutputSEStride
5122 × 3Conv2d-M-5122 × 8-1
5122 × 3Conv2d-M-2562 × 16-2
5122 × 3Conv2d-M-1282 × 24-4
5122 × 3Conv2d-M-642 × 40-8
5122 × 8Conv2d-M-5122 × 16-2
2562 × 16G-bneck162562 × 16-1
2562 × 16Add-2562 × 16--
2562 × 16
2562 × 16G-bneck482562 × 24-2
1282 × 24G-bneck721282 × 24-1
1282 × 24Add-1282 × 24--
1282 × 24
1282 × 24G-bneck721282 × 4012
642 × 40G-bneck120642 × 4011
642 × 40Add-642 × 40--
642 × 40
642 × 40G-bneck240642 × 80-2
322 × 80G-bneck200322 × 80-1
322 × 80G-bneck184322 × 80-1
322 × 80G-bneck480322 × 11211
322 × 112G-bneck672322 × 11211
Table 2. Network model performance and parameter comparison.
MethodConv2d-M & G-BneckMulti-InAMSAWH-LossF1-Score
(%)
IoU
(%)
Params
(M)
Speed
(s)
Y-UNet 87.0580.1325.6383.9726
Y-UNet_L 88.1781.4425.6383.9287
Improvement 1 88.1281.336.7963.0625
Improvement 2 88.5181.876.8083.1838
Improvement 3 88.7382.286.7963.0550
DeeplabV3+ [27] 56.4153.045.8310.0167
G-UNets 89.2482.986.8082.9983
Conv2d-M & G-bneck: traditional convolution module combined with Ghost bottleneck; Multi-In: multi-scale input fusion strategy; AM: the attention block adopted by Y-UNet; SA: Shuffle Attention; WH-Loss: weighted hybrid-loss. The position of “√” in the table indicates that the improved algorithm adopts the corresponding strategy.
Publisher’s Note: MDPI stays neutral with regard to jurisdictional claims in published maps and institutional affiliations.

