1. Introduction
The Richtmyer–Meshkov instability (RMI) occurs when a shock wave impulsively accelerates a perturbed density interface, triggering perturbation growth [
1,
2]. Initially, perturbations evolve linearly, but as the instability progresses, nonlinear effects produce large-scale structures: bubbles (light fluid penetrating heavier fluid) and spikes (heavier fluid penetrating lighter fluid). At later stages, secondary instabilities may drive turbulent mixing. RMI is closely related to the Rayleigh–Taylor instability (RTI), which arises under sustained acceleration of a denser fluid by a lighter one [
3,
4]. RMI can be considered RTI’s impulsive analog. Due to its significance in fundamental science and applications like inertial confinement fusion (ICF) [
5], supernova dynamics [
6] and scramjet propulsion [
7], RMI has been extensively studied. Extensive research on flow dynamics, turbulence, and mixing generated by RMI and RTI has been integrated in some thorough reviews [
8,
9,
10,
11,
12], offering important insights into the evolution of instability across a variety of physical conditions.
The RMI, exemplified by the evolution of a single-mode perturbed interface, is a cornerstone for understanding instability dynamics. The initial configuration of the interface has a substantial impact on the instability dynamics, particularly the amplitude, wavelength, and number of perturbation modes. In this study, we consider a single-mode perturbation, in which the interface is modulated by a sinusoidal wave with a single dominant wavelength. This controlled setup enables a clearer analysis of fundamental mechanisms such as baroclinic vorticity deposition and shock–interface interactions. In contrast, multi-mode perturbations—often used in experiments or realistic flows—consist of a superposition of several wavelengths and amplitudes, leading to enhanced mixing and complex nonlinear interactions. Multi-mode cases are reserved for future investigation. Initially, Richtmyer [
1] developed an impulsive linear model for incompressible, inviscid flows to describe early perturbation growth within a linear stability framework. Subsequent refinements to linear theories have accounted for compressibility [
13], three-dimensional effects [
14], and density ratio variations [
15], enhancing predictive accuracy. As perturbation amplitudes grow comparable to the wavelength, nonlinear effects introduce asymmetry and complex structures in the interface evolution. To address this, advanced models have been proposed, including higher-order perturbation expansions [
16,
17] and potential flow models rooted in bubble dynamics [
18], and complemented by high-fidelity experimental validations [
19]. Recently, Probyn et al. [
20] investigated the evolution of single-mode RMI across varying Atwood numbers, shock strengths, and perturbation amplitudes. The results reveal time-dependent bubble shape inversion and secondary jet formation at moderate to high Mach numbers, attributed to vorticity deposition deeper within the heavy fluid by the transmitted shock. Alsaeed and Singh [
21,
22] numerically investigated the shock-accelerated V-shaped light/heavy fluid interface, and explored the impact of shock Mach numbers and vertex angles on the associated flow physics.
Interestingly, in both inertial confinement fusion capsules and supernovae applications, the material configuration consists of multiple finite-thickness fluid layers separated by distinct interfaces, each subjected to initial perturbations. Under shock acceleration, RMI typically develops within these finite-thickness layers, where the growth of perturbations at one interface is influenced by the evolving dynamics of adjacent interfaces. This phenomenon, referred to as interface coupling [
23,
24,
25], introduces additional complexity due to differing initial conditions and interactions between the interfaces. Moreover, each interface may exhibit a distinct instability growth rate, leading to asymmetric deformation and intricate mixing across the fluid layer. Therefore, understanding the instability evolution in finite-thickness fluid layers with multiple interacting interfaces is crucial for accurately predicting mixing behavior in shock-driven multiphase systems.
Theoretically, Taylor [
4] was the first to analyze RTI in a liquid layer and derived linear solutions for the amplitude growth of two interacting interfaces. When the fluid layer thickness is sufficiently small, the coupling effect between the interfaces cannot be neglected. Subsequently, Ott [
26] proposed a nonlinear solution for RTI growth in a thin, massless fluid layer, providing insight into bubble and spike formation dynamics. Linear solutions for RMI growth in stratified fluids were developed by Mikaelian [
27,
28,
29,
30], who also discussed interface coupling effects and the conditions required to suppress or “freeze” the growth of the first interface. Experimentally, Jacobs [
31] captured the instability evolution of a thin fluid layer generated by a gas curtain technique, identifying three distinct flow patterns. These flow patterns were attributed to differences in the initial perturbation amplitudes at the upper and lower interfaces [
32]. The observed flow patterns were subsequently categorized into three types—upstream mushroom, downstream mushroom, and sinuous shapes [
24]. However, predicting or controlling the exact flow pattern in a given experiment remains challenging due to the sensitivity to initial conditions.
Liu et al. [
33] investigated the growth of Richtmyer–Meshkov instability (RMI) in a two-layer fluid system under vacuum conditions and derived third-order weakly nonlinear solutions for the evolution of the middle interface using perturbation theory. Building on previous work, Liang and Luo [
34] extended the model of Jacobs et al. [
24] to incorporate a finite-thickness fluid layer separating three fluids with different densities. Subsequently, Liang and Luo [
35] explored the effects of interface coupling and reverberating wave interactions on perturbation growth by experimentally generating multiple fluid layers with varying gas compositions and thicknesses using a soap-film technique. More recently, Li et al. [
36] numerically investigated the evolution of a shock-induced fluid layer, providing new insights into the fundamental mechanisms of RMI under reshock conditions. Complementing these findings, Guo et al. [
37] experimentally examined finger collisions during RMI in light fluid layers subjected to reshock in a shock-tube facility. In the context of stratified fluid configurations, Singh [
38] performed numerical simulations of a shocked V-shaped
layer using a high-order modal discontinuous Galerkin method to investigate interface dynamics and instability development.
Despite significant advances in understanding RMI in multilayered and finite-thickness fluid systems, much of the existing research has focused on heavy-to-light or stratified density configurations, often emphasizing dense interface interactions under reshock conditions or multiple interface coupling. While studies have explored interface coupling, perturbation interactions, and nonlinear growth mechanisms in stratified and V-shaped fluid layers, limited attention has been directed toward the fundamental evolution of RMI in a single-mode light fluid layer bounded by two interfaces, particularly under varying layer thickness, perturbation amplitude, and shock strength conditions. The specific influence of layer confinement, baroclinic vorticity generation, and nonlinear interface deformation in such light fluid configurations remains underexplored. Moreover, quantitative insights into how these factors collectively affect vorticity dynamics, enstrophy, and mixing processes are lacking in prior numerical and experimental studies. Therefore, the motivation of this study is to systematically investigate the evolution of single-mode RMI in a shock-accelerated finite-thickness light helium layer surrounded by nitrogen gas, using high-fidelity simulations. By varying layer thickness, initial perturbation amplitude, and incident shock Mach number, the work aims to elucidate the interplay between interface evolution, vorticity generation, and instability amplification, providing new insights relevant to shock-driven mixing in inertial confinement fusion, astrophysical flows, and related multiphase systems.
The remainder of this paper is organized as follows:
Section 2 describes the initial setup and governing equations relevant to the study.
Section 3 details the numerical methodology and validation of the computational approach.
Section 4 presents an in-depth discussion of the numerical results, focusing on the effects of helium layer thickness, initial perturbation amplitude, and shock Mach number on the evolution of the single-mode helium/nitrogen interface. Finally,
Section 5 summarizes the main conclusions and provides an outlook for future research directions.
4. Results and Discussion
This section presents the numerical results for the interaction between a planar shock wave and a sinusoidal single-mode / interface in a light He fluid layer. The analysis focuses on the effects of He layer thickness, initial perturbation amplitude, and incident shock Mach number on the evolution of interface morphology, shock–interface interactions, vorticity generation, enstrophy, and kinetic energy. To systematically investigate these effects, simulations are performed for four He layer thicknesses (, 5, 15, and ), three initial perturbation amplitudes (, 10, and ), and three shock Mach numbers (, , and ).
All numerical simulations are conducted using an in-house third-order modal DG solver, implemented in FORTRAN 95 and compiled with Visual Studio 2019. Flow visualization and post-processing are performed using Tecplot 360 2019R1, enabling detailed examination of interface evolution, vorticity structures, and instability development.
Throughout the analysis, a normalized time scale is employed to describe the temporal evolution of the flow. The physical time t is non-dimensionalized using the characteristic time , where L is the characteristic length (taken as the interface wavelength) and is the velocity of the incident shock. Accordingly, the normalized time is defined as .
4.1. Grid Refinement Study
A grid refinement study is performed to ensure the accuracy, consistency, and reliability of the numerical simulations for the single-mode RMI in a light helium layer. Verifying grid independence within an acceptable tolerance provides confidence in the predictive capability of the computational framework to resolve key instability dynamics. In simulations of shock-accelerated single-mode RMI, it is crucial to perform a grid resolution analysis to accurately capture the development of small-scale vortical structures and interface deformation that govern the mixing process.
In the present study, grid convergence is assessed for a configuration consisting of a helium light fluid layer with thickness
and an initial perturbation amplitude
, subjected to a planar shock wave at Mach number
. Four mesh resolutions are considered:
,
,
, and
computational cells.
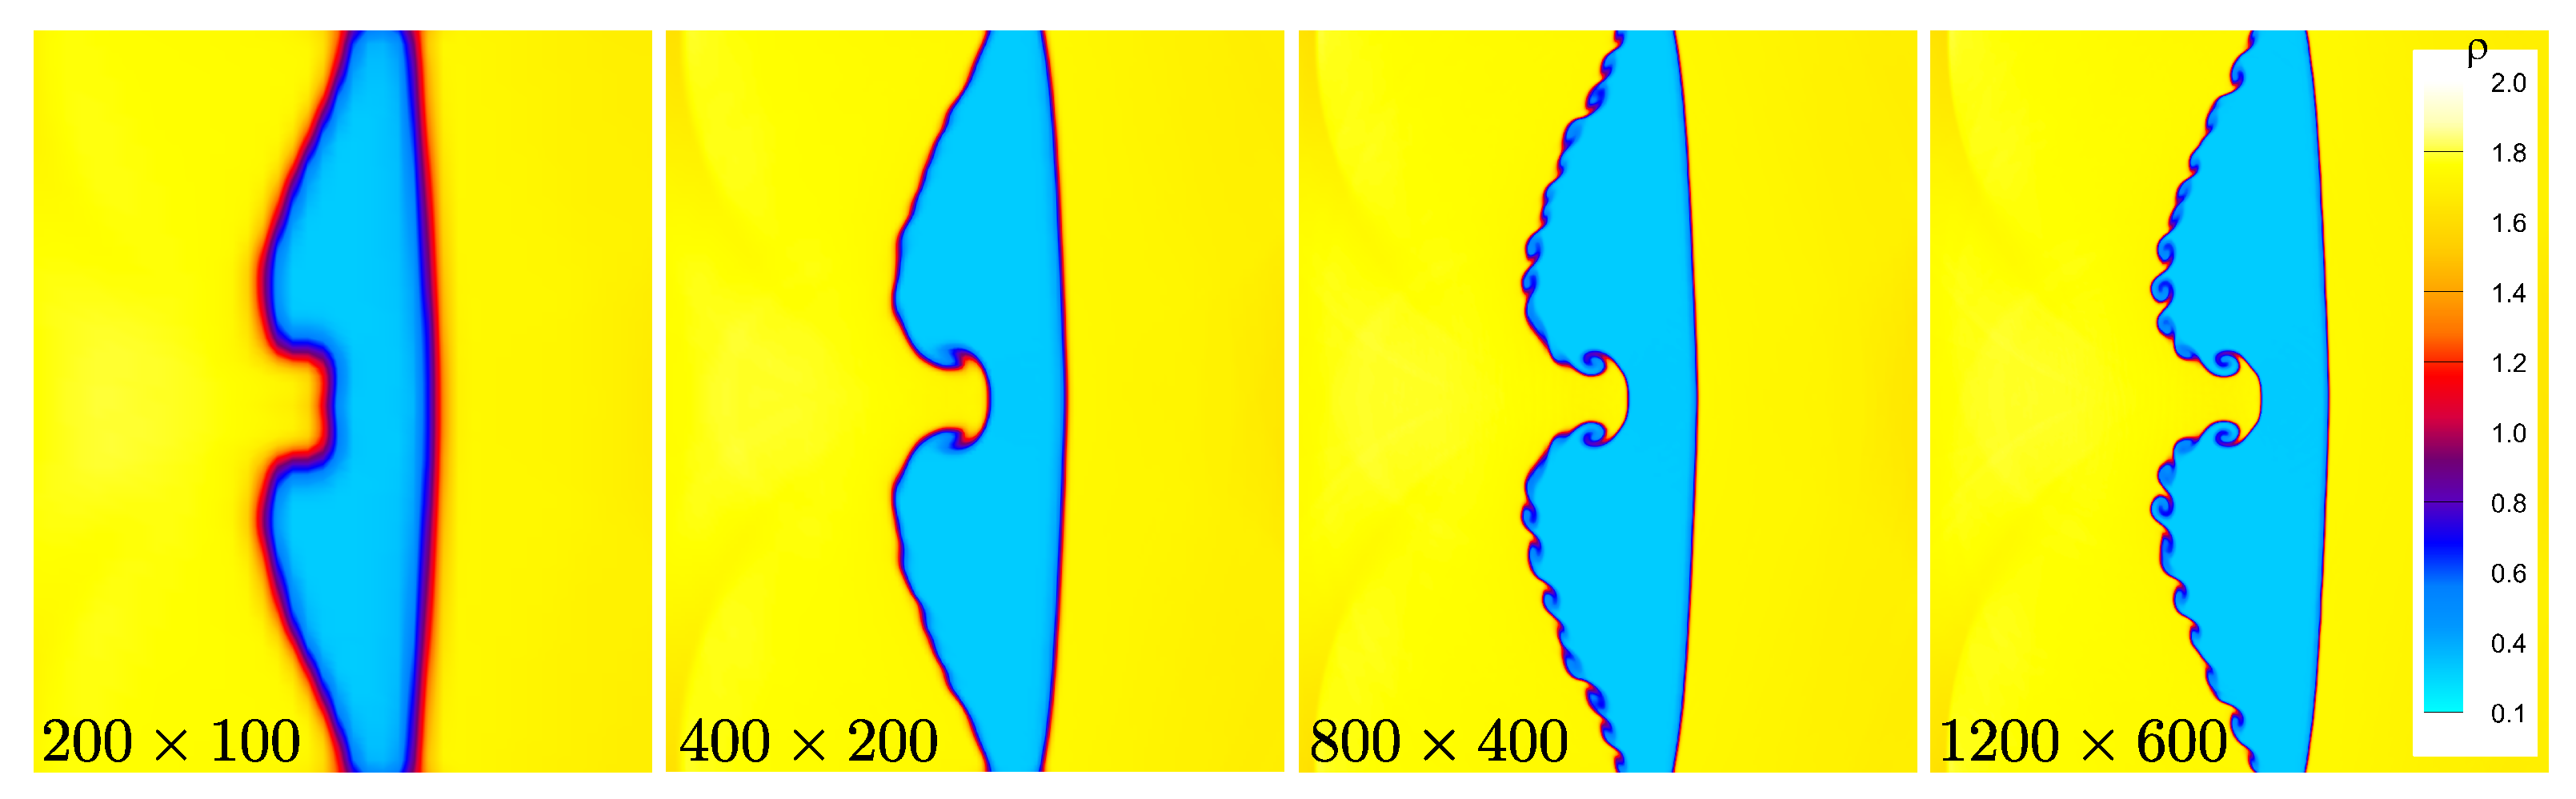
Figure 4 displays the density contours at normalized time
for each grid resolution, illustrating the evolution of the perturbed interface and the interaction with the shock wave. As the mesh resolution increases, the simulation progressively resolves finer-scale vortical structures and sharper interface features, with the
grid exhibiting the highest level of detail in both interface morphology and small-scale instabilities.
To further evaluate grid convergence,
Figure 5 presents the density profiles extracted along the centerline (
) at
for the four mesh resolutions. The profiles demonstrate excellent agreement between the
and
grids, particularly in the regions of steep density gradients near the interface. This close correspondence indicates that the
grid effectively approaches a grid-converged solution, with negligible differences compared to the finer grid. Based on these findings, the
mesh resolution is adopted for all subsequent simulations to ensure accurate resolution of the instability growth, interface deformation, and small-scale flow structures governing the evolution of the single-mode RMI in the light helium layer.
4.2. Effects of Fluid Layer Thickness
4.2.1. Flow Evolution and Interface Morphology
Figure 6 illustrates the temporal evolution of the flow field and interface morphology for the shock-accelerated single-mode RMI in a light helium layer surrounded by nitrogen gas, with layer thickness
, perturbation amplitude
, and incident shock Mach number
. The following simulations are conducted with a third-order modal DG scheme using a
grid, Krivodonova limiter, and
. The figure shows density contours (top) and corresponding density gradient contours (bottom) at selected normalized times
. At
, the incident shock (IS) impinges on the perturbed interface, generating a transmitted shock (TS1) into the helium layer and a reflected rarefaction wave (RR) propagating back into the nitrogen. By
, a first free precursor shock (FPS) forms within the helium layer ahead of the transmitted shock due to impedance mismatch and baroclinic vorticity effects. At
, the transmitted shock interacts with the second interface (helium–nitrogen boundary), generating a Mach stem (MS), reflected transmitted shock (RTS), and a triple point (TP) where wavefronts converge. As time progresses (
to
), jet-like structures emerge at the interface due to shock refraction and baroclinic torque, leading to material penetration of helium into the ambient gas. The transmitted shock (TS2) continues to interact with the helium layer boundaries. By
, Kelvin–Helmholtz instabilities (KHI) begin to develop along the interface shear layer, marking the onset of roll-up and secondary vortical structures. From
onward, the interface exhibits increasing deformation, accompanied by the formation of mushroom-shaped structures and vortex cores due to the combined effects of RMI and KHI. At later times (
to
), a primary vortex ring (PVR) forms and evolves, while a connecting bridge (CB) links the rolled-up interface segments. The interface continues to fold and stretch under the influence of accumulated vorticity, promoting mixing between helium and nitrogen. Overall, the figure demonstrates the complex interplay of transmitted and reflected shock waves, vorticity generation, interface deformation, and secondary instability mechanisms that characterize the nonlinear evolution of single-mode RMI in a confined light fluid layer. The development of vortical structures, jet formation, and eventual roll-up provide insight into the transition pathways toward turbulent mixing in shock-driven light fluid configurations.
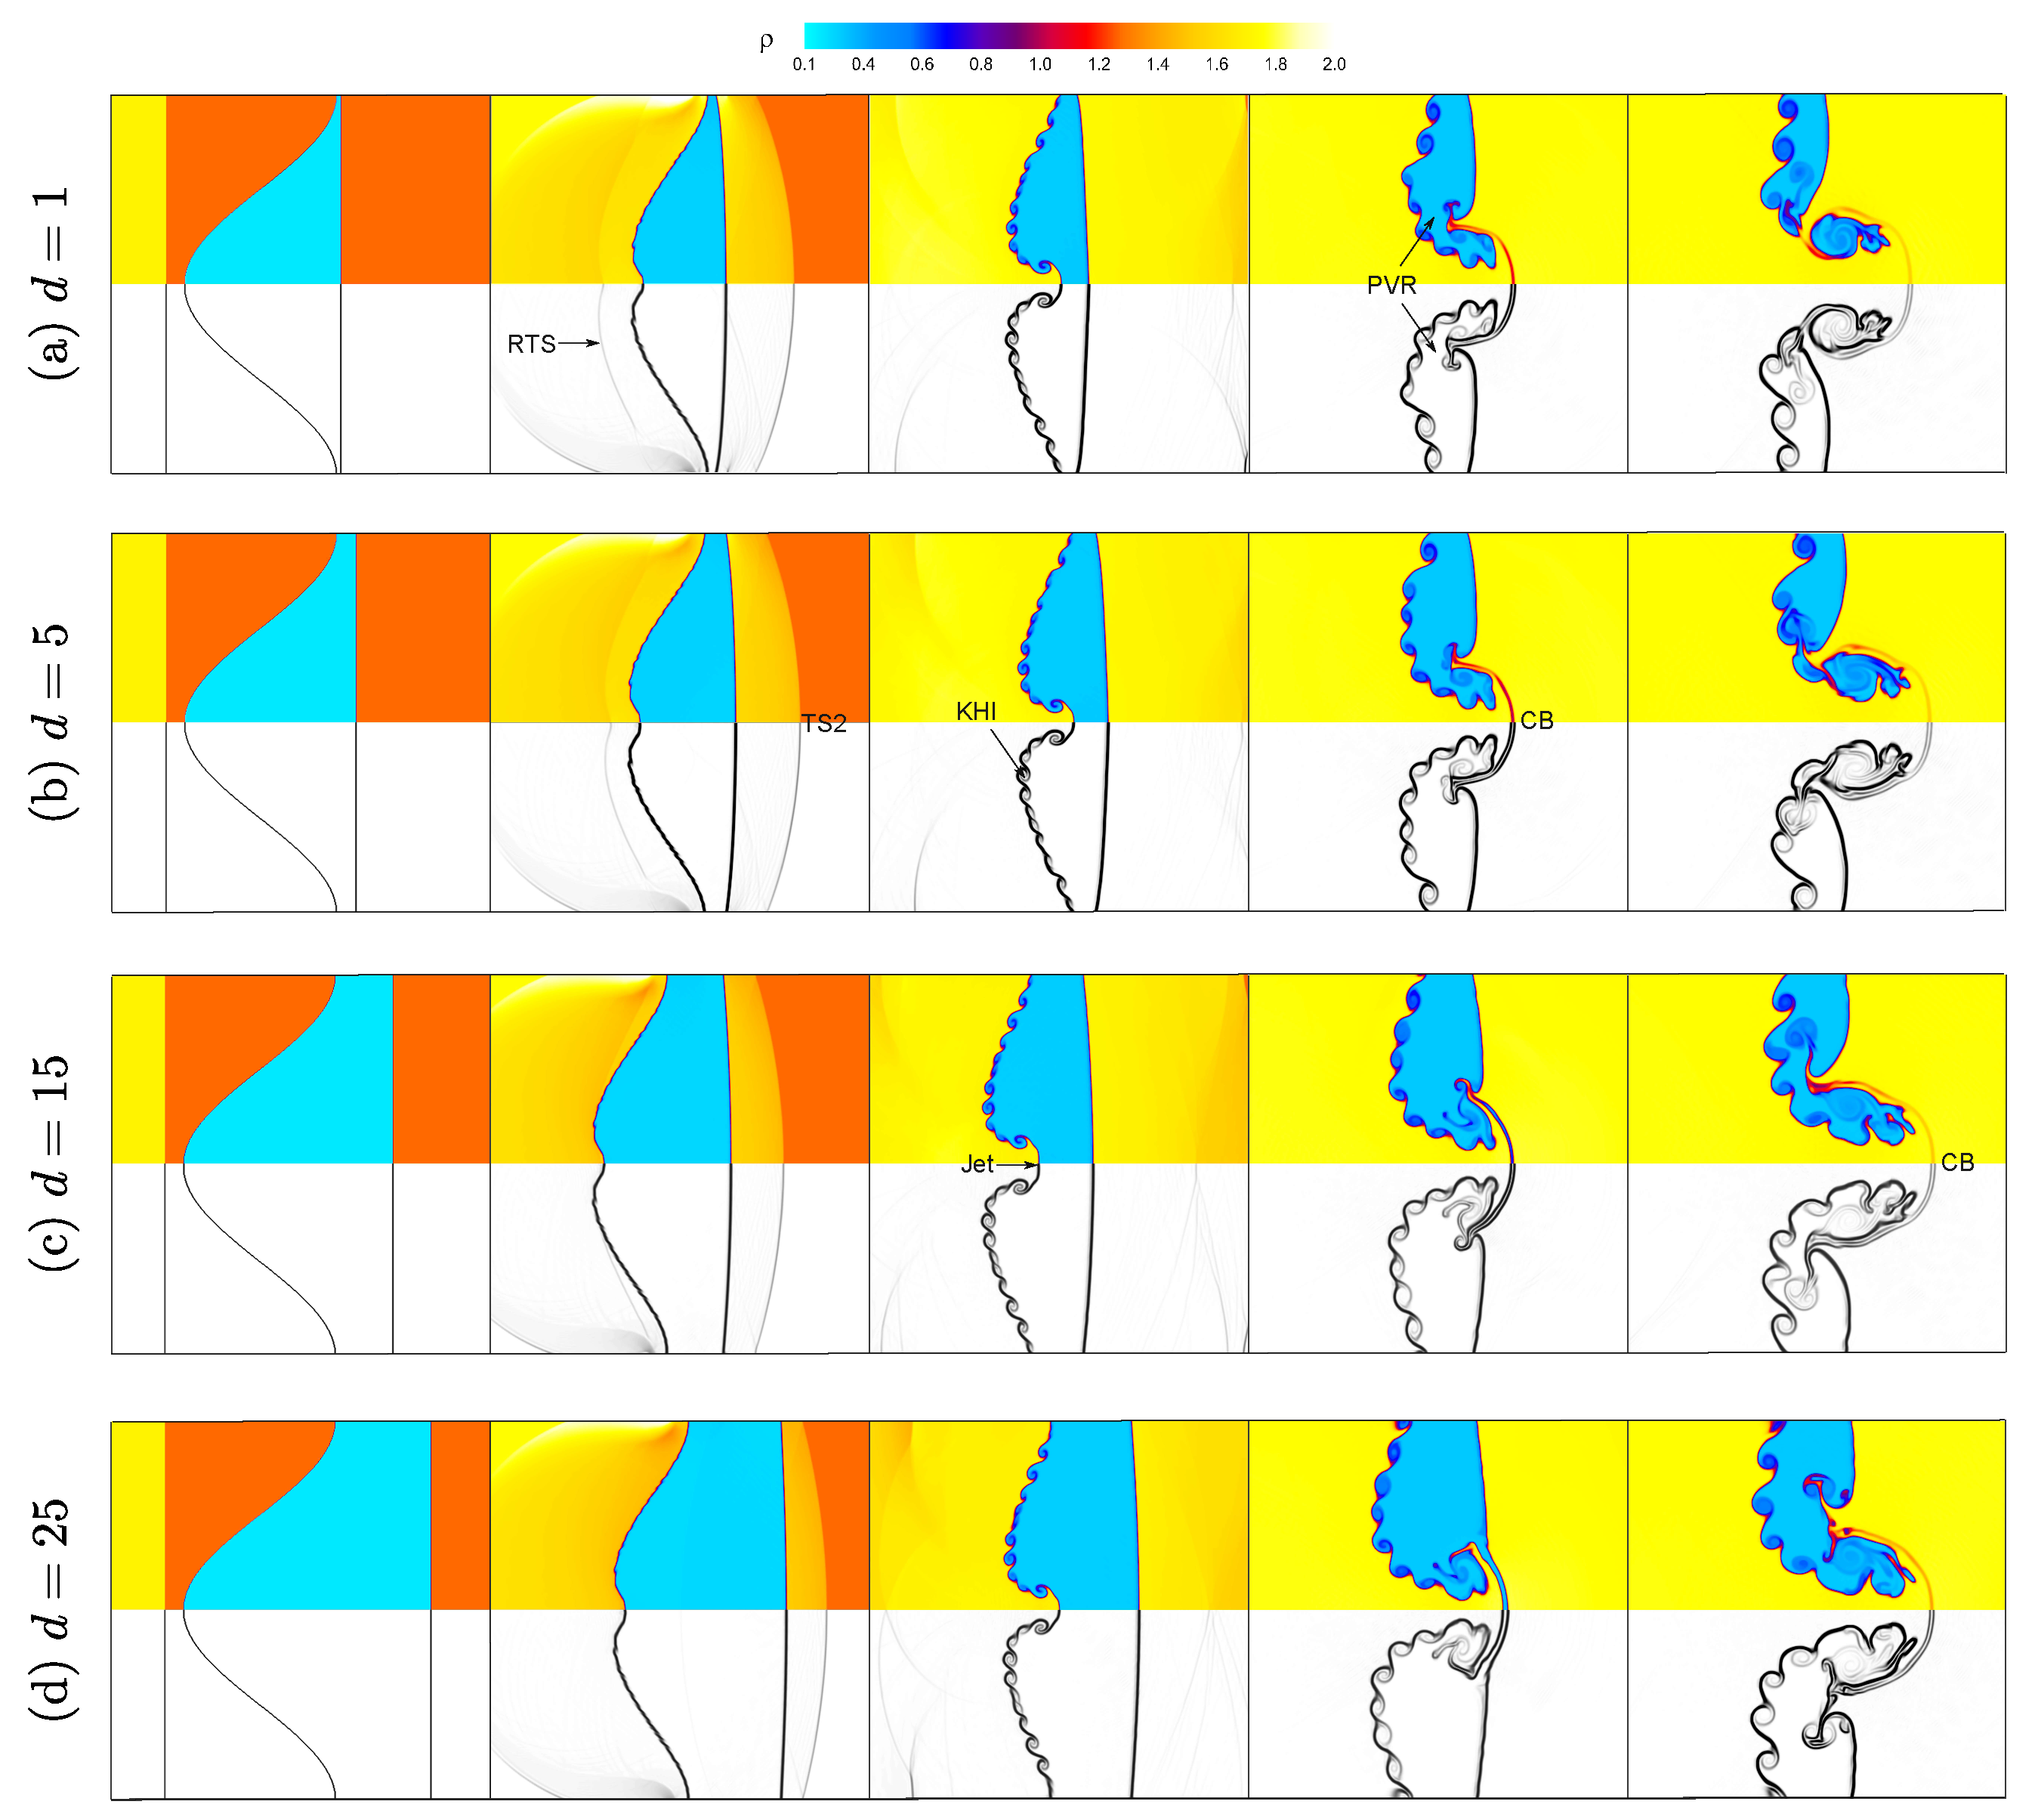
Figure 7 illustrates the effect of fluid layer thickness on the evolution of the shock-accelerated single-mode RMI in a light He layer surrounded by nitrogen gas, for initial perturbation amplitude
and shock Mach number
. The figure presents density contours and corresponding density gradient contours for four He layer thicknesses
. The results show that the layer thickness significantly affects interface deformation, vorticity formation, and instability growth. For the thinnest layer (
), the transmitted shock quickly reaches the second interface, generating a reflected transmitted shock (RTS) and limiting the time available for the instability to develop. The interface shows modest deformation, and the resulting vortex structures remain relatively small and confined. As the layer thickness increases to
, the delayed shock–second interface interaction allows greater interface evolution, leading to the onset of KHI and the formation of a connecting bridge (CB) between rolled-up interface segments. For
, the interface exhibits more pronounced deformation and jet-like structures penetrating into the ambient gas, with more developed vortical roll-up and stronger secondary instabilities. At the largest thickness (
), the instability experiences extended growth, resulting in large-scale vortex formation, more prominent roll-up, and reduced suppression from reflected waves at the second interface. In summary, increasing the layer thickness enhances the growth and complexity of the instability by providing a longer evolution distance before shock–interface interactions at the layer boundary, whereas thinner layers exhibit constrained instability development due to earlier wave reflections.
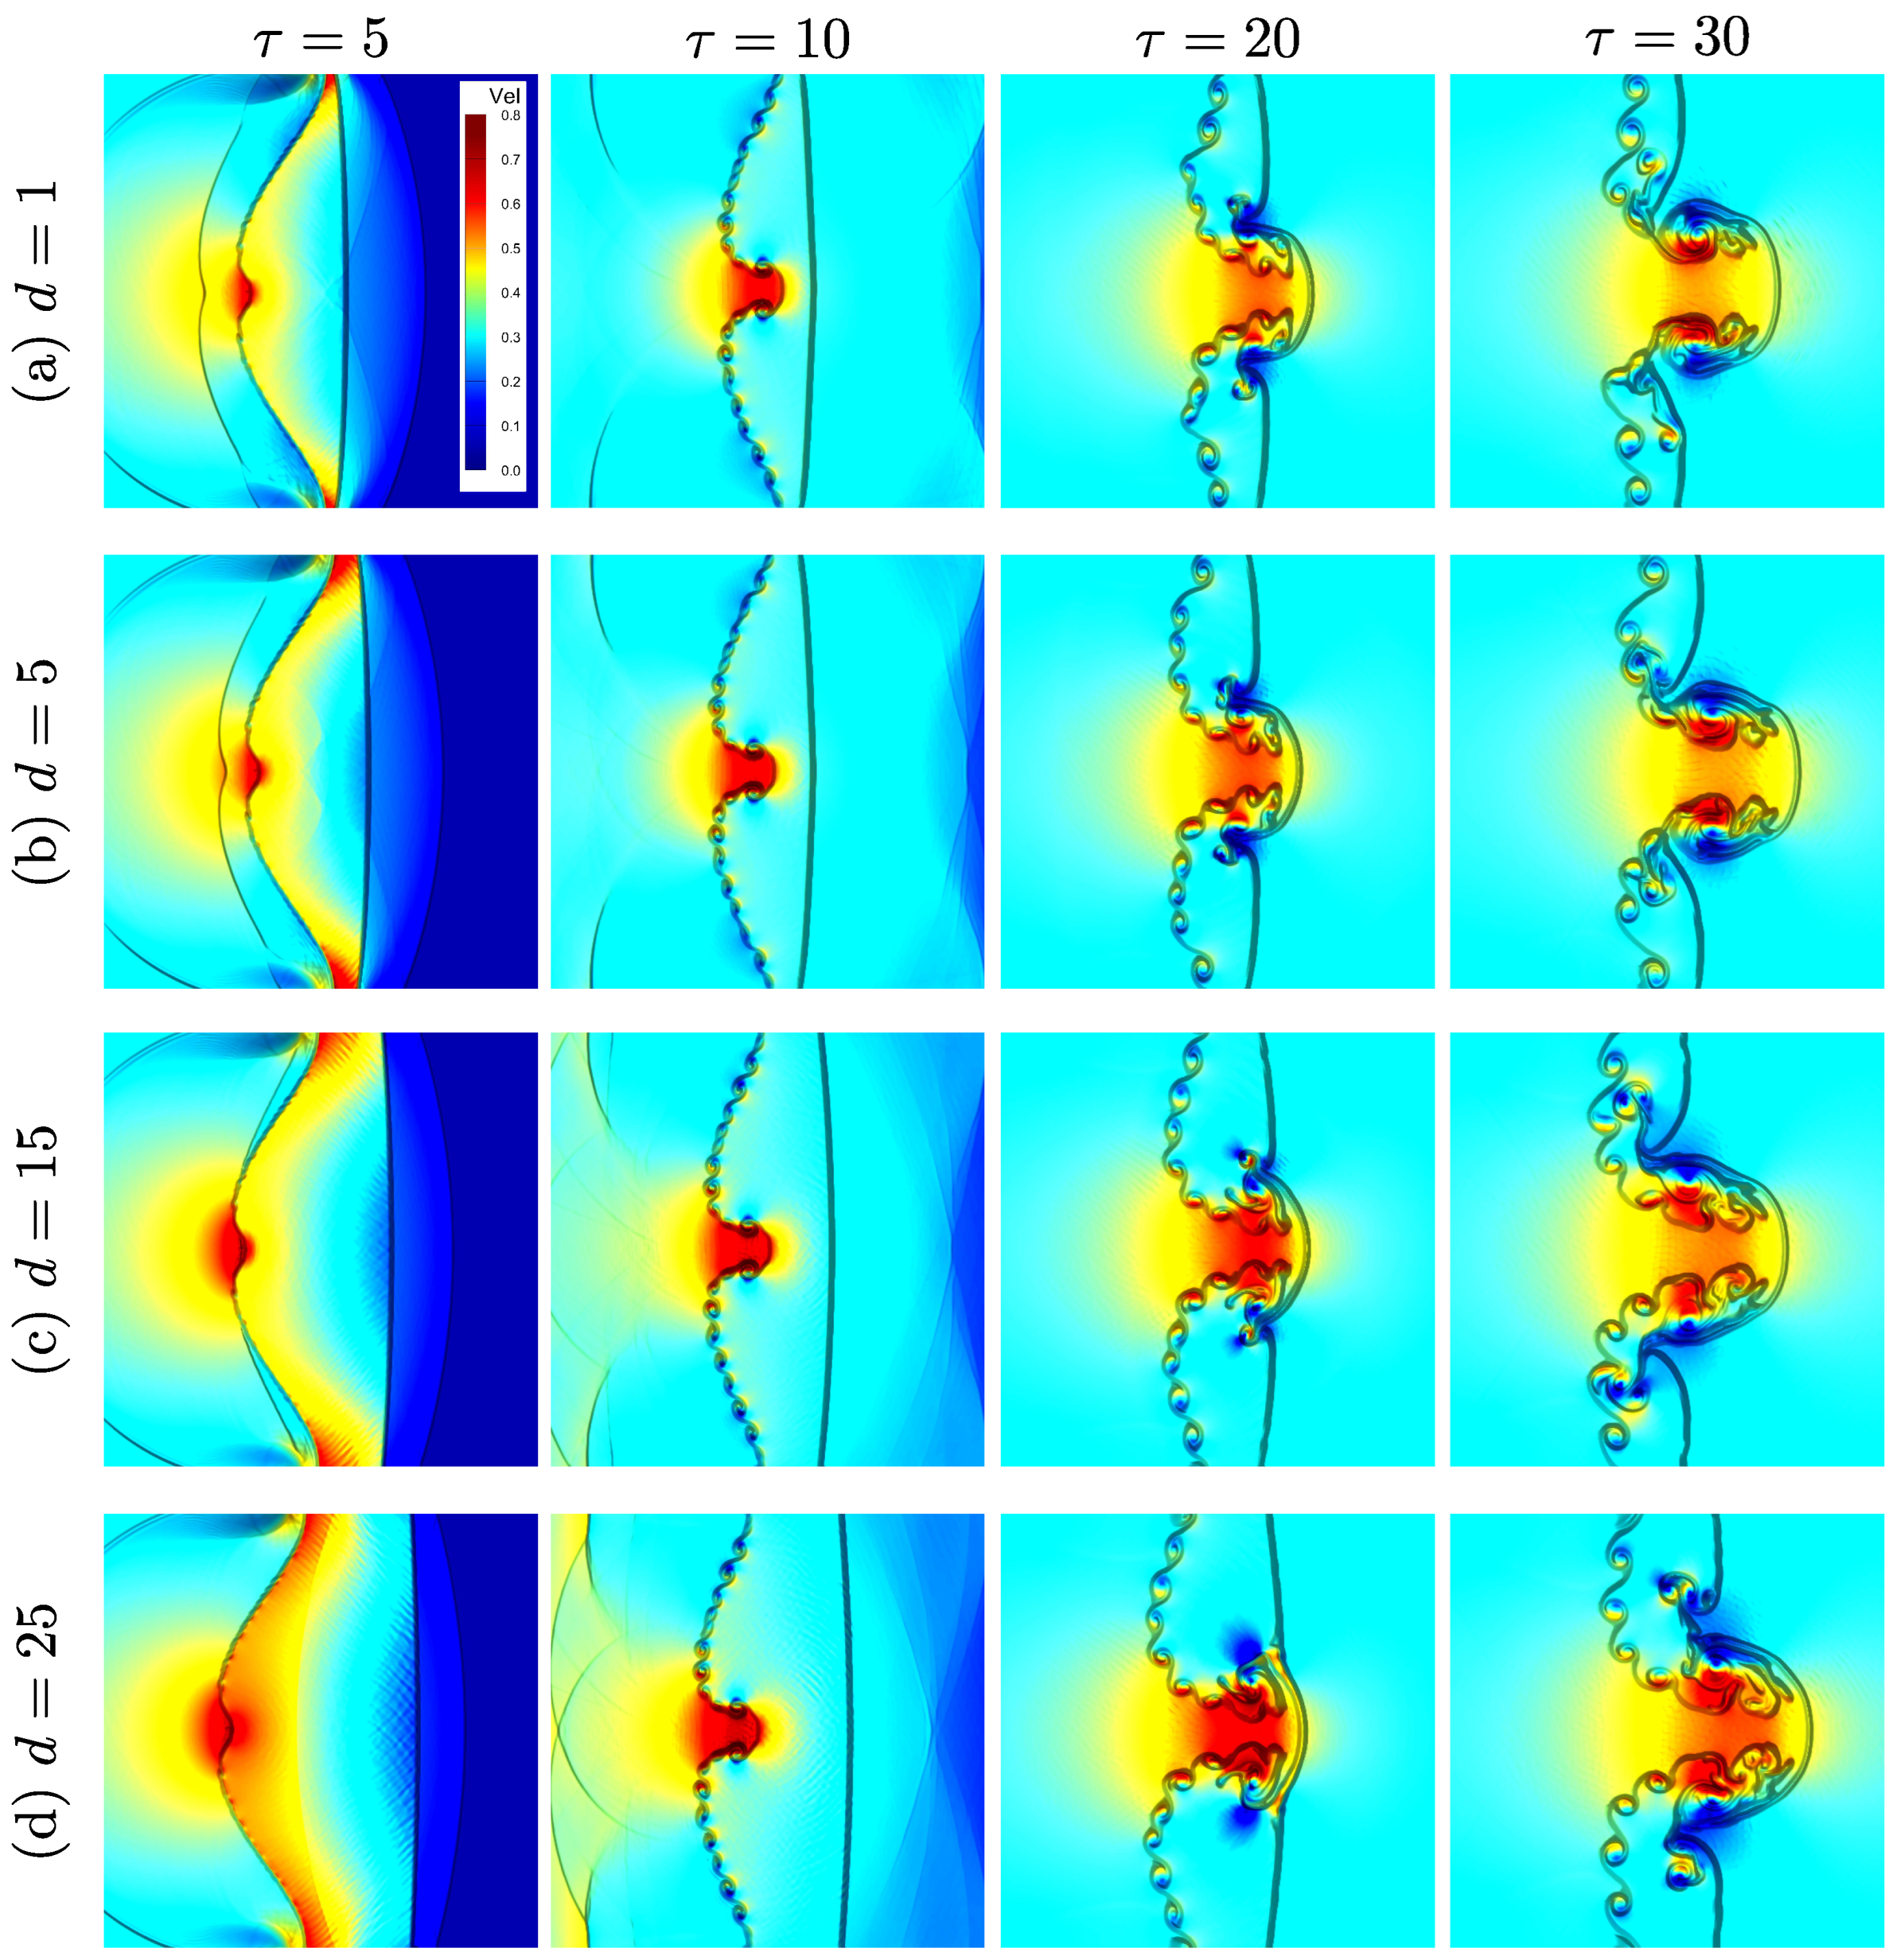
Figure 8 presents the time evolution of velocity magnitude contours for different helium layer thicknesses (
and
) at selected non-dimensional times
and 30, illustrating the dynamic response of the interface to shock acceleration in a single-mode RMI configuration. Following the passage of the IS wave, baroclinic vorticity is generated due to the misalignment of pressure and density gradients across the perturbed interface. In the early stages (
), thinner helium layers exhibit relatively mild deformation, as the transmitted shock quickly reaches the second interface, limiting the duration and spatial extent of vorticity generation. In contrast, thicker layers show stronger interface acceleration and more pronounced asymmetry, resulting from extended interaction with the shock. At later times (
), the velocity fields reveal the development of nonlinear bubble and spike structures, accompanied by significant shear near the interface. Thicker layers exhibit more complex velocity distributions, with evident vortex roll-ups and secondary instabilities indicative of sustained baroclinic activity and stronger nonlinear growth. The velocity intensity and structural complexity scale with helium layer thickness, underscoring the role of confinement in amplifying instability dynamics. Overall, the transition from shock-dominated to vortex-dominated behavior becomes increasingly pronounced with larger
d, highlighting the importance of layer thickness in controlling momentum transfer, vorticity deposition, and late-time flow morphology.
4.2.2. Vorticity Dynamics
The evolution of vorticity is a key feature in the RMI development, particularly in shock-accelerated light fluid layers. To elucidate the mechanisms responsible for vorticity generation during the interaction between the incident shock and the perturbed helium–nitrogen interface, the vorticity transport equation (VTE) is derived within the framework of the inviscid compressible Euler equations employed in the present study. Neglecting viscosity and thermal diffusion effects, the VTE for an inviscid flow is expressed as
where the individual terms are defined as
Here,
denotes the vorticity vector,
is the velocity field,
is the fluid density, and
p is the pressure. The operator
represents the material derivative, accounting for both local time variation and convection by the flow. Physically, the first term (VSG) corresponds to vorticity stretching and tilting induced by velocity gradients along the vorticity direction; in purely two-dimensional flows, this term vanishes. The second term (VSC) describes vorticity modification due to compressibility, becoming significant in regions with nonzero divergence. The third term (BAR) represents baroclinic vorticity generation arising from the misalignment between the density and pressure gradients—a dominant mechanism driving vorticity production and interface deformation in shock-accelerated light fluid layers. In the context of single-mode RMI in a helium layer, baroclinic torque at the perturbed interface plays a pivotal role in initiating and amplifying instability growth, leading to the formation of vortical structures that govern subsequent mixing dynamics.
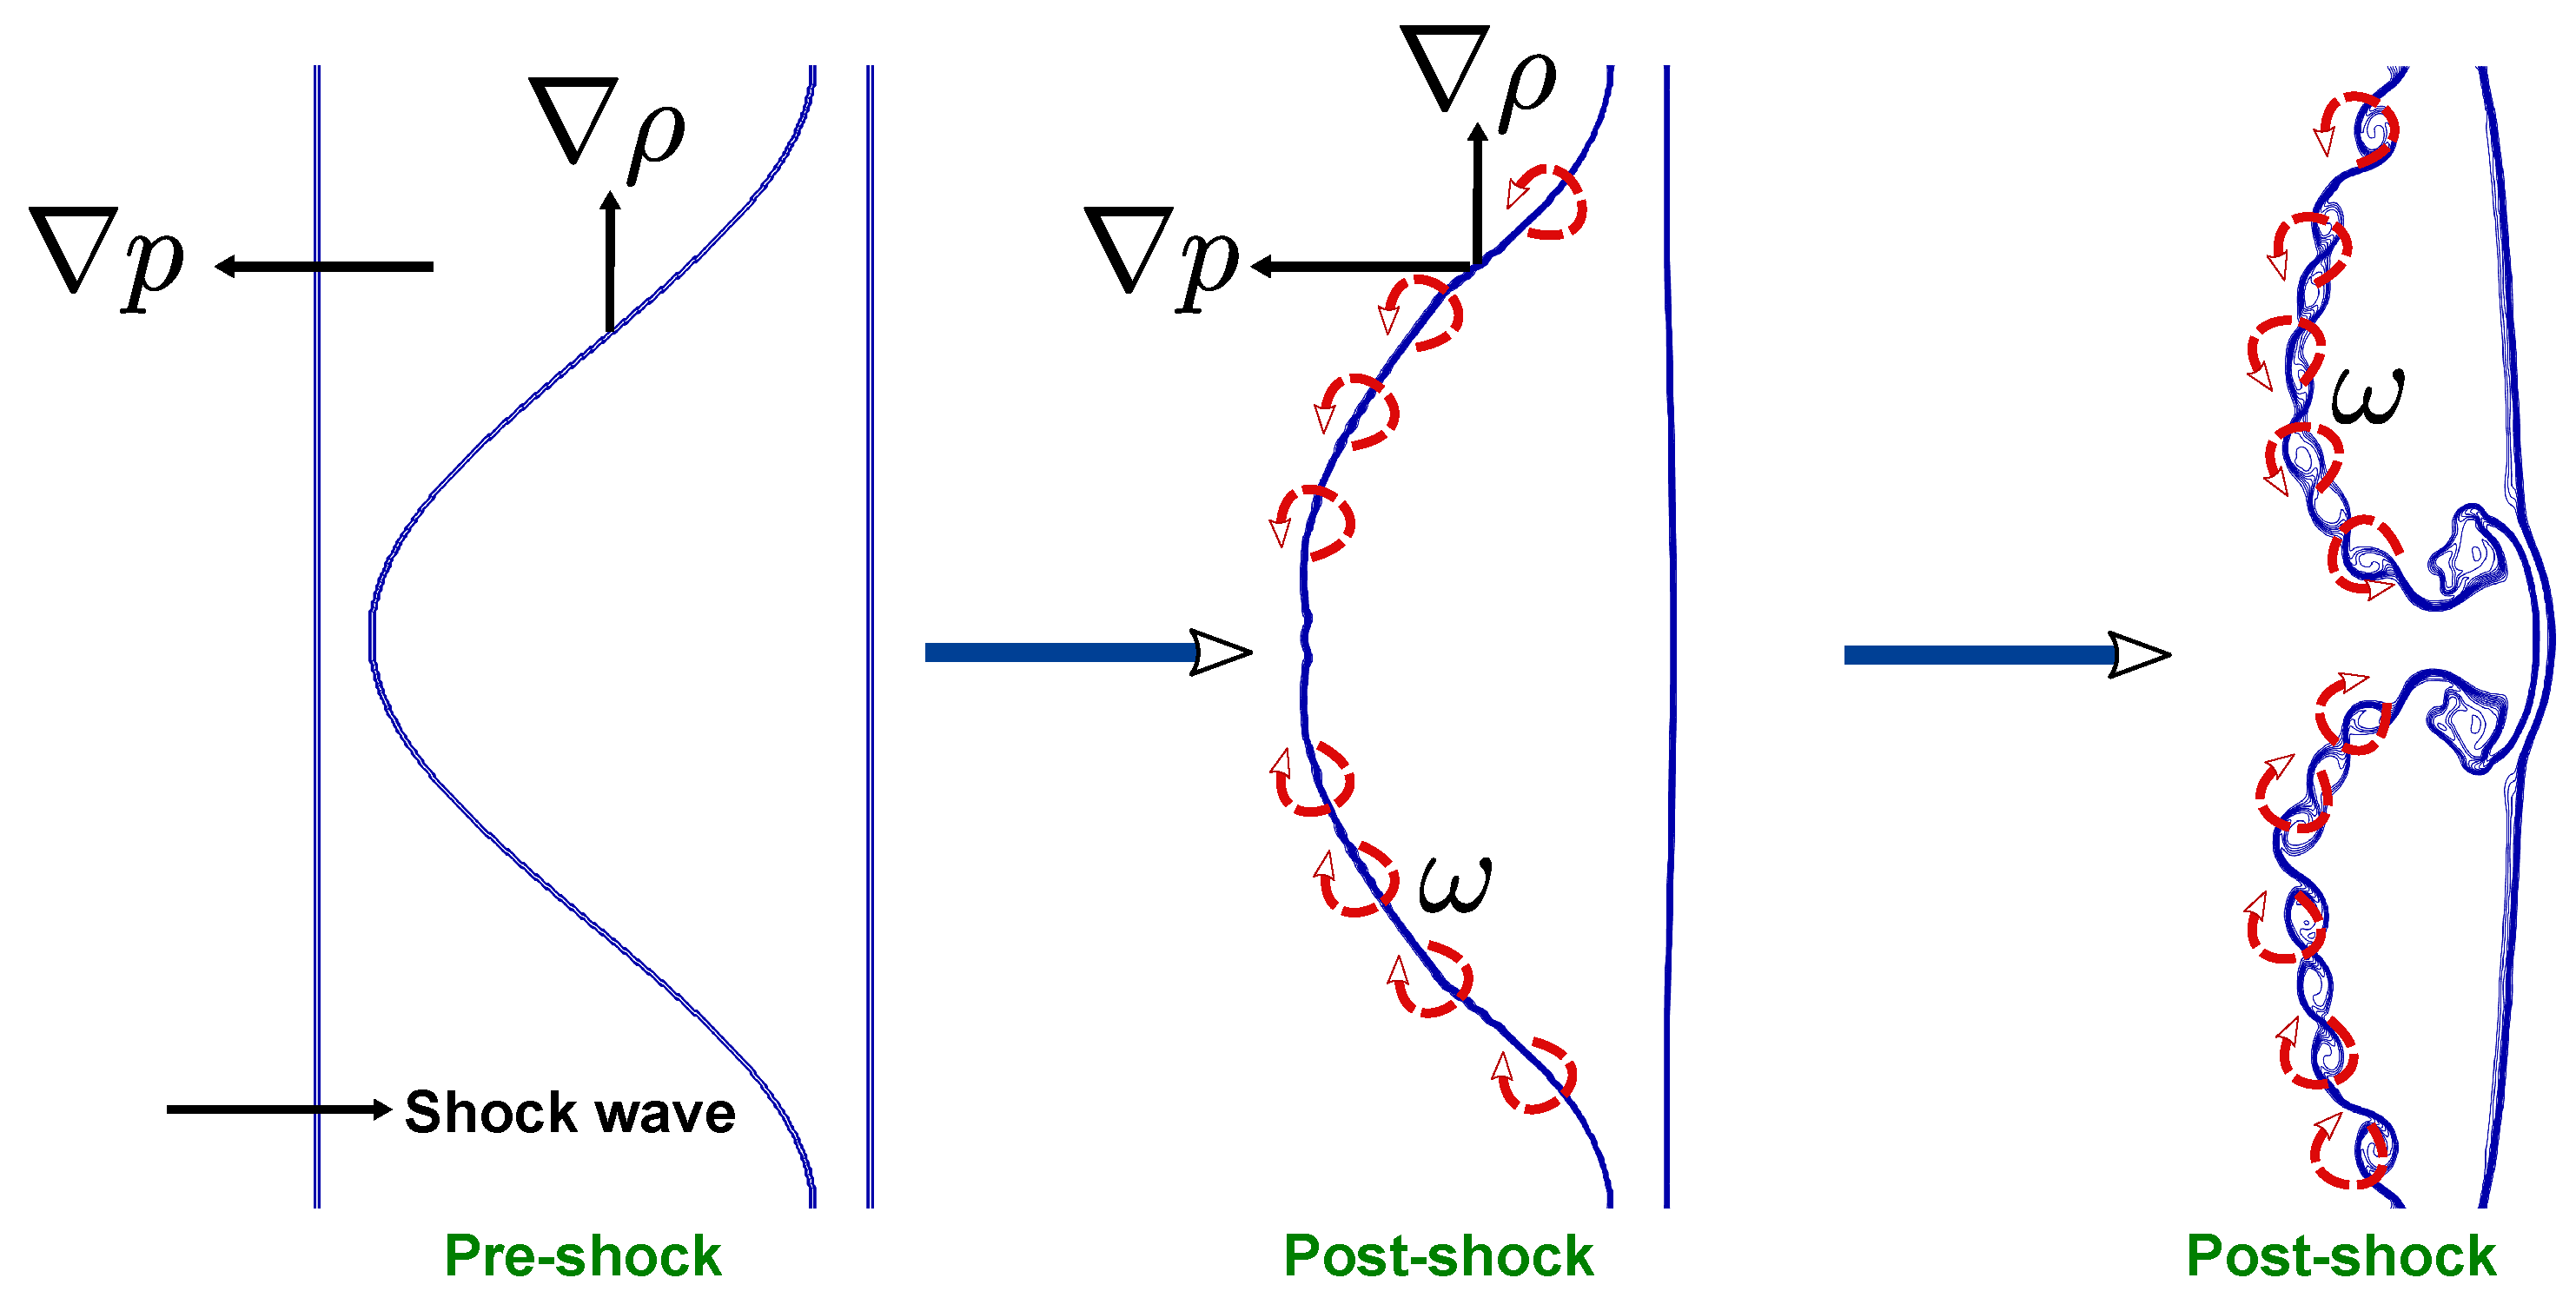
Figure 9 illustrates the mechanism of vorticity generation in the shock-accelerated single-mode RMI within a light helium layer surrounded by nitrogen gas. Prior to shock interaction (pre-shock stage), the pressure gradient (
) is aligned with the direction of the propagating shock wave, while the density gradient (
) is oriented normal to the perturbed helium–nitrogen interface. Under these conditions, the gradients are initially misaligned due to the sinusoidal interface perturbation. When the incident shock passes through the interface (post-shock stage), the pressure gradient imposed by the shock interacts with the existing density gradient along the interface, leading to a nonzero baroclinic torque given by the term
in the vorticity transport equation. This baroclinic torque generates vorticity concentrated along the interface, with alternating sign, corresponding to regions of positive and negative curl. The generated vorticity subsequently amplifies the interface deformation, initiating the roll-up process characteristic of the RMI evolution. At later post-shock times, the accumulated vorticity causes the interface to evolve into mushroom-like structures and vortex cores as the instability transitions into the nonlinear regime. This baroclinic vorticity generation is the primary mechanism driving interface growth and the formation of vortical structures in shock-accelerated light fluid layers, ultimately promoting mixing between the helium and nitrogen gases.
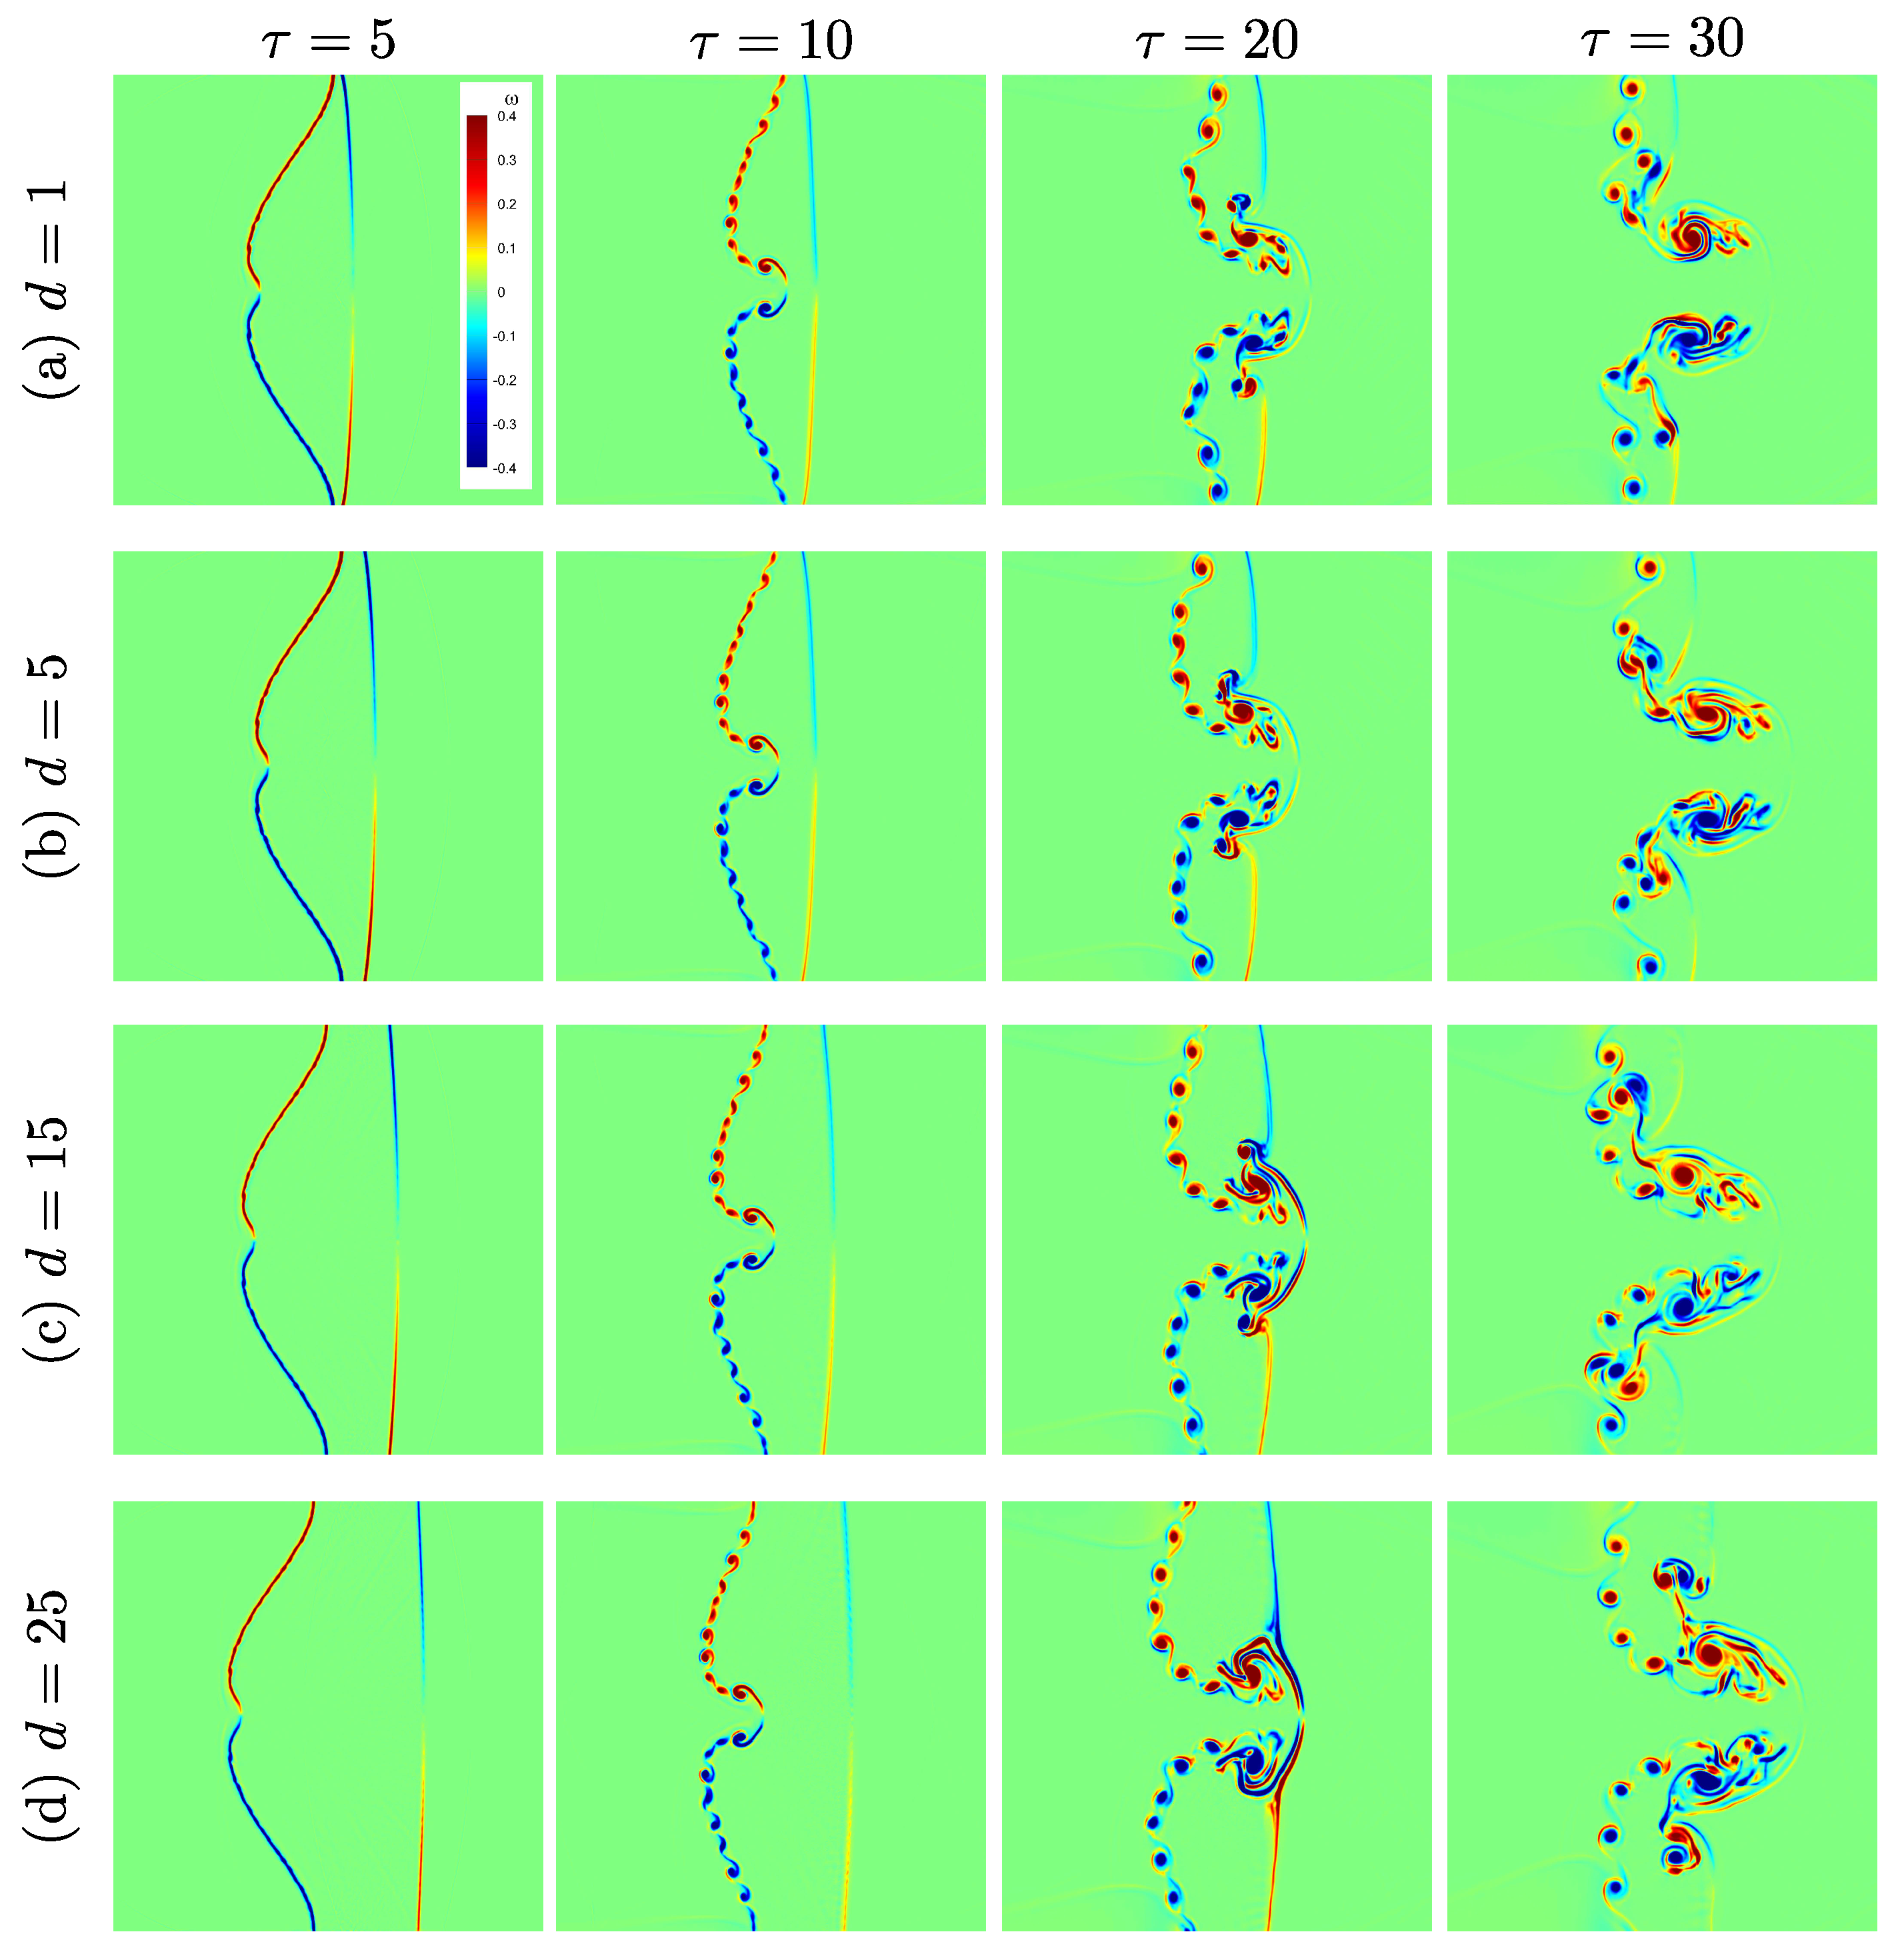
Figure 10 illustrates the effect of fluid layer thickness on the vorticity distribution during the evolution of the shock-accelerated single-mode RMI in a light helium layer, for
and
. The figure presents vorticity contours at normalized times
, 10, 20, and 30 for four helium layer thicknesses
. In all cases, baroclinic vorticity is generated along the perturbed helium–nitrogen interface as a result of the misalignment between pressure and density gradients induced by the shock–interface interaction. The initial vorticity appears as alternating layers of positive and negative values (red and blue regions), concentrated around the interface. As time progresses, the vorticity layers are advected and stretched by the evolving interface, forming vortical structures that drive interface deformation and mixing. For the thinnest layer (
), the transmitted shock quickly reaches the second interface, limiting the time available for vorticity amplification. Consequently, the vortex roll-up is weak and remains close to the interface with minimal small-scale structure. Increasing the layer thickness to
allows more vorticity accumulation and stretching before the transmitted shock interacts with the second interface, resulting in moderate vortex roll-up and larger-scale structures. At
, the vorticity evolution becomes more pronounced: the interface develops stronger roll-up and secondary vortices as the baroclinic vorticity has more time and space to amplify before encountering reflected or transmitted waves from the second interface. The trend continues at
, where the thickest layer supports the formation of more complex, highly rolled-up vortical structures and enhanced small-scale vorticity dynamics. In conclusion, thickening the helium layer delays wave interactions with the second interface, allowing baroclinic-driven instability growth and vortex merging to evolve over a longer time span. This results in stronger vorticity generation and more developed nonlinear vortex dynamics.
To systematically quantify the overall vorticity dynamics in the flow, several spatially integrated quantities derived from the VTE are introduced. These integrated measures provide a comprehensive assessment of the relative contributions from baroclinic torque, compressibility effects, and vortex stretching mechanisms during the evolution of the shock-accelerated single-mode RMI in a light helium layer. In this study, three key integrated quantities are considered: the spatially averaged vorticity magnitude, the absolute dilatation-induced vorticity, and the absolute baroclinic vorticity. These metrics enable characterization of the dominant sources of vorticity generation and their temporal evolution.
The spatially averaged vorticity magnitude,
, is defined as:
where
D denotes the spatial domain of the computational setup. The absolute dilatation-induced vorticity, associated with compressibility effects, is quantified by the spatial integral:
and the absolute baroclinic vorticity, representing the contribution from baroclinic torque, is given by:
These spatially integrated fields serve as valuable global indicators for evaluating the relative importance of different vorticity generation mechanisms throughout the instability evolution. Equations (10) and (11) quantify the contributions to the vorticity flux across the interface due to baroclinic torque and other interface dynamics. These expressions represent the rate of vorticity generation per unit area, and when integrated over the interface, yield quantities with units of vorticity rate multiplied by area (i.e.,
), rather than pure vorticity. In the context of shock-accelerated single-mode RMI in a light helium layer, they provide insight into how baroclinic and compressibility-related effects contribute to the overall vorticity production and interface deformation over time.
Figure 11 presents the temporal evolution of spatially integrated vorticity fields for shock-accelerated single-mode RMI in a light helium layer, for an initial perturbation amplitude
and incident shock Mach number
. The results show the effect of helium layer thickness (
, 5, 15, and 25 mm) on the average vorticity magnitude
, the absolute dilatation-induced vorticity
, and the absolute baroclinic vorticity
.
In
Figure 11a, the average vorticity magnitude
increases sharply immediately after the shock–interface interaction, driven primarily by baroclinic vorticity generation and the onset of interface deformation. Thicker helium layers (
and
) exhibit higher
values over time, indicating more sustained vorticity accumulation due to extended instability development before the transmitted shock reaches the second interface. In contrast, thinner layers result in lower
since the transmitted shock interacts with the second interface much earlier, limiting the duration of baroclinic generation in the helium region. Notably, transient decreases in
are observed at specific times across all cases. These drops correspond to phases where the pressure and density gradients become locally aligned following the initial shock–interface interaction, thereby diminishing the effective baroclinic torque
. Moreover, as the interface evolves and vortical structures begin to form and interact, the dynamics shift from active generation to redistribution of existing vorticity. This transition contributes to the non-monotonic behavior observed in the spatially integrated vorticity generation rate. In
Figure 11b, the absolute dilatation-induced vorticity, representing compressibility effects, peaks sharply around
for all cases, coinciding with the initial shock–interface interaction and transmitted shock generation. This contribution decays rapidly at later times, reflecting the dominant role of baroclinic and convective mechanisms in the nonlinear stages. The dilatation-induced vorticity is modestly higher for thicker layers but remains an order of magnitude smaller than the baroclinic term. In
Figure 11c, the absolute baroclinic vorticity increases rapidly after shock impact and sustains higher values over time in thicker helium layers. This trend confirms that thicker layers promote stronger and more persistent baroclinic vorticity generation, leading to enhanced interface deformation and more developed vortex structures. In contrast, thinner layers experience reduced baroclinic vorticity because the transmitted shock reflects earlier from the second interface, curtailing vorticity accumulation. In conclusion, these integrated fields demonstrate that helium layer thickness significantly influences the balance and magnitude of vorticity generation mechanisms in single-mode RMI. Thicker layers favor stronger baroclinic torque and sustained vorticity growth, while thinner layers limit instability amplification due to earlier wave interactions at the layer boundary.
4.2.3. Evolution of Enstrophy and Kinetic Energy
The evolution of enstrophy
and kinetic energy
provides quantitative insight into the dynamics of vorticity amplification, interface deformation, and energy transfer during the development of shock-accelerated single-mode RMI in a light helium layer. These global flow measures are defined as spatial integrals over the computational domain
D:
where
is the vorticity,
is the fluid density, and
u,
v are the velocity components in the
x- and
y-directions, respectively.
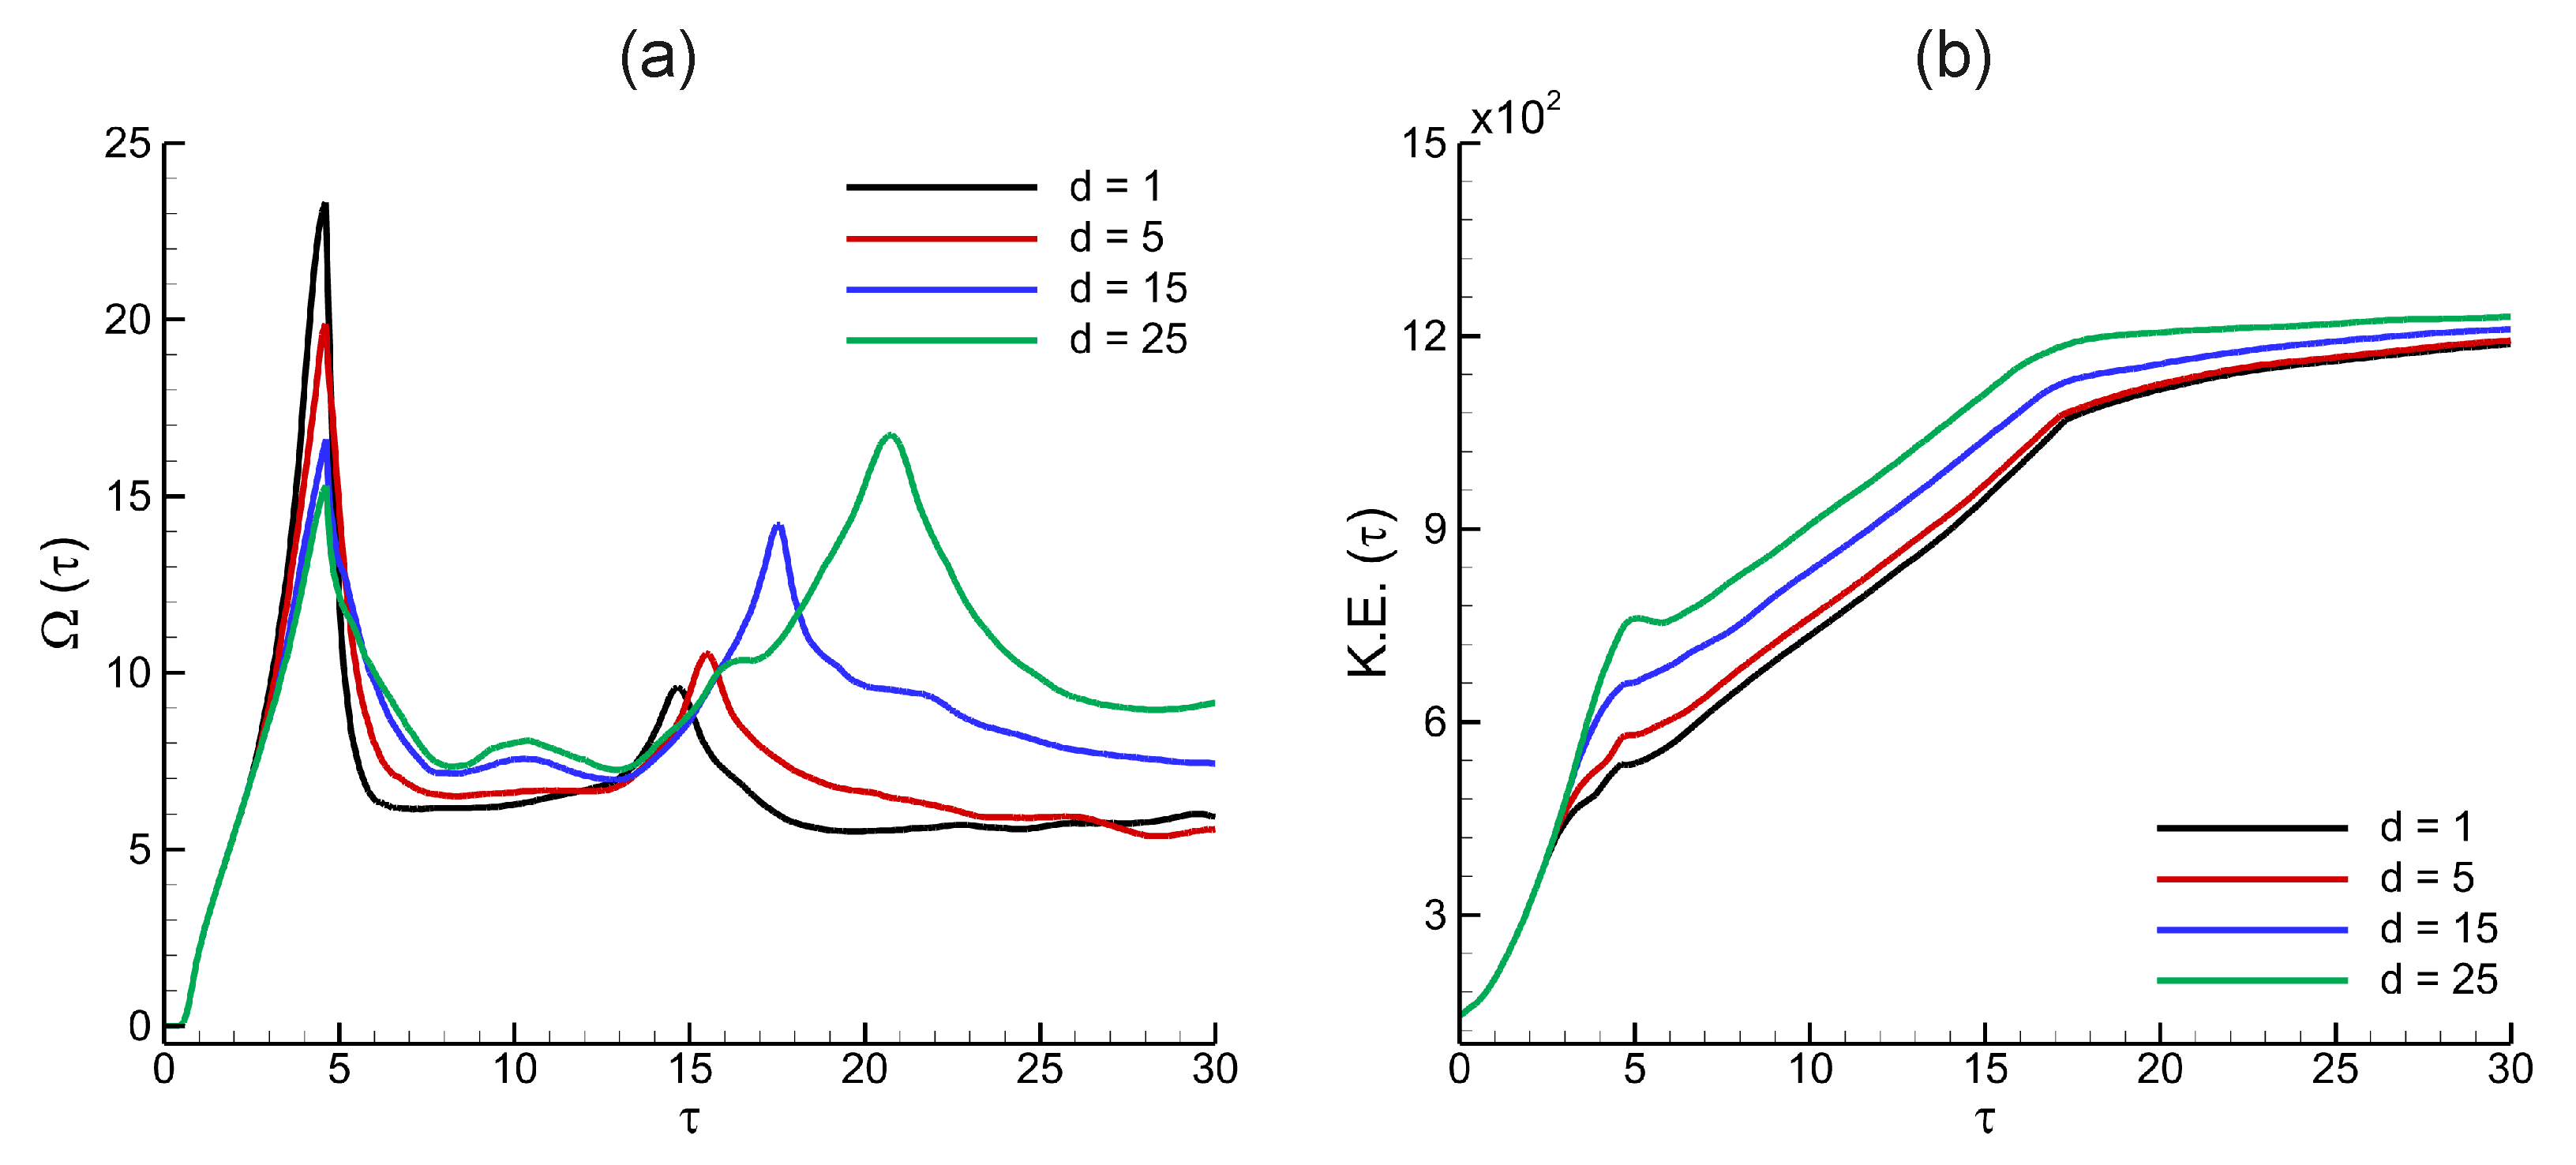
Figure 12 presents the temporal evolution of spatially integrated enstrophy
and kinetic energy
for shock-accelerated single-mode RMI in a light helium layer, at initial perturbation amplitude
and shock Mach number
. The figure compares the influence of four helium layer thicknesses (
, 5, 15, and 25 mm) on enstrophy and kinetic energy evolution. In
Figure 12a, enstrophy exhibits an initial sharp rise following the shock–interface interaction, driven by baroclinic vorticity generation along the perturbed helium–nitrogen interface. The first peak corresponds to the early amplification of vorticity as the interface deforms under the imposed pressure gradients. As time progresses, secondary peaks appear, associated with nonlinear vortex roll-up and further vorticity stretching. Notably, thicker helium layers (
and
) sustain higher enstrophy over time, reflecting enhanced vorticity production and more developed vortex structures due to the delayed interaction of the transmitted shock with the second interface. In contrast, thinner layers exhibit lower enstrophy levels and earlier plateauing, resulting from the limited time available for vorticity amplification before encountering reflected and transmitted waves at the second interface.
Figure 12b illustrates the temporal evolution of the spatially integrated kinetic energy. Following the shock impact, kinetic energy increases steadily as momentum is transferred from the incident shock to the helium layer, accelerating the perturbed interface. Thicker helium layers attain higher peak kinetic energy due to prolonged interaction between the transmitted shock and the evolving interface, which facilitates greater momentum deposition and sustained instability development. In contrast, thinner layers exhibit a more modest increase in kinetic energy, as the transmitted shock reaches the downstream interface sooner, thereby curtailing the energy transfer process and limiting interface amplification. At later times, the kinetic energy curve begins to plateau, indicating a transition toward a quasi-steady state. This leveling-off signifies that baroclinic vorticity generation and bulk acceleration have largely subsided. While the kinetic energy stabilizes, this does not necessarily imply that the pressure and velocity fields have become identical at the domain boundaries (
and
). Rather, it reflects the attenuation of large-scale gradients and dynamic imbalances, with only localized variations remaining due to residual vortical structures and interface deformation.
4.3. Effect of Perturbation Amplitude
The initial perturbation amplitude plays a critical role in determining the growth rate and nonlinear evolution of the shock-accelerated single-mode RMI in a light helium layer. To investigate this influence, simulations are performed for three different perturbation amplitudes (, 10, and 15 mm), while keeping the fluid layer thickness ( mm) and shock Mach number () fixed. The following simulations are also conducted with a third-order modal DG scheme using a grid, Krivodonova limiter, and .
Figure 13 shows the effect of initial perturbation amplitude on the evolution of the shock-accelerated single-mode RMI in a light helium layer. The figure presents density contours and density gradient contours at normalized times
, 10, 20, and 30 for perturbation amplitudes
. The results demonstrate that increasing the initial perturbation amplitude leads to more pronounced interface deformation, stronger vorticity generation, and accelerated instability growth. For the smallest amplitude (
), as illustrated in
Figure 13a, the interface shows modest displacement and delayed onset of nonlinear features such as roll-up and vortex formation. The interface remains relatively smooth with limited secondary structures by
. At
, as shown in
Figure 13b, the interface exhibits greater initial displacement and earlier development of nonlinear features. The density gradient contours reveal the emergence of Kelvin–Helmholtz instabilities and moderate vortex roll-up by
, with secondary vortices appearing along the shear layer by
. For the largest amplitude (
), as illustrated in
Figure 13c, the interface deformation is most pronounced, with rapid growth and early formation of large-scale vortical structures. Significant roll-up and vortex merging are already evident by
, while at
, the interface evolves into a highly deformed, turbulent-like structure with strong curvature and dense clustering of vortices.
Figure 14 illustrates the effect of initial perturbation amplitude on the temporal evolution of spatially integrated baroclinic vorticity
and (b) enstrophy
in the shock-accelerated single-mode RMI within a light helium layer, at fixed layer thickness
and shock Mach number
. The results are shown for three perturbation amplitudes:
, 10, and 15 mm. In
Figure 14a, the baroclinic vorticity exhibits an initial sharp rise following the shock–interface interaction, corresponding to baroclinic torque generated by the misalignment between pressure and density gradients along the perturbed interface. The magnitude of
increases with increasing
, indicating that larger initial amplitudes enhance baroclinic vorticity generation due to stronger interface slope gradients. While all cases show a peak shortly after shock impact, thicker perturbations sustain higher
over time, reflecting persistent vorticity production as the instability grows and transitions into the nonlinear regime. Similarly, in
Figure 14b, enstrophy
increases rapidly after shock impact, driven by the amplification of vorticity as the interface deforms. The peak enstrophy and sustained levels are positively correlated with
: larger perturbation amplitudes lead to higher
, reflecting stronger rotational motion and more intense vortex roll-up. Multiple peaks in enstrophy are observed at later times for higher
, corresponding to successive vortex interactions, merging, and secondary instability development.
4.4. Effect of Incoming Shock Wave Strength
The strength of the incident shock wave plays a critical role in dictating the evolution of RMI, influencing the interface deformation, vorticity generation, and instability amplification. To examine this effect, simulations are conducted for three shock Mach numbers (, 1.21, and 1.40), while keeping the helium layer thickness () and initial perturbation amplitude () fixed. All simulations in this investigation are performed using a third-order modal DG scheme with a grid resolution, the Krivodonova moment limiter, and a fixed CFL number of .
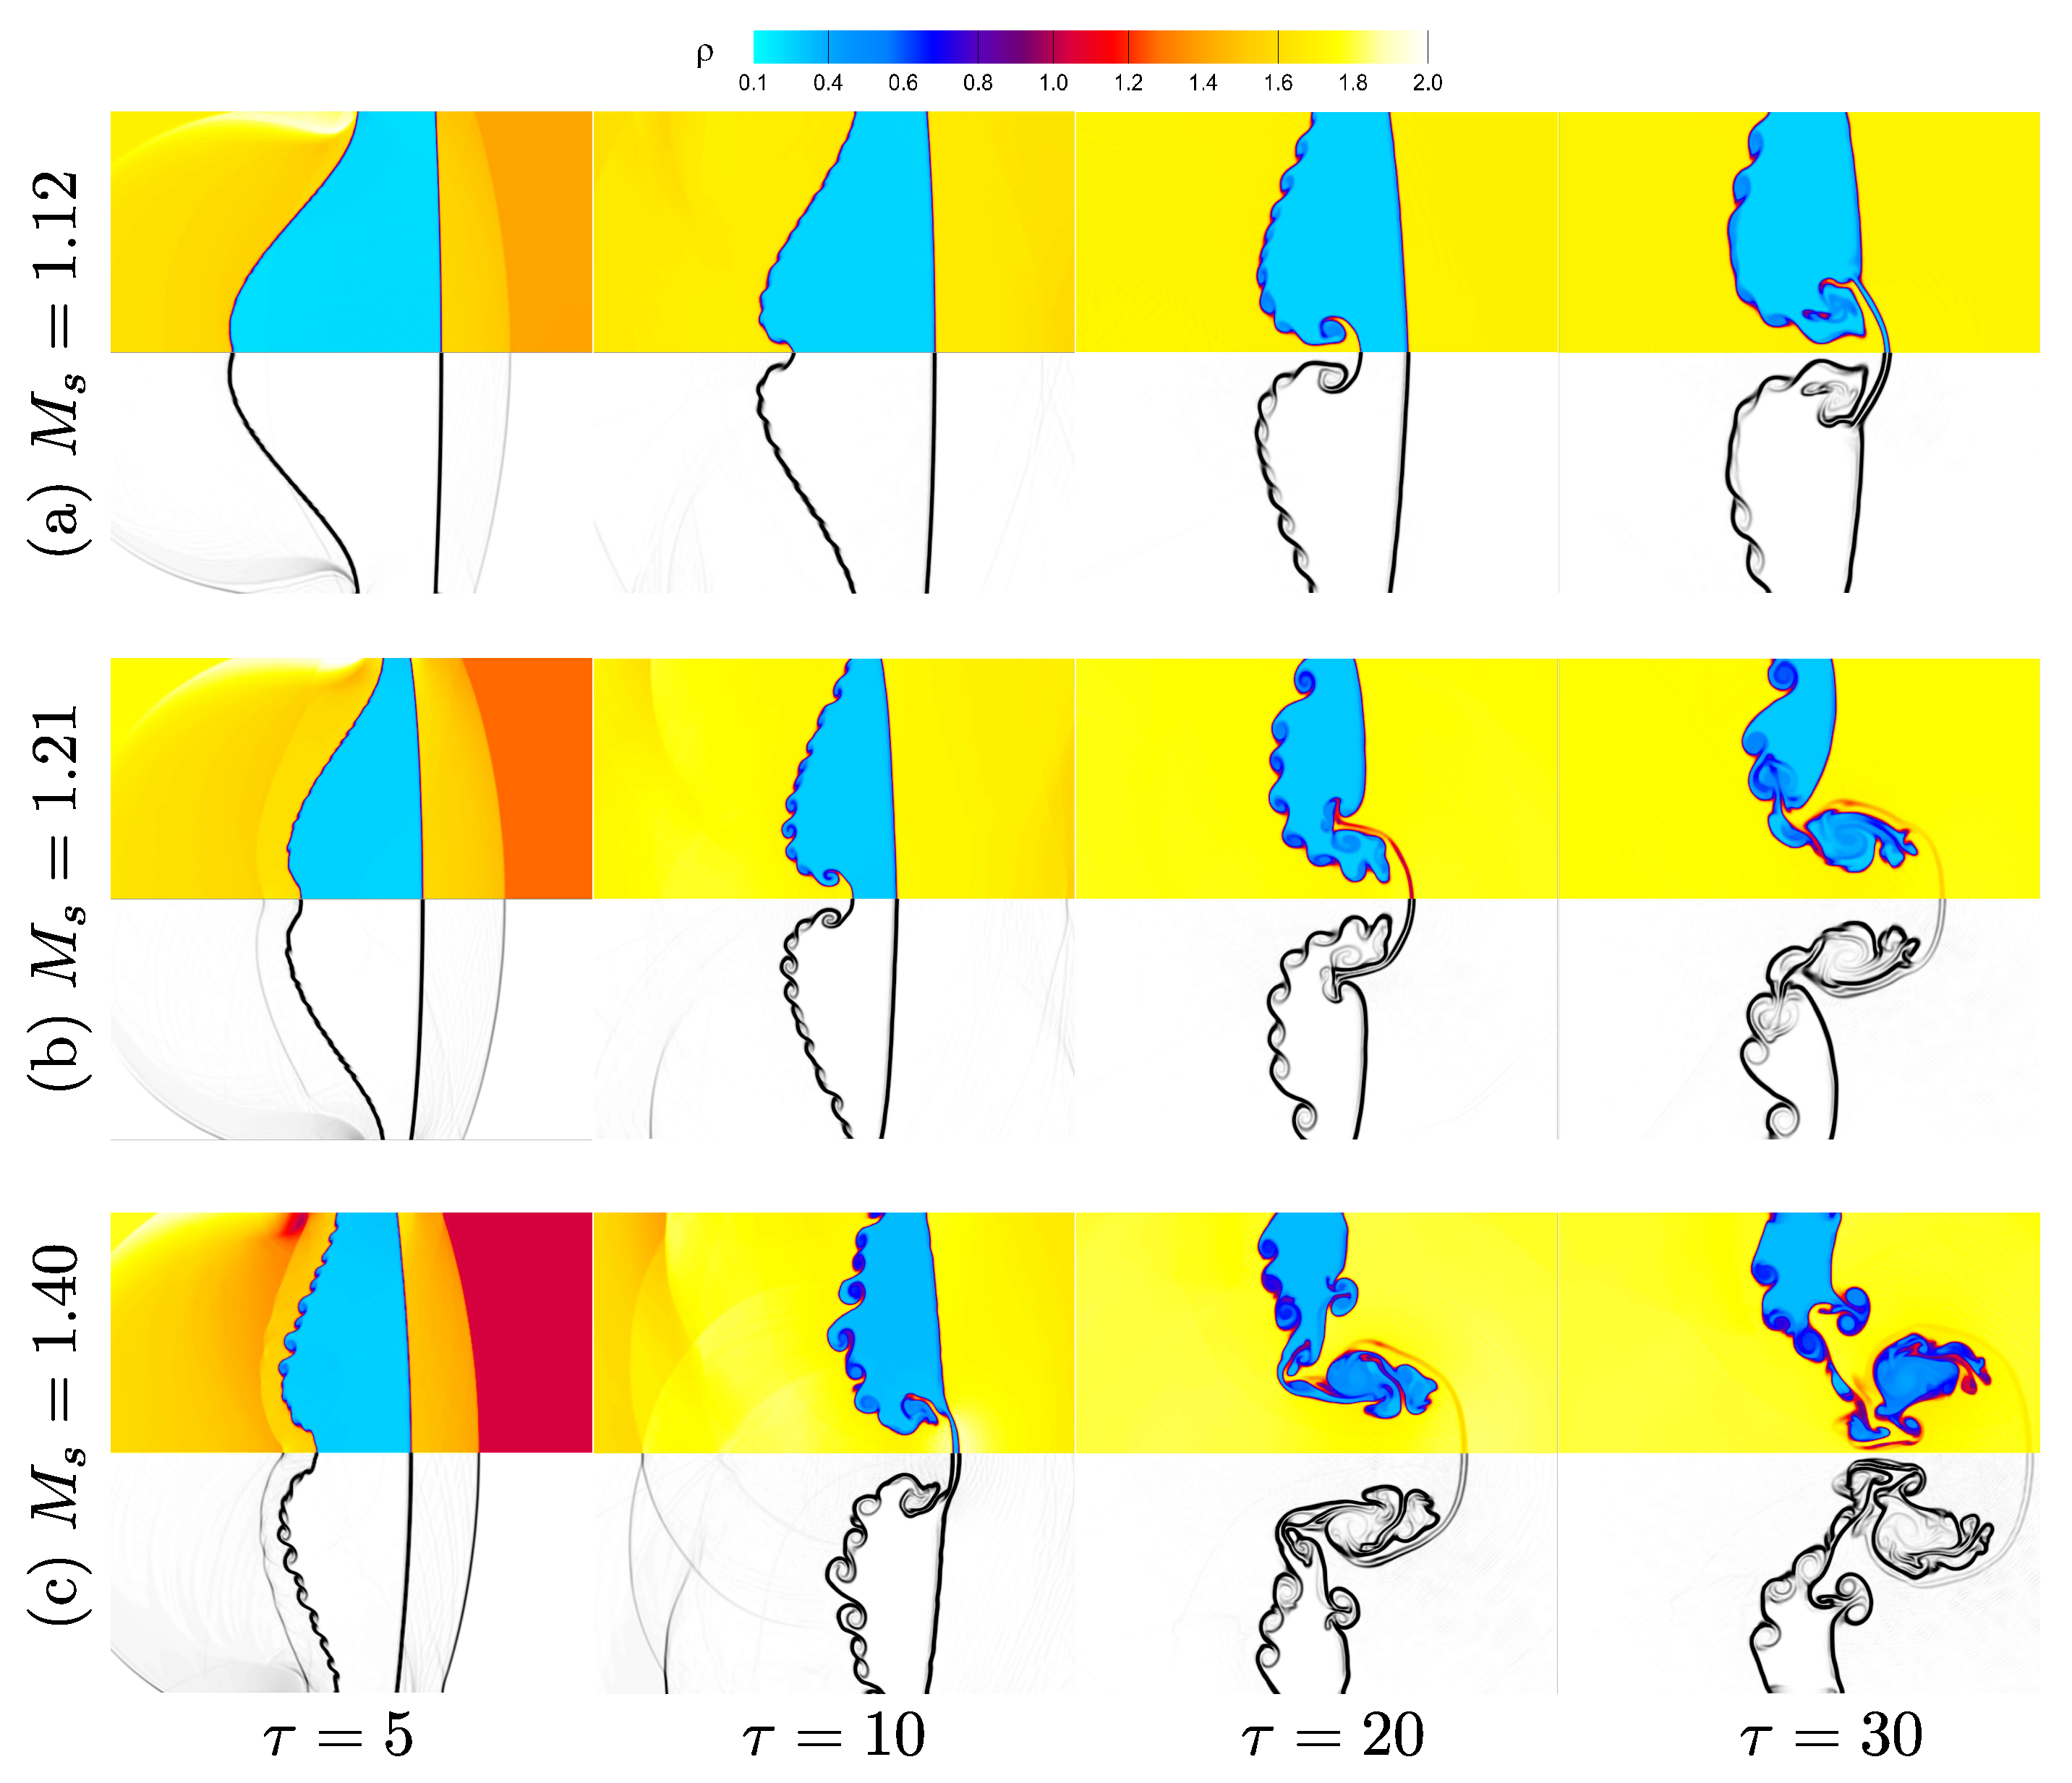
With a fixed layer thickness of
and an initial perturbation amplitude of
,
Figure 15 illustrates how the progression of the shock-accelerated single-mode RMI in a light helium layer is affected by the strength of the incoming shock waves. For three shock Mach numbers
, the figure displays density and density gradient contours at normalized times
, 10, 20, and 30. The results demonstrate that increasing the shock strength accelerates the instability growth and intensifies interface deformation. For the weakest shock (
), as shown in
Figure 15a, the interface undergoes moderate displacement and delayed vortex roll-up, with relatively smooth interface morphology persisting up to
. Vorticity generation and nonlinear structures are weaker due to reduced baroclinic torque and lower velocity gradients imposed by the weaker shock. At intermediate shock strength (
), as shown in
Figure 15b, the interface shows greater displacement and earlier development of vortical structures. The density gradient contours reveal clear Kelvin–Helmholtz roll-up starting by
, with multiple vortices formed along the interface by
. The stronger shock enhances baroclinic vorticity generation, resulting in more pronounced instability amplification. For the strongest shock (
), as shown in
Figure 15c, the interface exhibits rapid deformation and highly nonlinear roll-up. Large vortex cores and significant interface curvature are already visible by
, and by
, the interface evolves into a complex, folded structure with intensified vortex merging and secondary instabilities. The density gradients show sharper features and higher gradients, reflecting stronger vorticity accumulation and faster transition toward turbulent-like mixing. In summary, increasing the incident shock Mach number promotes faster instability growth, stronger baroclinic vorticity generation, and more complex interface morphology. The higher shock strength enhances the pressure gradient across the perturbed interface, leading to greater misalignment with the density gradient and stronger baroclinic torque, thus accelerating the nonlinear evolution of the single-mode RMI in the light helium layer.
Figure 16 shows the effect of incoming shock wave strength on the temporal evolution of spatially integrated baroclinic vorticity
and enstrophy
for shock-accelerated single-mode RMI in a light helium layer, with fixed layer thickness
and initial perturbation amplitude
. In
Figure 16a, the baroclinic vorticity exhibits a rapid rise immediately after shock–interface interaction, corresponding to the onset of vorticity generation driven by the baroclinic torque (
). The magnitude of
increases significantly with increasing shock Mach number, indicating that stronger shocks amplify the baroclinic mechanism due to higher imposed pressure gradients. The strongest shock (
) achieves the highest peak and sustains elevated vorticity over time, while the weakest shock (
) generates lower and less persistent vorticity levels. Similarly,
Figure 16b shows that enstrophy, representing the integral of squared vorticity, follows the same trend: it increases rapidly after shock impact and reaches higher values as the shock strength increases. The largest enstrophy is observed for
, reflecting enhanced rotational motion, stronger vortex structures, and more complex interface deformation under the influence of the stronger shock. In contrast, lower enstrophy is associated with
, indicating weaker vorticity amplification and delayed nonlinear transition. In summary, these results demonstrate that increasing the incident shock Mach number promotes stronger baroclinic vorticity generation and accelerates the growth of rotational structures, leading to higher enstrophy and more vigorous instability development. The higher shock strength amplifies the coupling between pressure and density gradients at the perturbed interface, driving faster instability growth, earlier transition to nonlinear regimes, and enhanced mixing in shock-accelerated light fluid layers.
5. Conclusions and Future Work
In this study, high-fidelity numerical simulations were conducted to investigate the Richtmyer–Meshkov instability (RMI) in a shock-accelerated, single-mode light helium layer surrounded by nitrogen gas. A high-order modal discontinuous Galerkin method was employed to solve the compressible two-component Euler equations and to capture the nonlinear evolution of the interface. The investigation focused on the effects of three key physical parameters: helium layer thickness, initial perturbation amplitude, and the incident shock Mach number. The simulations successfully resolved complex flow features such as transmitted and reflected shocks, vortex roll-up, Kelvin–Helmholtz instabilities, and nonlinear interface deformation, offering comprehensive insights into the underlying instability mechanisms.
The results highlight that the nonlinear progression of RMI is highly sensitive to the examined parameters. Among these, the helium layer thickness plays a particularly crucial role in determining the temporal and spatial evolution of interface dynamics. Increasing the helium layer thickness prolongs the time required for the transmitted shock to interact with the downstream interface. This extended interaction window allows the initial perturbations to amplify more freely, resulting in sustained baroclinic vorticity generation and more pronounced interface deformation. As the layer thickness increases, the interface undergoes more extensive roll-up, forming well-developed vortex structures and secondary instabilities such as Kelvin–Helmholtz modes. For thin layers, the shock quickly reaches the second interface, limiting the instability development and suppressing nonlinear growth mechanisms. In contrast, thick helium layers provide a larger spatial domain for instability to evolve, enabling the accumulation of vorticity and the emergence of complex flow structures before the transmitted shock reflects or refracts from the second boundary. This effect is evident in the observed trends of increased enstrophy and kinetic energy with layer thickness, indicating stronger rotational motion and more vigorous mixing dynamics.
Another key focus of this study was also the influence of the incident shock Mach number () on flow evolution. It was observed that higher values substantially accelerate instability development and intensify interface distortion. Stronger shocks increase the baroclinic torque across the perturbed interface, resulting in earlier transition to nonlinear regimes and the formation of prominent mushroom-shaped structures. At , the simulations revealed sharp interface gradients and intricate secondary instabilities, in contrast to the more subdued and delayed features observed at . Quantitatively, higher shock strengths were associated with greater spatially averaged vorticity, elevated baroclinic vorticity generation, and sustained enstrophy. Additionally, kinetic energy exhibited more rapid growth with increasing , driven by stronger momentum transfer from the shock wave to the helium layer.
Future work will extend this study in several directions. Higher Mach number regimes and varying density and specific heat ratios will be explored to assess their impact on baroclinic vorticity generation, particularly in astrophysical and high-energy-density contexts. The inclusion of physical viscosity, species diffusion, and multi-mode initial perturbations will enable a more realistic analysis of mixing and nonlinear mode coupling. Additionally, three-dimensional simulations will be pursued to capture mechanisms such as vortex stretching generation (VSG), which are absent in the current two-dimensional framework.


