Abstract
Sustainable development generally includes three key dimensions: environmental, economic, and social. However, both in practice and in theory, the social dimension often receives less attention than the other two, even though it is just as important. This lack of focus can be seen in the lack of tools available to measure problems within the social dimension, such as emotional sustainability within the work environment. The objective of this research is to propose a methodology for emotional classification (ECM) using advanced systems such as artificial intelligence to serve as a tool for measuring emotional sustainability in a work environment. This methodology was applied in an institution whose objective was to accredit and comply with a Mexican standard (NOM-035) regarding stress and anxiety of labor personnel. As a result of the research, we have a method for emotional diagnosis that functions as a tool for the quantification and evaluation of emotions and thus contributes to the implementation of social sustainability. Finally, a proposal for improvements and factors to be taken into account in order to reproduce the ECW method is offered.
Keywords:
social sustainability; artificial intelligence; deep learning; emotion classification; emotional sustainability; emotional diagnosis MSC:
68T01; 68T07; 68T20; 68T09; 92B15; 62R20
1. Introduction
Sustainable development is commonly understood to involve three dimensions: environmental, economic, and social. However, the social dimension is often neglected in both practice and theory, as scientific research and technological development are predominantly concentrated in the environmental field. This includes efforts to preserve biodiversity, safeguard ecosystems, improve resource efficiency, promote green production, develop eco-innovative technologies, and reduce the impacts of global warming and climate change. Comparatively, the social dimension, including combating poverty and promoting social equality through education and health, is neglected. Organizations are increasingly endeavoring to reduce their carbon footprint, decrease their reliance on plastics and other raw materials, switch to more sustainable energy sources, conserve, and care for nature, as well as strive for more eco-friendly business models. Conversely, the social dimension of sustainability, including emotional sustainability, which has a direct impact on the wellbeing of workers, is not given as much attention [1]. Social sustainability (Figure 1) occurs when social systems and their relationships and structures aim for the active support of future healthy and livable communities, fulfilling the current needs of society without risking the needs of future generations [2]. According to this definition, it is critical to address which needs have been identified as promoting social wellbeing and how factors such as health, personal relationships, safety, living standards, equality, freedom, the environment, and services [3] influence social sustainability.
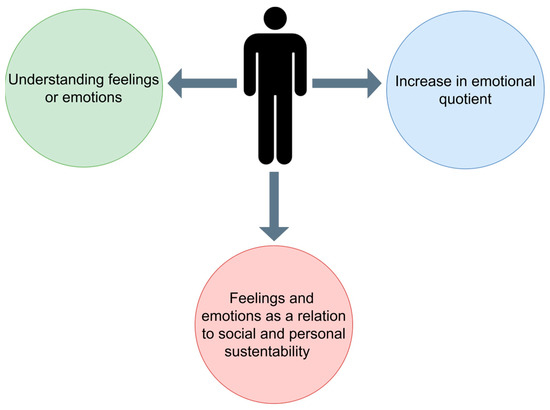
Figure 1.
Emotional Sustainability.
At present, employees are operating in extremely challenging contexts, with an inclination towards the utilization of digital technologies in the corporate atmosphere [4], particularly in the manufacturing sector, due to the emergence of I4.0. Environments with highly automated systems are increasingly being demanded, resulting in greater technical complexity and more challenging workplaces for workers, as they must interact with large-scale human–machine interfaces and are exposed to the digital transformation of work, wherein the majority of tasks are completed by computers or at least through an interface [5,6]. The digitization of companies necessitates continuous internal and external networking, resulting in employees having to remain constantly available via online platforms such as video and chat. This affects the way that individuals spend their working hours, as they are rarely disconnected from their professional obligations, which can be detrimental to their emotional wellbeing.
The encroachment of digital technology into daily life has made it increasingly difficult for people to differentiate between their professional and personal lives, resulting in an alarming spike in stress levels [7]. The blurring of the boundaries between work and relaxation has been accelerated by the rapid digitization of the world. In addition to this, due to the overwhelming amount of connection and engagement that comes with the digital age, workers are at a heightened risk of developing chronic mental stress, which, if left unchecked, could lead to severe health issues and even fatalities. It is important to note that those workers who lack experience with digital technology, such as those who work in manual labor or repetitive tasks with limited variation, are particularly prone to emotional health problems. Such constant exposure to digital technology can lead to heightened feelings of anger, stress, boredom, over-stimulation, and even hypersensitivity [8].
This results in the importance of measuring, diagnosing, monitoring, and controlling the emotional health of workers within their work environment in order to detect possible affectations in time and thus avoid serious illnesses for the employee, which in turn will be reflected in higher and better performance. Occupational health and safety management methodologies have been proposed to guide business practices (OHSAS 18001, CSA Z1000-06, Z1002-12, etc.) [9]. However, continuous monitoring and measurement of emotions are required to provide a diagnosis while enabling the mass connectivity inherent to I4.0. Therefore, the objective of this research is to propose a methodology for emotional classification (ECM) that serves as a tool to measure emotional sustainability in a work environment. Such a methodology was applied in an institution that aimed to accredit and comply with a Mexican standard (NOM-035) regarding stress and anxiety of working personnel. The following section describes the proposed methodology, followed by the results of its application in this institution, discussion, and conclusions.
2. Materials and Methods
In order to gain a deeper comprehension of the correlation between emotional state and social sustainability, a direct approach was implemented. This study’s method focuses primarily on the evaluation of different literature review techniques for emotional analysis and the identification of hazardous situations. Based on the analysis, a new path will be defined and implemented. The following sequence of steps is proposed as an approximation obtained through experimentation and appropriate analysis, which is later elaborated:
- Background revision.
- Analysis of tools, theoretical approaches, and comparison of emotional diagnosis techniques.
- Development of an emotional diagnosis method.
- Implementation of emotional diagnosis as a social sustainability metric.
2.1. Background Revision
The main idea behind the background revision is to find useful systems or practices for emotional detection and its interpretation as a form of index for workers. Nonetheless, this process will allow the identification of gaps and opportunities to be covered while determining emotions via technological approaches; as a consequence, the following steps are proposed:
- Consult the literature to identify relevant themes or topics. During this stage, several pertinent terms connected to the investigation—e.g., biometrics, emotional detection, deep neural networks—were explored.
- Examine the years in which articles were written. In this step, we limited our search to articles published within the last five years, with the exception of articles in a knowledge base.
- Interpret the articles’ titles. This section has the purpose of eliminating topics that are not pertinent to the research while simultaneously emphasizing any information that may be pertinent or significant.
- Identify relevant sections and subjects. During the comprehensive literature review, sources of information were scrutinized, and a more focused search was conducted to identify topics or existing relevant information related to the proposed methodology.
- Review if the bibliographies are recent or related to the topic. Supplementary data were obtained from the bibliographic references of the review articles. To ascertain the relevance and timeliness of the sources, the citations within the articles under consideration were examined, and if deemed appropriate for the research, they were included in the literature review conducted in the initial phase.
2.2. Analysis of Tools and Theoretical Approaches and Comparison of Emotional Diagnosis Techniques
A structured and systematic approach was proposed to examine and assess the relevant instruments and theoretical frameworks in order to identify the key components of emotional diagnosis and compare them to the primary goal of the research. Therefore, it is relevant to target the components of emotion diagnosis, such as the number of signals and systems used to process and classify emotional states. The following rough model was implemented to achieve the aforementioned objective:
- Define main goals and key indicators. To effectively diagnose emotions, first it is necessary to determine the main emotions analysis or stimuli goals. Depending on the goal of the diagnosis, the method or approach will differ. Indicators also play a strong role in defining the path for emotional detection. Indicators work as stimuli or phenomena focused on in biometrical readings, depending on the emotion intended to be measured. For example, indicators could vary from skin temperature to brain activity.
- Identify the elements that are going to be compared. Given the variety of emotional goals and measures taken, comparing different techniques or approaches can be difficult. Therefore, extreme care must be taken when identifying comparable elements in a diagnosis.
- Analyze and study the differences. Once the possible comparison elements have been identified, the study of the difference in the application and the advantages and disadvantages gained with it will increase the filtering of relevant information.
- Search for patterns and trends. Lastly, identifying patterns and trends in the data will help to determine what information is useful for the next step in research or identify possible areas of investigation.
Then, with the goal of gaining a better understanding and analysis of how emotions are measured, a numerical comparison is proposed based on the idea of comparing techniques and approaches depending on which method was applied to the sample or dataset and the technical aspects that were prioritized.
2.3. Development of an Emotional Diagnosis Method
Taking into account the previous analysis and with the main goal of developing an emotional diagnosis method, the following sequence of actions is shown and expanded sequentially (Figure 2):
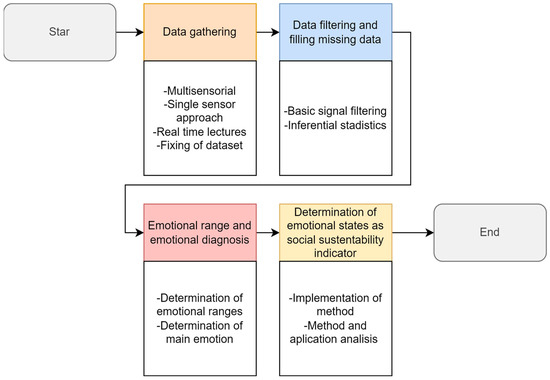
Figure 2.
Method proposed.
2.3.1. Data Gathering
The initial step in any technological diagnosis is the gathering of data. Due to the emotional nature of the subject, the primary source of data regarding emotional state should be obtained via the use of sensory systems and biological signals, either in real time or using previously obtained scenarios. In consequence, data collection can be divided into two fundamental approaches. The first method places emphasis on real-time analysis, necessitating the concurrent measurement of biological signals at the time of diagnosis, while the second relies entirely on the dataset of previous biometrical readings [10].
Given the importance of a clinical basis for the technological diagnosis of emotions, the data-gathering method for such applications is dependent on the specific application. Most research and applications that focus on data analysis or the implementation of new tools and techniques tend to employ a single-sensor approach. By contrast, many real-world applications utilize multiple sensors to acquire biological emotional data.
2.3.2. Data Filtering and Filling Missing Data
Given that much of biological analysis is dependent upon the quality of the data, it is essential to ensure a minimum number of gaps in the dataset, as well as to employ appropriate filtering techniques. Nevertheless, it should be noted that certain types of filtering may alter the behavior of the signal. This combination is presented based on its intrinsic qualities, which will be further elucidated in the following section. In order to achieve a proper filtering of biological signals, a multilayer filtering process is recommended, relying on eliminating non-prolonged amorphous data.
- Initial filtering. Initially, it is advised to utilize a low-pass filter in the case of real-time readings, as this can be implemented in the hardware of the data-gathering system. Alternatively, if the data are obtained from a pre-existing dataset, a mathematical simulation should be used. The point of such implementation is a spike control; therefore, the following filtering is presented. Suppose the original raw signal behaves as a regular waveform. It should be described by the following function:where t describes time and x the variable of signal input. Considering that the signal is sourced from a non-neuralgic origin, a common method of analysis is to take samples at regular time intervals. Consequently, the analysis shifts to a sample-based approach, where h is the time interval between samples and i is the proportion of this interval to the total time:This results in a correlation of new filtered values in the form of listed data:Once the data input has been subject to low-level filtering, it may be necessary to employ inferential statistical techniques. It can be deduced that certain sensory systems are capable of quickly collecting vast quantities of data, particularly when dealing with real-time events. Utilizing the mean and standard deviation to compress biometric data, as well as eliminate anomalous values and uncontrolled stimuli, is a valuable strategy. The proposed method uses an all-purpose statistical basic analysis, which will allow reducing possible relevant data while filtering, achieved by the implementation of a cyclical moving average as shown next:The advantages of the previously mentioned filtering process include the suppression of the noisy signal for any subsequent analysis or implementation of the data (Figure 3 shows an example of biosignal filtering).
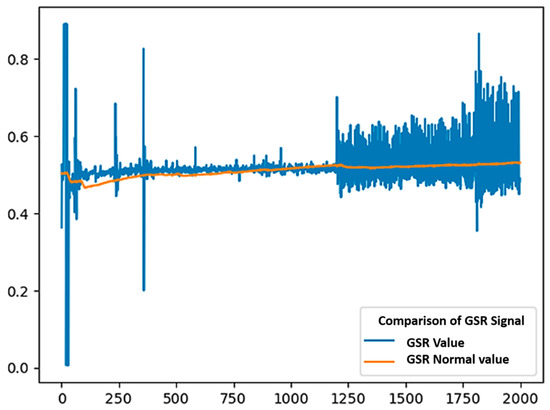 Figure 3. Example of biosignal filtering.
 - Filling in missing data is a vital process used to fill any blanks in data gathered after filtering biological signals, with a particular emphasis on secondary physiological reactions. Support vector machines, K-nearest neighbor (K-nn), or Naïve Bayes is recommended for this, as biological signals tend to follow predictable patterns, making them easily foreseeable signals. This detailed dataset is then employed to accurately fill in any missing pieces in the collected data. It is essential to note, however, that the process of filling in missing information will be determined by the main purpose of the implementation as well as the emotional data chosen. The proposed SVM-based approach for filling in missing data in a multisensory reading style should be followed as shown next. Support Vector Machines (SVM) use a hyperplane to effectively divide data into two distinct categories. New instances can be mapped into the same space and classified according to which side of the hyperplane they fall on. A successful separation is achieved when the hyperplane is maximally distant from the nearest training data points of any class (referred to as the margin). A larger margin typically leads to a lower generalization error of the classifier. Thus, the key to SVM is identifying a hyperplane with the greatest margin:The main comparison between the multiple possible results for missing data can be assessed by the distance comparison of the vectors; in the next equation, the main approach for measuring such distances is taken from the measuring of Euclidian distances but adapted to hyperplane equations:where the numerator stands for the hyperplane equation from a given vector and the Euclidean norm . Lastly, after obtaining the distance, the maximization of the minimal distance value is defined:The system can be trained to predict values based on the initial classification by using learning datasets. It is important to keep in mind that these predictive measures should only be employed if the statistical filtering leaves gaps in the data, which is unlikely with the most common types of sensory signals.
2.4. Emotional Ranges and Emotional Diagnosis
The determining factor in emotional diagnosis lies in the emotional range and the specific emotion. This is considered the difficult part, as it is the core of emotional and social sustainability. It also answers important questions, such as how your feelings affect you. In order to identify specific emotions, the emotional range must be determined. This emotional range consists of the four main emotional aspects of the human mind:
- Positive low-arousal range.
- Negative low-arousal range.
- Positive high-arousal range.
- Negative high-arousal range.
The emotional range of the desired emotion will dictate the focus of the signal analysis, though common tools can be used for both general and specific classification.
This section is important for the readings, as it outlines the process of classifying emotions into four main ranges. Utilizing previous readings of external variable analysis as the foundation for a pre-emotional state and utilizing a K-nn classification, an emotional range value can be obtained. This is because emotional states constitute a general approach to the subject’s status; therefore, they tend to be very general and can be inferred somewhat easily. It should be noted that the tool for range classification may vary depending on the application and signal used, but distance comparison approaches are strongly recommended for their computing cost efficiency.
The K-nn algorithm is similar to SVM in that it relies on measuring distances. However, unlike SVM, it uses a more common value approach that allows for the identification of similar values in a subset, resulting in a more accurate approximation of the emotional phenomenon. The following section will outline the proposed procedure:
Having the same equation for Euclidean distance and a distance value , class input assignment is defined as follows:
The classification at this point is expected to be rough and can be predicted with relative ease. Nonetheless, the only output will be an emotional range, not an actual emotion. In order to identify real emotions, the external values of the reading must be taken into account. This especially depends on the focus emotion of the analysis; for example, in the case of identifying anger, a classification must deliver the negative high-arousal range reading. However, considering the emotional states that can be found in this range, it could be inferred that stress or anxiety present the same output, confusing the result.
In order to solve the aforementioned problem, an external analysis of external variables related to the study subject is proposed. This external analysis will focus on factors such as humidity, the subject’s previous emotional condition, age, general health, and gender. These values will create the basis for a deeper analysis and diagnosis. The proposed method for obtaining and using this information is described below.
To take the values of external parameters into account, a direct ponderation is considered, resulting in some compensation values:
Once the external variable values are obtained, they will be utilized as output goals for a second classifier, as shown in the next diagram (Figure 4):
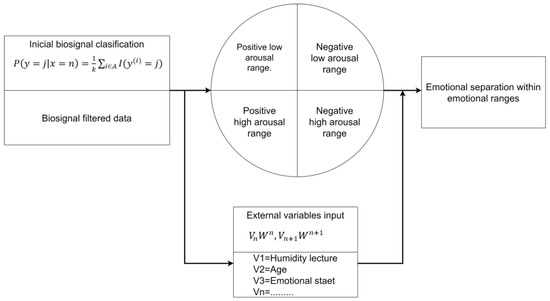
Figure 4.
Emotional separation within emotions.
As mentioned before, the ECM is effective at classifying emotions within a common emotional range. However, emotions such as anxiety that fall within a high-arousal negative range require a more sophisticated classification approach. A deep learning approach is recommended for this task, but it is important to note that any high-end classification algorithm could be used if the application demands it. Factors such as computing requirements and data quantities must be taken into account before implementing any solution.
One of the main reasons for avoiding mathematical base modeling for a neural network approach is the problem of modeling emotional behavior among different individuals. The second classification utilizes recurrent neural networks, which are popular in medical applications. However, if data are in a sequence such that one data point depends upon the previous data point, we need to modify the neural network to incorporate the dependencies between these data points. RNNs have the concept of memory, which helps them store the states or information of previous inputs to generate the next output of the sequence (Figure 5).
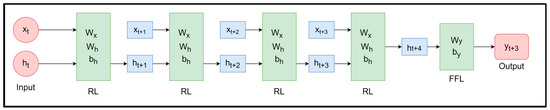
Figure 5.
Recurrent neural network operation.
In the above equation, consists of the input a time step t; is the output of the network a time step t; consists in a vector (array) that stores the values of the hidden units/states at time t; is weight associated with input values; is weight defined for hidden layers; considers the weight for y output; and lastly, are the bias associated with hidden layers and feedforward last layer, respectively. At each time step, the network can be unfolded for k time steps to obtain the output at time step k + 1. This behavior is similar to a feedforward neural network. Therefore, considering an activation function the behavior should be as shown next:
In consequence, the output values should be as follows:
In conclusion, the neural network should work as follows:
where l represents the layer index and the number of nodes on layer l.
In emotional detection terms, the RNN network computes the values of the hidden units (loaded with emotional measures) and the output after k time steps. The weights (obtained by the external variable classification) associated with the network are shared temporally. Each recurrent layer has two sets of weights: one for the input and the second for the hidden unit. The last feedforward layer computes the final output for the number of k time steps obtained to obtain the emotional state within the emotional range.
Currently, in terms of activation function, three main types are recommended: the sigmoidal function, the Tanh function, and the Relu function. Then, the training should utilize the backpropagation function; this algorithm, which is based on computing the gradient vector (Equation (15)), is called the backpropagation-in-time algorithm or BPTT algorithm for short.
This means that the learning rate will be determined by how quickly the algorithm can find the local minimum. As a result, the backpropagation function can be expressed in the network as follows, taking into account the error (d) in rate of time:
Determination of Emotional Diagnosis as a Social Sustainability Indicator
After outlining the technical approach for the method of emotional diagnosis, it is important to plan an approach to using it as a metric for social sustainability. As mentioned in previous chapters, social sustainability is often overlooked in favor of other aspects of sustainability, and as a result, the methods for measuring it are heavily reliant on questionnaires and indexes. In the case of emotional sustainability, there are few documented attempts to measure it, and the generalization of social sustainability indexes is not applicable.
The following approach is listed to determine the viability of the ECM as a metric for social sustainability:
- Construct an external values metric.
- Determine a sample from the available population.
- Analyze readings to create a diagnosis.
In order to reduce bias and stabilize output, a metric approach should be taken to evaluate external values. This approach would involve using a questionnaire with basic information to be integrated into the system. The information should be taken from a real-world sample in order to account for factors that cannot be directly measured from biosignals, such as environmental temperature and humidity, gender, age, previous cardiovascular conditions, previous respiratory conditions (including COVID), infections or fevers in the last 10 days, level of tolerance to negative emotions, time in the week dedicated to exercising, number of working hours per day, and whether the subject has a chronic condition.
After the initial external values have been gathered, it is necessary to determine how many subjects will be in the sample from the available population. The sample size will be obtained from the finite population, due to the fact that social sustainability depends on social structures. The following procedures can be used to calculate the sample size.
The sample size (n) can be defined as a function of the population size (N), the confidence level (Z), the accepted error (e), and the probabilities of success (p) and failure (q) for the given case:
It is important to obtain samples from two different populations in order to compare the classification of emotions. One population should come from a pre-established emotional database, such as a repository for anxiety or happiness, while the other should be a real-world population.
As this section continues to focus on the process of diagnosis, after obtaining the biological data, the diagnosis can be made by post-processing the biometrical signals. To do this, the signals must first be passed through a filtering system and then be classified, as explained in Figure 6.
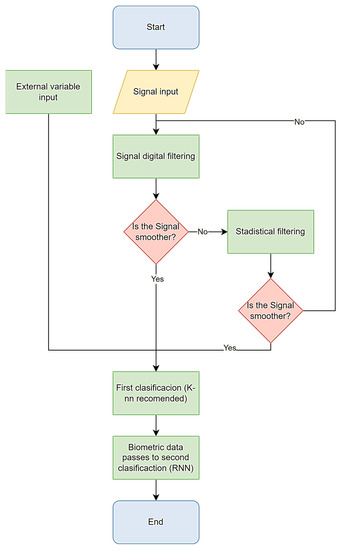
Figure 6.
Diagnosis approach.
Once the sample and diagnosis method have been established, a common analysis of accuracy, precision, and recall should be conducted. For this research, statistical measures such as the mean and relevant graphics will be used to assess behavior and revise performance as needed. It is suggested that using F1-scores as a tool for evaluating the classification model would be most effective. Nonetheless, it is important to recapitulate that the main goal of such responses is to corroborate their capability of measuring emotional sustainability.
The F1-score is a metric that is commonly used in the field of machine learning for evaluating the performance of automatic classification models. The score is based on the harmonic mean of the precision and recall values. Additionally, the concept of accuracy can be used to evaluate the number of correct predictions compared to the number of false predictions in a model. representing true positives, representing false positives, and representing false negatives results in the following:
Similarly, the second evaluation metric, recall, is based on truth relations in the classifications, but the structure of the formula is different, as shown below.
The F1-score can be obtained by unifying the readings using the concept of arithmetic mean.
3. Results
All the results from the proposed methodology will be expanded and explained in the next section of the study, with any difficulties or discussions being reserved for the following chapter.
3.1. Background Revision Results
As the main result from the literature review, the current approach for emotional diagnosis focuses on a more traditional physiological method. In most environments, there is no question or discussion that the diagnosis of emotional conditions is more mature within the medical discipline [11]. Therefore, any diagnosis provided by a medical expert has low probabilities of bias and misinterpretation if the patient offers sincere information during diagnosis, although most medical diagnoses are often supported by medical equipment [12]. Based on the utilization of medical equipment, it can be understood that biological signals are often used by medics to support the separation of symptoms, allowing an extra backing of any analysis done to a subject and the consequential interpretation. However, in order for an industry to provide a direct diagnosis from a specialist as soon as possible, any specialist for emotional diagnosis must be a full-time company employee, thus requiring greater demand on the company in order to be rentable [13]. Nonetheless, while medical diagnosis can be very effective, it is also time-consuming and ineffective when checking large quantities of subjects and wastes valuable 4.0 technologies.
In contrast to the traditional diagnosis approach, research shows that in order to detect and diagnose negative emotional conditions within working environments, a technological approach should be preferable [14]. Furthermore, technological approaches encompass all systems that do not or only partially rely on a professional physician’s diagnosis. Some of the more relevant tools for modern emotional analysis consist of the application of machine learning and deep neural networks [15], which, when supported by biometrical technologies, can become dominant trends in clinical diagnosis [16].
However, signal processing, although critically important, does not give an actual diagnosis, at least not compared to a clinical one. Because of that, the next phase of technological diagnosis uses several technological tools, including biometrics methods, artificial intelligence, and cloud computing, to name a few [17]. All these tools help convert the tacit knowledge implied in traditional physiological analysis into technological knowledge. Based on what has been described thus far, the analysis for emotional conditions can be described as the implementation of biodata acquisition followed by a technological or professional analysis. Considering current available literature, it can be inferred that the main trend of emotional reading relies on two major approaches, being the multiple-sensorial approach and the single-sensor one. The first one utilizes multiple sensors to obtain biometrical emotional data; preferably, such sensors should obtain information from two or more biological systems within the human body, for example, the heart rate (cardiovascular) combined with the vision system of the eye’s behavior. In addition, this method has the capability of utilizing different kinds of signals and biological sources, which can vary greatly from one another.
The second one uses a single source for the biological data, for example, gathering heart data from an electrocardiogram only. Consequently, it is important to mention that both methods have their advantages and disadvantages; nonetheless, the implementation will rely mostly on the approach for emotional detection and the emotion that it aims to detect.
3.2. Results of Analysis of Tools, Theoretical Approaches, and Comparison of Emotional Diagnosis Techniques
The first result of the analysis is the finding of previous solutions for the problem, followed by the identification of emotion-reading methods as well as the usual approach for this kind of diagnosis and classification utilizing advanced methods; such tools or approaches are listed in the next section (Table 1):

Table 1.
Emotional diagnosis approaches.
Subsequentially, an analysis of the popularity of emotional biosignal utilization is shown in Figure 7 based on the common approaches for emotional reading. The previously mentioned analysis employs a numerical quantification for the popularity of biosignals based on the consulted literature and the selection criteria commonly utilized in deciding the pertinent data source. In addition, some relevant information about the alternatives is also listed as follows:
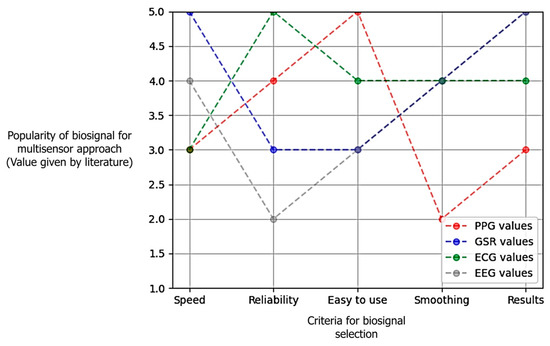
Figure 7.
Biosignals used for emotional detection.
- Photoplethysmography (PPG). This is a sensing technique that uses blood flow as its main signal source. By measuring heart rate variability (HRV) or simple heart rate (HR), it is possible to interpret emotions based on the autonomic nervous system (ANS). However, the main limitation of this signal is its sensitivity to movement and external factors.
- Galvanic skin response (GSR). This signal value comes from the electrodermal activity, which is an electrical current in the skin. In this case, the information was conflicting, with some studies showing good results [30] and others showing results that were not as good [31]. It is mainly critiqued for its sensibility to movement.
- Electrocardiogram (ECG). This signal is obtained directly from the heart and is therefore highly recommended for traditional diagnosis. However, it relies on expensive machinery.
- Electroencephalogram (EEG). ECG signals differ from other signals in that they come directly from brain activity. This makes them strong emotional indicators, but the downside is that they can be considered impractical.
It is important to note that there is no one established way to select signals for readings, so it is recommended to choose the signals that best fit the application within this research.
3.3. Results of Development of Emotional Diagnosis Method
The first section of the results for the diagnosis method is the basis for the rest of the project, as it pertains to data gathering. After much revision and testing of biological signals, the main achievement was the separation into operative combinations. These combinations gave different performance values, with the main difference being between the multiple-sensor approaches and the one-sensor approach. As a format for the evaluation of the combinations of signals, an average is utilized for comparing the standard in order to determine accuracy. The main sample consisted of 1000 values (Figure 8).
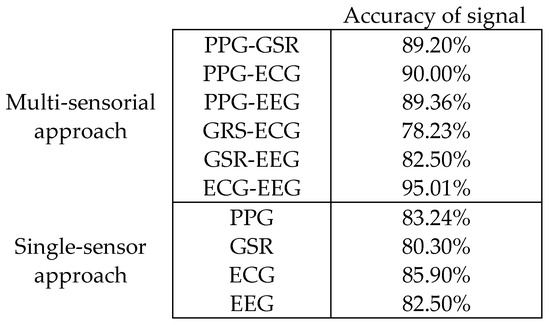
Figure 8.
Performance values.
Despite being able to infer patterns of accuracy in biometrical signals from the information displayed beforehand, the performance of the signals can vary greatly between a real-time reading and a database extraction. In this research, the most cost-effective approach was found to be using a database constructed from our own measures. Therefore, the method EMC recommends is to follow such a procedure. Although the preexisting datasets are not recommended, they can still be utilized for a comparison with the final emotional diagnosis if the emotional state of the preexisting dataset is known.
After reviewing the possible emotional signals, the data-gathering process continues with the data derived from them, which are presented in the following section (Figure 9):
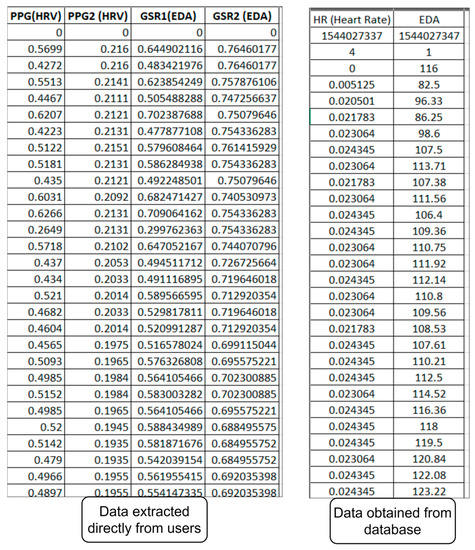
Figure 9.
Datasets for method testing.
In the figure, an example of data obtained from multiple sensors is shown. On the left, you can see data from the cardiovascular and electrodermal systems, such as heart rate variability and galvanic skin reflection. On the right, you can see the same data obtained from a fixed database.
Once the emotional values have been obtained, it is time to determine the external variables. However, there is a divergence in how external variables are utilized when managing a pre-existing database. This is because the external variables are directly related to the emotions obtained from a physical data measure. As a result, external values support the definition of the output for deep learning (by developing emotional ranges) only in direct data acquisition. It is important to be able to directly measure the values associated with an emotional diagnosis in order to obtain accurate results. This can be achieved by directly questioning and registering the relevant information without relying on non-numerical values, as shown in Figure 10.
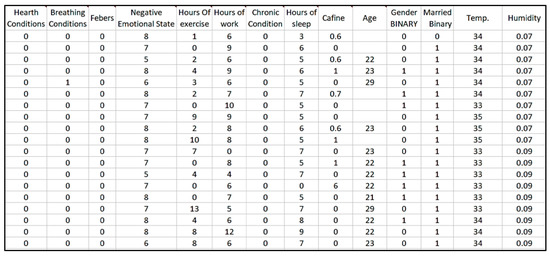
Figure 10.
External values results.
After receiving the biological and external values, the next step is pre-processing. This involves filtering the data to smooth it out, reduce noise, and remove short-term amorphous data. Depending on the state of the original data, this process may vary, but bases for this research recommend using an SVM algorithm (Figure 11) for indentation of missing data and at least a low-pass filter for noisy signals.
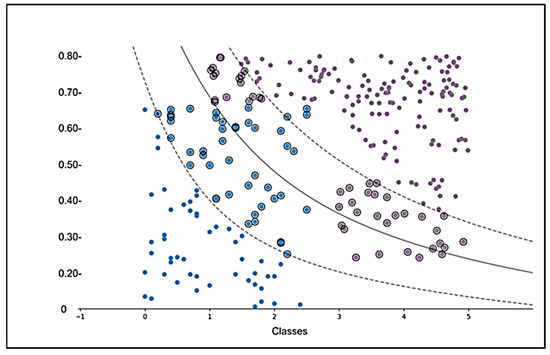
Figure 11.
SVM behavior.
Based on the previous figure, a variable will be segregated through the best hyperplane (middle curve), showing the separation of the sample into the main focus classes. Once the separation is achieved, the prognostic for missing data can be established by creating two main subsets, with the middle section working as a predictor base. A result of this is the smoothing of the signal by the filter, as well as the separation of the data into two datasets (80% for training and 20% for testing), with approximated 90% accuracy of prediction of missing data using the SVM approach with single biological signals.
As mentioned before, the key to successful emotion classification and its use for emotional and social sustainability lies in the ability to accurately identify and differentiate emotions within a given range. According to the ECM, in order to achieve emotion separation, multiple classification levels must be addressed. Initially, EMC recommends a process called the “nearest distance algorithm” for classifying external variables and linking them with the emotional biosignal data. Such tools generate a better understanding of emotion due to the fact that emotions and human tolerance to them vary greatly depending on the individual. Therefore, this kind of algorithm should adapt to how humans perceive emotions and the factors that affect them.
The selected algorithm for the previously mention purposed is K-nn (Figure 12). As mentioned before, the K-nn algorithm, as a classifier, separates alues into classes based on their proximity to the neighbor values and defines the unknown value as part of the most influencing neighbor. Nonetheless, it is important to mention that the best way to determine the best performance of the mentioned technique is by defining a specific number of neighbors for the comparison. At the same time, it is important to remember that the performance is not directly proportional to the quantity of neighbors, i.e., the performance of the algorithm will depend on a large enough value of k (neighbors), which does not affect the speed or becomes redundant when aiming to find the limit of the result value. In consequence, the best approach to obtain the k value is by testing alternatives and comparing performance; in this case, after several attempts, the two main k values obtained were k = 5 and k = 10. As a result of the algorithm, the next values for classification were obtained by utilizing the algorithm with the previously mentioned external variables:
Classification accuracy with k = 10 is 83.33%.
Classification accuracy with k = 5 is 88.88%.
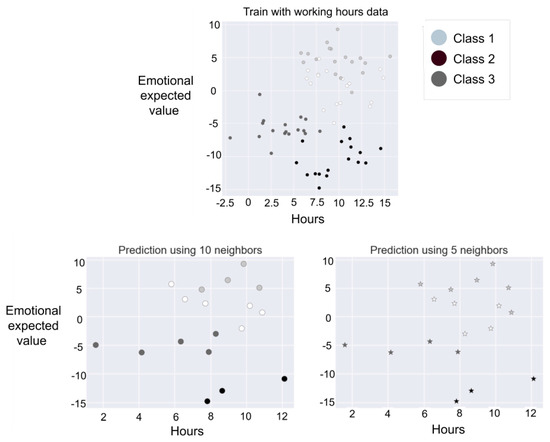
Figure 12.
K-nn performance.
Now, the classification of performance can be utilized. For example, while you are evaluating the emotional effect of working hours, the working hours can be divided into classes; overwork extends from 10 to 12 h, while regular working hours are 6–9 h. The subject would give the necessary information, and the algorithm would define which class is more suited to the input data.
Next, based on the emotional detection sequence, the measures taken from the subject are classified in order to sort emotions within an emotional range. This classification is implemented by a neural network, in this case, a recurrent neural network (RNN). RNNs were selected due to their efficient use of computing resources and their ability to handle large sample sizes.
The most important factor for utilizing a neural network is adjusting specific values and patterns in order to use the classification functions of the algorithm:
- Data normalization. It consists in the process of adjusting the scale of data to be introduced as input in algorithms. This can be done through methods such as experimentation and research. By normalizing data, we can ensure that algorithms receive input that is consistent and of a known scale, which can improve the accuracy of results.
- Weight initialization. It is described as a process of randomly initializing the weights of a neural network to reduce the instability of the gradient and allow for more effective training.
- Number of interactions. The system was tested with different numbers of iterations, from 100 to 1000, in order to find a critical point where the algorithm would not be overtrained.
- The learning rate. It is defined as the rate at which a model learns. In this case, the learning rate was obtained through trial and error. It is recommended to use a learning rate within the range of 0.1 to 1 × 10⁻⁶. For the particular case of this research, 1 × 10⁻⁶ could be done mostly with online IDE and GPU processing. If this option is not available, a compromise should be made within the aforementioned range.
- The activation function. To obtain the proper activation function, several were tested for different combinations of input and output layers to reduce gradient error. However, no significant effects were observed. Therefore, a version with only a sigmoidal activation function was selected and implemented due to its ease of implementation in the algorithm.
- Cross-entropy function. This section was chosen as the loss function due to its cost–benefit ratio.
In conclusion, the main behavior of the deep learning approach for classifying emotions is expressed below in Figure 13. Showing that the precision increases while the error is reduced, this expresses a proper learning operation from the model and a good performance of the classification, although improvements are a possibility. Considering the former, it can be seen that the classification would become more precise through time until reaching its limit.
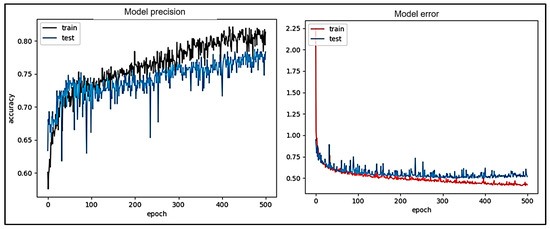
Figure 13.
RNN performance.
Next, some examples of the results of classification are shown. Due to hardware restriction, not all emotions could be included, but most of the common resulting emotions are integrated into Table 2.
Table 2.
Emotion classification result.
As the final result of the diagnosis based on ECM status, the main method is presented, based on the primary learning from the previously mentioned phases, and shown in Figure 14. In a direct manner, the method can be synthesized as follows:
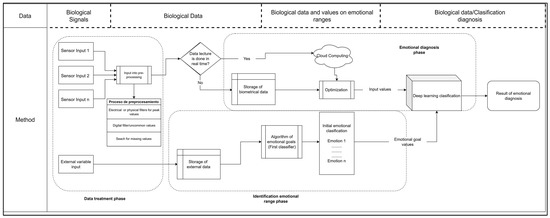
Figure 14.
ECM for emotional diagnosis.
- Main data are obtained through gathering and utilizing biosignals. As mentioned before, a multisensory approach is recommended over a single-sensor use. In addition, if the biometric data are taken directly from the subjects, the external data must be taken as well.
- Once signals and data are obtained, signals should be passed through preprocessing in the form of filters, with low-pass filtering being recommended. Subsequently and if needed, a revision for missing data due to the nature of the biological data distance values search is recommended, such as an SVM algorithm.
- Next is the data processing section, which is divided into two main paths, real-time processing and previously obtained data. In the first case, the computational power required for continuous biological signal acquisition and data processing would be considerable; therefore, in the case of following the first path, cloud computing is recommended, as well as optimization techniques. In contrast, by following the second option, a first classification utilizing biological data and external values is utilized for emotional range determination and the determination of the next classification’s characteristics.
- Lastly, a second classification utilizing advanced techniques determines the specific emotion within emotional ranges. Due to reasons explained in previous chapters, deep neural networks are recommended.
3.4. Result of Implementation of Emotional Diagnosis as a Social Sustainability Metric
To actually comprehend how emotional states affect the social sustainability of a company’s environment, a case study was conducted. This study was performed by measuring emotional conditions within a working environment and using technological systems to allow monitoring of the employees.
First of all, it is relevant to mention that the test was implemented at a university in Ciudad Juarez, which is a border town in the north of Mexico. In addition, the Mexican government has promoted social sustainability through norms that aim to reduce stressful conditions in the workplace, such as Nom-035. The analysis was focused on the Technological University of Ciudad Juarez, which handles mass connection systems within their organization and some other tools of Industry 4.0, as well as a requirement for fulfillment of social sustainability demanded by Mexican law.
In terms of the study itself, there are several aspects to address. First, it is important to mention that the university already has protocols for emotional control. For example, in the administrative branch, if an employee feels overwhelmed emotionally, he/she can leave and work in a home office mode. The same protocols are applied at some other companies in Juarez, such as Flex Manufacturing. The previously mentioned option is given to the administrative level due to the ability to change to a home office and the idea that they are considered the most emotionally affected of the employees. According to the managing personnel, most of the mentioned conventions were put in place because of a projection from government analysis on workers’ emotional conditions, but such analysis was performed in the capital of the country in entirely different conditions than those that rule the frontier. As a consequence, this creates a strong bias for the implementation of social sustainability through emotions.
In order to avoid the bias created by the central entities, the verification of emotional conditions within the university had to be carried out from the acquisition of data to the analysis.
Contrary to common belief, there is a wide range of emotional diagnosis approaches based on technological tools, most of which are oriented toward obtaining numerical evidence of the presence of negative emotional conditions. Here, based on previous ideas, this case was analyzed by applying a technological diagnosis tool integrated with 4.0 technology to the classification of emotional status on employees.
For the implementation, commencing with the solicitation of access to the company data from the validation of NOM-035, these data were originally obtained by completing a questionary made by the psychologist of the university, although it cannot be included in this document due to privacy policies. The main information obtained from it was a value between 0 and 1 that determined the worker’s emotional state (mostly anxiety and stress but also including depression). The actual study focused on addressing the range of negative high-arousal emotions, specifically anxiety and stress. The sample size came from the finite population of 140 that are present in the institution, and as mentioned in the previous process, a simple size equation was used to obtain a result of 70 samples. However, smaller samples were taken in order to find out how well the method performed. Lastly, the same institution provided a stress–anxiety inference measure by a physiology professional in order to compare results and verify the requested normativity (Table 3).
Table 3.
Implementation results.
The above table presents the results of the implementation. In this case, the same sample was first analyzed without a negative emotional condition, in a sort of neutral state. Later, the same population received a negative stimulus, which should alter the emotional state. Finally, the population was divided into two sections: one was considered the control section, which acted as a base for the reading, and the second sample mentioned previous negative emotional conditions. The reading was compared to the approximation that the institution had previously shown, and it was found that most personnel present negative emotional conditions, although some do not show a level that can cause alarm. Now, based on the previous evaluation from the company, the pattern appears to be the same. Nonetheless, according to the company, the administrative personnel were the most affected; therefore, such workers are the only ones that have distance work options. Nonetheless, according to the results obtained, the main focus group for the negative condition was the teachers. Let us recapitulate that the comparison between the previous data obtained by a health professional presents a comparable reading in all but the two previously mentioned cases.
At last, a quick evaluation of the algorithm was implemented utilizing a confusion matrix and the support of the physiological professional and the subjects in order to analyze its behavior as a specific emotion detector (Figure 15). This evaluation works only as a path to determining, from a computational point of view, how efficient the algorithm is. In the current case, the algorithm behaved well by obtaining a precision of 0.8837 and a recall of 0.9743, resulting in an F1-score of 0.9268. This indicated that the program itself can achieve a mostly correct classification of emotions based on the previously mentioned emotional ranges and biological readings.
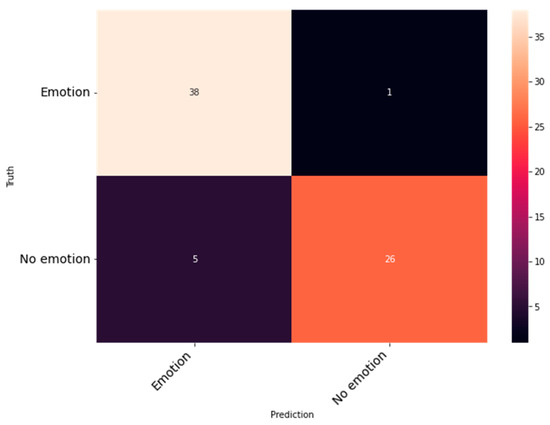
Figure 15.
Confusion matrix of the implementation.
4. Discussion
Although arguably relevant, it is important to address a relevant factor of this research, which is that there are few attempts to obtain a real measure of emotions in social sustainability, at least in a working setting. However, there are plenty of technological approaches for emotional detection and quantification. Considering such tools are available, companies can begin to develop an actual protocol for social sustainability, considering Industry 4.0 tools such as the Internet of Things and smart diagnosis, making it possible to actually guarantee sustainability at all levels in companies, not limiting themselves only to environmental measures and regulations. This method could be utilized as a standard for social/emotional sustainability indicators as well as a more tangible evaluation system for the validation and improvement of sustainable protocols.
When using the proposed method, some observations must be taken into account. Firstly, the direct measure approach should always be given priority over online databases. This means that taking measures directly from subjects provides more versatility to the method and its results. In addition, the use of data is incredibly critical, which is why cloud computing is included in the method when working with real-time diagnosis. However, constructing a database from direct readings appears to be the best approach for data gathering. Continuing with the analysis, the multilayer classification proves to be enough, although it depends on the emotional goal and the performance of the classification.
In addition, one of the main observations obtained from this research is the fact that the implementation of social sustainability has a severe bias, or at least the implementation in this specific case. Based on previous sections, the NOM-035 exists to protect the wellbeing of the workers, specifically in terms of emotional sustainability. Based on the common method of professional analysis, the validation of emotional sustainability in the company affirms that the most emotionally effected employees were in the administrative area, which is considered to have a higher workload (9 h approx.). At the same time, the institution affirmed that teachers had a lower emotional load, due the fact they change classrooms and move around the institute getting fresh air and walking. However, the technological analysis leads to the opposite conclusion, which agreed with the answers provided by the personnel. In consequence, the institution had to change the protocols for emotional sustainability among the teaching area personnel. In addition, mass connectivity proves to be a critical factor due to the increase in complexity and the inability to unplug from the working setting. Curiously, the teaching personnel mentioned were seriously affected by this aspect of mass connectivity, especially by the pressure of their students more than the institution itself.
Author Contributions
Conceptualization, F.A.R.-C., A.G.-V. and I.J.C.P.-O.; Methodology, F.A.R.-C. and A.G.-V.; Software, F.A.R.-C.; Validation, L.C.M.-G. and L.A.R.-P.; Formal Analysis, F.A.R.-C. and L.C.M.-G.; Investigation, F.A.R.-C., A.G.-V. and I.J.C.P.-O.; Resources, L.C.M.-G. and I.J.C.P.-O.; Data Curation, F.A.R.-C. and I.J.C.P.-O.; Writing—Original Draft Preparation, F.A.R.-C., A.G.-V. and I.J.C.P.-O.; Writing—Review & Editing, F.A.R.-C., A.G.-V., I.J.C.P.-O., L.C.M.-G. and L.A.R.-P.; Visualization, L.C.M.-G. and L.A.R.-P.; Supervision, I.J.C.P.-O., L.C.M.-G. and L.A.R.-P.; Project Administration, F.A.R.-C. and I.J.C.P.-O.; Funding Acquisition, F.A.R.-C. and I.J.C.P.-O. All authors have read and agreed to the published version of the manuscript.
Funding
This research received funding as part of the main author’s scholarship given by the National Council for Science and Technology.
Data Availability Statement
Not applicable.
Conflicts of Interest
The authors declare no conflict of interest.
References
- Eizenberg, E.; Jabareen, Y. Social sustainability: A new conceptual framework. Sustainability 2017, 9, 68. [Google Scholar] [CrossRef]
- Amrutha, V.N.; Geetha, S.N. A systematic review on green human resource management: Implications for social sustainability. J. Clean. Prod. 2020, 247, 119131. [Google Scholar] [CrossRef]
- Jamwal, A.; Agrawal, R.; Sharma, M.; Kumar, V.; Kumar, S. Developing A sustainability framework for Industry 4.0. Procedia CIRP 2021, 98, 430–435. [Google Scholar] [CrossRef]
- Krachtt, N. The Workforce Implications of Industry 4.0: Manufacturing Workforce Strategies to Enable Enterprise Transformation. 2018. Available online: https://minds.wisconsin.edu/bitstream/handle/1793/78886/Krachtt,%20Noah.pdf?sequence=1 (accessed on 24 November 2022).
- Kumar, P.; Garg, S.; Garg, A. Assessment of Anxiety, Depression and Stress using Machine Learning Models. Procedia Comput. Sci. 2020, 171, 1989–1998. [Google Scholar] [CrossRef]
- Gross, E. Work, organization and stress. Soc. Stress 2017, 3, 54–110. [Google Scholar] [CrossRef]
- Madero Gómez, S.; Ortiz Mendoza, O.E.; Ramírez, J.; Olivas-Luján, M.R. Stress and myths related to the COVID-19 pandemic’s effects on remote work. Manag. Res. 2020, 18, 401–420. [Google Scholar] [CrossRef]
- Oztemel, E.; Gursev, S. Literature review of Industry 4.0 and related technologies. J. Intell. Manuf. 2020, 31, 127–182. [Google Scholar] [CrossRef]
- Badri, A.; Boudreau-Trudel, B.; Souissi, A.S. Occupational health and safety in the industry 4.0 era: A cause for major concern? Saf. Sci. 2018, 109, 403–411. [Google Scholar] [CrossRef]
- Amin, M.R.; Wickramasuriya, D.S.; Faghih, R.T. A Wearable Exam Stress Dataset for Predicting Grades using Physiological Signals. In Proceedings of the 2022 IEEE Healthcare Innovations and Point of Care Technologies (HI-POCT), Houston, TX, USA, 10–11 March 2022; IEEE: Piscataway, NJ, USA, 2022; pp. 30–36. [Google Scholar]
- Kalliomaki, J.; Brodda Jansen, G. Development of a Chronic Stress Diagnosis. J. Rehabil. Med. 2021, 4, 4–6. [Google Scholar] [CrossRef]
- Sioni, R.; Chittaro, L. Stress Detection Using Wearable Physiological Sensors. Artif. Comput. Biol. Med. Lect. Notes Comput. Sci. 2015, 360, 526–532. [Google Scholar] [CrossRef]
- Roldan, F.A.; Perez, I.J.; Ochoa, C. Clinical Diagnosis of Chronic Stress Using Bio-Signals Within the Framework of Industrial Revolution 4.0. In Proceedings of the 10th Annual World Conference of the Society for Industrial and Systems Engineering, Virtual, 23–24 September 2021; pp. 180–187. [Google Scholar]
- Ngiam, K.Y.; Khor, I.W. Big data and machine learning algorithms for health-care delivery. Lancet Oncol. 2019, 20, e262–e273. [Google Scholar] [CrossRef] [PubMed]
- Hamet, P.; Tremblay, J. Artificial intelligence in medicine. Metabolism 2017, 69, S36–S40. [Google Scholar] [CrossRef] [PubMed]
- Park, S.T.; Kim, D.Y.; Li, G. An analysis of environmental big data through the establishment of emotional classification system model based on machine learning: Focus on multimedia contents for portal applications. Multimed. Tools Appl. 2020, 86, 34459–34477. [Google Scholar] [CrossRef]
- Shin, J.; Maeng, J.; Kim, D.H. Inner Emotion Recognition Using Multi Bio-Signals. In Proceedings of the 2018 IEEE International Conference on Consumer Electronics-Asia (ICCE-Asia), JeJu, Republic of Korea, 24–26 June 2018; IEEE: Piscataway, NJ, USA, 2018; pp. 206–212. [Google Scholar] [CrossRef]
- Van Acker, B.B.; Conradie, P.; Vlerick, P.; Saldien, J. Employee acceptability of wearable mental workload monitoring in industry 4.0: A pilot study on motivational and contextual framing. In Proceedings of the Design Society International Conference on Engineering Design (ICED), Delft University of Technology, Delft, The Netherlands, 5–8 August 2019; pp. 2101–2109. [Google Scholar] [CrossRef]
- Panicker, S.S.; Gayathri, P. A survey of machine learning techniques in physiology based mental stress detection systems. Biocybern. Biomed. Eng. 2019, 39, 444–469. [Google Scholar] [CrossRef]
- Zhang, J.; Yin, Z.; Chen, P.; Nichele, S. Emotion recognition using multi-modal data and machine learning techniques: A tutorial and review. Inf. Fusion 2020, 59, 103–126. [Google Scholar] [CrossRef]
- Londhe, S.; Borse, R. Emotion Recognition Based on Various Physiological Signals—A Review. ICTACT J. Commun. Technol. 2018, 9, 1815–1822. [Google Scholar] [CrossRef]
- Acharya, D.; Billimoria, A.; Srivastava, N.; Goel, S.; Bhardwaj, A. Emotion recognition using fourier transform and genetic programming. Appl. Acoust. 2020, 164, 107260. [Google Scholar] [CrossRef]
- Xing, W.; Bei, Y. Medical Health Big Data Classification Based on KNN Classification Algorithm. IEEE Access 2020, 8, 28808–28819. [Google Scholar] [CrossRef]
- Abtahi, F.; Ro, T.; Li, W.; Zhu, Z. Emotion Analysis Using Audio/Video, EMG and EEG: A Dataset and Comparison Study. In Proceedings of the 2018 IEEE Winter Conference on Applications of Computer Vision (WACV), Lake Tahoe, NV, USA, 12–15 January 2018; pp. 10–19. [Google Scholar] [CrossRef]
- Katarya, R.; Yadav, A. A comparative study of genetic algorithm in sentiment analysis. In Proceedings of the 2018 2nd International Conference on Inventive Systems and Control (ICISC), Coimbatore, India, 19–20 January 2018; IEEE: Piscataway, NJ, USA, 2018; pp. 136–141. [Google Scholar] [CrossRef]
- Alam, R.; Abedin, F.; Moon, I.L.; Talukder, A.; Hong, C.S. Healthcare IoT-based Affective State Mining Using a Deep Convolutional Neural Network. IEEE Access 2019, 7, 75189–75202. [Google Scholar] [CrossRef]
- Al-Shargie, F. Multilevel Assessment of Mental Stress using SVM with ECOC: An EEG Approach. Med. Biol. Eng. Comput. 2019, 56, 1–19. [Google Scholar] [CrossRef]
- Manjunath, P. Predictive Analysis of Student Stress Level using Machine Learning. Int. J. Eng. Res. Technol. 2021, 9, 76–80. [Google Scholar]
- Ng, H.W.; Nguyen, V.D.; Vonikakis, V.; Winkler, S. Deep learning for emotion recognition on small datasets using transfer learning. In Proceedings of the 2015 ACM on International Conference on Multimodal Interaction; Association for Computing Machinery: New York, NY, USA, 2015; pp. 443–449. [Google Scholar] [CrossRef]
- Liu, M.; Fan, D.; Zhang, X.; Gong, X. Human Emotion Recognition Based on Galvanic Skin Response Signal Feature Selection and SVM. In Proceedings of the 2016 International Conference on Smart City and Systems Engineering (ICSCSE), Hunan, China, 25–26 November 2016; IEEE: Piscataway, NJ, USA, 2017; pp. 157–160. [Google Scholar] [CrossRef]
- Hassani, S.; Bafadel, I.; Bekhatro, A.; Al Blooshi, E.; Ahmed, S.; Alahmad, M. Physiological signal-based emotion recognition system. In Proceedings of the 2017 4th IEEE International Conference on Engineering Technologies and Applied Sciences (ICETAS), Salmabad, Bahrain, 29 November–1 December 2017; IEEE: Piscataway, NJ, USA, 2018; pp. 1–5. [Google Scholar] [CrossRef]
Disclaimer/Publisher’s Note: The statements, opinions and data contained in all publications are solely those of the individual author(s) and contributor(s) and not of MDPI and/or the editor(s). MDPI and/or the editor(s) disclaim responsibility for any injury to people or property resulting from any ideas, methods, instructions or products referred to in the content. |
© 2023 by the authors. Licensee MDPI, Basel, Switzerland. This article is an open access article distributed under the terms and conditions of the Creative Commons Attribution (CC BY) license (https://creativecommons.org/licenses/by/4.0/).