Article

Change-Point Detection in Homogeneous Segments of COVID-19 Daily Infection

by
Segun Light Jegede
1,2,* and
Krzysztof J. Szajowski
1
1
Faculty of Pure and Applied Mathematics, Wroclaw University of Science and Technology, Wybrzeze Wyspianskiego 27, 50-370 Wroclaw, Poland
2
Department of Mathematical Sciences, Kent State University, Kent, OH 44240, USA
*
Author to whom correspondence should be addressed.
Axioms 2022, 11(5), 213; https://doi.org/10.3390/axioms11050213
Submission received: 20 March 2022 / Revised: 12 April 2022 / Accepted: 29 April 2022 / Published: 4 May 2022

Abstract

:
Modeling the number of individuals in different states is a principal tool in the event of an epidemic. The natural transition of individuals between possible states often includes deliberate interference such as isolation or vaccination. Thus, the mathematical model may need to be re-calibrated due to various factors. The model considered in this paper is the SIRD epidemic model. An additional parameter is the moment of changing the description of the phenomenon when the parameters of the model change and the change is not pre-specified. Detecting and estimating the moment of change in real time is the subject of statistical research. A sequential (online) approach was applied using the Bayesian shift point detection algorithm and trimmed exact linear time. We show how methods of analysis behave in different instances. These methods are verified on simulated data and applied to pandemic data of a selected European country. The simulation is performed with a social network graph to obtain a practical representation ability. The epidemiological data used come from the territory of Poland and concern the COVID-19 epidemic in Poland. The results show satisfactory detection of the moments where the applied model needs to be verified and re-calibrated. These show the effectiveness of the proposed combination of methods.
MSC:
Primary: 92C60; Secondary: 62L15; 92D25

1. Introduction

In probabilistic models, we try to adjust the description in the simplest possible form. This method works well in the case of static phenomena that exhibit some stationarity, defined as a phenomenon whose source remains constant over time. In observations of such a phenomenon, randomness appears as a result of imperfect measurement methods or slight fluctuations in factors illustrating the state of the environment. We expect similar observations by dividing the phenomenon into areas (in time or space) with a homogeneous environment. Violation of homogeneity is a signal that the observed phenomenon has changed significantly. Thus, we would like to know how to detect these invisible changes by observing visible effects. It is an important research aspect that has its methodology. An adequate model of the phenomenon allows for a better short-term and long-term forecast. A correct model in the short term usually needs to be improved for long-term analysis, especially when the change in the phenomenon is sudden. We introduce the concept of change point to standardize such mathematical models.
From the perspective of time, the use of epidemic models (v. [1,2,3,4]) allows the forecasting of the number of daily cases (the intensity of epidemic development) in a short time (v. [5]). The detailed models may be different at a time when immunity in the population emerges only as a result of infection and the lack of a contact restriction policy. A change in the process is also possible due to new mutations (v. [6]). The introduction of contact restrictions and effective vaccination is another example where the appropriate model will be different. Applying a different model may deviate from information about the environment while the change or signal is present in the observed data. This signal may be the deteriorating compliance of the observations with the forecasts as measured by various criteria. The methods of change-point analysis, based on the data, allow the determination of rational criteria for determining the disorder moments.
In Figure 1, for example, with an approximate monthly segmentation, the sequence of infection changes is observed from January 2020 to February 2020, February 2020 to May 2020, May 2020 to August 2020, and August 2020 to early 2021 and then begins to decline. At all these points of trend changes, not predicted by the SIRC model, there are factors that are not properly accounted for in the basic model, and the model used should be changed. Those factors that are not taken into account may include actions taken that are noteworthy and documented for the investigation and control of an epidemic or the emergence of a mutation in the virus. The continuum of pandemic phases Figure 2 can be correlated with Figure 1. Figure 2 presents the four phases of a pandemic. The phases are the inter-pandemic, alert, pandemic and transition. The peak which started from the alert phase to the pandemic phase is caused by the great increase in the average daily cases. In line with the phases are the risk assessments which includes preparing for the subdue of worsening cases, responding and its result, recovery.
The term change point comes from studying detailed manufacturing processes in systems that routinely duplicate certain activities. We know that a correctly implemented production procedure results in high-quality products. The observed quality confirms the correctness of the process; an increase in defectiveness is a signal that the production process has been disordered. Thus, we have the intuition that the change point is a moment where the nature of the process changes. In a sequence of observations, such changes may be due to the abrupt deviation of the probability distribution at some point from what it initially follows. The method of change-point analysis originated in Page [7] by (v. [7,8]). The first approach was proposed to identify a single change point with a known model before and after the disorder. It is more difficult to detect a change point when the model after the change point is unknown (see [9]). The study has progressively been improved by presenting algorithms that can be used to detect several change points in data. These algorithms can be classified into two major groups, offline change point detection algorithms and online change point detection algorithms. The online change point detection algorithms are also known as sequential change-point detection algorithms, which use the cumulative sum method (CUSUM), generalized likelihood ratio, or Shiryayev–Roberts (SR) procedure (v. the monograph of the topic [10]).
To summarize, the subject of this research is to detect and estimate the moment of change in real time. We used the sequential (online) approach. The concept of sequential algorithms is desirable because our data are the daily numbers of infected people. Thus, there is a need to raise some alarms following an observed change. We used algorithms constructed based on Bayesian and purity methods. We demonstrated how to use the algorithms. We tested the algorithms on simulated data before the real-life data. The simulation was performed with a social network graph to obtain a practical representation ability. We used Poland’s COVID-19 data for our real-life test (We use the data on the daily number of COVID-19 infections in the period from January 2020 to early 2021 year in Poland (v. worldometers.info site (https://www.worldometers.info/coronavirus/country/poland/, accessed on 3 April 2021), Figure 1)). Additionally, we make remarks on the correlation of the change-point result with COVID-19 events in Poland.
The rest of the study is structured as follows: Section 2 presents the concept of change-point detection and its paradigms considered in this study. Section 3 presents the selected change-point algorithm that will be used for change-point detection. Section 4 presents the epidemic model for the study, and its parameter estimation. Section 5 presents the simulation procedure and describes the real data. Section 6 presents the results obtained from the application of the algorithms, which includes the simulation results and the real data result.

2. Concept of Change-Point Detection

The incidence of the subject change-point detection has led to the development of novel algorithms in several studies. This has further led to the application of some of these algorithms to data that are defined within their scope of composition. Detecting change points involves searching for the beginning of a new pattern within a given dataset. The method of change-point detection has been widely used for time series modeling [11,12,13] and has been applied to different areas, such as quality control [14], finance [15,16], climate monitoring [17,18], genetics [19,20] and so on. A very simple illustration of change-point detection is the case where we have a piece-wise function plotted as given in Figure 3. The function, f ( x ) can be said to be composed of three different functions—linear function, a ( x ) ; constant function, b ( x ) and linear function, c ( x ) . These functions are defined at the change points A and B, respectively, i.e., a ( x ) = Line OA, b ( x ) = Line AB and c ( x ) =  Line BC.
Suppose that we have a sequence of random variables, x t , with probability distribution function, f t , t = 1 , 2 , . . . , n . The change point detection problem is to determine the point at which there are significant changes in the properties of the dataset. The location of these change points can be denoted by τ = ( τ 0 = 0 , τ 1 , τ 2 , . . . , τ t , τ m + 1 = n ) .
The hypothesis tested by the change-point detection problem is presented as follows:
H 0 : f 1 = f 2 = . . . = f n H 1 : f 1 = f τ 1 f τ 1 + 1 = . . . = f τ 2 f τ 2 + 1 = . . . = f τ m f τ m + 1 = . . . = f n
where
  • 1 = τ 0 < τ 1 < τ 2 < . . . < τ m < τ t = n ;
  • m is the unknown number of change points;
  • τ 1 , τ 2 , . . . , τ m are the change-point locations.
The objectives of the change-point problem can be seen in light of the following points:
  • Quantity Objective: This involves the estimation of the possible number of change points, m, within the data.
  • Location Objective: This involves the identification of the locations of the t change points in the data. This objective was further improved into quantifying the uncertainty in the locations within a confidence interval.
  • Modeling Objective: This is the final objective of the method and it seeks to determine a befitting model for each of the m + 1 segments, i.e., fitting observations lying within the splits that result from each change point.
In past literature, change-point problems have been solved using some basic and defined approaches of statistical and mathematical methods. These approaches include the likelihood ratio (LR) testing, the Cumulative Sum (CUSUM) methods, the Bayesian approach, the Hidden Markov Model (HMM) and the dynamic programming-based methods. The change-point algorithms used in this study are based on the Bayesian approach and the dynamic programming. Thus, the following subsections will discuss these paradigms, including the corresponding algorithm used.

2.1. Bayesian Method of Change-Point Detection

The idea of the Bayesian approach can be easily understood from the concept of Bayesian statistics (cf. Press [21], DeGroot [22]). Bayesian statistics is a theory that is based on the Bayesian interpretation of probability, which expresses the degree of belief in an occurrence based on prior knowledge. The prior knowledge of such an occurrence can greatly influence the degree of belief. The theory is in contrast to the frequentist approach that considers probability to be the relative frequency of the occurrence after a large number of trials. Bayesian statistics generally employs the Bayes theorem (cf. Martz and Waller [23]). The Bayes theorem expresses the conditional probability of an event, A, given that event B is true as (2). A is more similar to a proposition, while B is the evidence. P ( A | B ) is the conditional probability after incorporating news that event B is true.
P ( A | B ) = P ( B | A ) P ( A ) P ( B )
In change-point detection, the Bayesian approach involves placing a prior on the number of change points, m, and their corresponding location. Although this method of specifying priors may appear logical, the priors for the quantity and locations of change points can be jointly defined indirectly by specifying a prior on the length of a segment, and this technique offers computational advantages over specifying two distinct priors [24]. Suppose that we have a series, X, with k segments, and θ k represents the parameter vector for the k t h segment of the series; then, the posterior probability of the set of m change points at locations τ is presented in Equation (3).
P ( m , τ , θ 1 , θ 2 , . . . , θ m + 1 | X , λ , ν 1 , ν 2 , . . . , ν k + 1 ) P ( m | λ ) P ( τ | m ) P ( θ 1 , θ 2 , . . . , θ m + 1 | ν 1 , ν 2 , . . . , ν m + 1 ) P ( X | m , τ , θ 1 , θ 2 , . . . , θ m + 1 ) = P ( m | λ ) { k = 1 m P ( τ k ) } P ( θ 1 , θ 2 , . . . , θ m + 1 | ν 1 , ν 2 , . . . , ν m + 1 ) { k = 1 m + 1 t = τ k 1 + 1 τ k P ( X t | θ k ) }
where
  • k = 1 , . . . , m + 1
  • τ = ( τ 0 = 0 , τ 1 , τ 2 , . . . , τ m , τ m + 1 = n )
  • P ( θ 1 , θ 2 , . . . , θ m + 1 | ν 1 , ν 2 , . . . , ν m + 1 ) is the joint prior of the parameter vectors
  • P ( X | m , τ , θ 1 , θ 2 , . . . , θ m + 1 ) is the likelihood of the given time series and given by Equation (4)
    P ( X | m , τ , θ 1 , θ 2 , . . . , θ m + 1 ) = k = 1 m + 1 t = τ k 1 + 1 τ k P ( X t | θ k )
A typical change-point model which employs this approach is the online change point detection [25], which is one of the main algorithms used in this study. In addition to change-point models, Bayesian approaches based on Markov Chain Monte Carlo (MCMC) have been applied [26,27,28]. When the number of changes is unknown, reversible jump MCMC [29] becomes a useful and typical strategy. It explores the joint space of the model and parameters for a collection of models with varying numbers of change points. The Bayesian approach, as one of the paradigms of change-point detection, with the introduction of Markov chains, led to another paradigm known as the Hidden Markov Models (HMMs) [30]. HMM is comparable in certain aspects to the Bayesian approach. For instance, let the series X be assumed to have a first-order Markov property and hidden segment labels Ξ = Ξ 1 , Ξ 2 , . . . , Ξ n ; the likelihood of X modeled as a HMM is formulated as:
Ξ P ( X , Ξ ) = Ξ i = 1 n P ( X i , Ξ i | Ξ i 1 , X 1 )
In the HMM, work has also been done on calculating the number of hidden states. Further discussion on the online Bayesian change-point detection is presented in Section 3.1.

2.2. Dynamic Programming Method

The dynamic programming method (DPM) was introduced using the concept of log-likelihood. A penalized cost technique can be used to extend the log-likelihood approach to change-point detection to the multiple change-point case. The dynamic programming approach is then used on the penalized cost function to detect changes. Dynamic programming is formulated through an optimization problem such that the likelihood of the series, X i i = 1 , 2 , . . . , n , is used as the cost function, which is minimized. To improve the optimization, a penalized approach can be used. Suppose that we have a change point at τ ; then, the optimization approach is presented in Equation (6)
min 1 τ < n { C ( x 1 : τ ) + C ( x τ + 1 : n ) + ϱ }
C ( x 1 : τ ) + C ( x τ + 1 : n ) + ϱ < C ( x 1 : n )
It is important to note that Equation (6) follows from Equation (7). The penalty, ϱ , is re-defined from the threshold of the likelihood approach [10]. This can be generalized for multiple change-point detection (say m change points) as in Equation (8).
min m , τ 1 : m { i = 1 m + 1 [ C ( x τ i 1 + 1 : τ i ) ] + ϱ }
Equation (8) is unconstrained; it can, however, be solved in a constrained manner as Equation (9) subjected to Equation (10)
Z = min τ 1 : m { i = 1 m + 1 [ C ( x τ i 1 + 1 : τ i ) ] }
subject to
min m ϵ 1 : M { Z + f ( m ) }
where f ( m ) is a chosen penalty term that increases as m increases and can also be a linear function in a form that is similar in a certain respect to the penalized unconstrained minimization approach. Although it might be difficult to know, nevertheless, M is present as the maximum change points in the series.
In Auger and Lawrence [31], the Segment Neighborhood (SN) search method was introduced, directed towards solving the constrained problem (9). The method uses a recursive procedure (13) which links Z m ( x 1 : t ) to Z m 1 ( x 1 : s ) for s < t to find the optimal segmentation in a series by specifying a maximum number of changes, M.
Z m ( x 1 : t ) = min τ { i = 0 m C ( x ( τ i + 1 ) : τ i + 1 ) }
= min τ m { min τ 1 : ( m 1 ) i = 0 m 1 C ( x ( τ i + 1 ) : τ i + 1 ) + C ( x ( τ m + 1 ) : τ m + 1 ) }
= min τ m 1 { Z m ( x 1 : s ) + C ( x ( τ m + 1 ) : τ m + 1 ) }
Similarly, Jackson et al. [32] presented a solution to the penalized optimization problem in (8) by proposing the optimal partitioning (OP) method. The OP method recursively solves Equation (15).
Z ( t ) = min τ ϵ τ * { i = 1 m + 1 [ C ( x τ i 1 + 1 : τ i ) ] + ϱ }
= min s ϵ 0 , . . . , t 1 { Z ( s ) + C ( x ( s + 1 ) : t ) + ϱ }
where τ * is the set of all possible change-point numbers and positions for data segmentation up to time t. The computation cost of the OP method is O ( n 2 ) , and the method is much faster than the SN method, having a computational cost of O ( M n 2 ) . The advantage of the SN is that it can find multiple change points within a range with 1:M changes. Additionally, recent algorithms that use pruning approaches to decrease computations have been developed to address the computational cost of executing dynamic programming algorithms. There are two types of these pruning techniques as used in studies: the inequality-based pruning used for the Pruned Exact Linear Time (PELT) [33] algorithm and the functional pruning used in the Function Pruning Optimal Partitioning (FPOP) algorithm [34]. The aim of pruning is to remove the points that can never be change points during the recursion procedure. The dynamic procedure will be discussed in light of the PELT algorithm later in the study.

3. Change-Point Algorithm

The two main change-point algorithms used in this study are discussed in this section.

3.1. Bayesian Online Change-Point Detection

The study reverts to the Bayesian Online Change-Point Detection (BOCPD) approach presented by Adams and MacKay [25]. The detection algorithm of the BOCPD (Algorithm 1) assumes that the sequence of observation consists of segments resulting from some partition. Thus, the algorithm identifies a change point when the underlying generative model of the observation changes and a new segment surfaces. The approach basically makes use of run length, r t . Suppose that r t is a non-negative discrete variable which represents the length of time until the next change point. This implies that r t = 0 at every change point. The BOCPD algorithm is based on estimating the posterior probability of the current run length, P ( r t | x 1 : t ) , and integrates the underlying predictive model, P ( x t + 1 | r t , x t ( r ) ) , over it. The resulting joint distribution over the observed data and the run length from the posterior probability of the current run length follows the below recursion:
P ( r t , x 1 : t ) = r t 1 P ( r t , r t 1 , x 1 : t )
= r t 1 P ( x t | r t 1 , x r ( r ) ) P ( r t | r t 1 ) P ( r t 1 , x 1 : t 1 )
Now, it becomes possible to compute the joint distribution by computing the predictive distribution over the newly observed data, P ( x t | r t 1 , x r ( r ) ) , and the prior over r t given r t 1 . P ( x t | r t 1 , x r ( r ) ) can be calculated since the new observation only depends on the recent data x t ( r ) . However, the prior over r t given r t 1 , i.e., P ( r t | r t 1 ) , is computed through a hazard function H ( r t 1 ) [ 0 , 1 ] that allows two possible outcomes for r t .
P ( r t | r t 1 ) = H ( r t 1 + 1 ) if r t = 0 1 H ( r t 1 + 1 ) if r t = r t 1 + 1 0 otherwise
This implies that the hazard function implicitly induces a distribution over the period of the segments included in an observation sequence. In the long run, the joint probability will not only help to detect change points but also help to predict future observations. In essence, the marginal predictive distribution is obtained as:
P ( x t + 1 | x 1 : t ) = r t P ( x t + 1 | x t ( r ) , r t ) P ( r t | x 1 : t )
Algorithm 1: BOCPD Algorithm.
Input:  H ( . ) (Hazard function) and Θ p r i o r (Prior hyper-parameters for the observation model)
  1: for each new datum, x t  do
  2:     for  r t 0 to n do▹ Estimate using sufficient statistics
  3:          π t ( r ) = P ( x t | ν t ( r ) , κ t ( r ) )
  4:     end for
  5:     for  r t 1 to n do▹ Compute the growth probabilities
  6:          P ( r t = r t 1 + 1 , x 1 : t ) = r t 1 ( 1 H ( r t 1 ) ) P ( r t 1 , x 1 : t 1 ) π t ( r )
  7:     end for
  8:     for  r t 0 to n do▹ Compute the change-point probabilities
  9:          P ( r t = 0 , x 1 : t ) = P ( r t 1 , x 1 : t 1 ) π t ( r ) H ( r t 1 )
 10:     end for
 11:      P ( r t | x 1 : t ) = P ( r t , x 1 : t ) / P ( x 1 : t ) ▹ Compute the run length distribution
 12:      Θ t 0 = Θ p r i o r ▹ Update sufficient statistics
 13:     for  r t 1 to R do
 14:         Update Θ t r t from Θ t 1 r t 1 and x t + 1
 15:     end for
 16:      P ( x t + 1 | x 1 : t ) = r t P ( x t + 1 | x t ( r ) , r t ) P ( r t | x 1 : t ) ▹ Output prediction
 17: end for

3.2. Pruned Exact Linear Time Algorithm

The Pruned Exact Linear Time (PELT) Algorithm [33] was proposed with the intent of searching how the computational efficiency of the optimal partition (OP) method [32] can be improved through pruning. The pruning is done while ensuring that the global minimum of the cost function is still found. Whilst some methods use the likelihood functions as their cost function, the arguably most used cost function minimization approach for estimating change points is:
min τ ϵ τ * { i = 1 m + 1 [ C ( x τ i 1 + 1 : τ i ) ] + ϱ f ( m ) }
where:
  • C ( . ) is a cost function for a segment;
  • ϱ f ( m ) is a penalty to guard against overfitting.
The OP method was obtained from the equation. For the modification of the OP method to include pruning, the PELT algorithm (Algorithm 2) was proposed through the following theorem:
Theorem 1.
When introducing a change point into a sequence of observations, the cost, C, of the sequence reduces. Mathematically, assume that there is a constant K such that s < t < T ,
C ( x ( s + 1 ) : t ) + C ( x ( t + 1 ) : T ) + K C ( x ( s + 1 ) : T )
Then, if
F ( s ) + C ( x ( s + 1 ) : t ) + K F ( t )
holds, at a future time T > t , s can never be the optimal last change point prior to T.
It is important to note that ϱ has no relationship with the change points, c p ( 0 ) is null at the start and K also relies on Theorem 1.
Algorithm 2: PELT Algorithm.
Input: (a) Set of data, y i ϵ R , i = 1 , . . . , n , (b) a measure of C ( . ) dependent on y i , (c) a penalty constant, β , independent of the change points and (d) a constant K satisfying theorem 1
Output: Change points in c p ( n )
 1: Initialize: F ( 0 ) = β , c p ( 0 ) , R 1 = 0
 2: for τ * 1 to n do
 3:     Calculate  F ( τ * ) = m i n τ ϵ R τ * [ F ( τ ) + C ( y ( τ + 1 ) + τ * ) + β ]
 4:     Let  τ 1 = a r g F ( τ * )
 5:     Set  c p ( τ * ) = [ c p ( τ 1 ) , τ 1 ]
 6:     And  R τ * + 1 = τ ϵ R τ * τ * : F ( τ ) + C ( y ( τ + 1 ) + τ * ) + K F ( τ * )
 7: end for
The cost function we used for the PELT algorithm is discussed in Section 3.3.

3.3. Cost Function and Penalties

The cost function, also known as the loss function or error function, is a function that maps an event or the values of one or more variables into a real number that intuitively represents any “cost” associated with the event in mathematical optimization. In most cases, they are functions that are desired to be minimized. They are a measure of homogeneity and can be classified into either parametric [35] or non-parametric [36]. The concept of cost functions in change-point detection is such that its value is low in segments with no change points and high in segments with change points. Although there are many ways to define costs, they are mostly equal to a loss based on an acceptable likelihood model.
With respect to the PELT algorithm, the method uses a penalized cost function based on the introduction of ϱ f ( m ) . Suppose that a datum is modeled from a normal distribution independently and identical with mean μ and variance σ 2 ; the log-likelihood of the data x ( s + 1 ) : t is
l ( x ( s + 1 ) : t ; μ , σ ) = t s 2 l o g ( σ 2 ) 1 2 σ 2 j = s + 1 t ( y j μ ) 2
The log-likelihood function (23) is used to formulate the cost associated with a segment with respect to the known or unknown case of the mean and the variance.
  • The cost function of a segment specific mean, μ , assuming that the variance, σ 2 , is known and common to all observations, is given by (24).
    C 1 ( x ( s + 1 ) : t ) = ( t s ) l o g ( σ 2 ) + 1 σ 2 j = s + 1 t ( y j 1 t s i = s + 1 t y i ) 2
    The cost function associated with the segment is obtained by performing a minus twice the log-likelihood (23).
  • Similarly, the cost function of a segment specific variance σ 2 , assuming that the mean μ is known and constant for the observation, is given by
    C 2 ( x ( s + 1 ) : t ) = ( t s ) { l o g ( 1 t s j = s + 1 t ( y j μ ) 2 ) + 1 }
  • The cost function of a segment specific mean μ and variance σ 2 is obtained by using minus twice the log-likelihood (23) after maximizing over both μ and σ . The resulting function is given by (26)
    C 3 ( x ( s + 1 ) : t ) = ( t s ) { l o g ( 1 t s j = s + 1 t ( y j 1 t s i = s + 1 t y i ) 2 ) + 1 }
As discussed earlier for the penalized nature of the cost function used in the PELT algorithm, it important to note that the performance of the penalized optimization approach depends on the penalty value, β . Simply put, the choice of the penalty value has a significant effect on the detected changes. Suppose that introducing a change point leads to certain number parameters, denoted by p; most of the literature has considered a penalty based on different criteria for model selection. One of the most used is the Akaike Information Criterion (AIC) [37]. This is an estimator of prediction error; thus, it measures the goodness of fit of an estimated statistical model.
A I C = 2 p 2 ln ( L ^ )
B I C = p ln ( n ) 2 ln ( L ^ )
In addition to p defined as the estimated parameters in the model, let L ^ denote the maximum value of the likelihood function for the model, and the AIC is given in Equation (27). The Bayesian Information Criterion (BIC) [38], also known as the Schwarz Information Criterion (SIC), is another closely used approach to the AIC. The BIC presented in Equation (28) and the AIC both attempt to resolve the problem of overfitting (that is, the problem of increased likelihood while fitting a model due to additional parameters). However, the penalty term is larger in BIC than in AIC. There is a modification of the BIC, MBIC, proposed by Zhang and Siegmund [39]. The MBIC accounts for the length of the segments; although it works well for simulated data, the study by Hocking et al. [40] has shown it to be limited with real-life datasets. The elbow plot approach, which is an adaptive penalty choice, was proposed by Lavielle and Moulines [41]. The method involves sequentially running the optimization problem for different numbers of change points and plotting it against the unpenalized cost; the traditional elbow plot approach is used to select the best segmentation point. This method is similar to that used by Hocking et al. [40], which reported the best segmentation with various numbers of change points, and then used the annotated training data to figure out the best penalty.

4. Secretion of Homogeneous Segments in the Number of Daily Infections

Modeling of infectious diseases is a subject having no depreciating interest in research across its concerned fields, such as mathematics, public health, epidemiology, etc. This results from the ubiquitous prevalence of various diseases occurring among the human race. A prominent example is the current pandemic at the time of writing—the COVID-19 virus. We will discuss the various models for infectious diseases with a focus on the infection rate in this section. We will also discuss two change-point detection algorithms that we will be using with the models.

4.1. Epidemic Model

Epidemic models are a well-known tool for simulating the mechanism by which infectious diseases spread. Several studies have used these models to predict future disease outbreaks, propose methods or strategies to prevent disease outbreaks and assess the efficacy of these methods. The epidemic model can exist in two types, which are stochastic and deterministic. The stochastic model is a model type which allows for random variance in one or more inputs over time to estimate the probability distributions of possible outcomes. On the other hand, the deterministic models involve assigning the population to different groups or sub-groups or compartments. Each compartment represents a specific phase of the epidemic. In addition, the stochastic models are based on chance variations in exposure risk, disease dynamics and other illness dynamics. The transition rates in the deterministic models are expressed mathematically as derivatives. Three common common epidemic models are presented below:
(i)
The SIS Model—the model has two compartments—the susceptible and the infectious. The model flow is presented below:
S u s c e p t i b l e ( S ) I n f e c t i o u s ( I ) S u s c e p t i b l e ( S )
The model compartments result from infections that do not confer any long-lasting immunity—infections such as influenza and the common cold. The differential form of the model is presented as follows:
S ( t ) = β ( t ) S ( t ) I ( t ) N + γ I ( t ) I ( t ) = β ( t ) S ( t ) I ( t ) N γ I ( t )
where
  • S ( t 1 ) = S 1 > 0 , I ( t 1 ) = I 1 > 0
  • β is the average number of contacts per person per time, t.
  • γ is the rate at which people in the infectious compartment become susceptible again.
  • N is assumed to be fixed in this case; thus, N N ( t ) = S ( t ) + I ( t )
(ii)
The SIR Model—the model has three compartments—the susceptible, the infectious and the removed. The model flow is presented below:
S u s c e p t i b l e ( S ) I n f e c t i o u s ( I ) R e m o v e d ( R )
The “removed” compartment of the model accounts for any individual that recovers or dies from the disease. The differential form of the model is presented as follows:
S ( t ) = β ( t ) S ( t ) I ( t ) N I ( t ) = β ( t ) S ( t ) I ( t ) N γ I ( t ) R ( t ) = γ I ( t )
where
  • S ( t 1 ) = S 1 > 0 , I ( t 1 ) = I 1 > 0 , R ( t 1 )
  • β is the average number of contacts per person per time, t.
  • γ is the rate at which people in the infectious compartment are removed.
  • N is assumed to be fixed in this case; thus, N N ( t ) = S ( t ) + I ( t ) + R ( t ) .
(iii)
The SIRD Model—the model is a modification of the SIR model, in which the recovered and the removed (which implies the dead) are separated. Thus, it has four compartments, and the model flow is presented presented below:
S u s c e p t i b l e ( S ) I n f e c t i o u s ( I ) R e c o v e r e d ( R ) D e a t h   o r   R e m o v e d ( D )
The differential form of the model is presented as follows:
S ( t ) = β ( t ) S ( t ) I ( t ) N I ( t ) = β ( t ) S ( t ) I ( t ) N γ I ( t ) ψ I ( t ) R ( t ) = γ I ( t ) D ( t ) = ψ I ( t )
where
  • S ( t 1 ) = S 1 > 0 , I ( t 1 ) = I 1 > 0 , R ( t 1 ) 0
  • β is the average number of contacts per person per time, t.
  • γ is the rate at which people in the infectious compartment recover.
  • ψ is the rate at which people in the infectious compartment are removed (that is, die).
  • N is assumed to be fixed in this case; thus, N N ( t ) = S ( t ) + I ( t ) + R ( t ) + D ( t ) .

4.2. Parameter Estimation

An important parameter that draws the attention of researchers more in the epidemic model lies within the infection compartment from the susceptible compartments. The first basic parameter is the infection rate itself, which is more convenient to be estimated with a time constant population assumption using the method adopted in the study by Wacker and Schluter Wacker and Schlüter [42]. For the purpose of this study, we focus more on the SIRD model. The time discrete formulation of the SIRD model was derived using the finite difference approach such that the approximation
f ( t i + 1 ) f i + 1 f i Δ t = f i + 1 f i
holds for all i 1 , , n since Δ t = 1 . The implication of this is the following equations:
S i + 1 S i = β i + 1 S i + 1 I i + 1 N
I i + 1 I i = β i + 1 S i + 1 I i + 1 N γ i + 1 I i + 1 ψ i + 1 I i + 1
R i + 1 R i = γ i + 1 I i + 1
D i + 1 D i = ψ i + 1 I i + 1
The time varying coefficients sequence is obtained as with the following conditions:
  • if I i + 1 0 , set γ i + 1 = R i + 1 R i I i + 1 and τ i + 1 = D i + 1 D i I i + 1
    if S i + 1 0 , set β i + 1 = N ( S i S i + 1 ) S i + 1 I i + 1
    if S i + 1 = 0 , set β i + 1 = 0
  • if I i + 1 = 0 , set β i + 1 = 0 , γ i + 1 = 0   and   τ i + 1 = 0
The coefficients, γ and τ , are usually assumed to be constant in time; thus, they can be represented with their mean ( γ ¯ and τ ¯ ) or median ( γ ^ and τ ^ ). That is,
ζ ¯ = i = 2 n ζ i
ζ ^ = ζ [ n 2 ] if n is odd ζ [ n 1 2 ] + ζ [ n + 1 2 ] 2 if n is even
where ζ { γ , β } .
Another parameter of interest is the time count of the number of people with the disease, i.e., the infectious compartment. This can be modeled using several approaches, such as the ARIMA time series approach.

5. Simulation Procedure and Real Data Description

The real data for the study will be such that it follows an SIRD epidemic model. Thus, we perform the simulation for the SIRD epidemic model proposed in Section 4. This is because the source of the real-life data contains only the details relating to the infectious, recovered and removed (death) compartment. Using a fixed population figure is a particular limitation of our study. We adopt a network-based simulation to model an epidemic that allows for phase-type transmissibility in a SIRD model; see Figure 4. The network approach allows the real-life explanation of connectivity, which, in this case, allows the contact rate effect, i.e., the average number of contacts per person per time. The network also allows the simulation to be done randomly.
The network algorithm is constructed in a manner such that:
  • The average number of contacts per person per time, β , is random and phase-based.
  • The beta is chosen such that β E x p ( λ ) and λ varies within time intervals. Six different λ s were chosen for λ ; this implies six phases and five known change points in the transmission rate of the decease.
  • Other parameters of the model ( γ and τ ) are fixed based on the assumption in Section 4.2. The choice of these parameters for the simulation is γ = 0.3 and τ = 0.15
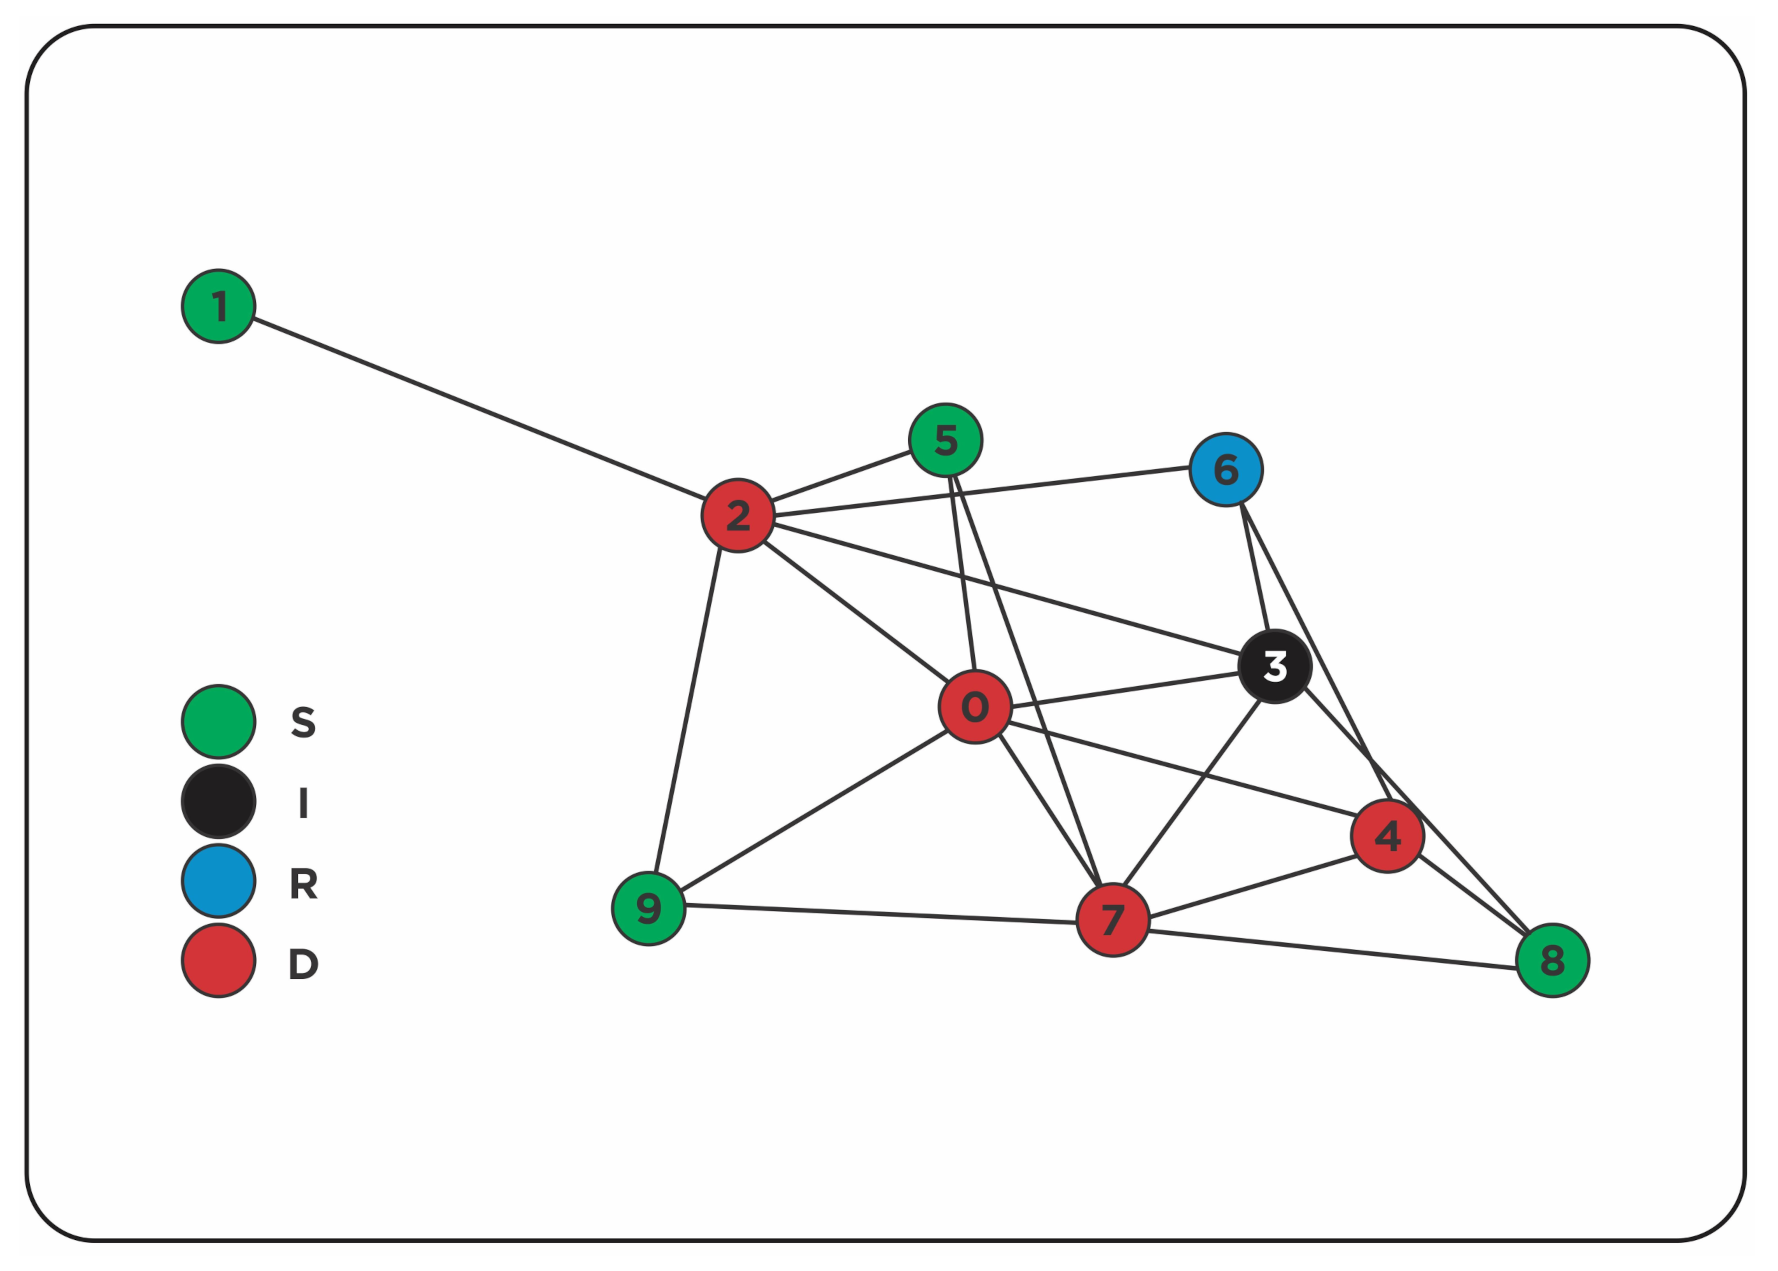
  • The network starts with the whole population as susceptible with a single infection (N = 1000).
  • The disease is only transferable within neighbors of the node with the probability β t at time t.
According to the simulation assumptions, the epidemic model was simulated on a random graph (Figure 5)— G ( N = 1000 , p = 0.02 ) , where N is the number of nodes (that is, N is the population) and p is the probability of an edge connecting to another (that is, it shows the connectivity in society). Algorithm 3 describes how the SIRD simulation was carried out.
Algorithm 3: Network algorithm for the SIRD model.
 1: S 1 = N I 1 , I 1 = 1 , R 1 = 0 , D 1 = 0 ▹ Initialize nodes in the compartments
 2: i = 0
 3: while i < T do
 4:     for node in I t 1  do
 5:        Infect neighbor nodes at rate β t to obtain I t
 6:     for in I t 1  do
 7:        Simultaneously,
 8:         Recover nodes at rate γ to obtain R t
 9:         Remove (death) nodes at rate γ to obtain D t
10:     Check I t R t D t = 0
11:     for node in graph do
12:        if node not in D t :
13:           if node not in R t :
14:             if node not in I t :
15:                put node in S t
16: next i
We used the daily COVID-19 data for Poland from 15th February 2020 to 2nd April 2021. We extracted the data from worldometers.info site (https://www.worldometers.info/coronavirus/country/poland/ (accessed on 3 April 2021)), including a fixed population of Poland since the time discrete approach considered in the estimation of the transmission rate uses a fixed population size. The compartmental plot of Poland’s COVID-19 data is presented in Figure 6. We ignored the susceptible compartment in Figure 6 to improve the visibility of other compartments. The model simulation and parameter estimation were done on Python, while the change-point detection algorithm was implemented using the packages [43] presented by their authors in R. Five different penalties were considered for the PELT algorithm: AIC, BIC/SIC, MBIC, Manual and None. None means no penalty was introduced in the optimization procedure of the algorithm. We use the elbow method for the manual penalty, with the penalty value obtained at 3.5 for both simulated and real data. The result of the simulation and application are discussed in the next section. The change points detected are presented in Appendix A (see Table A1, Table A2, Table A3, Table A4, Table A5, Table A6, Table A7, Table A8, Table A9, Table A10, Table A11, Table A12, Table A13, Table A14 and Table A15).

6. Results and Discussion

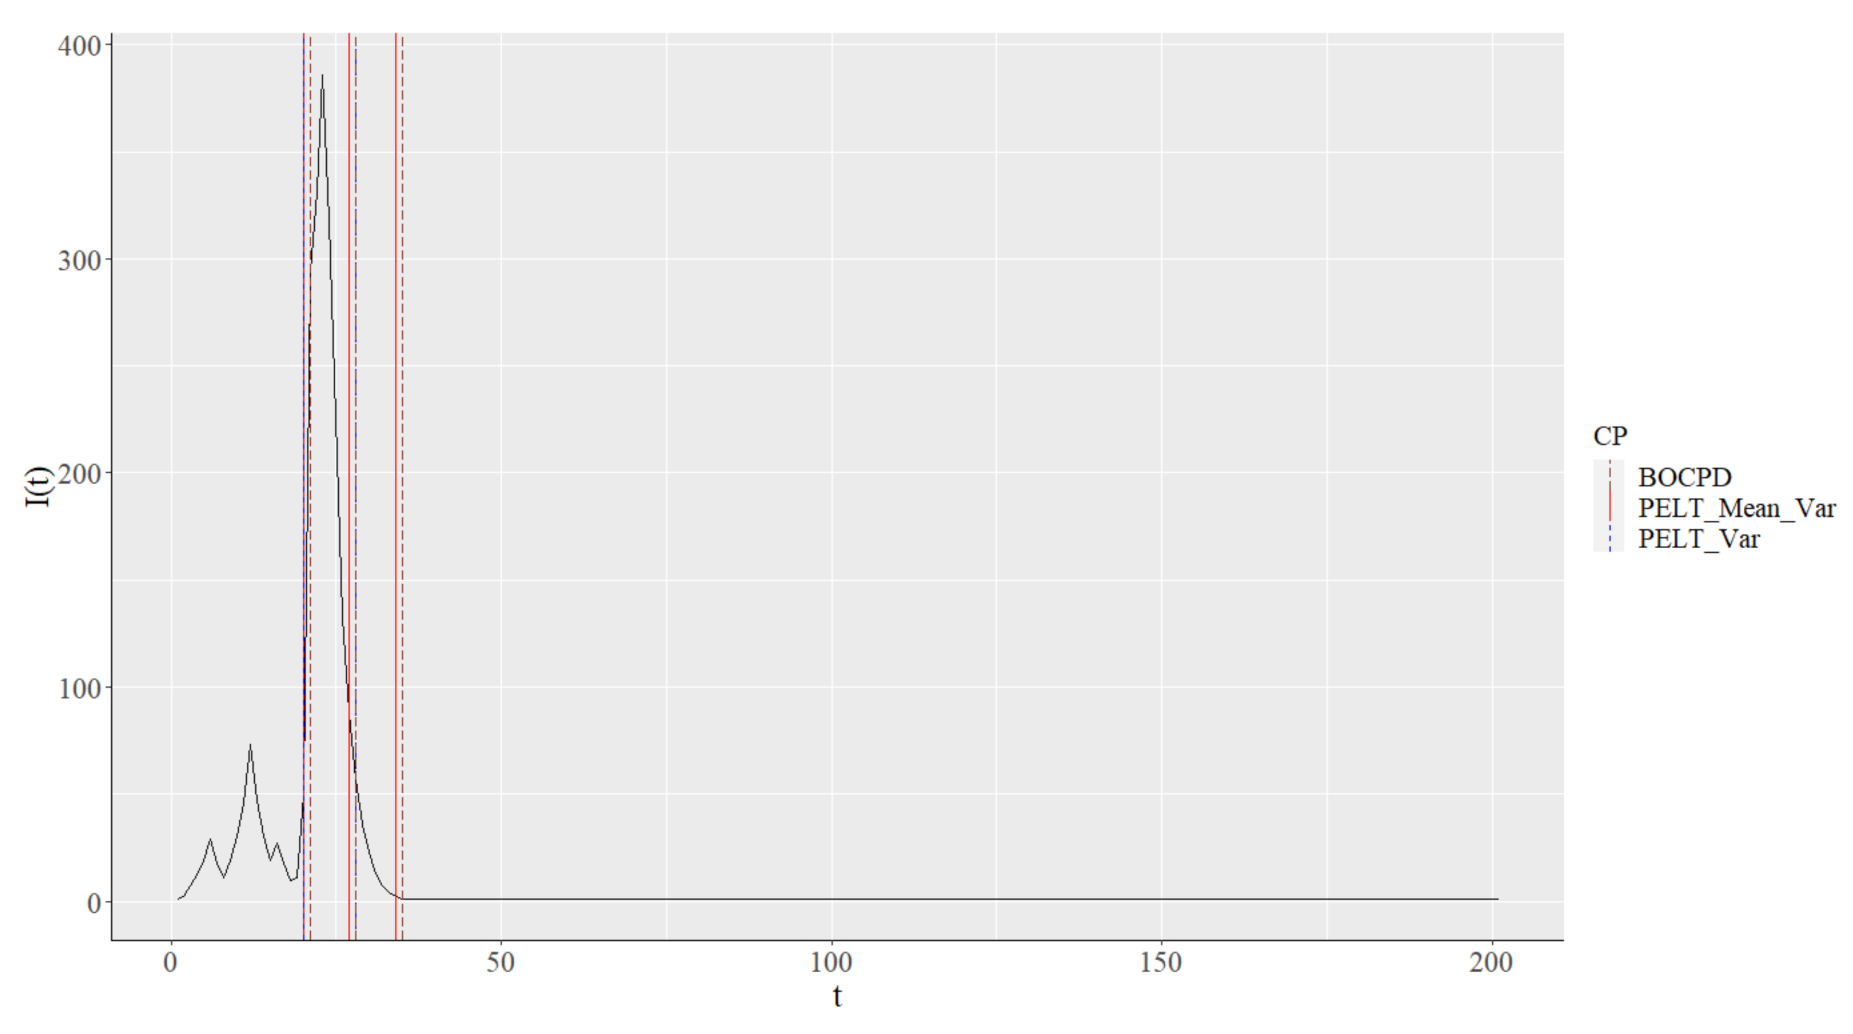
6.1. Simulation Result

Here, the result of the change-point detection algorithm is presented for the simulated data. To illustrate an online approach, both change-point algorithms (PELT and BOCPD) were tested in bits of 20, 30, 50, 100 and 201. It was possible to trace the change-point process of the transmission rate since the rate was self-introduced at time-points 35, 65, 100, 137 and 174.
The two algorithms (BOCPD and PELT) explored were able to properly detect some changes between the transmissibility data after time-point 20. We also discovered that the use of no penalty value results in the discovery of too many change points in the data. This was especially too many for the case of the specific mean penalty function (Function (24)); we detected change points at every time point. The manual approach, i.e., the use of the traditional elbow plot, had the second lowest performance. The AIC and the MBIC penalty function used on either of the specific variance (Function (25)) or specific mean and variance (Function (26)) are preferred for change-point detection in the simulated transmission rate and the infection. Based on the accuracy of the detection algorithm and the number of change points detected, the MBIC penalty function is preferred. Thus, we report the plot for only the MBIC penalty value. Furthermore, a larger sample improves the detection. We can see this in the BOCPD result.
Figure 7 shows the detection location of the BOCPD, specific variance PELT, and specific mean and variance PELT algorithm. The two PELT algorithms have three change points where they coincide (CP at 18, 20 and 99) and the last change point with a difference of one time-point—CP located at time-point 56 for specific variance and 57 for specific mean and variance PELT. These change points are one to two time-points away from the BOCPD change points; BOCPD change points are located at time points 21, 58 and 101. The change points discovered in the transmissible rate by the algorithms are related to the induced change-point locations. For instance, the real change point fixed at the time-point is in the domain of the change point located at time-point 20 for the two PELT algorithms and 21 for the BOCPD. The change point fixed at 65 can be linked with the change point at 56 in the specific variance PELT algorithm, point 57 in the specific mean and variance PELT algorithm and point 58 of the BOCPD. The change point fixed at 100 is detected at 99 for the PELT algorithms and 101 for the BOCPD. Thus, we can conclude that it is difficult to detect the last two fixed change points, i.e., 137 and 174. The reason may be due to a low variation in the segment of the observation containing the change points. It is possible to understand this from the change-point detection involving only the mean with constant variation.
We compare the result from the transmission rate to the daily infection. We discover that the points of detection do not necessarily agree. This effect can be understood from the simulation algorithm of the SIRD model. The disease flows at a specific rate per time but an infected person does not become “double-infected”. A general observation that shows the PELT algorithm detecting changes at a point behind the BOCPD can also be noticed. For instance, the BOCPD detects changes at time-points 21, 28 and 35, while the specific mean and variance PELT algorithm detect changes at time-points 20, 27 and 34. Specific variance PELT has change points located at time-points 20 and 28. The three methods were sensitive enough to detect the end segment of the disease (Figure 8). The issue of variance detection from the transmission rate and the difference in its change-point locations from the daily infection implies that change-point detection that takes variations into account is most needed for a phase-type model such as this.

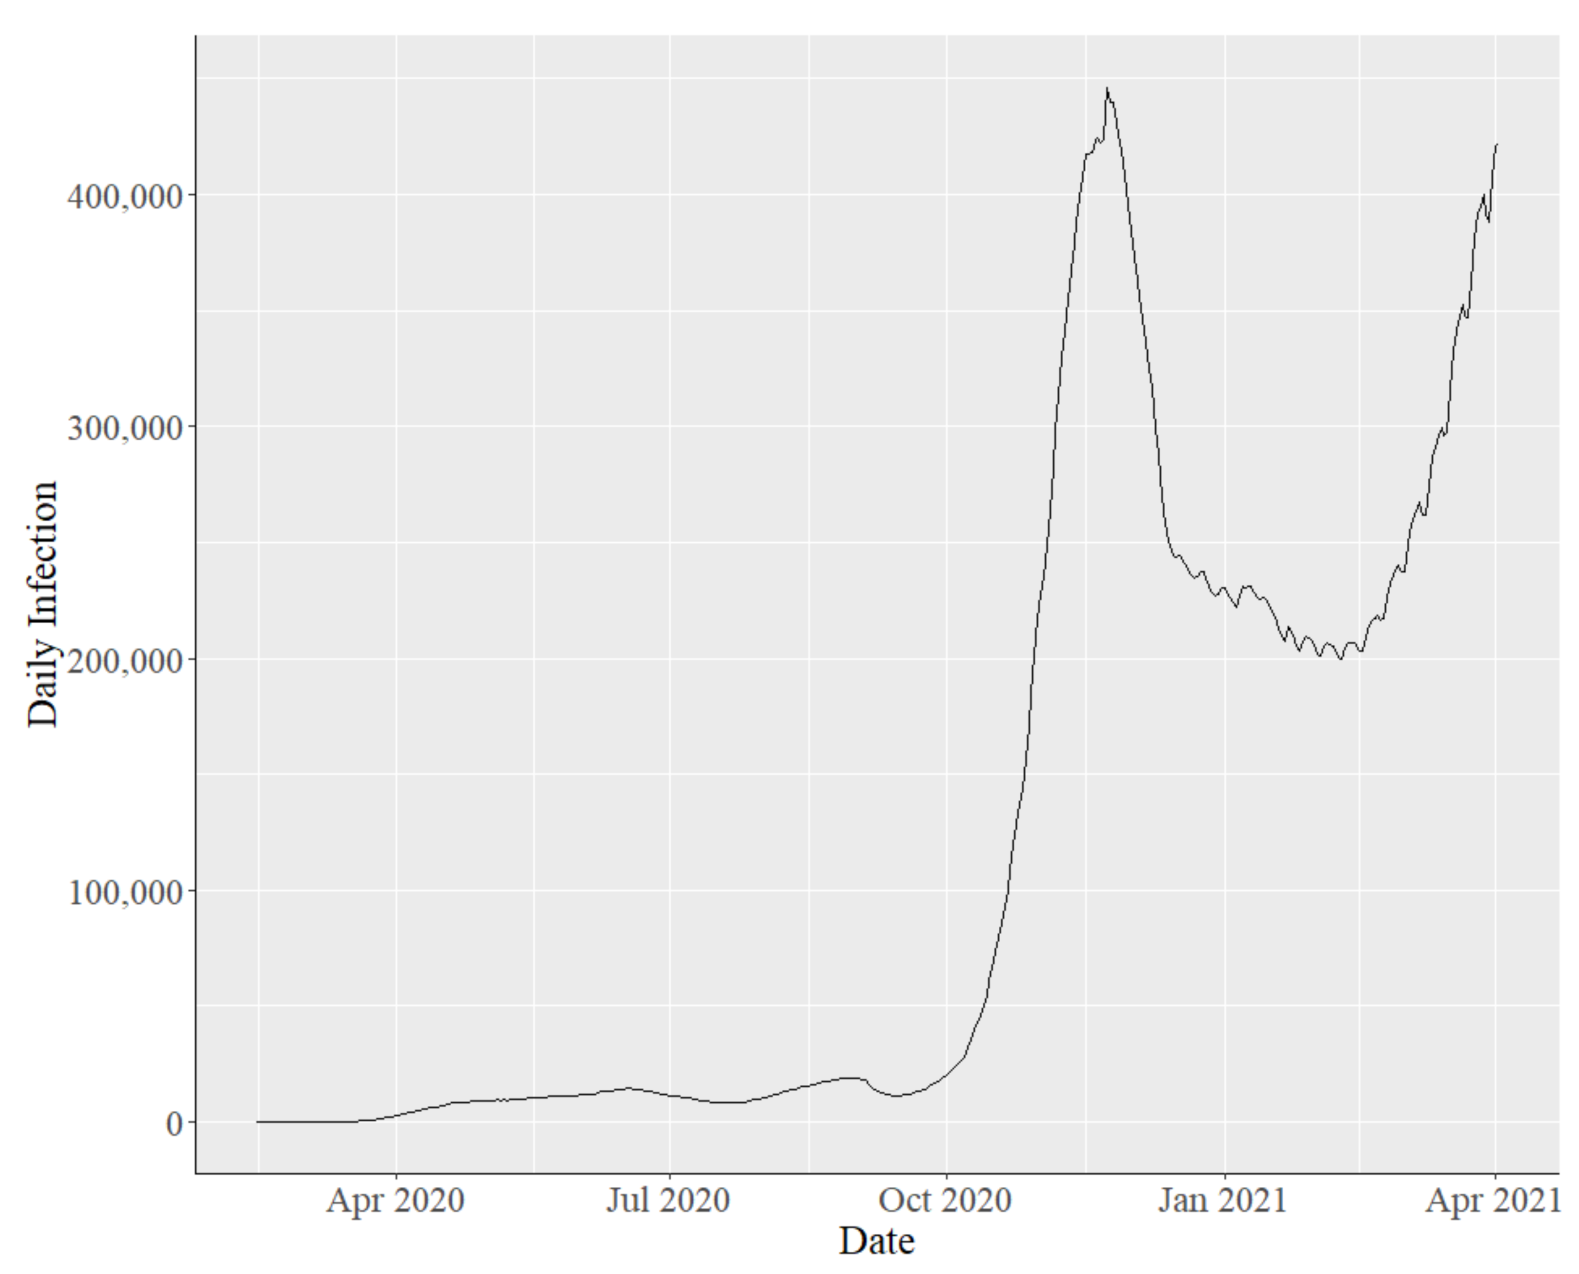
6.2. Change-Point Detection on Real-Life Data

Following the same procedure used to detect change points in the simulated data, we observe similar effects of the change-point algorithms on the transmission rate and daily infection. These include the fact that the specific variance and the specific mean and variance PELT algorithm are preferred based on observations from Figure 9. Specific variance PELT was very sensitive to high variation. In this case, the specific mean and variance PELT appears to be better than other PELT approaches. This is because it could detect abrupt changes in segments with small variations (Figure 9). The plotted algorithms detect almost similar changes till the same time-point (CPs at time-points 18–19, 32–33 and 49–52). After these time-points, the specific variance PELT algorithm could not detect any other changes.
Figure 10 presents the pattern of detecting high and low variation changes as in the transmission rate, which was also observed for the daily infection. However, it is more obvious from Figure 11 that the specific variance PELT detects fewer change points than the other algorithms. It is important to note that choosing highly optimized (specific variance PELT with MBIC) change points does not imply that the other change points detected by other means are not significant. Critically checking these points, we can observe change events surrounding the COVID-19 pandemic. The specific variance PELT with MBIC was selected based on the simulation result. We detect change points at points 264, 300 and 389. These points fall on 4 November 2020, 10 December 2020 and 9 March 2021. The events surrounding these dates are highlighted below:
  • Change point at time-point 264 (4 November 2020): Stricter coronavirus disease (COVID-19) restrictions were announced for Saturday (7 November 2020) by the Polish Prime Minister Mateusz Morawiecki, who also warned that if cases did not become stable, a full lockdown might be introduced in a week to ten days. As a result of the new laws, most retail malls, theaters, museums, galleries and cinemas would close. Students who had not previously worked remotely would be required to do so. Hotel rooms would be available only to business guests. Previously, bars and restaurants had been ordered to close, and the elderly had been advised to remain at home. This was due to the increase in the daily cases.
  • Change point at time-point 298 (10 December 2020): Due to increased disease activity in Poland, authorities planned to strengthen current coronavirus disease (COVID-19) restrictions from 28 December 2020 to at least 17 January 2021. International arrivals were expected to isolate for 10 days, unless they traveled through private means. Additionally, theaters, museums, etc., were closed and hotels were only opened for business purposes. Looking at Figure 10, we observe that a decrease in daily infections was observed around this period; however, the purpose of this declaration can either be traced to the total current infections and/or cumulative infections. The period was also the festive season and the beginning of a new year, which could lead to a high contact rate between people, especially during new year’s eve. The news also indicated that the second wave of COVID-19 started around late December.
  • Change point at time-point 389 (9 March 2021): Another rise in daily COVID-19 infections in Poland; news spread tagged sometime around early March the third wave of COVID-19 in Poland. Health officials tightened COVID-19 entry restrictions for certain travelers on 27 February 2021, while domestic limitations would be extended until at least 14 March 2021. On 20 March 2021, a total lockdown was announced for the whole country of Poland. The new restriction required pupils within the age of 1–3 years to return back to online learning.

7. Conclusions

This work investigates change-point detection algorithms in phase-type signals. The subject of consideration was the epidemic model, which suited the data that we used for the analysis. We used the Suspected, Infected, Recovered and Death (SIRD) model for the study. The main parameter that we were interested in was the mean and the variance of the transmissibility rate and daily infection. The two algorithms used for our analysis were the Bayesian Online Change Point Detection (BOCPD) algorithm and Pruned Exact Linear Time (PELT) algorithm. BOCPD employs the Bayes theorem depending on run length. PELT is an optimization approach to change points with pruning. Since it is possible to run the optimization in the PELT algorithm with different penalty values, we considered five different statistical penalty functions. These included the AIC, BIC/SIC, MBIC, a Manual approach using the elbow method and a null penalty value. The PELT algorithm also permits change-point detection for two parameters of interest: the mean, the variance and the variance and the mean together. We tested the algorithms on simulated data before the real-life data. The simulation was performed with a social network graph to obtain a practical representation ability. We used Poland’s COVID-19 data for our real-life test. Estimating the change points in the simulated transmissibility rate and the daily infection, we discovered that (a) the BOCPD and the PELT algorithm will most likely detect the same change points, probably with a unit time difference; (b) mean detection in the PELT algorithm has poor performance; this implies that the variance or a combination of both parameters for detection is better; (c) the penalty value that optimizes the model parameters well is the MBIC; (d) the change-point location of the transmissibility rate and daily infection is not necessarily the same. As illustrated, we observed the events surrounding the moment of change in the variance PELT algorithm with the MBIC as the penalty value. The three dates detected by this algorithm were 11 November 2020, 10 December 2020 and 9 March 2021. We discovered that the last two dates were the period when the second and third waves of COVID-19 were said to have started in Poland. There was a strict lockdown policy announcement during these periods.

Author Contributions

Conceptualization and methodology, S.L.J. and K.J.S.; choice of software, implementation and code development of the algorithm and numerical simulations, S.L.J.; validation and formal analysis, S.L.J. and K.J.S.; writing—original draft preparation and visualization, S.L.J.; supervision, K.J.S.; project administration, S.L.J.; funding acquisition, K.J.S. All authors have read and agreed to the published version of the manuscript.

Funding

Supported by Wrocław University of Science and Technology, Faculty of Pure and Applied Mathematics, under the project 8211204601 MPK: 9130740000.

Data Availability Statement

The COVID-19 data used in this study were obtained from worldometers.info site (https://www.worldometers.info/coronavirus/country/poland/, accessed on 3 April 2021).

Conflicts of Interest

The authors declare no conflict of interest.

Abbreviations

The following abbreviations are used in this manuscript:
AICAkaike’s Information Criterion (p. 10, cf. [37])
BICBayesian Information Criterion (p. 10, cf. [38])
BOCPDBayesian Online Change-Point Detection (p. 7, cf. [25])
CPChange Point (p. 15)
CUSUMCumulative Sum (p. 3)
DPMDynamic Programming Method (p. 5)
FPOPFunction Pruning Optimal Partitioning (p. 6, cf. [34])
HMMHidden Markov Model (p. 4)
LRLikelihood Ratio (p. 4)
MBICModified Bayesian Information Criterion (p. 10, cf. [39])
OPOptimal Partitioning (p. 6, cf. [32])
PELTPruned Exact Linear Time (p. 6, cf. [33])
SICSchwarz Information Criterion (p. 10, cf. [38])
SIRSusceptible, Infected, Removed (and immune)
or deceased individuals. (p. 10, v. [1,2,3,4]).
SIRCThe SIR model with the additional group of partially resistant to the current
strain people: Susceptible—Infectious—Recovered—Cross-Immune (p. 2, v. page 10).
SIRDThe SIR that contains the D factor—the number of deceased people (p. 10, v. [44,45,46,47]).

Appendix A. Tables

Table A1. PELT Algorithm Result for Simulated Transmissibility Rate.
nPenaltyPELT(Mean)PELT(Variance)PELT(Mean, Variance)
mτmτmτ
20None191, 2, 3, 4, 5, 6,
7, 8, 9, 10, 11,12,
13, 14,15, 16, 17,
18, 19
82, 5, 7, 9, 11,
14, 16, 18
82, 5, 7, 9, 11,
13, 15, 18
SIC, BIC12011852, 5, 7, 9, 18
MBIC12011822, 18
AIC12011862, 5, 7, 11, 14, 18
Manual12011882, 5, 7, 9, 11,
13, 15, 18
30None291, 2, 3, 4, 5, 6,
7, 8, 9, 10, 11,
12, 13, 14, 15, 16,
17, 18, 19, 20, 21,
22, 23, 24, 25, 26,
27, 28, 29
122, 5, 7, 9, 11,
14, 16, 18, 20,
23, 25, 27
132, 5, 7, 9, 11, 13,
15, 18, 20, 22,
24, 26, 28
SIC, BIC130218, 2042, 5, 18, 20
MBIC130218, 2032, 18, 20
AIC130218, 2072, 5, 7, 11, 14,
18, 20
Manual130218, 20102, 5, 7, 9, 11, 13,
15, 18, 21, 24
* means each time point was detected as a change point; *** means change points detected are more than 40.
Table A2. PELT Algorithm Result for Simulated Transmissibility Rate.
nPenaltyPELT(Mean)PELT(Variance)PELT(Mean, Variance)
mτmτmτ
50None49***222, 5, 7, 9, 11,
14, 16, 18, 20,
23, 25, 27, 29,
31, 33, 35, 37,
39, 41, 44, 46,
48
222, 5, 7, 9, 11,
13, 15, 18, 20,
22, 24, 26, 28,
30, 32, 35, 37,
39, 41, 43, 45,
47
SIC, BIC150218, 2032, 18, 20
MBIC150218, 2032, 18, 20
AIC150218, 20102, 5, 7, 11,
14, 18, 20, 32,
35, 37
Manual150218, 20172, 5, 7, 9, 11,
13, 15, 18, 21,
24, 32, 35, 37,
39, 41, 45, 47
100None99***43***44***
SIC, BIC110017142, 18, 20, 57
MBIC1100171318, 20, 57
AIC1100619, 21, 24, 58,
74, 77
202, 5, 7, 11,
14, 18, 20, 32,
35, 37, 39, 52,
54, 56, 72, 75,
77, 79, 93, 95
Manual1100819, 21, 24, 58,
74, 77, 79, 84
362, 5, 7, 9, 11,
13, 15, 18, 21,
24, 32, 35, 37,
39, 41, 45, 47,
51, 54, 56, 59,
62, 66, 68, 70,
72, 75, 77, 79,
81, 84, 88, 91,
93, 95, 98
201None200***86***88***
SIC, BIC1201418, 20, 56, 9962, 18, 20, 57,
99, 111
BIC1201418, 20, 56, 9962, 18, 20, 57,
99, 111
MBIC1201418, 20, 56, 99418, 20, 57, 99
AIC12011118, 20, 56, 72, 75,
77, 80, 84, 93,
95, 99
51***
Manual12011318, 20, 56, 72,
75, 77, 80, 84,
93, 95, 99, 111,
114
70***
* means each time point was detected as a change point; *** means change points detected are more than 40.
Table A3. PELT Algorithm Result for Simulated Infection.
nPenaltyPELT(Mean)PELT(Variance)PELT(Mean, Variance)
mτmτmτ
20None19*82, 4, 6, 8,
10, 13, 15, 17
82, 4, 6, 9,
11, 13, 16, 18
SIC, BIC172, 3, 4, 5, 6, 7, 8,
9, 10, 11, 12, 13,
14, 15, 16, 17, 19
12022, 9
MBIC172, 3, 4, 5, 6, 7, 8,
9, 10, 11, 12, 13,
14, 15, 16, 17, 19
12012
AIC172, 3, 4, 5, 6, 7, 8,
9, 10, 11, 12, 13,
14, 15, 16, 17,19
44, 10, 13, 1752, 4, 10, 13,
17
Manual172, 3, 4, 5, 6, 7, 8,
9, 10, 11, 12, 13,
14, 15, 16, 17, 19
44, 10, 13, 1762, 4, 10, 13,
16, 18
30None29*132, 4, 6, 9, 11,
13, 16, 18, 20,
22, 24, 26, 28
132, 4, 6, 9, 11,
13, 15, 17, 19,
21, 24, 26, 28
SIC, BIC272, 3, 4, 5, 6, 7, 8,
9, 10, 11, 12, 13,
14, 15, 16, 17, 19,
20, 21, 22, 23, 24,
25, 26, 27, 28, 29
220, 2542, 9, 20, 25
MBIC272, 3, 4, 5, 6, 7, 8,
9, 10, 11, 12, 13,
14, 15, 16, 17, 19,
20, 21, 22, 23, 24,
25, 26, 27, 28, 29
12032, 20, 25
AIC272, 3, 4, 5, 6, 7, 8,
9, 10, 11, 12, 13,
14, 15, 16, 17, 19,
20, 21, 22, 23, 24,
25, 26, 27, 28, 29
220, 2582, 4, 10, 13,
17, 19, 25, 28
Manual272, 3, 4, 5, 6, 7, 8,
9, 10, 11, 12, 13,
14, 15, 16, 17, 19,
20, 21, 22, 23, 24,
25, 26, 27, 28, 29
220, 25102, 4, 10, 13,
17, 19, 21, 24,
26, 28
* means each time point was detected as a change point; *** means change points detected are more than 40.
Table A4. PELT Algorithm Result for Simulated Infection.
nPenaltyPELT(Mean)PELT(Variance)PELT(Mean, Variance)
mτmτmτ
50None341, 2, 3, 4, 5, 6,
7, 8, 9, 10, 11,
12, 13, 14, 15,
16, 17, 18, 19,
20, 21, 22, 23,
24, 25, 26, 27,
28, 29, 30, 31,
32, 33, 34
172, 4, 6, 9, 12,
14, 16, 18, 20,
23, 25, 27, 29,
31, 33, 35, 42
212, 4, 6, 9, 11,
13, 15, 17, 19,
21, 24, 26, 28,
30, 32, 34, 36,
38, 40, 45, 47
SIC, BIC302, 3, 4, 5, 6, 7,
8, 9, 10, 11,
12, 13, 14, 15,
16, 17, 19, 20,
21, 22, 23, 24,
25, 26, 27, 28,
29, 30, 31, 33
220, 2552, 20, 25, 30,
34
MBIC302, 3, 4, 5, 6, 7,
8, 9, 10, 11,
12, 13, 14, 15,
16, 17, 19, 20,
21, 22, 23, 24,
25, 26, 27, 28,
29, 30, 31, 33
220, 25420, 25, 30, 34
AIC312, 3, 4, 5, 6, 7,
8, 9, 10, 11,
12, 13, 14, 15,
16, 17, 19, 20,
21, 22, 23, 24,
25, 26, 27, 28,
29, 30, 31, 32,
33
220, 25102, 4, 10, 13,
17, 19, 25, 28,
31, 34
Manual312, 3, 4, 5, 6, 7,
8, 9, 10, 11,
12, 13, 14, 15,
16, 17, 19, 20,
21, 22, 23, 24,
25, 26, 27, 28,
29, 30, 31, 32,
33
220, 25132, 4, 10, 13,
17, 19, 21, 24,
26, 28, 30, 32,
34
* means each time point was detected as a change point; *** means change points detected are more than 40.
Table A5. PELT Algorithm Result for Simulated Infection.
nPenaltyPELT(Mean)PELT(Variance)PELT(Mean, Variance)
mτmτmτ
100None341, 2, 3, 4, 5,
6, 7, 8, 9, 10,
11, 12, 13, 14,
15, 16, 17, 18,
19, 20, 21, 22,
23, 24, 25, 26,
27, 28, 29, 30,
31, 32, 33, 34
342, 4, 6, 8, 10,
13, 15, 17, 20,
22, 24, 26, 28,
30, 32, 34, 38,
42, 46, 52, 54,
59, 62, 65, 68,
71, 74, 77, 80,
83, 86, 89, 92,
95
392, 4, 6, 9, 11,
13, 15, 17, 19,
21, 24, 26, 28,
30, 32, 34, 36,
38, 40, 45, 47,
49, 53, 56, 59,
62, 65, 68, 71,
74, 77, 80, 83,
86, 90, 92, 94,
96, 98
SIC, BIC302, 3, 4, 5, 6,
7, 8, 9, 10, 11,
12, 13, 14, 15,
16, 17, 19, 20,
21, 22, 23, 24,
25, 26, 27, 28,
29, 30, 31, 33
220, 2752, 20, 25, 30,
34
MBIC292, 4, 5, 6, 7,
8, 9, 10, 11,
12, 13, 14, 15,
16, 17, 19, 20,
21, 22, 23, 24,
25, 26, 27, 28,
29, 30, 31, 33
220, 27320, 27, 34
AIC312, 3, 4, 5, 6, 7,
8, 9, 10, 11, 12,
13, 14, 15, 16, 17,
19, 20, 21, 22, 23,
24, 25, 26, 27, 28,
29, 30, 31, 32, 33
220, 27102, 4, 10, 13,
17, 19, 25, 28,
31, 34
Manual312, 3, 4, 5, 6, 7,
8, 9, 10, 11, 12,
13, 14, 15, 16, 17,
19, 20, 21, 22, 23,
24, 25, 26, 27, 28,
29, 30, 31, 32, 33
64, 10, 13, 17,
20, 27
132, 4, 10, 13,
17, 19, 21, 24,
26, 28, 30, 32,
34
201None341, 2, 3, 4, 5, 6,
7, 8, 9, 10, 11,
12, 13, 14, 15, 16,
17, 18, 19, 20, 21,
22, 23, 24, 25, 26,
27, 28, 29, 30, 31,
32, 33, 34
192, 4, 6, 9, 11,
13, 15, 17, 19,
21, 24, 26, 28,
30, 32, 34, 37,
72, 74
72***
* means each time point was detected as a change point; *** means change points detected are more than 40.
Table A6. PELT Algorithm Result for Simulated Infection.
nPenaltyPELT(Mean)PELT(Variance)PELT(Mean, Variance)
mτmτmτ
201SIC, BIC302, 3, 4, 5, 6,
7, 8, 9, 10, 11,
12, 13, 14, 15,
16, 17, 19, 20,
21, 22, 23, 24,
25, 26, 27, 28,
29, 30, 31, 33
220, 28420, 25, 30, 34
MBIC292, 4, 5, 6, 7,
8, 9, 10, 11, 12,
13, 14, 15, 16,
17, 19, 20, 21,
22, 23, 24, 25,
26, 27, 28, 29,
30, 31, 33
220, 28320, 27, 34
AIC312, 3, 4, 5, 6,
7, 8, 9, 10, 11,
12, 13, 14, 15,
16, 17, 19, 20,
21, 22, 23, 24,
25, 26, 27, 28,
29, 30, 31, 32,
33
59, 16, 19, 26,
29
102, 4, 10, 13,
17, 19, 25, 28,
31, 34
Manual312, 3, 4, 5, 6,
7, 8, 9, 10, 11,
12, 13, 14, 15,
16, 17, 19, 20,
21, 22, 23, 24,
25, 26, 27, 28,
29, 30, 31, 32,
33
59, 16, 19, 26,
29
132, 4, 10, 13, 17,
19, 21, 24, 26,
28, 30, 32, 34
* means each time point was detected as a change point; *** means change points detected are more than 40.
Table A7. BOCPD Algorithm Result for Simulated Transmissibility Rate and Infection.
n β I ( t )
m τ m τ
201191*
30121121
50121321,28,35
100221, 58, 10010021,28,36
201321, 58, 101321,28,37
* means each time point was detected as a change point; *** means change points detected are more than 40.
Table A8. BOCPD Algorithm Result for Poland’s COVID-19 Transmissibility Rate and Infection.
n β I ( t )
m τ m τ
20119119
30119219, 21
50219, 33419, 21, 31, 41
100419, 33, 52, 66719, 21, 31, 41, 53, 65, 81
200619, 33, 52, 66, 116, 1531319, 21, 31, 41, 53, 65, 81,
97, 114, 134, 146, 171, 188
4131019, 33, 52, 66, 116, 153,
223, 269, 284, 383
2419, 21, 31, 41, 53, 65, 81, 97,
114, 134, 146, 171, 188, 205,
224, 237, 246, 258, 272, 292,
304, 339, 376, 398
* means each time point was detected as a change point; *** means change points detected are more than 40.
Table A9. PELT Algorithm Result for Poland’s COVID-19 Transmissibility Rate.
nPenaltyPELT(Mean)PELT(Variance)PELT(Mean, Variance)
mτmτmτ
20None218, 1942, 6, 12, 1842, 9, 13, 18
SIC, BIC120118118
MBIC120118118
AIC120118118
Manual120118118
30None1218, 19, 20, 21,
22, 23, 24, 25,
26, 27, 28, 29
810, 12, 14, 18,
21, 24, 26, 28
92, 9, 13, 18,
20, 22, 24, 26,
28
SIC, BIC130218, 21218, 21
MBIC130130218, 21
AIC130218, 21218, 21
Manual130218, 21218, 21
50None3218, 19, 20, 21,
22, 23, 24, 25,
26, 27, 28, 29,
30, 31, 32, 33,
34, 35, 36, 37,
38, 39, 40, 41,
42, 43, 44, 45,
46, 47, 48, 49
172, 5, 7, 12, 18,
21, 24, 26, 29,
32, 34, 36, 38,
41, 44, 46, 48
172, 9, 13, 18,
20, 22, 24, 26,
28, 30, 32, 34,
36, 39, 41, 44,
47
SIC, BIC150318, 21, 32418, 21, 32, 39
MBIC150132418, 21, 32, 39
AIC150518, 21, 32, 36, 41618, 21, 32, 36,
38, 43
Manual150518, 21, 32, 36, 41918, 21, 30, 32, 36,
39, 41, 44, 47
100None82***413, 5, 7, 9, 13,
15, 18, 21, 24,
26, 29, 32, 34,
36, 39, 41, 44,
47, 49, 51, 53,
55, 57, 60, 62,
65, 67, 69, 71,
73, 75, 77, 79,
81, 83, 86, 88,
91, 93, 95, 98
412, 9, 13, 18,
20, 22, 24, 26,
28, 30, 32, 34,
36, 39, 41, 44,
47, 49, 51, 53,
55, 57, 60, 62,
65, 67, 69, 71,
73, 75, 77, 79,
81, 83, 85, 87,
89, 91, 93, 95,
98
SIC, BIC1100218, 32818, 21, 32, 39,
53, 55, 57, 65
MBIC1100218, 32518, 21, 36, 53,
65
* means each time point was detected as a change point; *** means change points detected are more than 40.
Table A10. PELT Algorithm Result for Poland’s COVID-19 Transmissibility Rate.
nPenaltyPELT(Mean)PELT(Variance)PELT(Mean, Variance)
mτmτmτ
100AIC1100518, 21, 32, 43, 572218, 21, 32, 36,
38, 44, 47, 49,
53, 55, 57, 65,
69, 71, 75,77,
81, 83, 87, 89,
91, 93
Manual1100518, 21, 32, 43,
57
2718, 21, 30, 32,
36, 39, 41, 44,
47, 49, 53, 55,
57, 60, 65, 69,
71, 75, 77, 81,
83, 87, 89, 91,
93, 95, 98
200None182***81***86***
SIC, BIC1200418, 32, 43, 1531218, 21, 32, 39,
53, 57, 65, 124,
133, 147, 157, 183
MBIC1200218, 40718, 32, 51, 65,
124, 133, 152
AIC12001018, 21, 32, 43, 53,
55, 57, 65, 159, 176
5318, 21, 32, 36,
38, 44, 47,
49, 53, 55, 57,
65, 69, 71, 75,
77, 81, 83, 87,
89, 91, 93, 95,
98, 106, 110, 112,
115, 124, 129, 131,
135, 137, 139, 144,
147, 150, 152, 156,
164, 166, 169, 171,
174, 176, 180, 182,
184, 186, 188, 190,
192, 197
Manual12001118, 21, 32, 43,
53, 55, 57, 65,
157, 166, 176
65***
413None395***171***182***
SIC, BIC1413818, 32, 49, 164,
176, 235, 267, 281
1718, 21, 32, 39,
53, 65, 124, 133,
147, 157, 183, 215,
236, 239, 267, 283,
382
* means each time point was detected as a change point; *** means change points detected are more than 40.
Table A11. PELT Algorithm Result for Poland’s COVID-19 Transmissibility Rate.
nPenaltyPELT(Mean)PELT(Variance)PELT(Mean, Variance)
mτmτmτ
413MBIC1413318, 32, 491218, 32, 51, 65,
124, 133, 152, 183,
215, 268, 283, 382
AIC14131518, 21, 32, 43,
53, 65, 157, 164,
176, 213, 223, 267,
281, 382, 386
128***
Manual14131918, 21, 32, 43,
53, 65, 157, 164,
176, 213, 222, 235,
260, 268, 281, 319,
321, 382, 386
151***
* means each time point was detected as a change point; *** means change points detected are more than 40.
Table A12. PELT Algorithm Result for Poland’s COVID-19 Daily Infection.
nPenaltyPELT(Mean)PELT(Variance)PELT(Mean, Variance)
mτmτmτ
20None11875, 7, 9, 11, 13, 15, 1842, 9, 13, 18
SIC, BIC12011811, 17
MBIC120118118
AIC120118118
Manual120118118
30None1118, 20, 21, 22,
23, 24, 25, 26,
27, 28, 29
93, 10, 12, 18,
20, 22, 24, 26,
28
92, 9, 13, 18,
20, 22, 24, 26,
28
SIC, BIC920, 22, 23, 24,
25, 26, 27, 28,
29
126418, 20, 22, 26
MBIC920, 22, 23, 24,
25, 26, 27, 28,
29
126318, 20, 26
AIC920, 22, 23, 24,
25, 26, 27, 28,
29
126518, 20, 22, 26,
28
Manual920, 22, 23, 24,
25, 26, 27, 28,
29
126618, 20, 22, 24,
26, 28
* means each time point was detected as a change point; *** means change points detected are more than 40.
Table A13. PELT Algorithm Result for Poland’s COVID-19 Daily Infection.
nPenaltyPELT(Mean)PELT(Variance)PELT(Mean, Variance)
mτmτmτ
50None3118, 20, 21, 22, 23,
24, 25, 26, 27, 28,
29, 30, 31, 32, 33,
34, 35, 36, 37, 38,
39, 40, 41, 42, 43,
44, 45, 46, 47, 48,
49
182, 7, 11, 18,
20, 23, 25, 27,
29, 31, 33, 35,
37, 39, 41, 43,
45, 47
192, 9, 13, 18, 20,
22, 24, 26, 28,
30, 32, 34, 36,
38, 40, 42, 44,
46, 48
SIC, BIC2920, 22, 23, 24, 25,
26, 27, 28, 29, 30,
31, 32, 33, 34, 35,
36, 37, 38, 39, 40,
41, 42, 43, 44, 45,
46, 47, 48, 49
142818, 20, 22, 26, 30,
35, 42, 48
MBIC2920, 22, 23, 24, 25,
26, 27, 28, 29, 30,
31, 32, 33, 34, 35,
36, 37, 38, 39, 40,
41, 42, 43, 44, 45,
46, 47, 48, 49
142618, 20, 26, 30,
35, 42
AIC2920, 22, 23, 24, 25,
26, 27, 28, 29, 30,
31, 32, 33, 34, 35,
36, 37, 38, 39, 40,
41, 42, 43, 44, 45,
46, 47, 48, 49
333, 38, 421318, 20, 22, 26, 28,
30, 33, 35, 38, 40,
42, 45, 48
Manual2920, 22, 23, 24, 25,
26, 27, 28, 29, 30,
31, 32, 33, 34, 35,
36, 37, 38, 39, 40,
41, 42, 43, 44, 45,
46, 47, 48, 49
333, 38, 421618, 20, 22, 24,
26, 28, 30, 32,
34, 36, 38, 40,
42, 44, 46, 48
100None81***3818, 20, 22, 24,
26, 28, 30, 32,
34, 36, 38, 40,
42, 44, 46, 48,
50, 52, 54, 56,
58, 60, 62, 64,
66, 69, 71, 73,
76, 78, 80, 82,
85, 87, 90, 93,
95, 97
432, 9, 13, 18, 20,
22, 24, 26, 28,
30, 32, 34, 36,
38, 40, 42, 44,
46, 48, 50, 52,
54, 56, 58, 60,
62, 64, 66, 68,
70, 72, 74, 76,
78, 80, 82, 85,
87, 89, 91,
93, 95, 97
* means each time point was detected as a change point; *** means change points detected are more than 40.
Table A14. PELT Algorithm Result for Poland’s COVID-19 Daily Infection.
nPenaltyPELT(Mean)PELT(Variance)PELT(Mean, Variance)
mτmτmτ
100SIC, BIC79***247, 601418, 20, 26, 30,
35, 42, 48, 55,
64, 71, 80, 86,
90, 93
MBIC78***11001218, 20, 26, 30, 38, 47,
55, 64, 71, 80, 86, 95
AIC79***443, 50, 55, 633218, 20, 22, 26, 28, 30,
33, 35, 38, 40, 42, 45,
48, 50, 52, 55, 58, 60,
62, 64, 66, 69, 71, 73,
78, 80, 85, 87, 90, 93,
95, 97
Manual79***443, 50, 55, 633918, 20, 22, 24, 26, 28,
30, 32, 34, 36, 38, 40,
42, 44, 46, 48, 50, 52,
54, 56, 58, 60, 62, 64,
66, 69, 71, 73, 76, 78,
80, 82, 85, 87, 89, 91,
93, 95, 97
200None181***90***92***
SIC, BIC178***852, 64, 79, 96, 145,
151, 164, 173
2418, 20, 26, 30, 38, 47,
55, 64, 71, 80, 86, 95,
104, 112, 134, 141,
144, 153, 157, 161,
171, 180, 187, 192
MBIC177***462, 87, 148, 1651918, 20, 30, 40, 52, 64,
71, 80, 86, 97, 112,
134, 141, 144, 151,
163, 171, 181, 192
AIC178***1152, 64, 79, 93, 112,
134, 146, 151, 164,
170, 180
69***
Manual178***1152, 64, 79, 93, 112,
134, 146, 151, 164,
170, 180
83***
* means each time point was detected as a change point; *** means change points detected are more than 40.
Table A15. PELT Algorithm Result for Poland’s COVID-19 Daily Infection.
nPenaltyPELT(Mean)PELT(Variance)PELT(Mean, Variance)
mτmτmτ
413None394***189***192***
SIC, BIC391***4243, 258, 301, 3894818, 20, 26, 30, 38, 47,
55, 64, 71, 80, 86, 95,
104, 112, 134, 141, 144,
153, 157, 161, 171, 181,
192, 202, 208, 218, 223,
230, 236, 243, 250, 257,
265, 273, 290, 298, 304,
309, 316, 338, 345, 369,
375, 382, 390, 396, 404,
411
MBIC390***3264, 300, 3893318, 20, 30, 40, 52, 64,
71, 80, 86, 97, 112, 134,
141, 144, 170, 181, 192,
203, 224, 236, 245, 257,
271, 291, 303, 316, 339,
369, 375, 382, 390, 396,
404
AIC391***5245, 256, 264, 301,
389
148***
Manual391***5245, 256, 264, 301,
389
177***
* means each time point was detected as a change point; *** means change points detected are more than 40.

References

  1. Kermack, W.; McKendrick, A. Contributions to the mathematical theory of epidemics–I. 1927. Bull. Math. Biol. 1932, 53, 35–55. [Google Scholar] [CrossRef]
  2. Kermack, W.; McKendrick, A. Contributions to the mathematical theory of epidemics–II. The problem of endemicity. Bull. Math. Biol. 1932, 53, 57–87. [Google Scholar] [CrossRef]
  3. Kermack, W.; McKendrick, A. Contributions to the mathematical theory of epidemics–III. Further studies of the problem of endemicity. 1933. Bull. Math. Biol. 1991, 53, 89–118. [Google Scholar] [CrossRef] [PubMed]
  4. Harko, T.; Lobo, F.S.N.; Mak, M.K. Exact analytical solutions of the Susceptible-Infected-Recovered (SIR) epidemic model and of the SIR model with equal death and birth rates. Appl. Math. Comput. 2014, 236, 184–194. [Google Scholar] [CrossRef] [Green Version]
  5. Stachowiak, M.K.; Szajowski, K.J. Cross-Entropy Method in Application to the SIRC Model. Algorithms 2020, 13, 281. [Google Scholar] [CrossRef]
  6. Gubar, E.; Taynitskiy, V.; Zhu, Q. Optimal Control of Heterogeneous Mutating Viruses. Games 2018, 9, 103. [Google Scholar] [CrossRef] [Green Version]
  7. Page, E.S. Continuous inspection schemes. Biometrika 1954, 41, 100–115. [Google Scholar] [CrossRef]
  8. Page, E. A test for a change in a parameter occurring at an unknown point. Biometrika 1955, 42, 523–527. [Google Scholar] [CrossRef]
  9. Sarnowski, W.; Szajowski, K. On-line detection of a part of a sequence with unspecified distribution. Stat. Probabil. Lett. 2008, 78, 2511–2516. [Google Scholar] [CrossRef] [Green Version]
  10. Tartakovsky, A.; Nikiforov, I.; Basseville, M. Sequential Analysis: Hypothesis Testing and Changepoint Detection; Monographs on Statistics and Applied Probability 136; CRC Press: Boca Raton, FL, USA, 2015; 579p, ISBN 978-1-4398-3820-4/hbk; 978-1-4398-3821-1/ebook. [Google Scholar]
  11. Aue, A.; Hörmann, S.; Horváth, L.; Reimherr, M. Break detection in the covariance structure of multivariate time series models. Ann. Stat. 2009, 37, 4046–4087. [Google Scholar] [CrossRef] [Green Version]
  12. Kirch, C.; Muhsal, B.; Ombao, H. Detection of changes in multivariate time series with application to EEG data. J. Am. Stat. Assoc. 2015, 110, 1197–1216. [Google Scholar] [CrossRef]
  13. Lavielle, M.; Teyssiere, G. Detection of multiple change-points in multivariate time series. Lithuan. Math. J. 2006, 46, 287–306. [Google Scholar] [CrossRef] [Green Version]
  14. Montgomery, D.C. Introduction to Statistical Quality Control, 6th ed.; John Wiley & Sons, Inc.: Hoboken, NJ, USA, 2009; 734p. [Google Scholar]
  15. Andreou, E.; Ghysels, E. Structural breaks in financial time series. Handb. Financ. Time Ser. 2009, 60, 839–870. [Google Scholar]
  16. Fryzlewicz, P.; Rao, S.S. Multiple-change-point detection for auto-regressive conditional heteroscedastic processes. J. R. Stat. Soc. Ser. B Stat. Methodol. 2014, 76, 903–924. [Google Scholar] [CrossRef]
  17. Reeves, J.; Chen, J.; Wang, X.L.; Lund, R.; Lu, Q.Q. A review and comparison of changepoint detection techniques for climate data. J. Appl. Meteorol. Climatol. 2007, 46, 900–915. [Google Scholar] [CrossRef]
  18. Ruggieri, E.; Herbert, T.; Lawrence, K.T.; Lawrence, C.E. Change point method for detecting regime shifts in paleoclimatic time series: Application to δ18 O time series of the Plio-Pleistocene. Paleoceanography 2009, 24, PA1204. [Google Scholar] [CrossRef] [Green Version]
  19. Olshen, A.B.; Venkatraman, E.; Lucito, R.; Wigler, M. Circular binary segmentation for the analysis of array-based DNA copy number data. Biostatistics 2004, 5, 557–572. [Google Scholar] [CrossRef]
  20. Picard, F.; Robin, S.; Lavielle, M.; Vaisse, C.; Daudin, J.J. A statistical approach for array CGH data analysis. BMC Bioinform. 2005, 6, 27. [Google Scholar] [CrossRef] [Green Version]
  21. Press, S.J. Subjective and Objective Bayesian Statistics. Principles, Models, and Applications. With Contributions by Siddhartha Chib, Merlise Clyde, George Woodworth and Alan Zaslavsky, 2nd Completely rev. ed.; Wiley Series in Probability and Statistics; Wiley-Interscience: Chichester, UK, 2003; 558p. [Google Scholar]
  22. DeGroot, M.H. Optimal Statistical Decisions. With a Foreword by Joseph B. Kadane, Reprint of the 1970 Original ed.; John Wiley & Sons: Hoboken, NJ, USA, 2004. [Google Scholar] [CrossRef]
  23. Martz, H.F.; Waller, R.A. Bayesian Reliability Analysis; Reprint with Corrections of the 1982 Orig., publ. by John Wiley & Sons ed.; Krieger Publishing Company: Malabar, FL, USA, 1991. [Google Scholar]
  24. Fearnhead, P. Exact and efficient Bayesian inference for multiple changepoint problems. Stat. Comput. 2006, 16, 203–213. [Google Scholar] [CrossRef] [Green Version]
  25. Adams, R.P.; MacKay, D.J. Bayesian online changepoint detection. arXiv 2007, arXiv:0710.3742. [Google Scholar]
  26. Stephens, D.A. Bayesian retrospective multiple-changepoint identification. J. Royal Stat. Soc. Ser. C (Appl. Stat.) 1994, 43, 159–178. [Google Scholar] [CrossRef]
  27. Szajowski, K. A two-disorder detection problem. Appl. Math. 1996, 24, 231–241. [Google Scholar] [CrossRef] [Green Version]
  28. Chib, S. Estimation and comparison of multiple change-point models. J. Econ. 1998, 86, 221–241. [Google Scholar] [CrossRef]
  29. Green, P.J. Reversible jump Markov chain Monte Carlo computation and Bayesian model determination. Biometrika 1995, 82, 711–732. [Google Scholar] [CrossRef]
  30. Cappé, O.; Moulines, E.; Rydén, T. Inference in Hidden Markov Models; Springer Series in Statistics; Springer: New York, NY, USA, 2005; 653p. [Google Scholar] [CrossRef]
  31. Auger, I.E.; Lawrence, C.E. Algorithms for the optimal identification of segment neighborhoods. Bull. Math. Biol. 1989, 51, 39–54. [Google Scholar] [CrossRef]
  32. Jackson, B.; Scargle, J.; Barnes, D.; Arabhi, S.; Alt, A.; Gioumousis, P.; Gwin, E.; Sangtrakulcharoen, P.; Tan, L.; Tsai, T. An algorithm for optimal partitioning of data on an interval. Signal Process. Lett. IEEE 2005, 12, 105–108. [Google Scholar] [CrossRef] [Green Version]
  33. Killick, R.; Fearnhead, P.; Eckley, I.A. Optimal Detection of Changepoints With a Linear Computational Cost. J. Am. Stat. Assoc. 2012, 107, 1590–1598. [Google Scholar] [CrossRef]
  34. Maidstone, R.; Hocking, T.; Rigaill, G.; Fearnhead, P. On optimal multiple changepoint algorithms for large data. Stat. Comput. 2017, 27, 519–533. [Google Scholar] [CrossRef] [Green Version]
  35. Chen, J.; Gupta, A.K. Parametric Statistical Change Point Analysis: With Applications to Genetics, Medicine, and Finance; Birkhäuser: Boston, MA, USA, 2012; 273p. [Google Scholar] [CrossRef]
  36. Matteson, D.S.; James, N.A. A Nonparametric Approach for Multiple Change Point Analysis of Multivariate Data. J. Am. Stat. Assoc. 2014, 109, 334–345. [Google Scholar] [CrossRef] [Green Version]
  37. Akaike, H. A new look at the statistical model identification. IEEE Trans. Autom. Control 1974, 19, 716–723. [Google Scholar] [CrossRef]
  38. Schwarz, G. Estimating the Dimension of a Model. Ann. Stat. 1978, 6, 461–464. [Google Scholar] [CrossRef]
  39. Zhang, N.R.; Siegmund, D.O. A modified Bayes information criterion with applications to the analysis of comparative genomic hybridization data. Biometrics 2007, 63, 22–32. [Google Scholar] [CrossRef] [PubMed]
  40. Hocking, T.; Rigaill, G.; Vert, J.P.; Bach, F. Learning sparse penalties for change-point detection using max margin interval regression. In Proceedings of the 30th International Conference on Machine Learning, PLMR, Atlanta, GA, USA, 17–19 June 2013; Volume 28, pp. 172–180. [Google Scholar]
  41. Lavielle, M.; Moulines, E. Least-squares estimation of an unknown number of shifts in a time series. J. Time Ser. Anal. 2000, 21, 33–59. [Google Scholar] [CrossRef]
  42. Wacker, B.; Schlüter, J. Time-Discrete Parameter Identification Algorithms for Two Deterministic Epidemiological Models Applied to the Spread of COVID-19; 11 May 2020, PREPRINT (Version 1) available at Research Square; 2020; Available online: https://doi.org/10.21203/rs.3.rs-28145/v1 (accessed on 3 April 2021).
  43. Killick, R.; Eckley, I. changepoint: An R package for changepoint analysis. J. Stat. Softw. 2014, 58, 1–19. [Google Scholar] [CrossRef] [Green Version]
  44. Calafiore, G.C.; Novara, C.; Possieri, C. A Modified SIR Model for the COVID-19 Contagion in Italy. In Proceedings of the 2020 59th IEEE Conference on Decision and Control (CDC), Jeju, Korea, 14–18 December 2020; pp. 3889–3894. [Google Scholar] [CrossRef]
  45. Ferrari, L.; Gerardi, G.; Manzi, G.; Micheletti, A.; Nicolussi, F.; Biganzoli, E.; Salini, S. Modeling Provincial Covid-19 Epidemic Data Using an Adjusted Time-Dependent SIRD Model. Int. J. Environ. Res. Public Health. 2021, 18, 6563. [Google Scholar] [CrossRef]
  46. Chatterjee, S.; Sarkar, A.; Chatterjee, S.; Karmakar, M.; Paul, R. Studying the progress of COVID-19 outbreak in India using SIRD model. Indian J. Phys. 2021, 95, 1941–1957. [Google Scholar] [CrossRef]
  47. Fanelli, D.; Piazza, F. Analysis and forecast of COVID-19 spreading in China, Italy and France. Chaos Solitons Fractals 2020, 134, 109761. [Google Scholar] [CrossRef]
Figure 1. Daily cases of COVID-19 infection in Poland.
Axioms 11 00213 g001
Figure 2. Continuum of pandemic phases.
Axioms 11 00213 g002
Figure 3. Simple change-point illustration.
Axioms 11 00213 g003
Figure 4. SIRD network model.
Axioms 11 00213 g004
Figure 5. Simulated epidemic curve on a random graph.
Axioms 11 00213 g005
Figure 6. Discrete estimated SIRD plot for Poland COVID-19 infections.
Axioms 11 00213 g006
Figure 7. Detection of CPs in the simulated transmission rate ( B O C P D ( m ) = 3 , P E L T _ M e a n _ V a r ( m ) = 4 , P E L T _ V a r ( m ) = 4 ).
Axioms 11 00213 g007
Figure 8. Detection of CPs in the simulated infection compartment ( B O C P D ( m ) = 3 , P E L T _ M e a n _ V a r ( m ) = 3 , P E L T _ V a r ( m ) = 2 ).).
Axioms 11 00213 g008
Figure 9. Detection of CPs in the COVID-19 transmission rate ( B O C P D ( m ) = 10 , P E L T _ M e a n _ V a r ( m ) = 12 , P E L T _ V a r ( m ) = 3 ).
Axioms 11 00213 g009
Figure 10. Detection of CPs in COVID-19 infection ( B O C P D ( m ) = 24 , P E L T _ M e a n _ V a r ( m ) = 33 , P E L T _ V a r ( m ) = 3 ).).
Axioms 11 00213 g010
Figure 11. Specific variance detection of CPs in COVID-19 infection using PELT.
Axioms 11 00213 g011
Publisher’s Note: MDPI stays neutral with regard to jurisdictional claims in published maps and institutional affiliations.

