
Multi-Layer Fuzzy Sustainable Decision Approach for Outsourcing Manufacturer Selection in Apparel and Textile Supply Chain


Abstract
:1. Introduction
2. Literature Review
3. Methodology
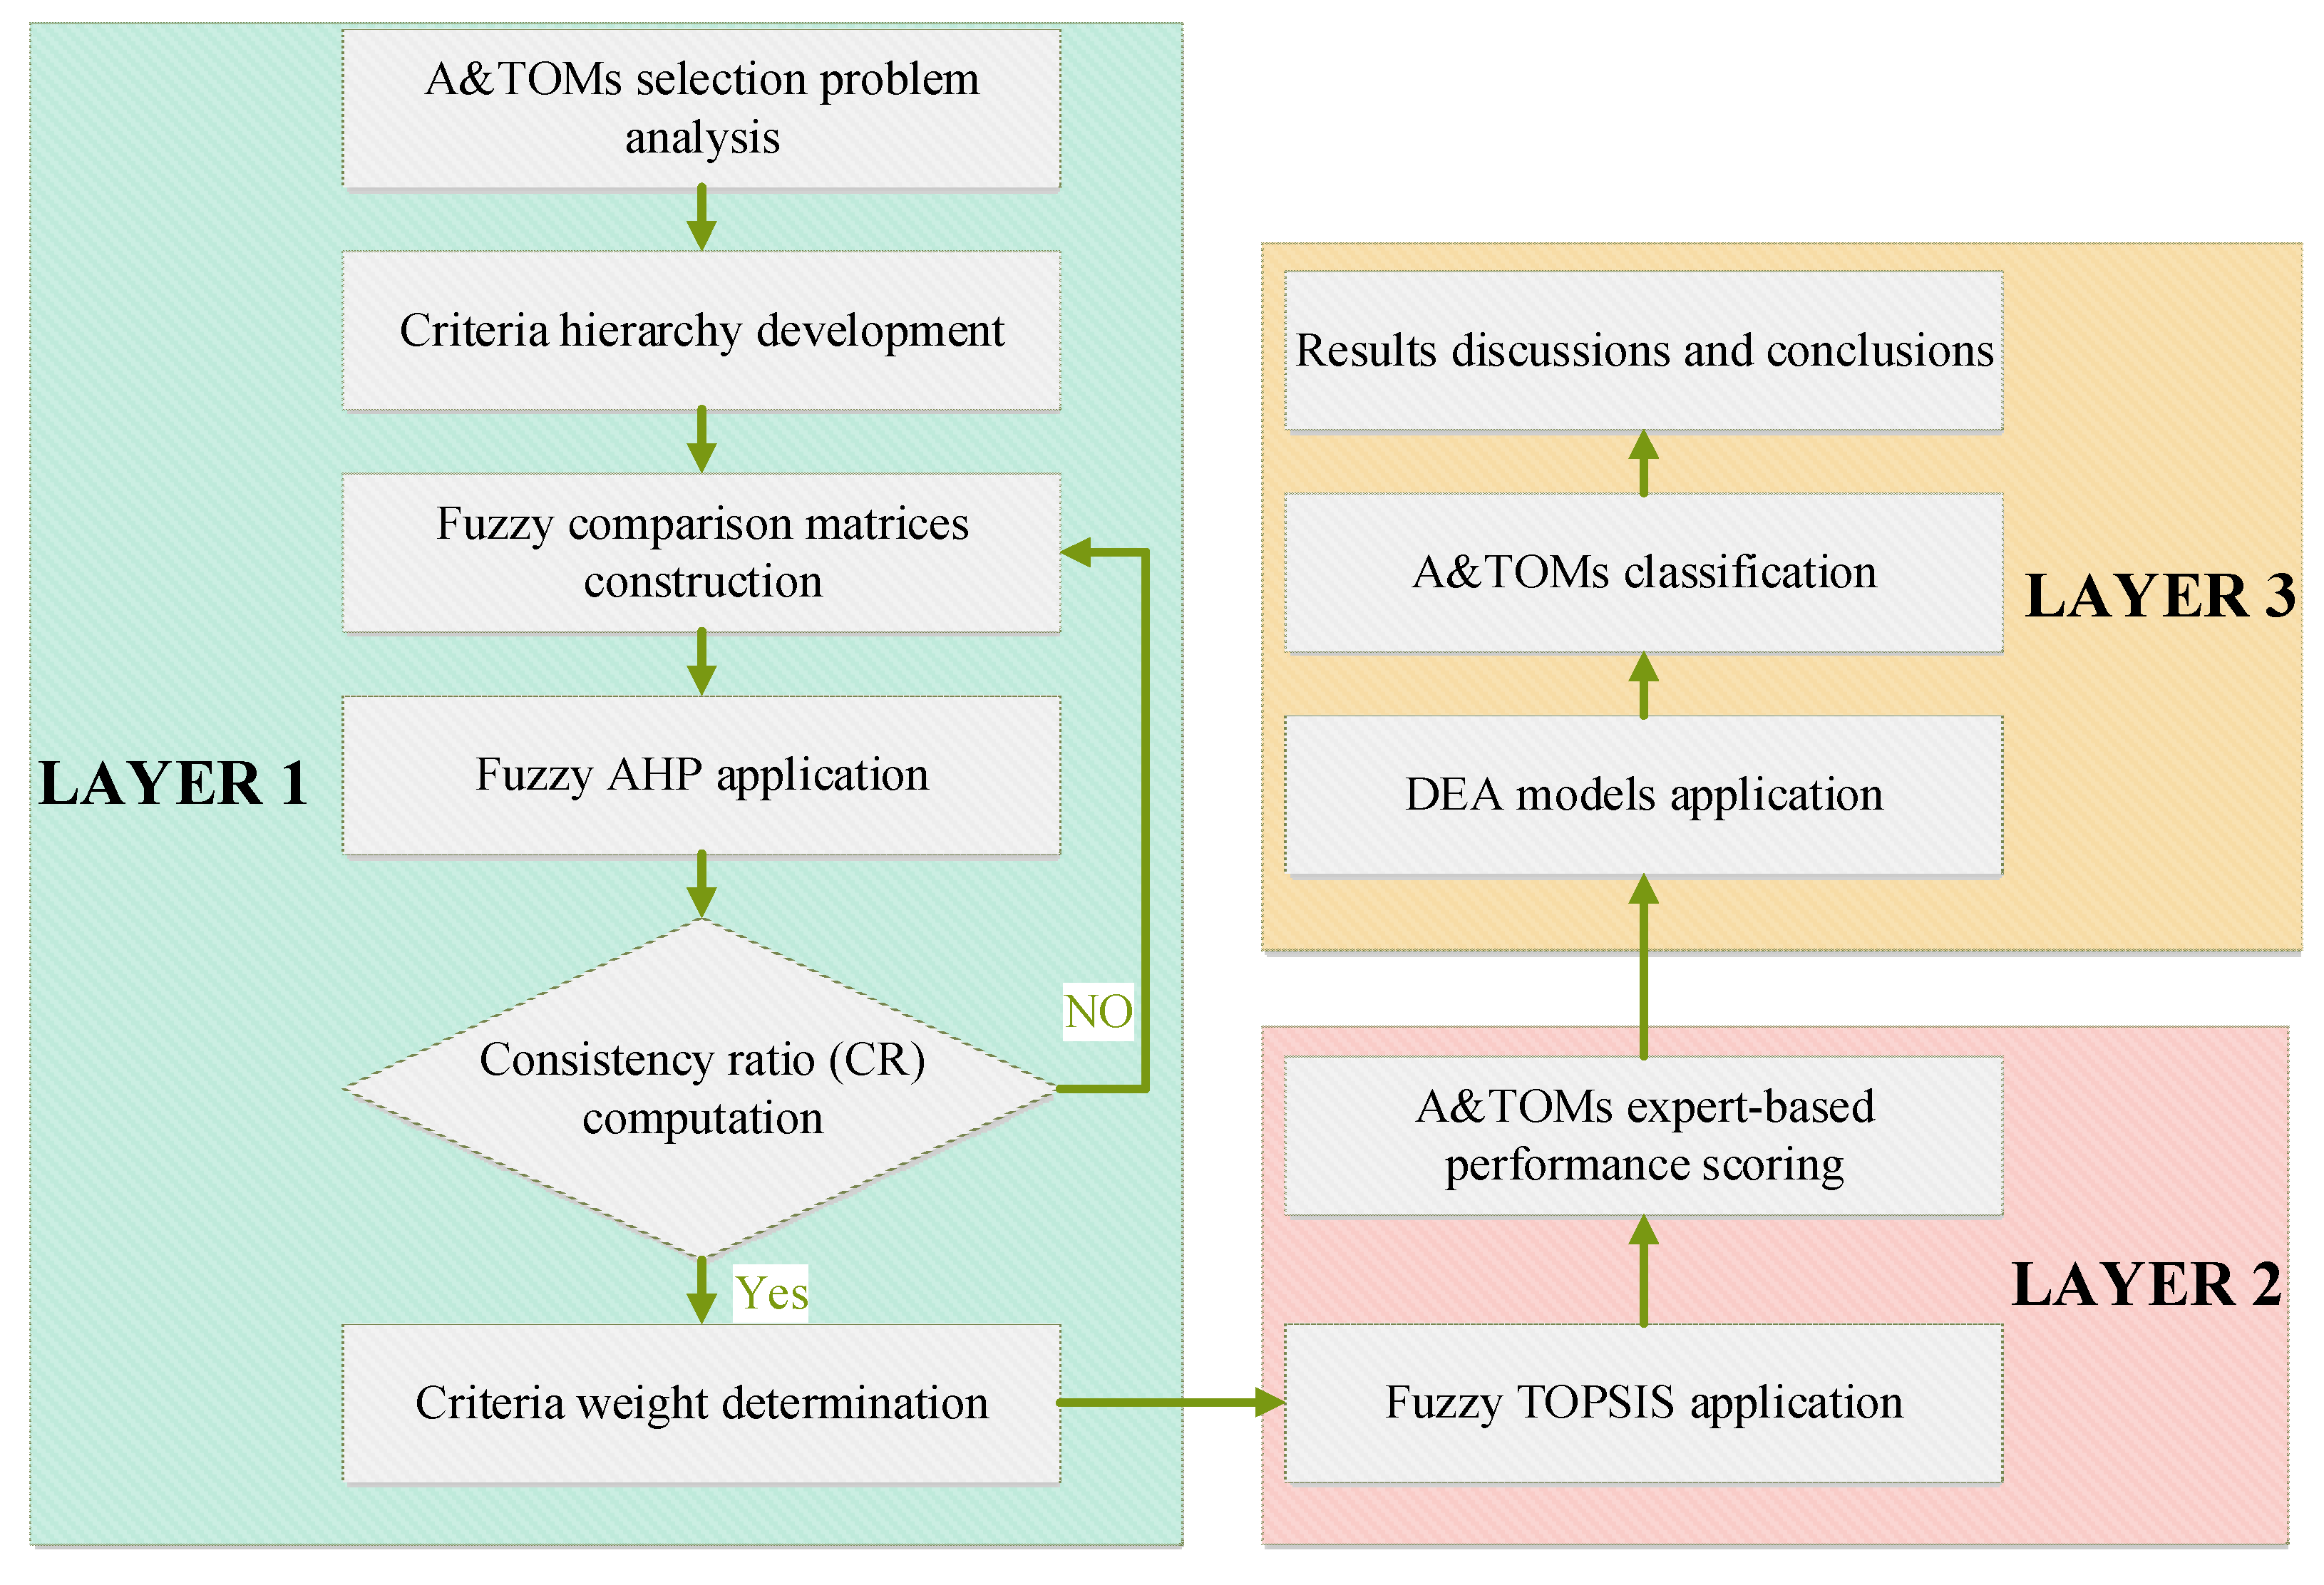
3.1. Methodology Description
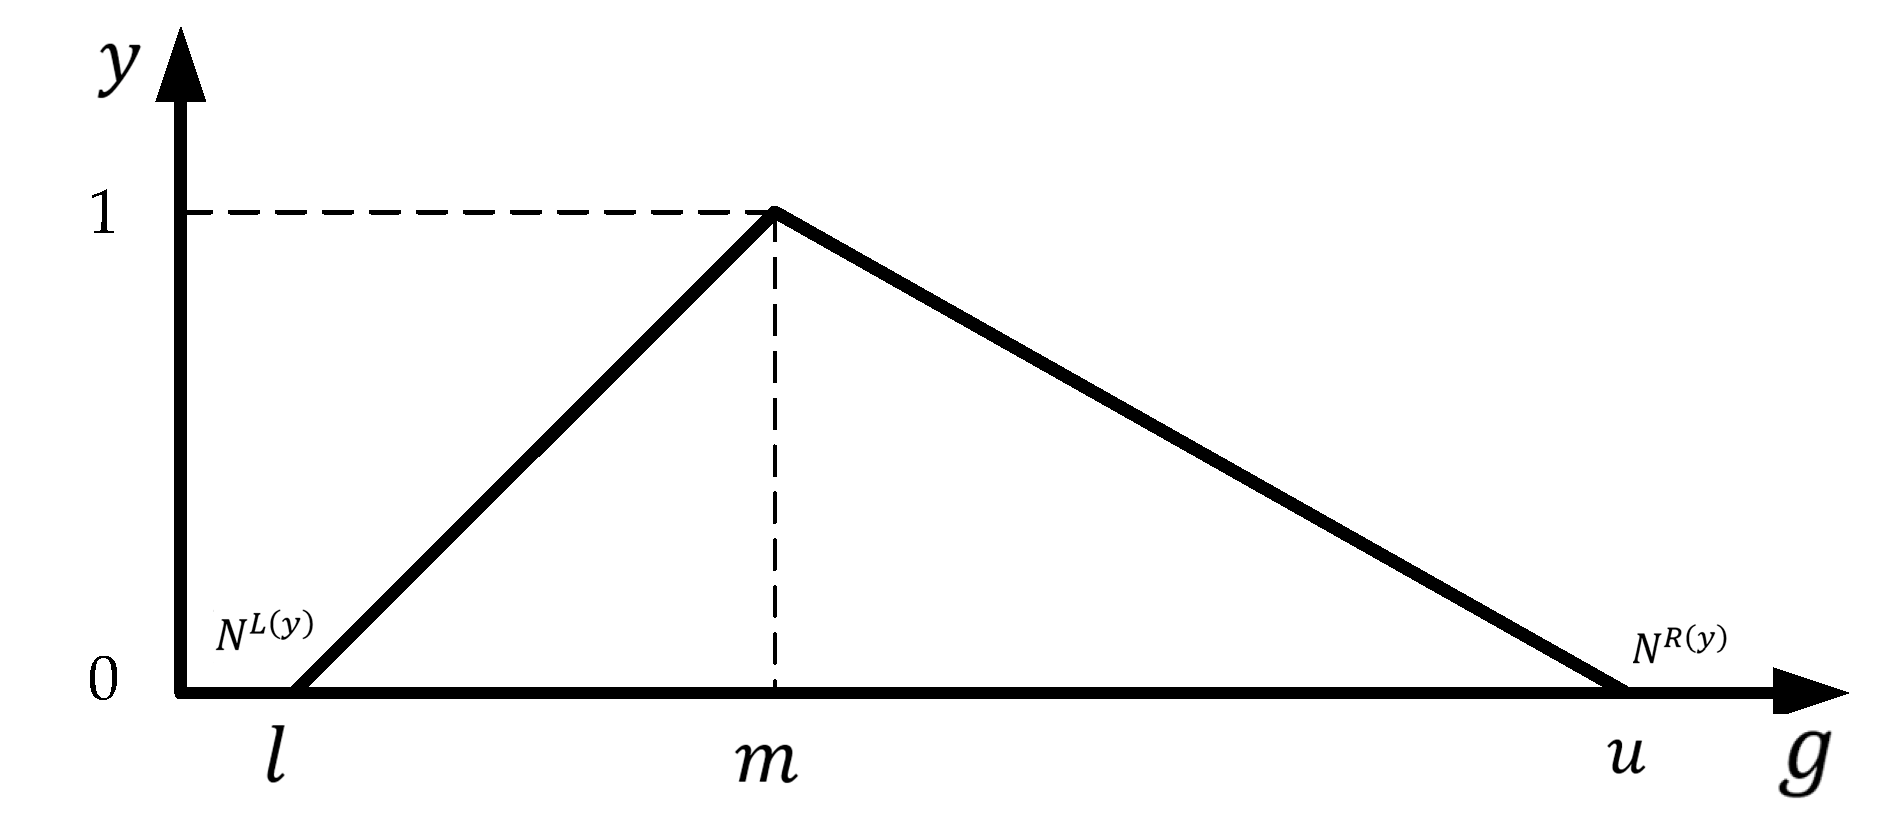
3.2. Fuzzy Set Theory
3.3. Fuzzy Analytical Hierarchy Process (FAHP)
3.4. Fuzzy Technique for Order of Preference by Similarity to Ideal Solution (FTOPSIS)
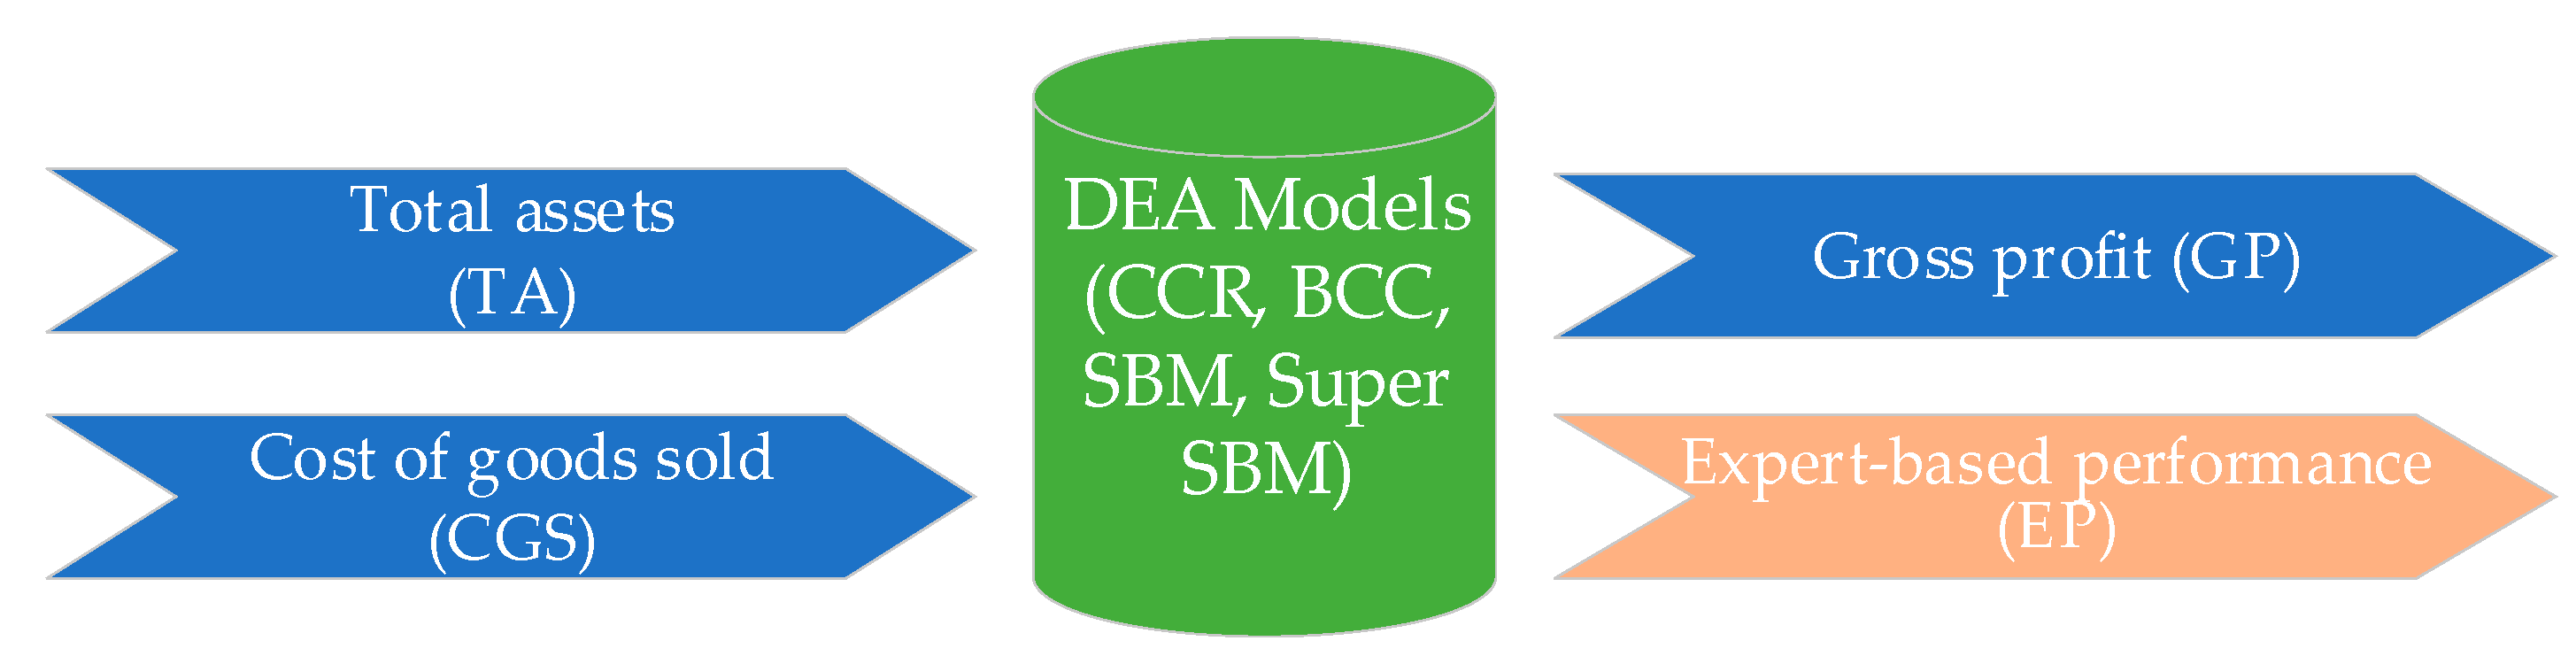
3.5. Data Envelopment Analysis
3.5.1. Inputs and Outputs Selection
3.5.2. DEA Models
4. Numerical Results
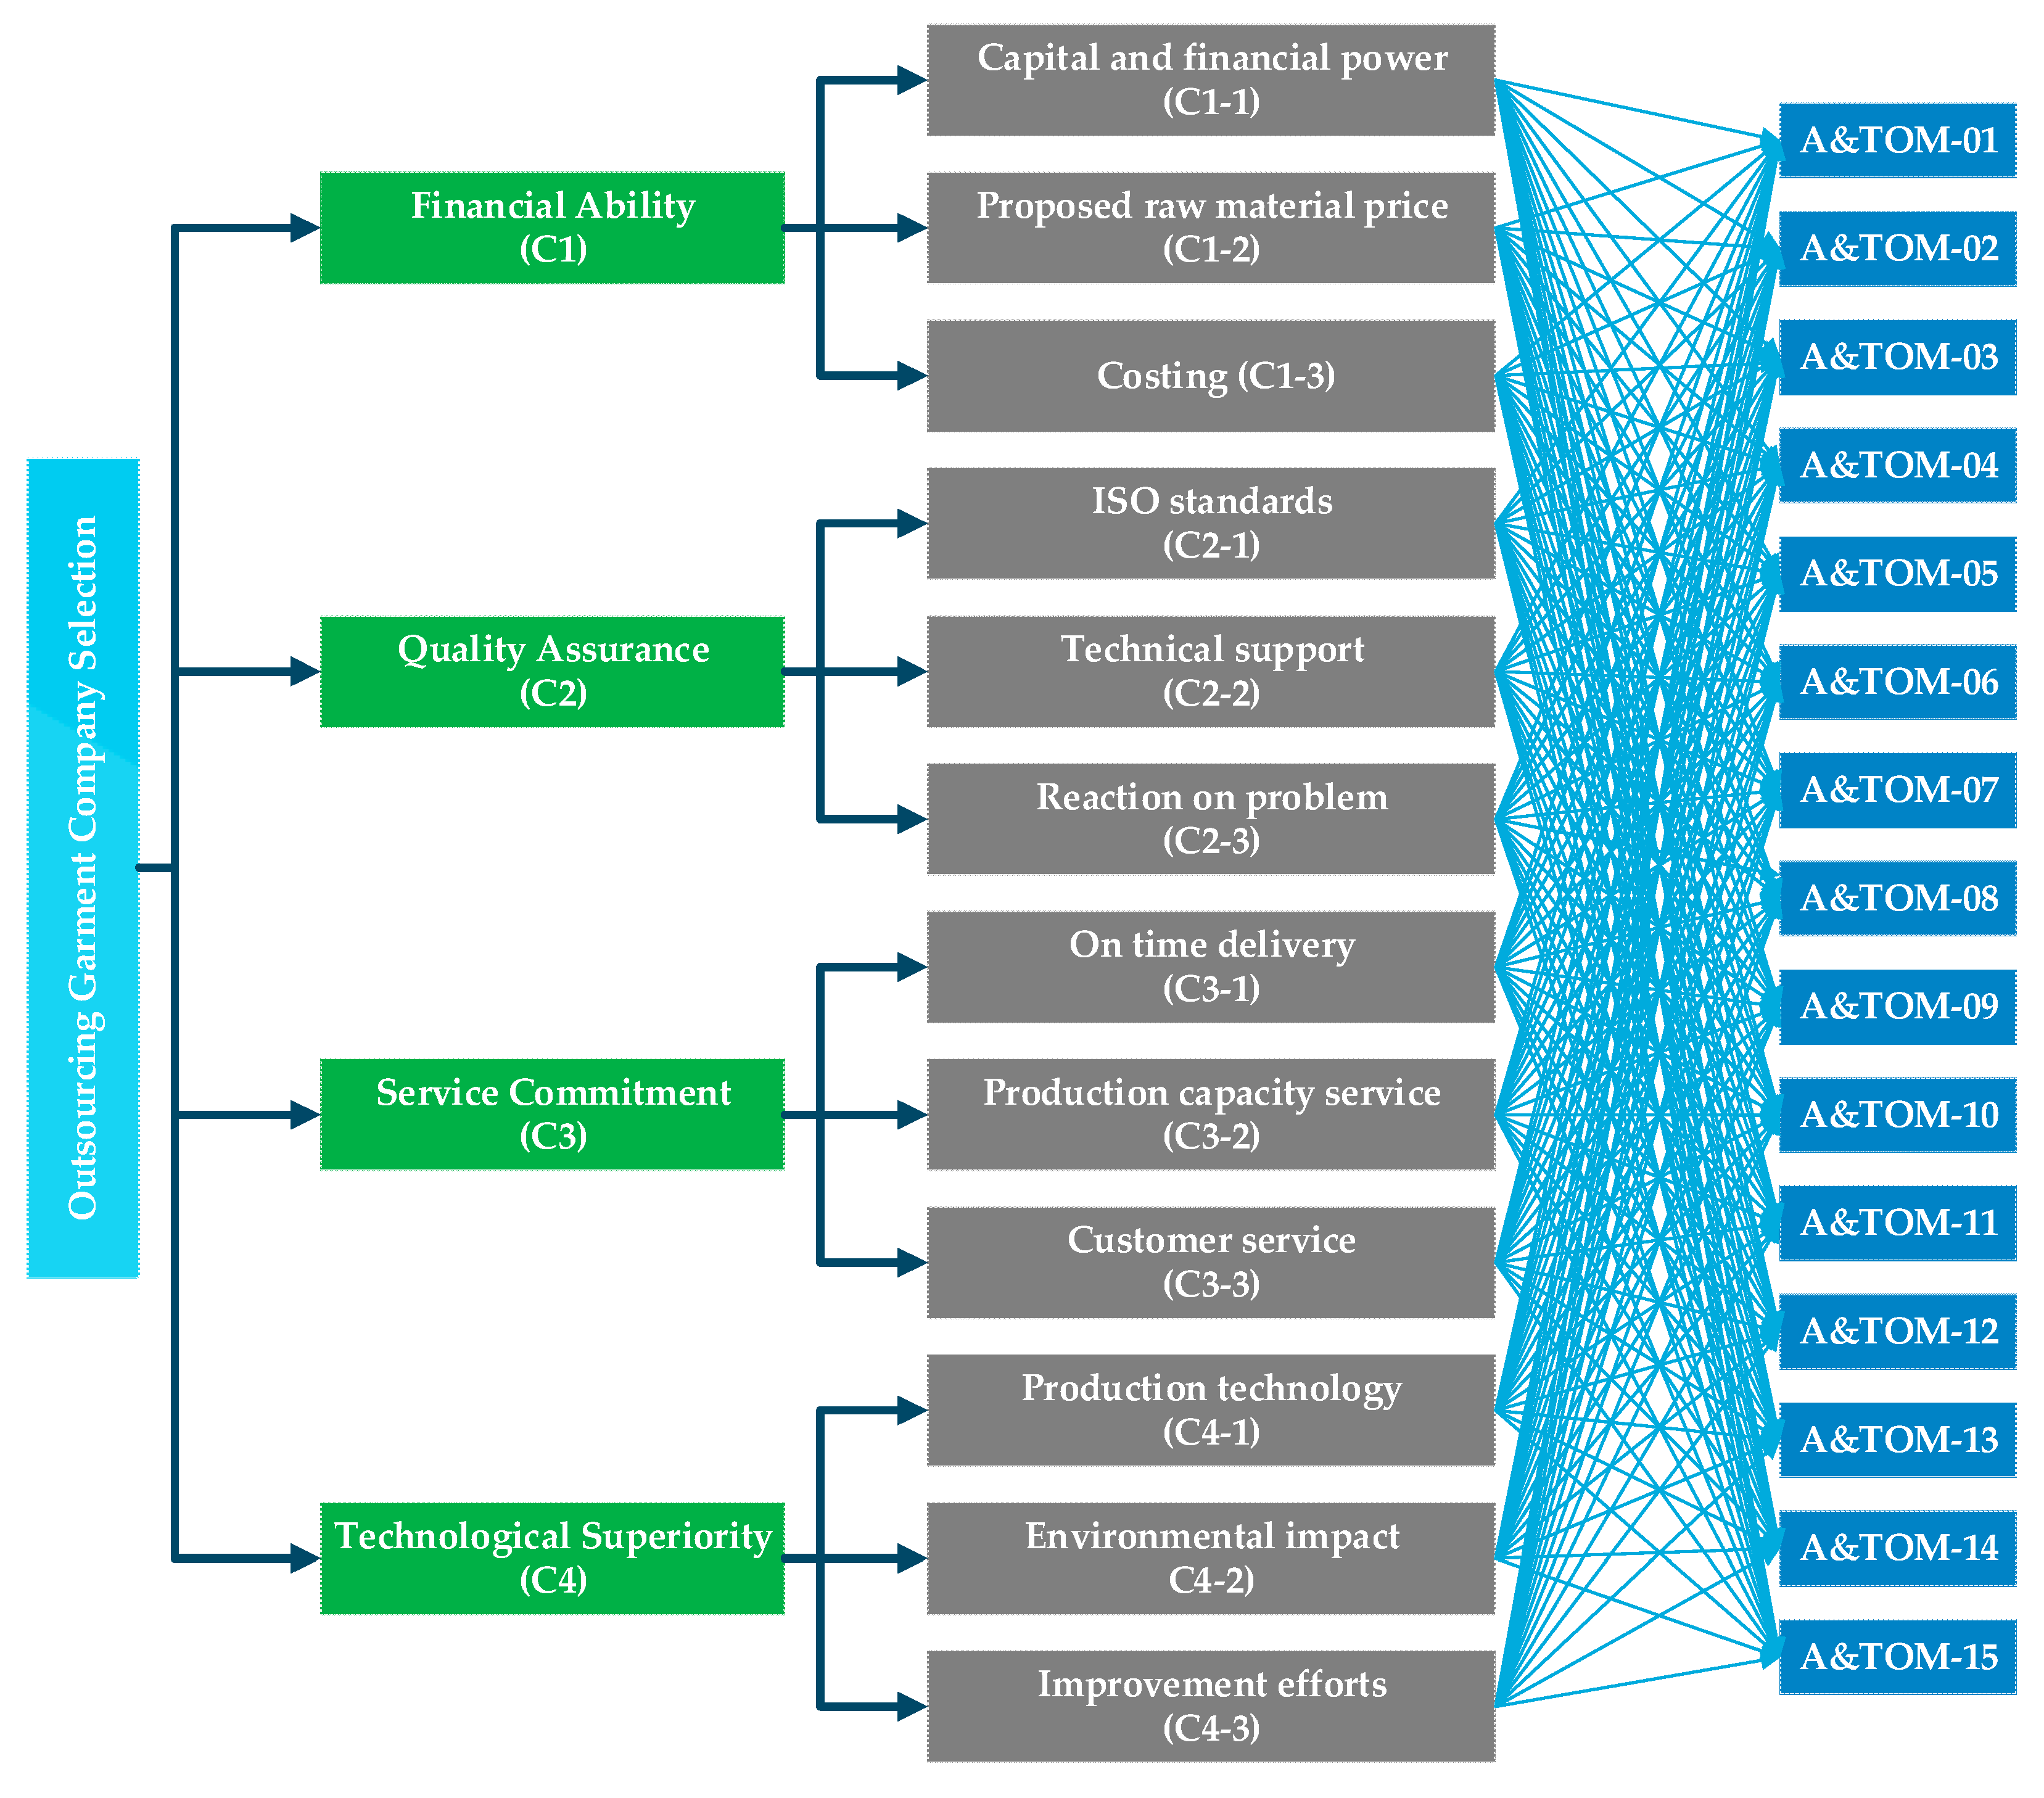
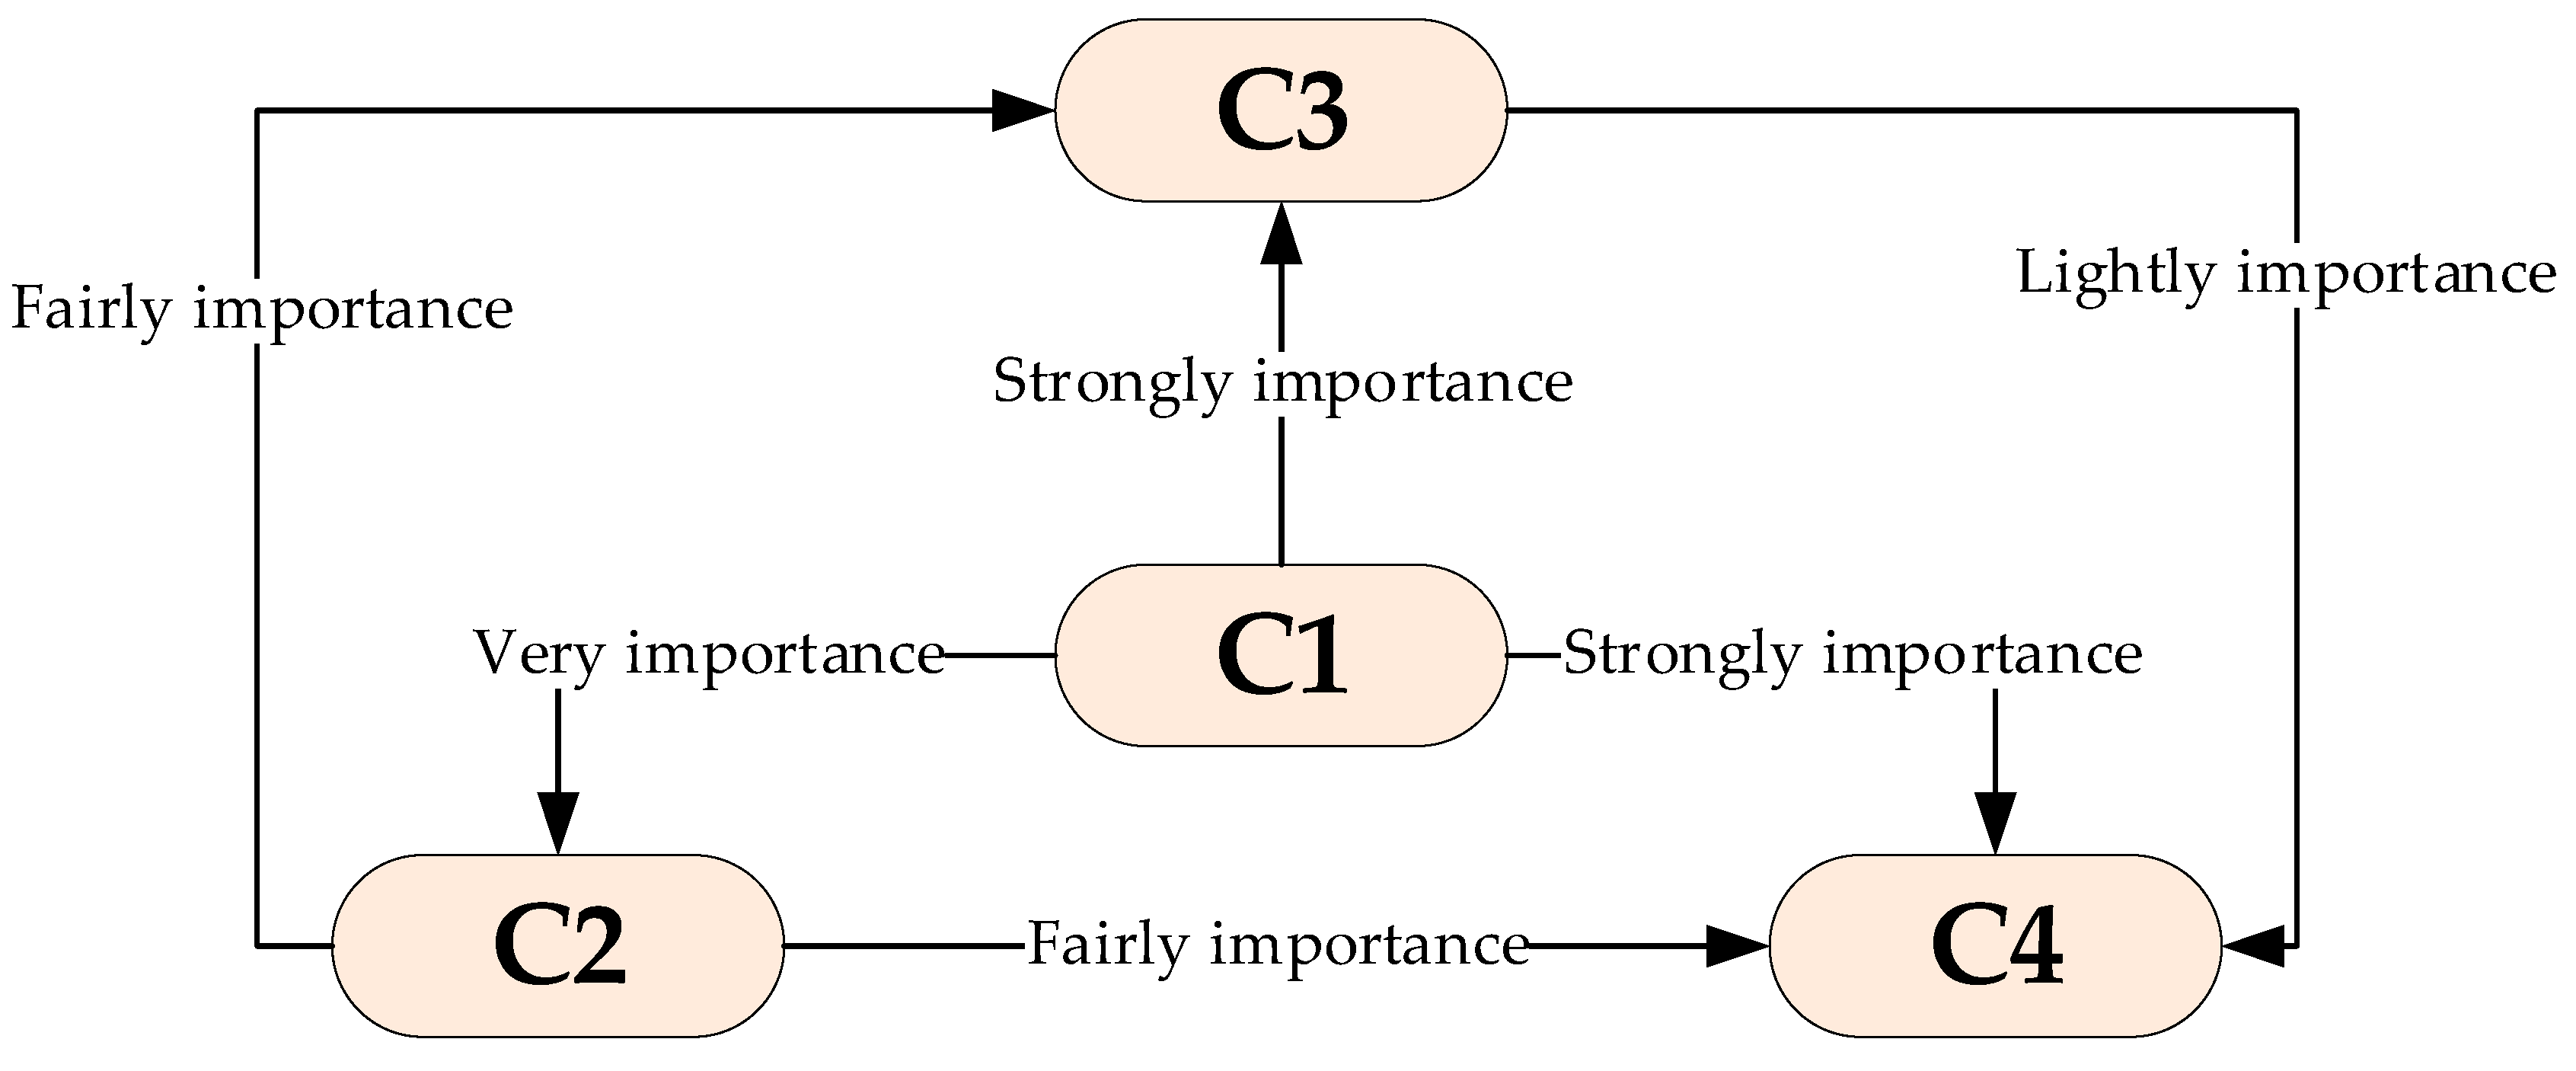
4.1. Case Study Description
4.2. Fuzzy AHP Calculation Results
4.3. Fuzzy TOPSIS Calculation Results
4.4. DEA Calculation Results
5. Conclusions
Author Contributions
Funding
Acknowledgments
Conflicts of Interest
Appendix A

| DMU | Sub-Criteria | |||||
|---|---|---|---|---|---|---|
| C1-1 | C1-2 | C1-3 | C2-1 | C2-2 | C2-3 | |
| A&TOM-01 | (3, 4, 5) | (3, 4, 5) | (3, 4, 5) | (1, 1, 1) | (5, 6, 7) | (1, 2, 3) |
| A&TOM-02 | (5, 6, 7) | (1, 1, 1) | (8, 9, 9) | (7, 8, 9) | (6, 7, 8) | (8, 9, 9) |
| A&TOM-03 | (5, 6, 7) | (2, 3, 4) | (7, 8, 9) | (5, 6, 7) | (2, 3, 4) | (1, 1, 1) |
| A&TOM-04 | (1, 1, 1) | (7, 8, 9) | (1, 2, 3) | (4, 5, 6) | (7, 8, 9) | (1, 2, 3) |
| A&TOM-05 | (7, 8, 9) | (1, 1, 1) | (2, 3, 4) | (6, 7, 8) | (7, 8, 9) | (1, 1, 1) |
| A&TOM-06 | (1, 2, 3) | (2, 3, 4) | (8, 9, 9) | (2, 3, 4) | (5, 6, 7) | (6, 7, 8) |
| A&TOM-07 | (2, 3, 4) | (1, 1, 1) | (5, 6, 7) | (1, 1, 1) | (1, 1, 1) | (4, 5, 6) |
| A&TOM-08 | (1, 1, 1) | (1, 2, 3) | (3, 4, 5) | (8, 9, 9) | (5, 6, 7) | (5, 6, 7) |
| A&TOM-09 | (6, 7, 8) | (6, 7, 8) | (8, 9, 9) | (2, 3, 4) | (6, 7, 8) | (3, 4, 5) |
| A&TOM-10 | (5, 6, 7) | (7, 8, 9) | (8, 9, 9) | (6, 7, 8) | (3, 4, 5) | (4, 5, 6) |
| A&TOM-11 | (8, 9, 9) | (5, 6, 7) | (2, 3, 4) | (4, 5, 6) | (6, 7, 8) | (5, 6, 7) |
| A&TOM-12 | (1, 1, 1) | (3, 4, 5) | (4, 5, 6) | (3, 4, 5) | (5, 6, 7) | (3, 4, 5) |
| A&TOM-13 | (7, 8, 9) | (5, 6, 7) | (1, 1, 1) | (3, 4, 5) | (2, 3, 4) | (8, 9, 9) |
| A&TOM-14 | (2, 3, 4) | (7, 8, 9) | (2, 3, 4) | (1, 1, 1) | (1, 1, 1) | (1, 2, 3) |
| A&TOM-15 | (1, 2, 3) | (3, 4, 5) | (7, 8, 9) | (1, 2, 3) | (2, 3, 4) | (8, 9, 9) |
| (17.18, 20.27, 23.07) | (20.27, 23.07, 16.49) | (23.07, 16.49, 19.65) | (16.49, 19.65, 22.89) | (19.65, 22.89, 20.66) | (22.89, 20.66, 24.02) | |
| DMU | Sub-Criteria | |||||
|---|---|---|---|---|---|---|
| C3-1 | C3-2 | C3-3 | C4-1 | C4-2 | C4-3 | |
| A&TOM-01 | (7, 8, 9) | (4, 5, 6) | (4, 5, 6) | (1, 1, 1) | (5, 6, 7) | (8, 9, 9) |
| A&TOM-02 | (4, 5, 6) | (1, 2, 3) | (7, 8, 9) | (7, 8, 9) | (4, 5, 6) | (5, 6, 7) |
| A&TOM-03 | (1, 2, 3) | (5, 6, 7) | (6, 7, 8) | (4, 5, 6) | (7, 8, 9) | (5, 6, 7) |
| A&TOM-04 | (5, 6, 7) | (3, 4, 5) | (5, 6, 7) | (6, 7, 8) | (5, 6, 7) | (6, 7, 8) |
| A&TOM-05 | (4, 5, 6) | (5, 6, 7) | (2, 3, 4) | (5, 6, 7) | (7, 8, 9) | (4, 5, 6) |
| A&TOM-06 | (2, 3, 4) | (3, 4, 5) | (3, 4, 5) | (6, 7, 8) | (1, 2, 3) | (6, 7, 8) |
| A&TOM-07 | (1, 2, 3) | (1, 2, 3) | (5, 6, 7) | (1, 2, 3) | (1, 2, 3) | (1, 1, 1) |
| A&TOM-08 | (1, 2, 3) | (3, 4, 5) | (2, 3, 4) | (1, 2, 3) | (1, 2, 3) | (1, 1, 1) |
| A&TOM-09 | (3, 4, 5) | (1, 2, 3) | (1, 2, 3) | (3, 4, 5) | (1, 2, 3) | (4, 5, 6) |
| A&TOM-10 | (1, 1, 1) | (5, 6, 7) | (6, 7, 8) | (8, 9, 9) | (5, 6, 7) | (4, 5, 6) |
| A&TOM-11 | (8, 9, 9) | (2, 3, 4) | (1, 2, 3) | (1, 1, 1) | (4, 5, 6) | (8, 9, 9) |
| A&TOM-12 | (5, 6, 7) | (5, 6, 7) | (1, 1, 1) | (3, 4, 5) | (3, 4, 5) | (7, 8, 9) |
| A&TOM-13 | (1, 1, 1) | (1, 1, 1) | (5, 6, 7) | (3, 4, 5) | (6, 7, 8) | (1, 2, 3) |
| A&TOM-14 | (3, 4, 5) | (1, 1, 1) | (8, 9, 9) | (6, 7, 8) | (1, 2, 3) | (1, 2, 3) |
| A&TOM-15 | (1, 1, 1) | (5, 6, 7) | (5, 6, 7) | (1, 2, 3) | (4, 5, 6) | (1, 1, 1) |
| (20.66, 24.02, 26.06) | (24.02, 26.06, 16.49) | (26.06, 16.49, 19.65) | (16.49, 19.65, 22.47) | (19.65, 22.47, 18.14) | (22.47, 18.14, 21.54) | |
| DMU | Sub-Criteria | |||||
|---|---|---|---|---|---|---|
| C1-1 | C1-2 | C1-3 | C2-1 | C2-2 | C2-3 | |
| A&TOM-01 | (0.02, 0.07, 0.21) | (0.07, 0.21, 0.02) | (0.21, 0.02, 0.05) | (0.02, 0.05, 0.16) | (0.05, 0.16, 0) | (0.16, 0, 0.01) |
| A&TOM-02 | (0.04, 0.11, 0.3) | (0.11, 0.3, 0.01) | (0.3, 0.01, 0.01) | (0.01, 0.01, 0.03) | (0.01, 0.03, 0.01) | (0.03, 0.01, 0.02) |
| A&TOM-03 | (0.04, 0.11, 0.3) | (0.11, 0.3, 0.01) | (0.3, 0.01, 0.04) | (0.01, 0.04, 0.13) | (0.04, 0.13, 0.01) | (0.13, 0.01, 0.02) |
| A&TOM-04 | (0.01, 0.02, 0.04) | (0.02, 0.04, 0.04) | (0.04, 0.04, 0.1) | (0.04, 0.1, 0.29) | (0.1, 0.29, 0) | (0.29, 0, 0) |
| A&TOM-05 | (0.05, 0.15, 0.38) | (0.15, 0.38, 0.01) | (0.38, 0.01, 0.01) | (0.01, 0.01, 0.03) | (0.01, 0.03, 0) | (0.03, 0, 0.01) |
| A&TOM-06 | (0.01, 0.04, 0.13) | (0.04, 0.13, 0.01) | (0.13, 0.01, 0.04) | (0.01, 0.04, 0.13) | (0.04, 0.13, 0.01) | (0.13, 0.01, 0.02) |
| A&TOM-07 | (0.01, 0.05, 0.17) | (0.05, 0.17, 0.01) | (0.17, 0.01, 0.01) | (0.01, 0.01, 0.03) | (0.01, 0.03, 0.01) | (0.03, 0.01, 0.01) |
| A&TOM-08 | (0.01, 0.02, 0.04) | (0.02, 0.04, 0.01) | (0.04, 0.01, 0.03) | (0.01, 0.03, 0.1) | (0.03, 0.1, 0) | (0.1, 0, 0.01) |
| A&TOM-09 | (0.04, 0.13, 0.34) | (0.13, 0.34, 0.03) | (0.34, 0.03, 0.09) | (0.03, 0.09, 0.26) | (0.09, 0.26, 0.01) | (0.26, 0.01, 0.02) |
| A&TOM-10 | (0.04, 0.11, 0.3) | (0.11, 0.3, 0.04) | (0.3, 0.04, 0.1) | (0.04, 0.1, 0.29) | (0.1, 0.29, 0.01) | (0.29, 0.01, 0.02) |
| A&TOM-11 | (0.06, 0.16, 0.38) | (0.16, 0.38, 0.03) | (0.38, 0.03, 0.08) | (0.03, 0.08, 0.23) | (0.08, 0.23, 0) | (0.23, 0, 0.01) |
| A&TOM-12 | (0.01, 0.02, 0.04) | (0.02, 0.04, 0.02) | (0.04, 0.02, 0.05) | (0.02, 0.05, 0.16) | (0.05, 0.16, 0) | (0.16, 0, 0.01) |
| A&TOM-13 | (0.05, 0.15, 0.38) | (0.15, 0.38, 0.03) | (0.38, 0.03, 0.08) | (0.03, 0.08, 0.23) | (0.08, 0.23, 0) | (0.23, 0, 0) |
| A&TOM-14 | (0.01, 0.05, 0.17) | (0.05, 0.17, 0.04) | (0.17, 0.04, 0.1) | (0.04, 0.1, 0.29) | (0.1, 0.29, 0) | (0.29, 0, 0.01) |
| A&TOM-15 | (0.01, 0.04, 0.13) | (0.04, 0.13, 0.02) | (0.13, 0.02, 0.05) | (0.02, 0.05, 0.16) | (0.05, 0.16, 0.01) | (0.16, 0.01, 0.02) |
| DMU | Sub-Criteria | |||||
|---|---|---|---|---|---|---|
| C3-1 | C3-2 | C3-3 | C4-1 | C4-2 | C4-3 | |
| A&TOM-01 | (0, 0.01, 0.02) | (0.01, 0.02, 0) | (0.02, 0, 0.01) | (0, 0.01, 0.01) | (0.01, 0.01, 0) | (0.01, 0, 0.01) |
| A&TOM-02 | (0.01, 0.02, 0.04) | (0.02, 0.04, 0.02) | (0.04, 0.02, 0.06) | (0.02, 0.06, 0.13) | (0.06, 0.13, 0.01) | (0.13, 0.01, 0.01) |
| A&TOM-03 | (0.01, 0.02, 0.04) | (0.02, 0.04, 0.02) | (0.04, 0.02, 0.04) | (0.02, 0.04, 0.1) | (0.04, 0.1, 0) | (0.1, 0, 0.01) |
| A&TOM-04 | (0, 0, 0.01) | (0, 0.01, 0.01) | (0.01, 0.01, 0.04) | (0.01, 0.04, 0.09) | (0.04, 0.09, 0.01) | (0.09, 0.01, 0.02) |
| A&TOM-05 | (0, 0.01, 0.02) | (0.01, 0.02, 0.02) | (0.02, 0.02, 0.05) | (0.02, 0.05, 0.12) | (0.05, 0.12, 0.01) | (0.12, 0.01, 0.02) |
| A&TOM-06 | (0.01, 0.02, 0.04) | (0.02, 0.04, 0.01) | (0.04, 0.01, 0.02) | (0.01, 0.02, 0.06) | (0.02, 0.06, 0) | (0.06, 0, 0.01) |
| A&TOM-07 | (0.01, 0.01, 0.03) | (0.01, 0.03, 0) | (0.03, 0, 0.01) | (0, 0.01, 0.01) | (0.01, 0.01, 0) | (0.01, 0, 0) |
| A&TOM-08 | (0, 0.01, 0.02) | (0.01, 0.02, 0.03) | (0.02, 0.03, 0.06) | (0.03, 0.06, 0.13) | (0.06, 0.13, 0) | (0.13, 0, 0.01) |
| A&TOM-09 | (0.01, 0.02, 0.04) | (0.02, 0.04, 0.01) | (0.04, 0.01, 0.02) | (0.01, 0.02, 0.06) | (0.02, 0.06, 0.01) | (0.06, 0.01, 0.01) |
| A&TOM-10 | (0.01, 0.02, 0.04) | (0.02, 0.04, 0.02) | (0.04, 0.02, 0.05) | (0.02, 0.05, 0.12) | (0.05, 0.12, 0) | (0.12, 0, 0.01) |
| A&TOM-11 | (0, 0.01, 0.02) | (0.01, 0.02, 0.01) | (0.02, 0.01, 0.04) | (0.01, 0.04, 0.09) | (0.04, 0.09, 0.01) | (0.09, 0.01, 0.01) |
| A&TOM-12 | (0, 0.01, 0.03) | (0.01, 0.03, 0.01) | (0.03, 0.01, 0.03) | (0.01, 0.03, 0.07) | (0.03, 0.07, 0) | (0.07, 0, 0.01) |
| A&TOM-13 | (0, 0, 0) | (0, 0, 0.01) | (0, 0.01, 0.03) | (0.01, 0.03, 0.07) | (0.03, 0.07, 0) | (0.07, 0, 0.01) |
| A&TOM-14 | (0, 0.01, 0.02) | (0.01, 0.02, 0) | (0.02, 0, 0.01) | (0, 0.01, 0.01) | (0.01, 0.01, 0) | (0.01, 0, 0) |
| A&TOM-15 | (0.01, 0.02, 0.04) | (0.02, 0.04, 0) | (0.04, 0, 0.01) | (0, 0.01, 0.04) | (0.01, 0.04, 0) | (0.04, 0, 0.01) |
| DMU | Sub-Criteria | |||||||||||
|---|---|---|---|---|---|---|---|---|---|---|---|---|
| C1-1 | C1-2 | C1-3 | C2-1 | C2-2 | C2-3 | C3-1 | C3-2 | C3-3 | C4-1 | C4-2 | C4-3 | |
| A&TOM-01 | 0.103 | 0.077 | 0.013 | 0.008 | 0.016 | 0.002 | 0.030 | 0.008 | 0.002 | 0.002 | 0.005 | 0.002 |
| A&TOM-02 | 0.149 | 0.017 | 0.025 | 0.070 | 0.018 | 0.007 | 0.020 | 0.004 | 0.003 | 0.020 | 0.005 | 0.001 |
| A&TOM-03 | 0.149 | 0.060 | 0.024 | 0.054 | 0.009 | 0.001 | 0.009 | 0.009 | 0.003 | 0.013 | 0.007 | 0.001 |
| A&TOM-04 | 0.023 | 0.144 | 0.007 | 0.045 | 0.021 | 0.002 | 0.023 | 0.006 | 0.002 | 0.017 | 0.005 | 0.001 |
| A&TOM-05 | 0.194 | 0.017 | 0.010 | 0.062 | 0.021 | 0.001 | 0.020 | 0.009 | 0.001 | 0.015 | 0.007 | 0.001 |
| A&TOM-06 | 0.057 | 0.060 | 0.025 | 0.029 | 0.016 | 0.006 | 0.012 | 0.006 | 0.002 | 0.017 | 0.002 | 0.001 |
| A&TOM-07 | 0.080 | 0.017 | 0.018 | 0.008 | 0.002 | 0.004 | 0.009 | 0.004 | 0.002 | 0.006 | 0.002 | 0.000 |
| A&TOM-08 | 0.023 | 0.043 | 0.013 | 0.074 | 0.016 | 0.005 | 0.009 | 0.006 | 0.001 | 0.006 | 0.002 | 0.000 |
| A&TOM-09 | 0.171 | 0.127 | 0.025 | 0.029 | 0.018 | 0.003 | 0.016 | 0.004 | 0.001 | 0.010 | 0.002 | 0.001 |
| A&TOM-10 | 0.149 | 0.144 | 0.025 | 0.062 | 0.011 | 0.004 | 0.004 | 0.009 | 0.003 | 0.021 | 0.005 | 0.001 |
| A&TOM-11 | 0.203 | 0.110 | 0.010 | 0.045 | 0.018 | 0.005 | 0.032 | 0.005 | 0.001 | 0.002 | 0.005 | 0.002 |
| A&TOM-12 | 0.023 | 0.077 | 0.015 | 0.037 | 0.016 | 0.003 | 0.023 | 0.009 | 0.000 | 0.010 | 0.004 | 0.002 |
| A&TOM-13 | 0.194 | 0.110 | 0.003 | 0.037 | 0.009 | 0.007 | 0.004 | 0.001 | 0.002 | 0.010 | 0.006 | 0.000 |
| A&TOM-14 | 0.080 | 0.144 | 0.010 | 0.008 | 0.002 | 0.002 | 0.016 | 0.001 | 0.003 | 0.017 | 0.002 | 0.000 |
| A&TOM-15 | 0.057 | 0.077 | 0.024 | 0.020 | 0.009 | 0.007 | 0.004 | 0.009 | 0.002 | 0.006 | 0.005 | 0.000 |
| Direction | Min | Min | Max | Max | Max | Min | Min | Max | Min | Max | Min | Min |
| Idea | 0.023 | 0.017 | 0.025 | 0.074 | 0.021 | 0.001 | 0.004 | 0.009 | 0.000 | 0.021 | 0.002 | 0.000 |
| Negative Idea | 0.203 | 0.144 | 0.003 | 0.008 | 0.002 | 0.007 | 0.032 | 0.001 | 0.003 | 0.002 | 0.007 | 0.002 |
References
- The Garment and Textile Industry Maintain the Optimistic Signals During Covid-19 Pandemic. 2021. Available online: https://www.chanchao.com.tw/VTG/newsDetail.asp?serno=3078 (accessed on 21 June 2021).
- Sardar, S.; Lee, Y.H.; Memon, M.S. A Sustainable Outsourcing Strategy Regarding Cost, Capacity Flexibility, and Risk in a Textile Supply Chain. Sustainability 2016, 8, 234. [Google Scholar] [CrossRef] [Green Version]
- Nong, N.-M.T.; Ho, P.T. Criteria for Supplier Selection in Textile and Apparel Industry: A Case Study in Vietnam. J. Asian Financ. Econ. Bus. 2019, 6, 213–221. [Google Scholar] [CrossRef]
- Taylan, O.; Bafail, A.O.; Abdulaal, R.M.S.; Kabli, M.R. Construction projects selection and risk assessment by fuzzy AHP and fuzzy TOPSIS methodologies. Appl. Soft Comput. 2014, 17, 105–116. [Google Scholar] [CrossRef]
- Yu, P.; Lee, J.H. A hybrid approach using two-level SOM and combined AHP rating and AHP/DEA-AR method for selecting optimal promising emerging technology. Expert Syst. Appl. 2013, 40, 300–314. [Google Scholar] [CrossRef]
- Shen, J.-L.; Liu, Y.-M.; Tzeng, Y.-L. The Cluster-Weighted DEMATEL with ANP Method for Supplier Selection in Food Industry. J. Adv. Comput. Intell. Intell. Inform. 2012, 16, 567–575. [Google Scholar] [CrossRef]
- Cook, W.D.; Seiford, L.M. Data envelopment analysis (DEA)—Thirty years on. Eur. J. Oper. Res. 2009, 192, 1–17. [Google Scholar] [CrossRef]
- Daraio, C.; Nepomuceno, T.C.C.; Costa, A.P.C.S. Theoretical and Empirical Advances in the Assessment of Productive Efficiency since the introduction of DEA: A Bibliometric Analysis. Int. J. Oper. Res. 2020, 1. [Google Scholar] [CrossRef]
- Daraio, C.; Kerstens, K.; Nepomuceno, T.; Sickles, R.C. Empirical surveys of frontier applications: A meta-review. Int. Trans. Oper. Res. 2020, 27, 709–738. [Google Scholar] [CrossRef] [Green Version]
- Rashidi, K.; Cullinane, K. A comparison of fuzzy DEA and fuzzy TOPSIS in sustainable supplier selection: Implications for sourcing strategy. Expert Syst. Appl. 2019, 121, 266–281. [Google Scholar] [CrossRef]
- Chin-Nung, L. Applying fuzzy-MSGP approach for supplier evaluation and selection in food industry. Afr. J. Agric. Res. 2012, 7, 726–740. [Google Scholar] [CrossRef]
- Wang, C.-N.; Nhieu, N.-L.; Tran, T.T.T. Stochastic Chebyshev Goal Programming Mixed Integer Linear Model for Sustainable Global Production Planning. Mathematics 2021, 9, 483. [Google Scholar] [CrossRef]
- How to Find Vietnam Clothing and Apparel Manufacturers. 2020. Available online: https://www.cosmosourcing.com/blog/clothing-manufacturing-vietnam-2020 (accessed on 22 January 2021).
- Çebi, F.; Bayraktar, D. An integrated approach for supplier selection. Logist. Inf. Manag. 2003, 16, 395–400. [Google Scholar] [CrossRef]
- Prusak, A.; Stefanów, P.; Niewczas, M.; Sikora, T. Application of The AHP in Evaluation and Selection of Suppliers. In Proceedings of the 57th EOQ Congress, Tallinn, Estonia, 17–20 June 2013; pp. 1–9. [Google Scholar]
- Dursun, M.; Karsak, E.E. A QFD-based fuzzy MCDM approach for supplier selection. Appl. Math. Model. 2013, 37, 5864–5875. [Google Scholar] [CrossRef]
- Karsak, E.E.; Dursun, M. An integrated fuzzy MCDM approach for supplier evaluation and selection. Comput. Ind. Eng. 2015, 82, 82–93. [Google Scholar] [CrossRef]
- Banaeian, N.; Mobli, H.; Nielsen, I.E.; Omid, M. Criteria definition and approaches in green supplier selection—A case study for raw material and packaging of food industry. Prod. Manuf. Res. 2015, 3, 149–168. [Google Scholar] [CrossRef]
- Jing, L.S. Supplier selection ranking using MCDM approach in the textile industries. Int. J. Appl. Optim. Stud. 2018, 1, 25–38. [Google Scholar]
- Bakhat, R.; Rajaa, M. Developing a novel Grey integrated multi-criteria approach for enhancing the supplier selection procedure: A real-world case of Textile Company. Decis. Sci. Lett. 2019, 8, 211–224. [Google Scholar] [CrossRef]
- Li, Y.; Diabat, A.; Lu, C.-C. Leagile supplier selection in Chinese textile industries: A DEMATEL approach. Ann. Oper. Res. 2019, 287, 303–322. [Google Scholar] [CrossRef]
- Ulutaş, A. Supplier Selection by Using a Fuzzy Integrated Model for a Textile Company. Eng. Econ. 2019, 30, 579–590. [Google Scholar] [CrossRef] [Green Version]
- Nakiboglu, G.; Bulgurcu, B. Supplier selection in a Turkish textile company by using intuitionistic fuzzy decision-making. J. Text. Inst. 2020, 112, 322–332. [Google Scholar] [CrossRef]
- Govindan, K.; Mina, H.; Esmaeili, A.; Gholami-Zanjani, S.M. An Integrated Hybrid Approach for Circular supplier selection and Closed loop Supply Chain Network Design under Uncertainty. J. Clean. Prod. 2020, 242, 118317. [Google Scholar] [CrossRef]
- Yang, Y.; Wang, Y. Supplier Selection for the Adoption of Green Innovation in Sustainable Supply Chain Management Practices: A Case of the Chinese Textile Manufacturing Industry. Processes 2020, 8, 717. [Google Scholar] [CrossRef]
- Ulutaş, A.; Stanujkic, D.; Karabasevic, D.; Popovic, G.; Zavadskas, E.K.; Smarandache, F.; Brauers, W.K.M. Developing of a Novel Integrated MCDM MULTIMOOSRAL Approach for Supplier Selection. Informatica 2021, 32, 145–161. [Google Scholar] [CrossRef]
- Ravi, V.; Shankar, R.; Tiwari, M.K. Analyzing alternatives in reverse logistics for end-of-life computers: ANP and balanced scorecard approach. Comput. Ind. Eng. 2005, 48, 327–356. [Google Scholar] [CrossRef]
- Lee, S.K.; Mogi, G.; Lee, S.K.; Hui, K.S.; Kim, J.W. Econometric analysis of the R&D performance in the national hydrogen energy technology development for measuring relative efficiency: The fuzzy AHP/DEA integrated model approach. Int. J. Hydrogen Energy 2010, 35, 2236–2246. [Google Scholar]
- Jayant, A.; Gupta, P.; Garg, S.K.; Khan, M. TOPSIS-AHP Based Approach for Selection of Reverse Logistics Service Provider: A Case Study of Mobile Phone Industry. Procedia Eng. 2014, 97, 2147–2156. [Google Scholar] [CrossRef] [Green Version]
- Mangla, S.K.; Kumar, P.; Barua, M.K. Risk analysis in green supply chain using fuzzy AHP approach: A case study. Resour. Conserv. Recycl. 2015, 104, 375–390. [Google Scholar] [CrossRef]
- Bouzon, M.; Govindan, K.; Rodriguez, C.M.T.; Campos, L.M.S. Identification and analysis of reverse logistics barriers using fuzzy Delphi method and AHP. Resour. Conserv. Recycl. 2016, 108, 182–197. [Google Scholar] [CrossRef]
- Li, X.; Liu, Y.; Wang, Y.; Gao, Z. Evaluating transit operator efficiency: An enhanced DEA model with constrained fuzzy-AHP cones. J. Traffic Transp. Eng. 2016, 3, 215–225. [Google Scholar] [CrossRef] [Green Version]
- Otay, İ.; Oztaysi, B.; Onar, S.C.; Kahraman, C. Multi-expert performance evaluation of healthcare institutions using an integrated intuitionistic fuzzy AHP&DEA methodology. Knowl. Based Syst. 2017, 133, 90–106. [Google Scholar]
- Mushtaq, F.; Shafiq, M.; Savino, M.M.; Khalid, T.; Menanno, M.; Fahad, A. Reverse Logistics Route Selection Using AHP: A Case Study of Electronics Scrap from Pakistan. In Advances in Production Management Systems. Production Management for Data-Driven, Intelligent, Collaborative, and Sustainable Manufacturing; Springer: Cham, Switzerland, 2018; pp. 3–10. [Google Scholar]
- Suganthi, L. Multi expert and multi criteria evaluation of sectoral investments for sustainable development: An integrated fuzzy AHP, VIKOR/DEA methodology. Sustain. Cities Soc. 2018, 43, 144–156. [Google Scholar] [CrossRef]
- Azimifard, A.; Moosavirad, S.H.; Ariafar, S. Selecting sustainable supplier countries for Iran’s steel industry at three levels by using AHP and TOPSIS methods. Resour. Policy 2018, 57, 30–44. [Google Scholar] [CrossRef]
- Wang, C.-N.; Zheng, T.-C.; Duong, D.; van Thanh, N. An Application of The Intergrated FANP-DEA Model in Supplier Selection. In Proceedings of the 2019 International Conference on Logistics and Industrial Engineering, Hochiminh City, Vietnam, 30 August 2019. [Google Scholar]
- Ghavami, S.M.; Borzooei, Z.; Maleki, J. An effective approach for assessing risk of failure in urban sewer pipelines using a combination of GIS and AHP-DEA. Process. Saf. Environ. Prot. 2020, 133, 275–285. [Google Scholar] [CrossRef]
- Liu, Y.; Eckert, C.M.; Earl, C. A review of fuzzy AHP methods for decision-making with subjective judgements. Exp. Syst. Appl. 2020, 161, 113738. [Google Scholar] [CrossRef]
- Solangi, Y.A.; Longsheng, C.; Shah, S.A.A. Assessing and overcoming the renewable energy barriers for sustainable development in Pakistan: An integrated AHP and fuzzy TOPSIS approach. Renew. Energy 2021, 173, 209–222. [Google Scholar] [CrossRef]
- Tavana, M.; Zareinejad, M.; Santos-Arteaga, F.J.; Kaviani, M.A. A conceptual analytic network model for evaluating and selecting third-party reverse logistics providers. Int. J. Adv. Manuf. Technol. 2016, 86, 1705–1721. [Google Scholar] [CrossRef]
- Oztaysi, B. A decision model for information technology selection using AHP integrated TOPSIS-Grey: The case of content management systems. Knowl. Based Syst. 2014, 70, 44–54. [Google Scholar] [CrossRef]
- Mousavi-Nasab, S.H.; Sotoudeh-Anvari, A. A comprehensive MCDM-based approach using TOPSIS, COPRAS and DEA as an auxiliary tool for material selection problems. Mater. Des. 2017, 121, 237–253. [Google Scholar] [CrossRef]
- Zarbakhshnia, N.; Soleimani, H.; Ghaderi, H. Sustainable third-party reverse logistics provider evaluation and selection using fuzzy SWARA and developed fuzzy COPRAS in the presence of risk criteria. Appl. Soft Comput. 2018, 65, 307–319. [Google Scholar] [CrossRef]
- Wang, C.-N.; Nhieu, N.-L.; Chung, Y.-C.; Pham, H.-T. Multi-Objective Optimization Models for Sustainable Perishable Intermodal Multi-Product Networks with Delivery Time Window. Mathematics 2021, 9, 379. [Google Scholar] [CrossRef]
- Zarei, E.; Ramavandi, B.; Darabi, A.H.; Omidvar, M. A framework for resilience assessment in process systems using a fuzzy hybrid MCDM model. J. Loss Prev. Process. Ind. 2021, 69, 104375. [Google Scholar] [CrossRef]
- Wang, P.; Zhu, Z.; Wang, Y. A novel hybrid MCDM model combining the SAW, TOPSIS and GRA methods based on experimental design. Inf. Sci. 2016, 345, 27–45. [Google Scholar] [CrossRef]
- Çifçi, G.; Büyüközkan, G. A Fuzzy MCDM Approach to Evaluate Green Suppliers. Int. J. Comput. Intell. Syst. 2011, 4, 894–909. [Google Scholar] [CrossRef]
- Wang, Z.; Hao, H.; Gao, F.; Zhang, Q.; Zhang, J.; Zhou, Y. Multi-attribute decision making on reverse logistics based on DEA-TOPSIS: A study of the Shanghai End-of-life vehicles industry. J. Clean. Prod. 2019, 214, 730–737. [Google Scholar] [CrossRef]
- Ebrahimi, B.; Tavana, M.; Toloo, M.; Charles, V. A novel mixed binary linear DEA model for ranking decision-making units with preference information. Comput. Ind. Eng. 2020, 149, 106720. [Google Scholar] [CrossRef]
- de Carvalho, V.D.H.; Poleto, T.; Nepomuceno, T.C.C.; Costa, A.P.P.C.S. A study on relational factors in information technology outsourcing: Analyzing judgments of small and medium-sized supplying and contracting companies’ managers. J. Bus. Ind. Mark. 2021. ahead of print. [Google Scholar]
- Charnes, A.; Cooper, W.W.; Rhodes, E. Measuring the efficiency of decision making units. Eur. J. Oper. Res. 1978, 2, 429–444. [Google Scholar] [CrossRef]
- Banker, R.D.; Charnes, A.; Cooper, W.W. Some Models for Estimating Techinical and Scale Inefficiencies in Data Envelopment Analysis. Manag. Sci. 1984, 30, 1078–1092. [Google Scholar] [CrossRef] [Green Version]
- Tone, K. A Slacks-based Measure of Efficiency in Data Envelopment Analysis. Eur. J. Oper. Res. 2001, 130, 498–509. [Google Scholar] [CrossRef] [Green Version]
- Tone, K. A Slacks-based Measure of Super-Efficiency in Data Envelopment Analysis. Eur. J. Oper. Res. 2002, 143, 32–41. [Google Scholar] [CrossRef] [Green Version]
- Lu, W.-M.; Hung, S.-W. Evaluating profitability and marketability of Taiwan’s IC fabless firms: An DEA approach. J. Sci. Ind. Res. 2009, 68, 851–857. [Google Scholar]
- Jiang, Y.-Y.; Li, L.-X.; Li, E.-Y. Analysis on the Efficiency of Real Estate Industry Based on DEA in Ningbo City. In Proceedings of the 2010 International Conference on Management Science & Engineering 17th Annual Conference, Melbourne, Australia, 24–26 November 2010; pp. 1632–1637. [Google Scholar]
- Li, M.-D.; Ge, H.; Guo, Y.-W.; Ming-Di, L.; Hong, G.; Yu-Wei, G. Efficiency of Listed Real Estate Companies in China Based on the Two-Stage DEA. In Proceedings of the 2014 International Conference on Management Science & Engineering 21th Annual Conference Proceedings, Helsinki, Finland, 17–19 August 2014; pp. 1313–1318. [Google Scholar]
- Chen, Q.; Li, F. Empirical Analysis on Efficiency of Listed Real Estate Companies in China by DEA. iBusiness 2017, 9, 49–59. [Google Scholar] [CrossRef] [Green Version]
- Russell, M. Textile Workers in Developing Countries and the European Fashion Industry: Towards Sustainability? European Parliament: Brussels, Belgium, 2020. [Google Scholar]
- Kim, J.-O.; Traore, M.K.; Warfield, C. The Textile and Apparel Industry in Developing Countries. Text. Prog. 2006, 38, 1–64. [Google Scholar] [CrossRef]
- Khan, S.R.; Dhar, D.; Navaid, M.; Pradhananga, M.; Siddique, F.; Singh, A.; Yanthrawaduge, S. Export Success and Industrial Linkages: The Case of Readymade Garments in South Asia; Palgrave Macmillan: New York, NY, USA, 2009; pp. 1–191. [Google Scholar]
- Saaty, T.L. The Analytic Hierarchy Process; McGrawHill: New York, NY, USA, 1980. [Google Scholar]


| No. | Authors | Year | Criteria | ||||||
|---|---|---|---|---|---|---|---|---|---|
| Cost | Quality | Logistics Service | Production/Sale Service | Technology | Business/Branding Management | Environmental Production System | |||
| 1 | Çebi and Bayraktar [14] | 2003 | X | X | X | ||||
| 2 | Shen J. et al. [6] | 2012 | X | X | X | X | X | X | |
| 3 | Prusak et al. [15] | 2013 | X | X | X | X | X | ||
| 4 | Dursun, M. and Karsak, E.E. [16] | 2013 | X | X | X | X | |||
| 5 | Karsak, E.E. and Dursun, M. [17] | 2015 | X | X | X | X | |||
| 6 | Banaeian, N. et al. [18] | 2015 | X | X | X | X | |||
| 7 | Jing, S.L. [19] | 2018 | X | X | X | X | |||
| 8 | Nong, N.-M.T., and Ho, P.T. [3] | 2019 | X | X | X | X | X | ||
| 9 | Bakhat, R. and Rajaa, M. [20] | 2019 | X | X | X | X | |||
| 10 | Li, Y. et al. [21] | 2019 | X | X | X | X | X | ||
| 11 | Ulutaş, A. [22] | 2019 | X | X | X | X | X | ||
| 12 | Nakiboglu, G. and Bulgurcu, B. [23] | 2020 | X | X | X | X | |||
| 13 | Govindan, K. et al. [24] | 2020 | X | X | X | ||||
| 14 | Yang, Y. and Wang, Y. [25] | 2020 | X | X | X | X | X | ||
| 15 | Ulutaş, A. et al. [26] | 2021 | X | X | X | X | |||
| No. | Authors | Year | Methods | |||||
|---|---|---|---|---|---|---|---|---|
| AHP | ANP | TOPSIS | Other MCDM | DEA | Mathematical Model | |||
| 1 | Çebi and Bayraktar [14] | 2003 | X | |||||
| 2 | Ravi, V. et al. [27] | 2005 | X | X | ||||
| 3 | Lee et al. [28] | 2010 | X | X | ||||
| 4 | Chin-Nung, Liao [11] | 2012 | X | X | ||||
| 5 | Shen et al. [6] | 2012 | X | X | ||||
| 6 | Prusak et al. [15] | 2013 | X | |||||
| 7 | Yu et al. [5] | 2013 | X | X | ||||
| 8 | Jayant, A. et al. [29] | 2014 | X | X | ||||
| 9 | Taylan et al. [4] | 2014 | X | X | ||||
| 10 | Oztaysi, B. [42] | 2014 | X | X | ||||
| 11 | Tavana, M. et al. [41] | 2015 | X | X | ||||
| 12 | Banaeian, N. et al. [18] | 2015 | X | X | ||||
| 13 | Mangla et al. [30] | 2015 | X | |||||
| 14 | Bouzon, M. et al. [31] | 2016 | X | |||||
| 15 | Li et al. [32] | 2016 | X | X | ||||
| 16 | Otay et al. [33] | 2017 | X | X | ||||
| 17 | Mousavi-Nasab et al. [43] | 2017 | X | X | X | |||
| 18 | Zarbakhshnia et al. [44] | 2018 | X | |||||
| 19 | Mushtaq, F. et al. [34] | 2018 | X | |||||
| 20 | Suganthi, L. et al. [35] | 2018 | X | X | X | |||
| 21 | Azimifard et al. [36] | 2018 | X | X | ||||
| 22 | Wang et al. [37] | 2019 | X | X | X | |||
| 23 | Govindan, K. et al. [24] | 2019 | X | X | ||||
| 24 | Rashidi et al. [10] | 2019 | X | X | ||||
| 25 | Wang et al. [49] | 2019 | X | X | ||||
| 26 | Ebrahimi et al. [50] | 2020 | X | |||||
| 27 | Ghavami et al. [38] | 2020 | X | X | ||||
| 28 | Liu et al. [39] | 2020 | X | X | ||||
| 29 | Solangi et al. [40] | 2021 | X | X | ||||
| 30 | Carvalho et al. [51] | 2021 | X | |||||
| 31 | This paper | 2021 | X | X | X | |||
| Importance Intensity | Definition | Triangular Fuzzy Number |
|---|---|---|
| 1 | Equal importance | (1, 1, 1) |
| 2 | Lightly importance | (1, 2, 3) |
| 3 | Weak importance | (2, 3, 4) |
| 4 | Preferable | (3, 4, 5) |
| 5 | Importance | (4, 5, 6) |
| 6 | Fairly importance | (5, 6, 7) |
| 7 | Highly importance | (6, 7, 8) |
| 8 | Strongly importance | (7, 8, 9) |
| 9 | Extremely importance | (8, 9, 9) |
| Linguistic Evaluation Levels | Triangular Fuzzy Number |
|---|---|
| Too poor | (1, 1, 1) |
| Very poor | (1, 2, 3) |
| Poor | (2, 3, 4) |
| Bad | (3, 4, 5) |
| Medium | (4, 5, 6) |
| Rather | (5, 6, 7) |
| Good | (6, 7, 8) |
| Very good | (7, 8, 9) |
| Perfect | (8, 9, 9) |
| Authors | Year | Input Factors | Output Factors |
|---|---|---|---|
| Hung and Lu [56] | 2009 | Equity Assets Employees | Profit Revenue EPS |
| Yuan et al. [57] | 2010 | Salary Investments Staff | Sales volume Total revenue |
| Li, M.-D. et al. [58] | 2014 | Total assets Costs Total operating | Operating income Earnings per share Net profit |
| Chen and Li [59] | 2017 | Business costs Number of workers Total assets | Corporate income Return on equity Gross profit |
| Correlation Coefficient | Degree |
|---|---|
| >0.8 | Very high |
| 0.6–0.8 | High |
| 0.4–0.6 | Medium |
| 0.2–0.4 | Low |
| <0.2 | Very Low |
| Criteria | C1 | C2 | C3 | C4 |
|---|---|---|---|---|
| C1 | (1, 1, 1) | (5, 6, 7) | (7, 8, 9) | (7, 8, 9) |
| C2 | (1/7, 1/6, 1/5) | (1, 1, 1) | (3, 4, 5) | (3, 4, 5) |
| C3 | (1/9, 1/8, 1/7) | (1/5, 1/4, 1/3) | (1, 1, 1) | (1, 2, 3) |
| C4 | (1/7, 1/8, 1/9) | (1/5, 1/4, 1/3) | (1/3, 1/2, 1) | (1, 1, 1) |
| Criteria | C1 | C2 | C3 | C4 |
|---|---|---|---|---|
| C1 | 1 | 5.916 | 7.937 | 7.937 |
| C2 | 0.169 | 1 | 3.873 | 3.873 |
| C3 | 0.126 | 0.258 | 1 | 1.732 |
| C4 | 0.126 | 0.258 | 0.577 | 1 |
| 1.421 | 7.433 | 13.388 | 14.542 |
| Criteria | C1 | C2 | C3 | C4 | Priority Vector |
|---|---|---|---|---|---|
| C1 | 0.704 | 0.796 | 0.593 | 0.546 | 0.660 |
| C2 | 0.119 | 0.135 | 0.289 | 0.266 | 0.202 |
| C3 | 0.089 | 0.035 | 0.075 | 0.119 | 0.079 |
| C4 | 0.089 | 0.035 | 0.043 | 0.069 | 0.059 |
| Criteria | Geometric Mean |
|---|---|
| C1 | (3.956, 4.427, 4.880) |
| C2 | (1.065, 1.278, 1.495) |
| C3 | (0.386, 0.500, 0.615) |
| C4 | (0.293, 0.354, 0.467) |
| SUM | (5.701, 6.558, 7.457) |
| SUM−1 | (0.134, 0.152, 0.175) |
| Criteria | Fuzzy Weight |
|---|---|
| C1 | (0.531, 0.675, 0.856) |
| C2 | (0.143, 0.195, 0.262) |
| C3 | (0.052, 0.076, 0.108) |
| C4 | (0.039, 0.054, 0.082) |
| Criteria | Fuzzy Weight | Sub-Criteria | Fuzzy Weight |
|---|---|---|---|
| C1 | (0.531, 0.675, 0.856) | C1-1 | (0.324, 0.550, 0.856) |
| C1-2 | (0.242, 0.368, 0.625) | ||
| C1-3 | (0.059, 0.082, 0.120) | ||
| C2 | (0.143, 0.195, 0.262) | C2-1 | (0.540, 0.707, 0.916) |
| C2-2 | (0.165, 0.223, 0.305) | ||
| C2-3 | (0.055, 0.070, 0.093) | ||
| C3 | (0.052, 0.076, 0.108) | C3-1 | (0.507, 0.682, 0.905) |
| C3-2 | (0.173, 0.236, 0.328) | ||
| C3-3 | (0.063, 0.082, 0.112) | ||
| C4 | (0.039, 0.054, 0.082) | C4-1 | (0.562, 0.709, 0.872) |
| C4-2 | (0.181, 0.231, 0.309) | ||
| C4-3 | (0.052, 0.06, 0.077) |
| Sub-Criteria | Direction | Final Fuzzy Weight |
|---|---|---|
| C1-1 | Minimize | (0.172, 0.371, 0.733) |
| C1-2 | Minimize | (0.128, 0.248, 0.535) |
| C1-3 | Maximize | (0.031, 0.055, 0.103) |
| C2-1 | Maximize | (0.077, 0.138, 0.240) |
| C2-2 | Maximize | (0.024, 0.043, 0.080) |
| C2-3 | Minimize | (0.008, 0.014, 0.024) |
| C3-1 | Minimize | (0.026, 0.052, 0.098) |
| C3-2 | Maximize | (0.009, 0.018, 0.035) |
| C3-3 | Minimize | (0.003, 0.006, 0.012) |
| C4-1 | Maximize | (0.022, 0.038, 0.071) |
| C4-2 | Minimize | (0.007, 0.012, 0.025) |
| C4-3 | Minimize | (0.002, 0.003, 0.006) |
| DMU | Ideal Gap | Negative Ideal Gap | Relative Gaps-Degree |
|---|---|---|---|
| A&TOM-01 | 0.125 | 0.122 | 0.495 |
| A&TOM-02 | 0.127 | 0.156 | 0.55 |
| A&TOM-03 | 0.135 | 0.116 | 0.46 |
| A&TOM-04 | 0.133 | 0.186 | 0.582 |
| A&TOM-05 | 0.173 | 0.141 | 0.449 |
| A&TOM-06 | 0.072 | 0.173 | 0.706 |
| A&TOM-07 | 0.091 | 0.179 | 0.663 |
| A&TOM-08 | 0.034 | 0.219 | 0.867 |
| A&TOM-09 | 0.191 | 0.053 | 0.216 |
| A&TOM-10 | 0.180 | 0.087 | 0.327 |
| A&TOM-11 | 0.208 | 0.053 | 0.204 |
| A&TOM-12 | 0.074 | 0.196 | 0.725 |
| A&TOM-13 | 0.201 | 0.054 | 0.212 |
| A&TOM-14 | 0.157 | 0.125 | 0.443 |
| A&TOM-15 | 0.090 | 0.165 | 0.648 |
| DMU | Relative Gaps-Degree | Average Relative Gaps-Degree | |||
|---|---|---|---|---|---|
| Decision Maker 1 | Decision Maker 2 | … | Decision Maker 20 | ||
| A&TOM-01 | 0.564 | 0.504 | … | 0.495 | 0.479 |
| A&TOM-02 | 0.505 | 0.302 | … | 0.550 | 0.465 |
| A&TOM-03 | 0.538 | 0.560 | … | 0.460 | 0.542 |
| A&TOM-04 | 0.539 | 0.394 | … | 0.582 | 0.59 |
| A&TOM-05 | 0.322 | 0.199 | … | 0.449 | 0.482 |
| A&TOM-06 | 0.570 | 0.506 | … | 0.706 | 0.492 |
| A&TOM-07 | 0.553 | 0.506 | … | 0.663 | 0.447 |
| A&TOM-08 | 0.608 | 0.439 | … | 0.867 | 0.602 |
| A&TOM-09 | 0.723 | 0.764 | … | 0.216 | 0.51 |
| A&TOM-10 | 0.552 | 0.560 | … | 0.327 | 0.521 |
| A&TOM-11 | 0.331 | 0.418 | … | 0.204 | 0.385 |
| A&TOM-12 | 0.109 | 0.361 | … | 0.725 | 0.488 |
| A&TOM-13 | 0.552 | 0.495 | … | 0.212 | 0.435 |
| A&TOM-14 | 0.816 | 0.613 | … | 0.443 | 0.544 |
| A&TOM-15 | 0.391 | 0.376 | … | 0.648 | 0.506 |
| Input | Output | |||
|---|---|---|---|---|
| DMU | TA | CGS | GP | EP |
| A&TOM-01 | 2,849,534 | 2,976,423 | 620,183 | 0.478888 |
| A&TOM-02 | 751,665 | 548,469 | 103,532 | 0.465032 |
| A&TOM-03 | 593,077 | 1,353,033 | 261,845 | 0.541631 |
| A&TOM-04 | 2,820,761 | 2,708,641 | 63,57 | 0.590117 |
| A&TOM-05 | 1,272,238 | 1,222,601 | 202,328 | 0.481764 |
| A&TOM-06 | 921,297 | 813,050 | 103,377 | 0.492412 |
| A&TOM-07 | 347,846 | 252,525 | 49,149 | 0.446507 |
| A&TOM-08 | 2,977,976 | 1,585,016 | 469,328 | 0.601649 |
| A&TOM-09 | 1,215,003 | 1,807,548 | 115,294 | 0.509697 |
| A&TOM-10 | 10,013 | 106,533 | 12,670 | 0.520968 |
| A&TOM-11 | 611,927 | 537,551 | 158,247 | 0.384776 |
| A&TOM-12 | 13,082 | 217,738 | 859 | 0.487503 |
| A&TOM-13 | 457,318 | 653,648 | 219,147 | 0.434678 |
| A&TOM-14 | 195,698 | 394,735 | 75,808 | 0.544012 |
| A&TOM-15 | 989,736 | 622,793 | 206,520 | 0.505728 |
| TA | CGS | TR | GP | EP | |
|---|---|---|---|---|---|
| TA | 1 | 0.880857 | 0.997829 | 0.687256 | 0.480023 |
| CS | 0.817037 | 0.690424 | 0.820937 | 0.793349 | 0.346464 |
| CGS | 0.880857 | 1 | 0.892835 | 0.620686 | 0.40558 |
| GP | 0.687256 | 0.620686 | 0.697232 | 1 | 0.121578 |
| EP | 0.480023 | 0.40558 | 0.475781 | 0.121578 | 1 |
| Supplier | CCR-I | CCR-O | BCC-I | BCC-O | SBM-I-C | SBM-O-C | Super SBM-I-C | Super SBM-I-V | Super SBM-O-C |
|---|---|---|---|---|---|---|---|---|---|
| A&TOM-01 | 11 | 11 | 1 | 1 | 9 | 14 | 9 | 7 | 14 |
| A&TOM-02 | 10 | 10 | 12 | 15 | 11 | 8 | 11 | 13 | 8 |
| A&TOM-03 | 6 | 6 | 1 | 1 | 4 | 10 | 4 | 13 | 8 |
| A&TOM-04 | 15 | 15 | 9 | 8 | 15 | 15 | 15 | 9 | 15 |
| A&TOM-05 | 12 | 12 | 13 | 13 | 12 | 11 | 12 | 12 | 11 |
| A&TOM-06 | 13 | 13 | 14 | 12 | 13 | 9 | 13 | 14 | 9 |
| A&TOM-07 | 7 | 7 | 10 | 14 | 10 | 4 | 10 | 11 | 4 |
| A&TOM-08 | 5 | 5 | 1 | 1 | 7 | 7 | 7 | 4 | 7 |
| A&TOM-09 | 14 | 14 | 15 | 11 | 14 | 12 | 14 | 15 | 12 |
| A&TOM-10 | 1 | 1 | 1 | 1 | 1 | 1 | 1 | 1 | 1 |
| A&TOM-11 | 4 | 4 | 8 | 10 | 6 | 5 | 6 | 8 | 5 |
| A&TOM-12 | 9 | 9 | 11 | 9 | 8 | 13 | 8 | 10 | 13 |
| A&TOM-13 | 1 | 1 | 1 | 1 | 1 | 1 | 2 | 5 | 2 |
| A&TOM-14 | 8 | 8 | 1 | 1 | 5 | 6 | 5 | 2 | 6 |
| A&TOM-15 | 1 | 1 | 1 | 1 | 1 | 1 | 3 | 6 | 3 |
Publisher’s Note: MDPI stays neutral with regard to jurisdictional claims in published maps and institutional affiliations. |
© 2021 by the authors. Licensee MDPI, Basel, Switzerland. This article is an open access article distributed under the terms and conditions of the Creative Commons Attribution (CC BY) license (https://creativecommons.org/licenses/by/4.0/).
Share and Cite
Wang, C.-N.; Pham, T.-D.T.; Nhieu, N.-L. Multi-Layer Fuzzy Sustainable Decision Approach for Outsourcing Manufacturer Selection in Apparel and Textile Supply Chain. Axioms 2021, 10, 262. https://doi.org/10.3390/axioms10040262
Wang C-N, Pham T-DT, Nhieu N-L. Multi-Layer Fuzzy Sustainable Decision Approach for Outsourcing Manufacturer Selection in Apparel and Textile Supply Chain. Axioms. 2021; 10(4):262. https://doi.org/10.3390/axioms10040262
Chicago/Turabian StyleWang, Chia-Nan, Thuy-Duong Thi Pham, and Nhat-Luong Nhieu. 2021. "Multi-Layer Fuzzy Sustainable Decision Approach for Outsourcing Manufacturer Selection in Apparel and Textile Supply Chain" Axioms 10, no. 4: 262. https://doi.org/10.3390/axioms10040262
APA StyleWang, C.-N., Pham, T.-D. T., & Nhieu, N.-L. (2021). Multi-Layer Fuzzy Sustainable Decision Approach for Outsourcing Manufacturer Selection in Apparel and Textile Supply Chain. Axioms, 10(4), 262. https://doi.org/10.3390/axioms10040262