Article

A Decision Support Model for Measuring Technological Progress and Productivity Growth: The Case of Commercial Banks in Vietnam

by
Chia-Nan Wang
1,*,
Ngoc-Ai-Thy Nguyen
1,*,
Thanh-Tuan Dang
1,2,* and
Thi-Thuy-Quynh Trinh
1
1
Department of Industrial Engineering and Management, National Kaohsiung University of Science and Technology, Kaohsiung 80778, Taiwan
2
Department of Logistics and Supply Chain Management, Hong Bang International University, Ho Chi Minh 723000, Vietnam
*
Authors to whom correspondence should be addressed.
Axioms 2021, 10(3), 131; https://doi.org/10.3390/axioms10030131
Submission received: 18 May 2021 / Revised: 4 June 2021 / Accepted: 22 June 2021 / Published: 24 June 2021

Abstract

:
The interactive relationship between the banking system and enterprise makes up the role that affects a national economy. Significantly, the relationship between banking and technology has become tighter over the past few decades. An assessment of bank performance is critical for understanding their position and provides valuable information to practitioners. In this paper, we assess the performance of the top 18 commercial banks in Vietnam during 2015–2019. The assessment utilizes two data envelopment analysis (DEA) models while involving the banks’ performance in six dimensions, including assets, deposits, operating expenses, liabilities as inputs, while treating loans and net income as outputs. Using the Malmquist measurement, the total productivity growth indexes of the banks are obtained, which are decomposed into technical and technological evolutions. Window analysis is used to compute the efficiencies of the banks in every single year in 2015–2019. From the results of Malmquist, most banks are found to decrease their Malmquist productivity indexes from 2015 to 2019, wherein both of their technical and technological indexes declined. Window analysis indicates B6-SHBank, B1-Vietinbank, and B18-PetrolimexGroup as the most efficient banks during 2015–2019, and in the interim, B16-BaoVietBank, B11-NationalCitizen, and B13-VietnamMaritime ranked on the bottom line. The managerial implications of this research help to reflect the comprehensive insights of the top Vietnamese commercial bank performance and offer a strategic guideline for decision-makers toward sustainable development in the banking industry.

1. Introduction

In response to the impacts of the COVID-19 crisis and the global economic recession, countries are looking to give their economies a much-needed jolt. In this context, financial assistance and supportive policies are implemented via economic stimulus packages to protect enterprises and citizens. The banking sector is a hinge for almost all economic activity. While the banking sector will be negatively affected by the crisis, it is also critical for national economic recovery. Amid this turbulence, the role of banks has been highlighted in recent periods, with the understandable assumption that they will step up to provide financial assistance, not just supporting customers and employees, but society as well.
The Vietnamese banking industry has also witnessed the apparent impact of the COVID-19 crisis. The banking sector was forecasted to have $39.85 billion in debts that were not able to be paid as scheduled due to the effect of COVID-19. The General Department of Statistics reported that the banking system’s credit growth was 0.68 percent in the first quarter of 2019 [1]. This growth rate was held at the lowest from the 2015 to the 2019 period, ranging from 1.25% to 2.81%. For consumer credit, the influence of the COVID-19 would take place in two stages. Since late March 2020, the existing and new loans’ interest rates were decreased by 2%. The banks rescheduled debt to support firms’ survival through the crisis [2]. Banks are improving customer service levels and significantly contributing to the GDP annually. However, the financial experts predicted that most banks would decrease deposit rates and interest rates, rescheduling debt payments as an effect of the crisis. The Vietnamese commercial banking system performs a crucial function in providing credit to enterprises. Therefore, the sustainability development of the Vietnamese banking sector is pivotal to the national economy [3].
In parallel, understanding the major determinants of bank performance during financial crises is crucial for tailoring public policies, regulations, and management practices to recognize and prevent bank problems early. In this context, Assaf et al. [4] indicated in the study that an overlooked factor affecting bank performance during crises is bank efficiency in pre-crisis times. Thus, aiming to estimate bank efficiency, which is used subsequently in panel estimations of the effects of bank efficiency on bank performance, in this paper, we use DEA Malmquist and Window models to study the intertemporal performance of top commercial banks in Vietnam in 2015–2019. To achieve this objective, we decompose the banks’ performance into six aspects, i.e., loans, net income, assets, deposits, operating expenses, and liabilities. To support the involvement of these variables, various related indexes and rankings by experts, researchers, and recent studies in the bank industry were investigated (elaborated in Section 3.2.1). The selection of these dimensions was also based on data obtained from the Vietnam Stock Market database, a reliable website for searching information and data using investment tools and analyzing stocks online to help investors get an insight into market and investment decisions. The operation of banks involves the utilization of resources in multiple dimensions such as assets, deposits, operating expenses, and liabilities (input variables) and generates different types of outputs such as loans and net income. Thus, the evaluation must consider multiple inputs and outputs simultaneously. Moreover, a bank naturally operates as a complex process, and thus the relationship between inputs and outputs has no readily available analytical representation. For these concerns, the data envelopment analysis (DEA) is a suitable approach to assist in this assessment. The adoption of DEA models for bank performance measurements is an active research area [5,6,7,8,9]. From researchers’ and practitioners’ perspectives, DEA can uncover the pattern of efficiency change over time for each bank. The approach is also able to indicate inefficient banks which must be improved further and those banks to be role models for other banks.
We applied the Malmquist index measurement and the Window analysis in DEA to a sample of 18 commercial banks in Vietnam during 2015–2019. We separated the six dimensions into four inputs (assets, deposits, operating expenses, and liabilities) and two outputs (loans and net income) to assess the performance of the banks. The Malmquist model is used to capture the total productivity growth rates of the banks, which discerns the pattern of efficiency change over time. To pin down the cause of efficiency change, we decomposed the banks’ Malmquist indexes into a technical efficiency change (catch-up) and a technological change (frontier-shift), which reflects an individual bank’s evolution driven by its efforts and the entire group’s change driven by prevalent trends. The Window analysis is employed to compute the overall efficiency performance of the banks in every single year during 2015–2019. By using this model, this research takes all six dimensions into account to benchmark the banks’ performance relative to an efficiency frontier. As far as it is known, the performance evaluation of banks’ efficiency at financial indicators, focusing on two pictures of the evaluation process, which are productivity improvement and efficiency performance, has not been widely studied in Vietnam. This research aims to partially fill the gaps found in the existing literature. By using the proposed DEA models, a more robust and comprehensive insight into the Vietnamese banking businesses is provided that can serve as a viable guideline for practitioners to be more aware of their position and situation, in light of devising more effective strategies in efficiency improvement, aiming towards sustainable development in the banking industry.
The rest of the paper is organized as follows. The literature review of relevant previous studies is presented in Section 2. Section 3 explains the methodology approach and study materials. Following that, Section 4 details the case study of Vietnam. Results analysis is provided in Section 5, and Section 6 displays discussions and conclusions.

2. Literature Review

In the management science of efficiency assessment literature, discussing banking performance has been a consistent major concern. Various approaches have been considered in the literature. Concerning the issue in Vietnam, Dang-Thanh [9] utilized a modified DEA window analysis to investigate the Vietnamese banking performance changes from 1990 to 2010. Cuong et al. [10] used the combing model of Fuzzy the Technique for Order of Preference by Similarity to Ideal Solution (FTOPSIS) and the Fuzzy Analytical Hierarchy Process (FAHP) to examine and rank five commercial banks in Vietnam. For other countries and purposes, Tlig et al. [11] applied the two approaches of fuzzy data envelopment analysis in evaluating Tunisian commercial banking performance based on certain crisp and imprecise data. In terms of the aspects considered in the banking assessment, relevant studies investigated the impacts of these following factors: cost and profit efficiency [4], interest expense, operating expense, interest/non-interest revenue, and loans [12], more complex dimensions such as service quality [13] and systemic risk [14], to mention a few. Considering complicated dimensions, the use of Game Theory as a mandatory feature in banking sectors is the only method used to ensure a competitive advantage in the triangle of Customer–Competitors–Product and Service. According to Game Theory assumptions, if a zero-sum game is used, one party’s profit will result in the loss of the other; as a result, banks will face severe and perfect competition, even if they have an oligopolistic structure [15]. Game theory approaches are useful and have been a popular mathematical framework developed to address problems in corporate finance, portfolio management, and investment banking, as carried out in various studies [15,16,17,18,19].
Given a handful of methodologies used in efficiency measurements, DEA is a popular nonparametric assessment approach for relative efficiency and productivity across different regions or time periods based on mathematical programming for benchmarking multi-input and multi-output units. Many forms of DEA have been widely applied to assess the performance of various entities, including countries, cities, industrial sectors, facilities, and companies. For example, Wang et al. [20] introduced a variegated approach by connecting the grey model GM and DEA Window model to approach the efficiency of 16 primary Asia airline organizations. Another study by Wang et al. [21] also used the DEA and Grey model to estimate twenty-four ITC companies of Vietnam’s performance. Novickytė et al. [22] evaluated the performance of the banks in Lithuania and examined bank efficiency in a low-interest-rate environment. Xu et al. [23] used DEA to recommend a framework to estimate the efficiency of securities companies which concerned technical heterogeneity and operational risks. The eco-productivity of 17 European countries was estimated by the Slacks-based measure method by Wang et al. [24] Liu et al. [25] evaluated the efficiency of Taiwanese semiconductor packaging and testing companies from 2000 to 2003. Estache et al. [26] used the Malmquist index method to examine and calculate and disintegrate the innovation efficiency of Mexico’s port system based on infrastructure from 11 main ports from 1996 to 1999. Another application of the Malmquist model showed the efficiency development of the Norwegian Motor Vehicle Inspection Agencies from 1989 to 1991 period. In the study, Odeck et al. [27] calculated the efficiency by DEA and productivity by the Malmquist index. Another study by Huang et al. [28] applied the combination of the DEA Malmquist model and the spatial panel method to discover the role of technological progress in reducing China’s energy concentration. Besides, the Window model in DEA has widely applied in recent research. Chung et al. [29] recommended a solution for long-term effectiveness in productivity and interest gaining. Combining artificial neural networks with the DEA approach, Vlontzos et al. [30] assessed and forecast the greenhouse gas emissions from EU countries’ agricultural production. Halkos et al. [31] combined generalized methods of moments (GMM) estimators and DEA to measure the Kuznets curve of countries’ environmental performance and national revenue. Řepková et al. [32] measured the performance of the Czech banking sector from 2003 to 2012. For assessing the Vietnamese textile and apparel industry, Le and Wang [33] propose an integrated approach using grey prediction–Malmquist–window analysis. The main purpose of this study was to provide an empirical analysis for enterprises by foreseeing future values, measuring the productivity growth of industrial sectors and further detecting the performance trends of companies.
This study aims to utilize two effective DEA models which are the Malmquist model and the Window model to construct a complete and viable evaluation framework devoted to the banking industry’s sustainable development. The practical contribution of this study is the comprehensive insight contributed by solving the case study of 18 commercial banks in Vietnam. Based on the selected indicators, the productivity growth of banks over time is measured by the Malmquist model, consisting of performance change, technological change, and total productivity change. The Window model then computes the efficiency of banking institutes’ performance, including variation by term, window length of the whole period, and window length of three years. The managerial contribution of this study is to support the decision-makers to be aware of their organization’s position in the banking industry to apprehend overall efficiency and productivity. This quantitative method also provides an intensive guideline in the decision-making process with other competitors in the related industries and anywhere else in the world.

3. Materials and Methods

3.1. Research Methodology

The mathematical modeling is applied for measuring the productivity growth, and the Window model is used for ranking the performance in the banking industry. Besides, a case study of the top 18 commercial banks in Vietnam is included. The research methodology is detailed as follows.
Part 1. Research direction: The first part defines the problem in the banking industry while determining the research objective, implementing a literature review to understand relevant previous studies, and building the modeling framework. The research objective is to measure the productivity growth for the period from 2015 to 2019 and to rank the performance of the top 18 commercial banks in Vietnam through a proposed quantitative method. The research is expected to provide an intensive guideline to decision-makers in relevant industries, to support them not only in order to improve their internal performance, but also to consider external competitiveness. Besides a practical contribution, the study is expected to minimize the impact of the global pandemic (i.e., COVID-19) on Vietnam’s banking industry.
Part 2. Research analysis: The selected variables are a critical step before applying the two models in the DEA approach, the Malmquist and Window model in this research. This selection significantly affects the process of the model’s calculation. The number of DMUs is at least twice the total number of inputs and outputs [34]. The paper’s objective is to evaluate the productivity growth and rank the performance position in the banking industry. Hence, according to the financial indicators in the banking management, the proper factors are carefully considered. Four inputs, which are assets, deposits, operating expenses, and liabilities, are selected; moreover, two output factors are loan and net income. Moreover, the correlation relationship among inputs and outputs are tested using Pearson theory before applying these DEA models.
Part 3. Research discussion: In this part, the results of the research will be discussed to meet the research objective. The results of the research are to provide a framework of the mathematical modeling for measuring and ranking the efficiency of the bank’s operation. Besides, a case study of the top 18 commercial banks in Vietnam is applied to demonstrate the model’s effectiveness. Future research is also given in this part.

3.2. Mathematical Modeling Approach

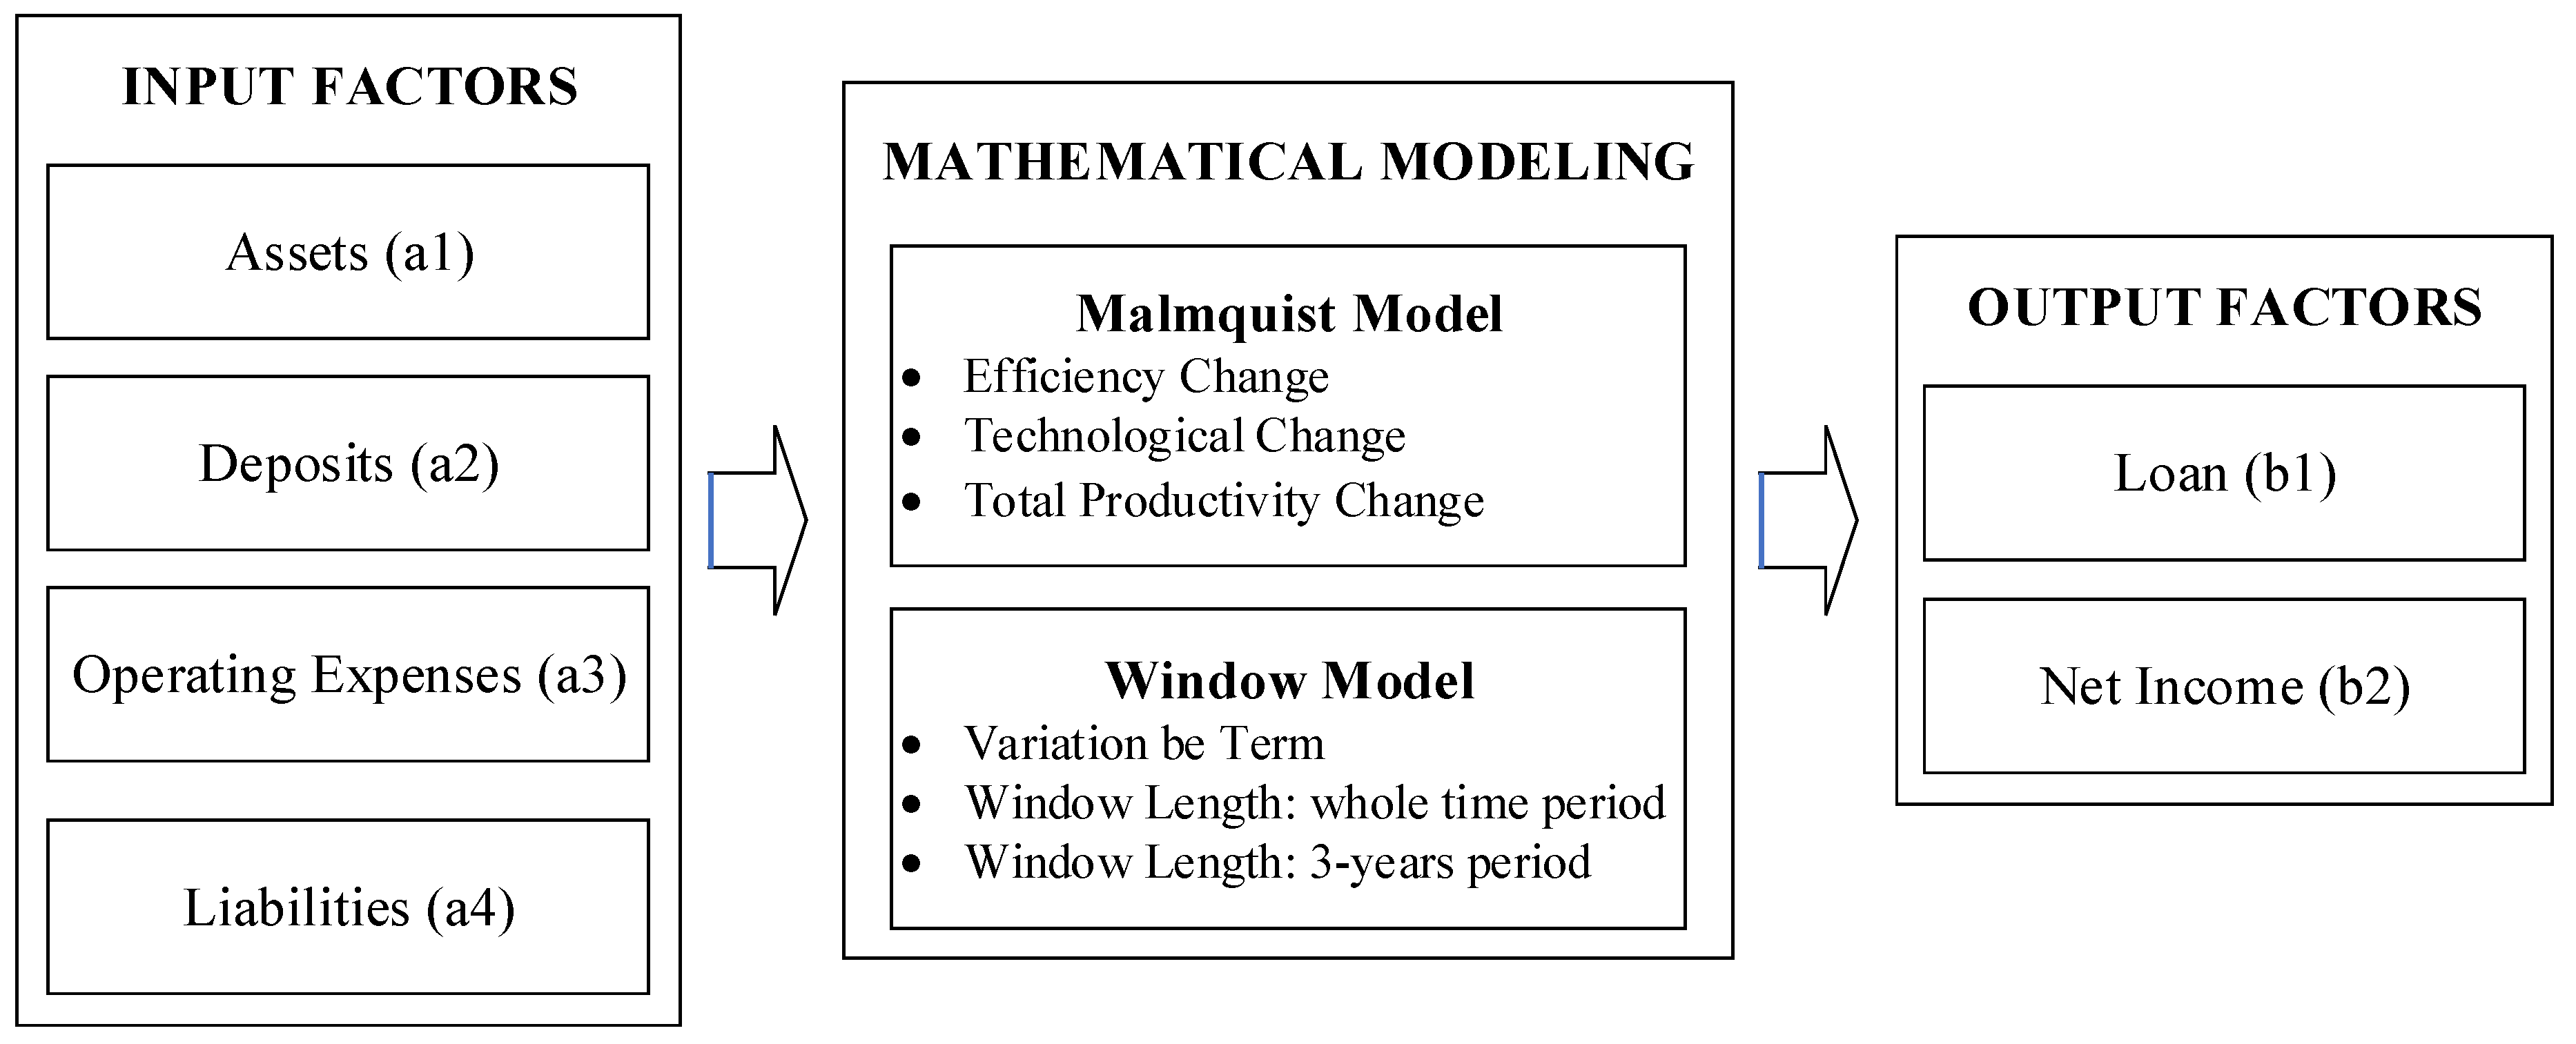
3.2.1. Modeling Framework

Generally, the modeling framework of the research for measuring the productivity growth and ranking the performance of DMUs (i.e., 18 commercial banks in Vietnam), a case study with four inputs and two outputs is presented in Figure 1.
The mathematical modeling consists of two sub-DEA models, which are the Malmquist model, and the Window model. The Malmquist model is used for measuring the productivity growth of banks between two periods based on three indexes, including technical efficiency change, technological change, and total productivity change. In the interim, the Window model is used for ranking the performance of banks over multiple periods, including variation by term, window length of the whole time period, and window length of a 3-year period. Therefore, the research applied this framework to accomplish the paper’s objective.
DEA is a complex method in which the inputs and outputs have a significance on the outcome. According to previous investigations, it is found that the business needs to adjust or reduce inputs while improving or increasing outputs, which are financial indexes [35,36]. Based on the objective of the study and the list of common input and output factors in the performance evaluation of banking systems (Table 1), this paper considers four inputs and two outputs, which are described as follows.
Input factors:
1.
Assets (a1): the amount of the total assets maintained by the bank that can be sold for value (i.e., belongings, interchange assets, customer’s loans, deposits to the headquarter).
2.
Deposits (a2): the total amount of deposits from customers and other banks.
3.
Operating expenses (a3): expenditure incurred by banking firms (i.e., employee compensation and benefits, information technology, legal fees).
4.
Liabilities (a4): a commitment that must eventually be paid (i.e., loans from the headquarter, customer’s deposits, interchange liabilities, non-performing loans).
Output factors:
5.
Loan (b1): referred to as a lending of money by customers, business, or company. It reflects the ability to provide financial services.
6.
Net Income (b2): refer to net interest income of the bank, is calculated by the interest payment on assets minus the interest payment on liabilities.

3.2.2. Pearson Correlation

The Pearson is generally used in previous studies, which describes the linear relationship of two variables, where +1 presents a total positive linear, 0 presents no linear, and −1 presents a total negative linear [33].
Isotropic is an essential DEA data assumption. The relationship between inputs and outputs will be verified before using the DEA model, which means that it should be in a total positive linear relationship. Pearson’s formula (r) of two factors (u) and (v) is calculated as Equation (1) [46].
r u v = Σ i = 1 n u i v i Σ i = 1 n u i Σ i = 1 n v i n ( Σ i = 1 n u i 2 ( Σ i = 1 n u i ) 2 n ) ( Σ i = 1 n v i 2 ( Σ i = 1 n v i ) 2 n )
where n represents sample size; u i , v i are the positions of a particular sample related to i .

3.2.3. DEA Malmquist Model

The catch-up index (C), i.e., technical efficiency, frontier-shift index (F), i.e., technological, and Malmquist Productivity Indicator (MPI), are computed as Equations (2)–(5) [47].
C = d 2 ( ( u i , v i ) 2 ) d 1 ( ( u i , v i ) 1 )
F = [ d 1 ( ( u i , v i ) 1 ) d 2 ( ( u i , v i ) 1 ) × d 1 ( ( u i , v i ) 2 ) d 2 ( ( u i , v i ) 2 ) ] 1 2
M P I = C   x   F = d 2 ( ( u i , v i ) 2 ) d 1 ( ( u i , v i ) 1 ) × [ d 1 ( ( u i , v i ) 1 ) d 2 ( ( u i , v i ) 1 ) × d 1 ( ( u i , v i ) 2 ) d 2 ( ( u i , v i ) 2 ) ] 1 2
M P I = [ d 1 ( ( u i , v i ) 2 ) d 1 ( ( u i , v i ) 1 ) × d 2 ( ( u i , v i ) 2 ) d 2 ( ( u i , v i ) 1 ) ] 1 2
where ( u i 1 , v i 1 ) denotes DMUi at stage 1, ( u i 2 , v i 2 ) denotes DMUi at stage 2, and the efficiency score of the DMUi  ( u i 1 , v i 1 ) t 1 is measured by the technological frontier t 2 : d t 2 ( ( u i , v i ) t 1 ) .
It can be seen from the above equations that the indexes of catch-up, frontier-shift, and Malmquist productivity of DMUi from stage 1 to 2 achieved progress, stable, or regress when the value of catch-up, frontier-shift, and Malmquist productivity is greater than 1, equal to 1, or less than 1, separately.

3.2.4. DEA Window Model

Charnes et al. [35,48] developed the Window model from DEA. The method objective is to measure the trend (i.e., efficiency) of DMUs over a long period with numerous input and output factors in the window length. Window investigation shows how the efficiency is implemented by sequences of overlapping windows. The DEA window approach is described briefly as follows. If D M U n   ( N   is   the   whole   DMUs ;   n = 1 ÷ N ) represents the n-th DMU that has m input variables to create s output variables. Let D M U n t represent the n-th DMU in stage t   ( t = 1 ÷ T ) , then the input and output vectors of D M U n t are represented as A n t and B n t , and are shown as Equations (6) and (7) as follows [29,49].
A n t = [ a n 1 t a n m t ] ,   A n t   denotes   input   vector   of   D M U n t
and
B n t = [ b n 1 t b n s t ] ,   B n t   denotes   output   vector   of   D M U n t
Assume that window begins at the stage k ( 1 k T ) and the window length w ( 1 w T k ) , then the matrix of input variables ( A k w ) and the output variables ( B k w ) of each window ( k w ) are shown in Equations (8) and (9) as follows.
A k w = [ a 1 k a 1 k + 1 a 1 k + w           a 2 k a 2 k + 1 a N k a N k + 1 a 2 k + w a N k + w ]
and
B k w = [ b 1 k b 1 k + 1 b 1 k + w           b 2 k b 2 k + 1 b N k b N k + 1 b 2 k + w b N k + w ]
We replace the variables of D M U n t into Equations (8) and (9) to get the model’s results. The window length w = 3 or w = 4, pointed to achieve the best balance of informativeness and durability of the technical efficiency [32,50]. In this paper, w = 3 is chosen for the calculation.

4. A Case Study

4.1. The Selection of DMUs

This paper concentrates on the operational efficiency evaluation of the top commercial joint-stock banks in Vietnam. They are the 18 commercial banks that have a big influence on the Vietnam banking stock market. In a total of 18 commercial banks, there are nine from Hochiminh Stock Exchange (HOSE), and three from Hanoi Stock Exchange (HNX) [51], as presented in Table 2, below.

4.2. Data Collection

This research used data from 2015 to 2019. The authors considered a variety of input and output factors (i.e., essential financial indexes), which are assets (a1), deposits (a2), operating expenses (a3), liabilities (a4) as inputs; and loans (b1), net income (b2) as outputs. The data source was consolidated from the yearly financial statement report of the top commercial banks in the Vietnam stock market [51]. The unit is measured in millions of US dollars. The statistical data for each year is provided in Table 3.

5. Results Analysis

5.1. Pearson Correlation Coefficient Test

Applying Equation (1), Table 4 shows the Person indicator of the factors for DMUs in 2015, 2016, 2017, 2018, and 2019, respectively. −1 to +1 is considered as a value range of the Pearson correlation coefficient.
Values from 0.8483 to 1 show the positive correlation coefficients, and these input and output factors are found to be extremely correlated, proving them to be proper variables for DEA mode (i.e., Malmquist and Window model). This implies that the collected data meet the isotropic conditions and, hence, can be applied to the proposed approach of this paper.

5.2. Productivity Growth Evaluation

5.2.1. Technical Efficiency Change (Catch-Up Index)

The MPI contains the elements used to evaluate efficiency/inefficiency, which are technical change, technological change, and total factor productivity. In this section, the authors present the results of technical efficiency change. The catch-up indexes in Table 5 and Figure 2 demonstrate the technical effective changes of DMUs, indicating the progress (if indexes are greater than 1), and the regress (if indexes are less than 1) of the technical efficiency of 18 DMUs in the period of 2015 to 2019. As can be seen, most of the efficiency indexes of the 18 DMUs had a fluctuating trend, except for B5-Sacombank, B8-HDBank, and B9-MilitaryBank, which have the catch-up indexes growing continuously during that time. The majority (10 DMUs: B1, 2, 7, 8, 10, 11, 13, 14, 15, 18) achieved progressive technical changes in the total research period (2015–2019), and thus the average catch-up index was obtained at 1.0072. B10-VP Bank achieved the highest catch-up index (1.1120) but had the least-stable technical performance on average. Meanwhile, B4-ACB had the lowest average catch-up value (0.9456), and B7-TP Bank had the most stable efficiency performance.
During the 2015–2016 period, only 7 out of 18 DMUs (B1, 6, 7, 10, 13, 14, 18) achieved technical efficiency, with scores > 1. The average technical efficiency index in this period is 1.0120. B10-VP Bank achieved the highest technical change at 1.4299, while B9-Military Bank had the lowest technical efficiency index (0.8290).
The technical efficiency of banks witnessed no improvement in 2016–2017, as the average catch-up in this period reached the lowest point of 0.9705. Only seven of the 18 DMUs (B1, 6, 7, 11, 15, 16, 18) had catch-up indexes greater than 1, but overall, the scores dropped significantly. Among those seven, only four banks maintained technical efficiency (B1, 6, 7, 18) from the previous period. B10-VP Bank performed the best during the previous period, but suffered a serious decline in technical efficiency, and then had the lowest efficiency performance in this period. B10′s catch-up score bottomed out to 0.6582, which is also the lowest value of all indexes during the total research period (2015–2019). B15-VIB achieved the highest technical efficiency in 2016–2017, at 1.2981.
During the 2017–2018 period, the average catch-up value increased to 1.0433 when half of the DMUs (B2, 3, 4, 7, 8, 10, 11, 12, 13) achieved technical efficiency. It is noticeable that many banks with low technical efficiency in the previous period had shown a significant improvement in this period (B2, 3, 4, 8, 10, 12, 13), with catch-up values greater than 1. Meanwhile, most of the good performing banks previously (B1, 6, 15, 16, 18) failed to maintain their high efficiency in this period. It is worth noting that B10-VP Bank and B15-VIB swapped their positions in productivity rankings. That means, B10-VP Bank was the worst-performing bank in the previous period and then became the best effective bank in the next period (with the score at 1.4351), while B15-VIB failed to maintain the highest technical efficiency in the previous period and then had the lowest catch-up value in this period (0.9331).
Half of the banks achieved technical efficiency in the final period (2018–2019), which are B1-Vietinbank, B3-Vietcombank, B5-Sacombank, B7-TPBank, B8-HDBank, B9-MilitaryBank, B12-OrientCommercial, B13-VietnamMaritime, and B14-SaigonBank. However, the indexes dropped significantly, thus, the average catch-up decreased to 1.0031 in this period. The efficiency of B8-HDBank had been continuously improved over the years and resulted in being the best performing bank during 2018–2019, with a catch-up index of 1.2491. B16-BaoVietBank was the worst-performing bank in this period, with a technical efficiency index of 0.8657.

5.2.2. Technological Change (Frontier-Shift Index)

The frontier-shift indexes of the DMUs are shown in Table 6, which are to measure their changes in technology between two periods. As can be seen, most of the banks maintained a high technological efficiency with indexes greater than 1 in all stages. On average, except for B14-SaigonBank, the remaining ones all of the banks (17 out of 18) obtained high efficiencies with frontier-shift indexes more than 1. Therefore, within the total research period (2015–2019), the medium point of the technological efficiency of DMUs resulted in a progressive score, at 1.0265. B10-VP Bank obtained the highest average technological score (1.0706), while B14-SaigonBank was the only bank to have the average frontier-shift index lower than 1 (at 0.9863). It can be observed in Figure 3 that B10 had the least-stable technological performance, while the rest had slight fluctuations during 2015–2019.
It can be concluded that the technology development and innovation of the banking industry in Vietnam has been performed effectively in recent years. The average technological efficiency index in each research period was above 1, at 1.0323 during 2015–2016, 1.0573 during 2016–2017, 1.0035 during 2017–2018, and 1.0128 during 2018–2019. Only one or two banks did not achieve technological progress in each period, namely B17-SaigonCongThuong from 2015 to 2016, B14-SaigonBank in the period of 2016–2017, B10-VPBank and B14-SaigonBank in the period of 2017–2018, and B8-HDBank in the period of 2018–2019. The bank that obtained the highest frontier-shift index in each period was B13-VietnamMaritime (during 2015–2016, at 1.0847), B10-VPBank (during 2016–2017, at 1.3578 and during 2018–2019, at 1.0540), and B11-NationalCitizen (during 2017–2018, at 1.0335).

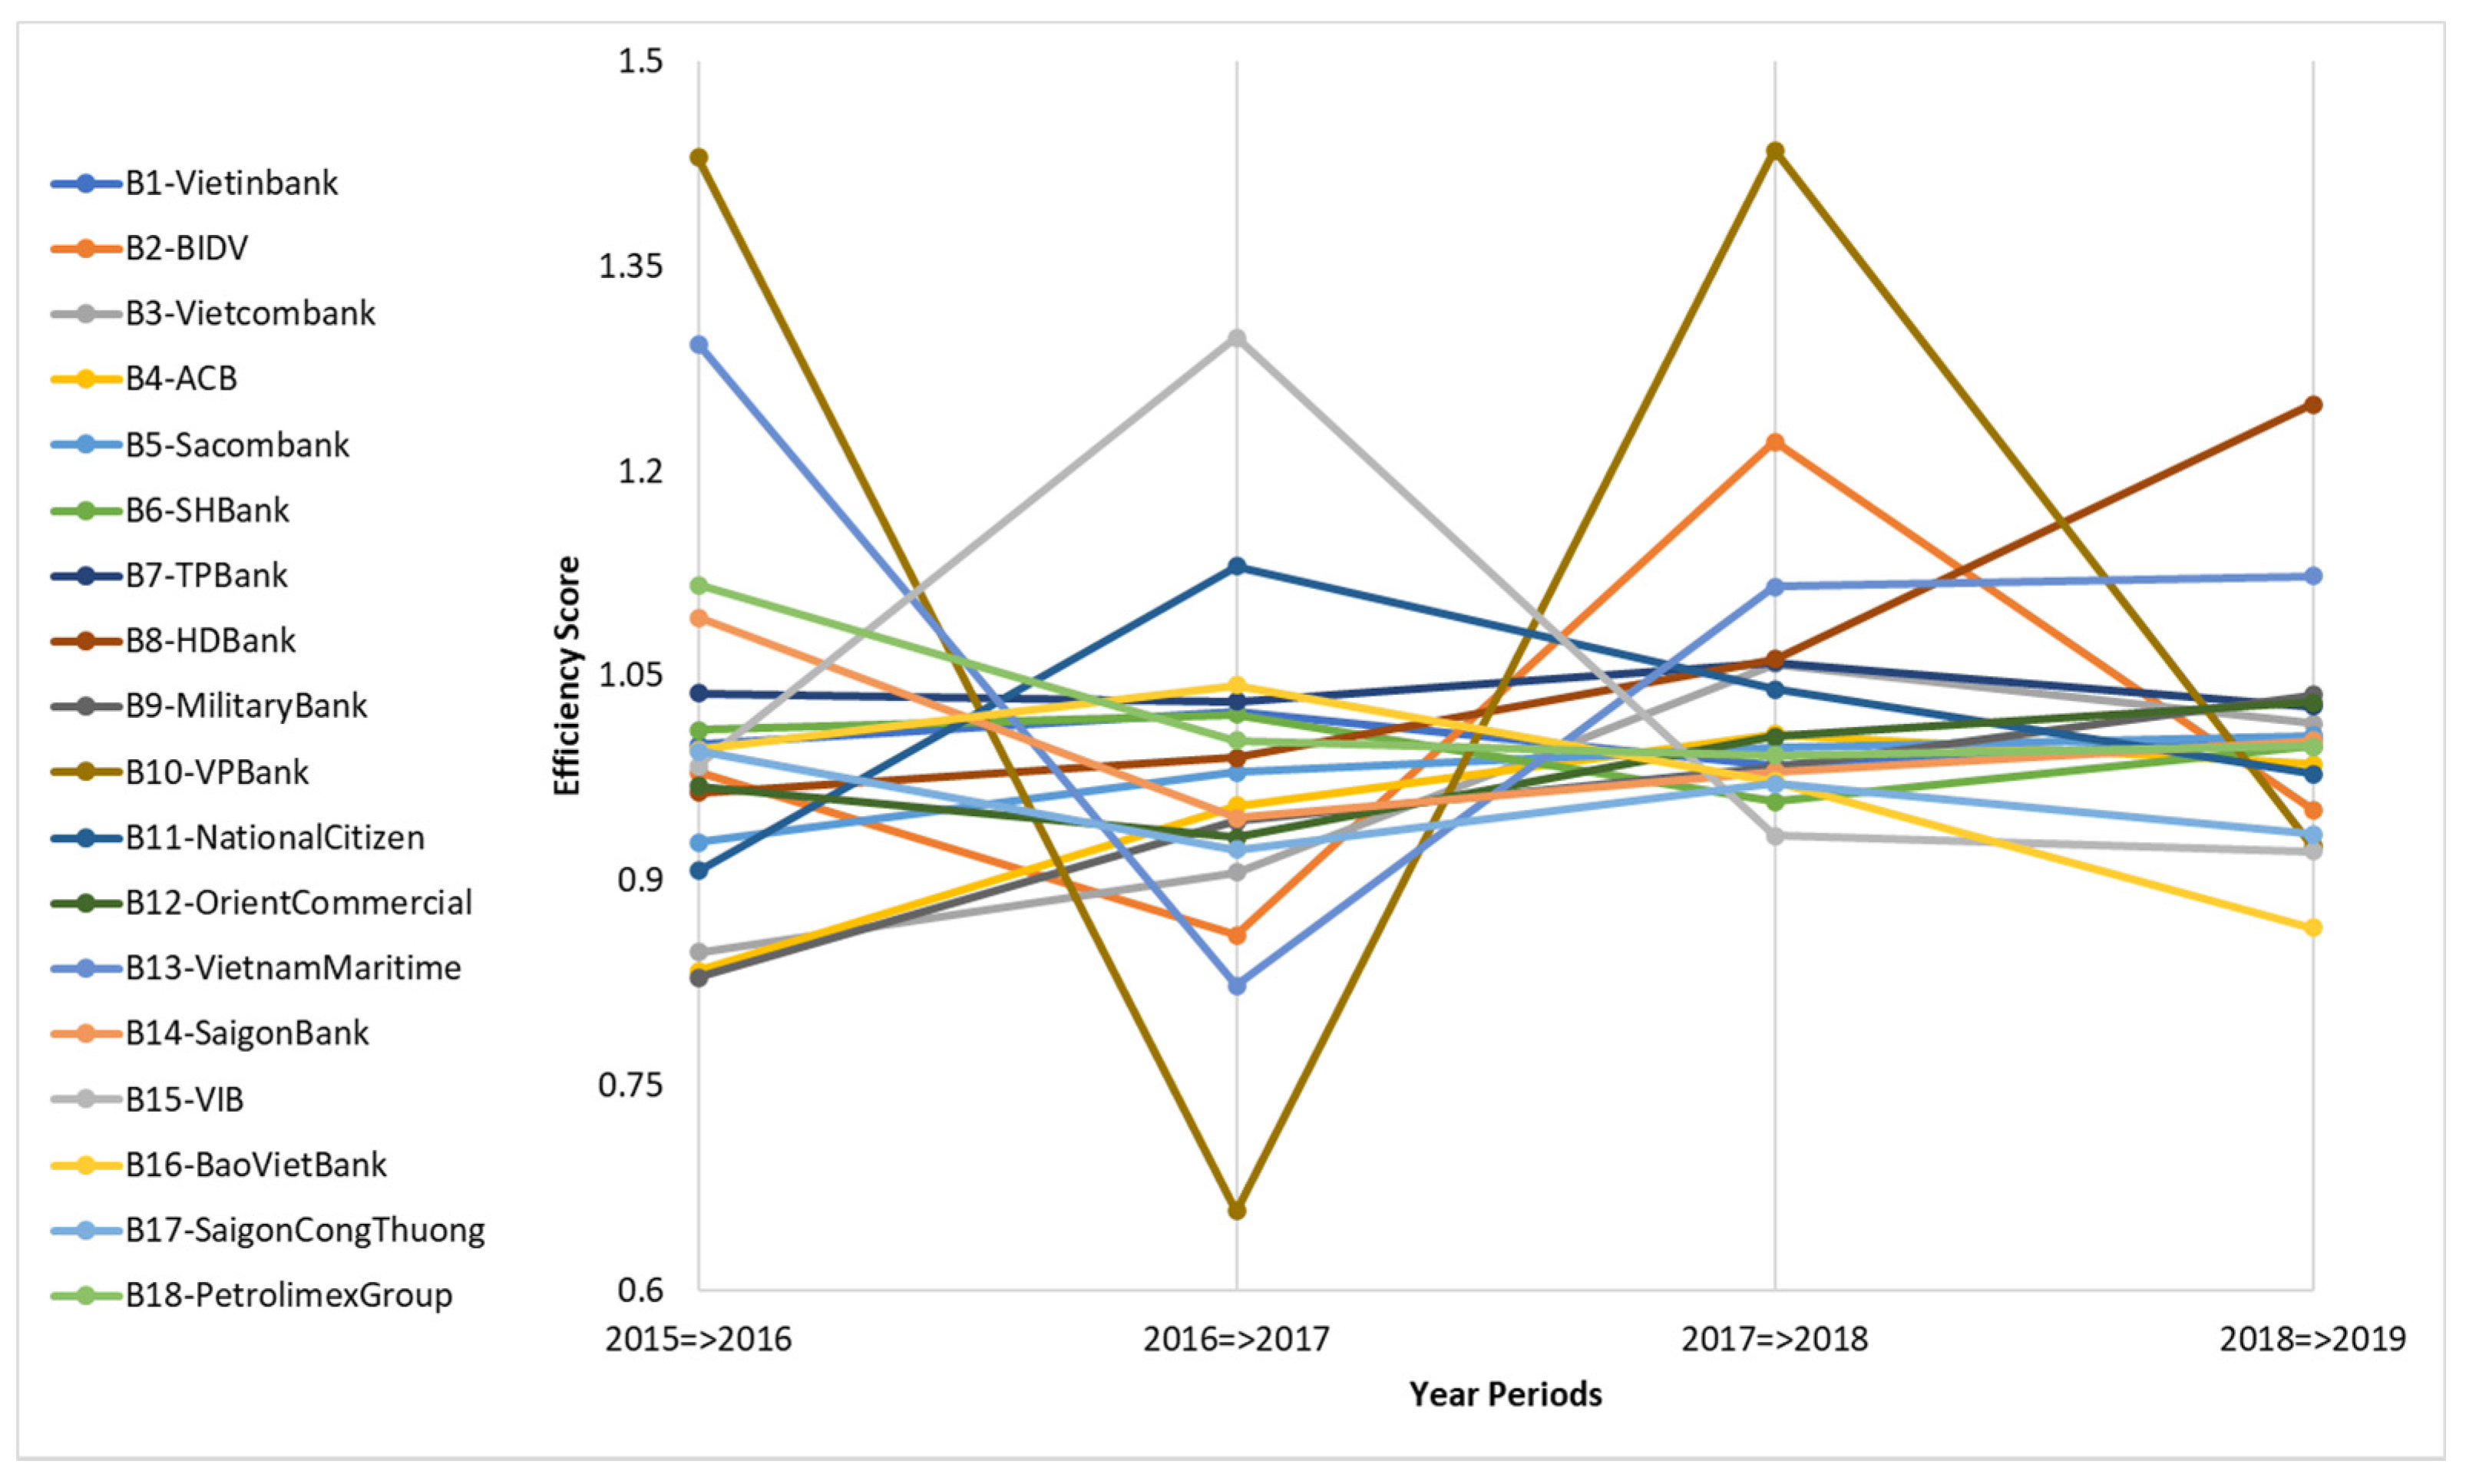
5.2.3. Malmquist Productivity Indicator (MPI)

MPI is a highly useful component to evaluate the performance in many areas, such as the automobile industry, finance, education, medical, and insurance, to name a few. From the results in Table 7 and Figure 4, the average Malmquist index of DMUs = 1.0306 (>1), which reflects that the majority (11 DMUs: B1, 2, 6, 7, 8, 10, 11, 12, 13, 15, and 18) achieved progress in total factor productivity. The total performance of most DMUs fluctuated during the research period (2015–2019), except for B7-TPBank, which had a decreasing efficiency, and B8-HDBank, which had a continuous improvement in productivity. On average, B10-VP Bank achieved the highest MPI value (1.1370) but had the least-stable performance. The lowest average MPI value of 0.9784 belongs to B4-ACB, meaning that it was the least-efficient bank during 2015–2019. B1-Vietinbank, B7-TPBank, and B8-HDBank had the most stable performance (MPI values were greater than 1 in all stages).
Overall, in every stage, the number of effective banks is in the majority, namely, 11 DMUs (B1, 6, 7, 8, 10, 12, 13, 14, 15, 16, 18) during 2015–2016, 10 DMUs (B1, 5, 6, 7, 8, 9, 11, 15, 16, 18) during 2016–2017, 11 DMUs (B1, 2, 3, 4, 5, 7, 8, 10, 11, 12, 13) during 2017–2018, 11 DMUs (B1, 3, 5, 6, 7, 8, 9, 12, 13, 14, 18) during 2018–2019. The average MPI value of DMUs was above 1 in all stages, at 1.0444 during 2015–2016, 1.0197 during 2016–2017, 1.0433 during 2017–2018, and 1.0152 during 2018–2019. The highest position in the total factor productivity among banks changed over periods, which are B10-VPBank during 2015–2016, B15-VIB during 2016–2017, B2-BIDV during 2017–2018, and B8-HDBank during 2018–2019, with scores of 1.4779, 1.3340, 1.2397, and 1.2127, respectively. In contrast, B4-ACB, B13-VietnamMaritime, B15-VIB, and B16-BaoVietBank were the worst-performing banks in each stage, with MPI values of 0.8904, 0.8666, 0.9358, and 0.8735, respectively.

5.3. DEA Window Analysis

At this part, the performance of DMUs (i.e., 18 commercial banks in Vietnam) for the period from 2015 to 2019 is ranked by the DEA Window model. To help, authors found a whole view of DMUs’ performance ranking, the Window results of the whole period were analyzed. Then, three windows of the 3 years, showing the most effective balance of informativeness and durability of the efficiency scores, were used for ranking the performance of these DMUs (i.e., 1st Window: 2015–2017, 2nd Window: 2016–2018, 3rd Window: 2017–2019) [50].

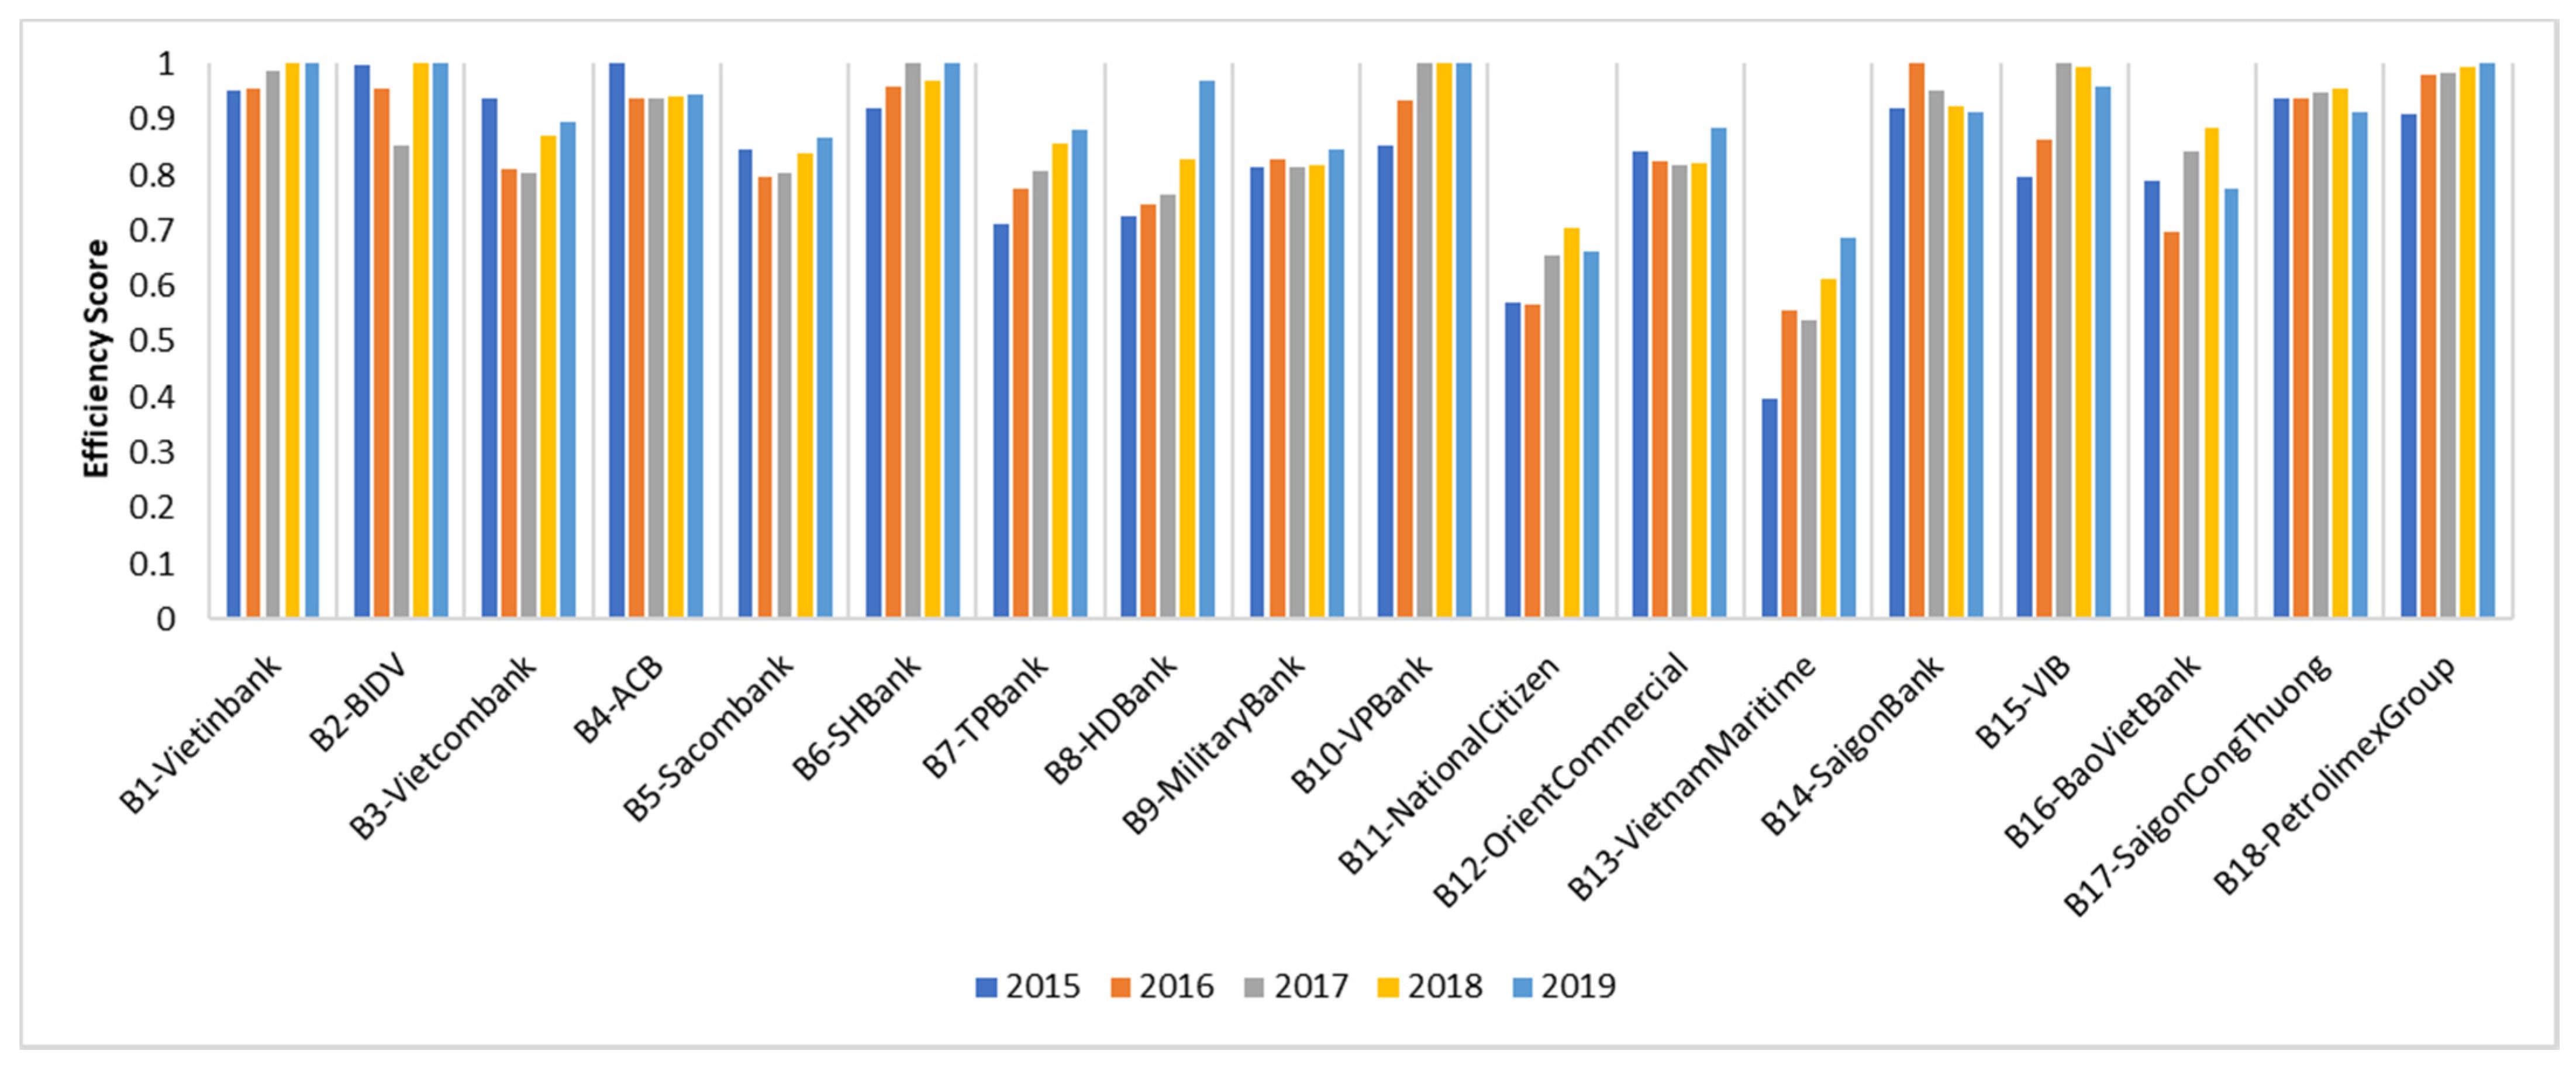
5.3.1. DEA Window of the Whole Period

The efficiency scores of 18 DMUs obtained for the whole period (2015–2019) are shown in Table 8. B1-Vietinbank is shown ranking at No. 1, with the highest efficiency score of 0.9789, while B13-VietnamMaritime had the worst efficiency score of 0.5583.
It can be concluded from Figure 5 that most of the indexes had a mild fluctuating trend, except for B1-Vietinbank, B7-TPBank, B8-HDBank, and B9-MilitaryBank, which had their indexes increased steadily or remained stable during the time of 2015–2019.

5.3.2. DEA Window of 3-Year Period

The scores of 18 DMUs obtained from the Window model for a 3-year period is shown in Table 9, and their rankings are illustrated in Figure 6. It is found that there is a slight change in the rankings of the DMUs in this table compared to Table 8. As shown in Table 9, B6-SHBank ranked first instead of B1-Vietinbank in Table 8, with an average score of 0.9876. B13-VietnamMaritime again had the worst average score, at 0.5621 in Table 9. This table also gives each DMU a higher resolution on the efficiency scores.
DMUs are separated into three groups based on the average efficiency rankings of them shown in Figure 6. The first group and the third group include the top and the worst three banks. The remaining banks belong to the 2nd group.
The 1st group includes B6-SHBank, B1-Vietinbank, and B18-PetrolimexGroup. The efficiency scores of B6-SHBank increased steadily from 2015 to 2017, from 0.9687 in 2015 to 0.9883 in 2016, and then reached 1 in 2017. The efficiency score dropped to 0.9813 in 2018 and then increased back to 1 in 2019. B1-Vietinbank had a score of 0.9706 in 2015, bottomed out to 0.9655 in 2016, increased to 0.9932 in 2017, and kept growing to 1 in 2018, and 2019. B18-PetrolimexGroup’s efficiency has increased annually as the scores improved as follows: 0.9274 (2015)–0.9953 (2016)–0.9979 (2017)–0.9996 (2018)–1 (2019).
The 2nd group consists of B2-BIDV, B10-VPBank, B14-SaigonBank, B4-ACB, B17-SaigonCongThuong, B15-VIB, B3-Vietcombank, B12-OrientCommercial, B5-Sacombank, B9-MilitaryBank, B8-HDBank, and B7-TPBank. While most of them had the efficiency performance that fluctuated year over year, B10-VPBank had a steady increasing performance, improved significantly from 0.8870 in 2015 to 0.9519 in 2016, then to 1 in 2017 and remained stable in 2018 and 2019. B10-VPBank is one of the joint stock commercial banks with a long history in Vietnam. This result is reasonable as the bank was reported to achieve a sustainable and impressive operation compared to the general context of the whole market [52].
The 3rd group includes B16-BaoVietBank, B11-NationalCitizen, and B13-VietnamMaritime. These banks could not reach a score of 1.00 in any research period. Furthermore, all the efficiency scores that they achieved were below 0.9.

6. Discussions and Conclusions

The Vietnamese commercial banking system performs a crucial role in providing credit to enterprises. Therefore, the stability of the banking sector is pivotal to the Vietnamese economy. This study takes advantage of both DEA efficiency-based models, including Malmquist index measurements and Window analysis, to assess the banks’ performance in Vietnam, especially considering the period prior to the COVID-19 crisis. In detail, the assessment involves the performance of 18 Vietnamese commercial banks in 2015–2019 while taking four inputs (assets, deposits, operating expenses, liabilities) and two outputs (loans, net income) into account. By deriving the Malmquist indexes, the productivity growth rates of the banks over time were obtained. Moreover, decomposition of the indexes enables us to discern the cause of efficiency improvement into technical change and/or frontier shift driven by group-wide pertinent trends. The Window model of the Whole Period and the model of 3 years generate and rank the banks’ efficiency in every single year in 2015–2019 by benchmarking them against the efficiency frontier.
In terms of technical efficiency, B3-Vietcombank, B5-Sacombank, B8-HDBank, B9-MilitaryBank, and B12-OrientCommercial achieved a noticeable improvement, from a regressive score in 2015 to a progressive score in 2019. From Table 5, their catch-up scores increased from 0.8475, 0.9281, 0.9646, 0.8290, and 0.9695 to 1.0152, 1.0062, 1.2491, 1.0361, and 1.0307, respectively. However, the average technical efficiency slightly decreased, from 1.0120 in 2015 to 1.0031 in 2019. That is because most banks had a decline in their scores during this period, especially B10-VPBank, which experienced a dramatic fall in its efficiency, even though this bank achieved the highest catch-up index during 2015–2016 and 2017–2018.
Regarding technological progress, it is noteworthy that a large proportion of banks achieved scores greater than 1 in all stages. Nevertheless, their technological efficiencies tended to decrease, then the average frontier-shift index for the period 2015–2019 suffered a slight decline, from 1.0324 to 1.0128 (see Table 6). Only 6 out of 18 banks improved their technological capabilities, namely B1-Vietinbank, B2-BIDV, B5-Sacombank, B6-SHBank, B10-VPBank, and B17-SaigonCongThuong, from 1.0001, 1.0064, 1.0007, 1.0092, 1.0336, 0.9861 in 2015 to 1.0054, 1.0290, 1.0094, 1.0391, 1.0540, and 1.0160 in 2019, respectively.
As seen in Table 7, a large majority of banks (about 60%) were able to achieve MPIs higher than 1 in each period. That means most banks balanced their effort into both technical and technological performance to obtain an overall progressive outcome. It can also be found that 11 out of 18 banks achieved progressive average MPI values for the total research period while the rest need to balance their technical and technological performance better. The average MPI values of all banks for the whole period dropped from 1.0444 in 2015 to 1.0152 in 2019. Figure 7 demonstrates the correlation relationship among MPI, technical efficiency, and technological efficiency. Note that all averages of technological indexes are higher than 1, indicating that the technical efficiency indexes are the determinants for productivity growth. No doubt that the MPI trend is caused by the technical efficiency trend, as can be observed in Figure 7.
The DEA Window analysis indicated that the DMUs had different efficiency performances during 2015–2019. B6-SHBank, B1-Vietinbank, and B18-PetrolimexGroup are in the 1st group with the best performances. The 2nd group includes B2-BIDV, B10-VPBank, B14-SaigonBank, B4-ACB, B17-SaigonCongThuong, B15-VIB, B3-Vietcombank, B12-OrientCommercial, B5-Sacombank, B9-MilitaryBank, B8-HDBank, and B7-TPBank, followed by the 3rd group that includes B16-BaoVietBank, B11-NationalCitizen, and B13-VietnamMaritime. It is noteworthy that B13-VietnamMaritime had the lowest average efficiency ranking of DMUs (Figure 6) but one of the best indicators of average productivity change (Figure 7). It can be expounded that having a progressive productivity growth rate in no way means that the bank is an efficient performer. Although its indicators related to growth performance increased remarkably over time compared to others, the bank somewhat failed to transform its input resources into outputs in the most efficient way compared to other banks.
The findings from the analysis of two models show that, while some banks do not rank well in various existing bank rankings [53] or have modest productivity growth indexes, they do achieve perfect efficiency and rank highly based on the Window analysis. The divergence from the existing rankings is attributable to the mechanism of the DEA approach, which ranks the banks based on their relative efficiency rather than absolute performance. For example, B6-SHBank, B1-Vietinbank, and B18-PetrolimexGroup achieve one of the worst indicators in the average productivity change (see Figure 7) but are the most efficient banks on average (see Figure 6). The result in no way means they are currently Vietnam’s leading financial institutions or that they achieve the best performance in any specific aspect. Rather, it implies that these three banks were able to generate the best possible outcomes in loans and net income given their current input resources. In contrast, and somehow contrary to the common impression, B10-VPBank, B8-HDBank, and B13-VietnamMaritime have the worst average efficiency despite having the best average productivity growth over time, indicating that they have not been translating their resources to their full potential in terms of loans and net income. As a result, there is a lot of opportunities for them to increase efficiency. Rather than expanding resources, they can improve their efficiency by making better use of what they already have. According to the correlation relationship of the performance indexes as in Figure 7, for most of the banks, the effects of technical change and the frontier shift are significantly different in strength, for which the total productivity change is caused by an exceptionally strong effect in technical efficiency. The reason behind the change can be traced to policies and/or economic situations.
To conclude, the main contributions of this research can be summarized as follows. Methodologically, by using DEA approaches (Malmquist and Window models), the current study provides a viable and complete efficiency assessment process of the banking sector, discerning two pictures on bank performance, which are productivity improvement and efficiency performance. From the literature review, there has not been carried out a thorough investigation examining the Vietnamese banks as outlined in this research using the proposed framework, which can constitute the novelty of the study and is a research gap that needs to be bridged. Regarding practical implications, the results from both models offer comprehensive insights into the efficiency of the top 18 commercial banks. In Vietnam, changing customer expectations and improved technological capabilities have been a daunting problem for banks. In the context of the rising competition from a handful of start-ups that use technology to create unique customer experiences around banking and other financial services, most banks are forced to respond by innovating themselves. Most notably, the effects of the global pandemic are changing how banks adapt to digital technology. Vietnamese banks, like banks all over the world, will be faced with a difficult choice when deciding to invest in their technology systems to meet the change in the current trend of shopping and consuming services [54]. Towards this end, this research can be a significant material for banking decision-makers to look at their current status in terms of crucial drivers in the industry.
Some limitations to this paper can be outlined as follows. First, input and output variable selection are not fully reflected all over the financial indicators of the banking industry; thus, future studies should consider more dimensions such as total capital, equity, securities, number of employees, or non-financial aspects, in order to give a higher resolution on the efficiency scores. Second, future studies should include quantitative approaches, such as combining the DEA models with a qualitative method, which uses fuzzy multiple criteria decision making to provide more robust results. As previously discussed, the global COVID-19 pandemic with an outbreak period from the end of 2019 to 2021 has been causing unprecedented disruptions to economies and sectors including the banking industry. This study also signifies the avenues for future research that address relevant problems considering the complex data produced in this period.

Author Contributions

Conceptualization, T.-T.D. and T.-T.-Q.T.; Data curation, T.-T.D.; Formal analysis, N.-A.-T.N.; Funding acquisition, C.-N.W.; Investigation, N.-A.-T.N.; Methodology, T.-T.-Q.T.; Project administration, C.-N.W.; Software, T.-T.D. and N.-A.-T.N.; Validation, C.-N.W. and T.-T.D.; Writing—original draft, T.-T.D. and T.-T.-Q.T.; Writing—review and editing, C.-N.W. and N.-A.-T.N. All authors have read and agreed to the published version of the manuscript.

Funding

This research was partly supported by the National Kaohsiung University of Science and Technology, and project number MOST 109-2622-E-992-026 from the Ministry of Sciences and Technology in Taiwan.

Acknowledgments

The authors appreciate the support from the National Kaohsiung University of Science and Technology, Ministry of Sciences and Technology in Taiwan.

Conflicts of Interest

The authors declare no conflict of interest.

References

  1. COVID-19 Hits Profitability of National Banking Sector. Available online: https://customsnews.vn/covid-19-hits-profitability-of-national-banking-sector-14135.html (accessed on 14 May 2021).
  2. Banking Sector Reviews Effects of Covid-19 Pandemic Prepare for Difficult Year. Available online: https://vietnamnews.vn/economy/business-beat/716434/banking-sector-reviews-effects-of-covid-19-pandemic-prepare-for-difficult-year.html (accessed on 14 May 2021).
  3. Batten, J.A.; Vo, X.V. Determinants of Bank Profitability–Evidence from Vietnam. Emerg. Markets Financ. Trade 2019, 55, 1417–1428. [Google Scholar] [CrossRef]
  4. Assaf, A.G.; Berger, A.N.; Roman, R.A.; Tsionas, M.G. Does efficiency help banks survive and thrive during financial crises? J. Bank. Financ. 2019, 106, 445–470. [Google Scholar] [CrossRef]
  5. Paradi, J.C.; Zhu, H. A survey on bank branch efficiency and performance research with data envelopment analysis. Omega 2013, 41, 61–79. [Google Scholar] [CrossRef]
  6. Avkiran, N.K.; Cai, L. Identifying distress among banks prior to a major crisis using non-oriented super-SBM. Ann. Oper. Res. 2014, 217, 31–53. [Google Scholar] [CrossRef]
  7. Avkiran, N.K. An illustration of dynamic network DEA in commercial banking including robustness tests. Omega 2015, 55, 141–150. [Google Scholar] [CrossRef]
  8. Mohtashami, A.; Ghiasvand, B.M. Z-ERM DEA integrated approach for evaluation of banks & financial institutes in stock exchange. Expert Syst. Appl. 2020, 147, 113218. [Google Scholar]
  9. Dang-Thanh, N. Measuring the performance of the banking system: Case of Vietnam (1990–2010). J. Appl. Financ. Bank. 2012, 2, 289–312. [Google Scholar]
  10. Cuong, D.X.; Hien, H.T.; Long, T. Multi-Criteria Decision-Making Model Evaluating the Performance of Vietnamese Commercial Banks. Int. J. Financ. Res. 2018, 9, 132–141. [Google Scholar] [CrossRef] [Green Version]
  11. Tlig, H.; Hamed, A. Assessing the Efficiency of commercial Tunisian Banks using Fuzzy Data Envelopment Analysis. J. Data Envel. Anal. Decis. Sci. 2017, 2, 14–27. [Google Scholar] [CrossRef] [Green Version]
  12. Banker, R.D.; Chang, H.; Lee, S.Y. Differential impact of Korean banking system reforms on bank productivity. J. Bank. Financ. 2010, 34, 1450–1460. [Google Scholar] [CrossRef]
  13. Paradi, J.C.; Sherman, H.D.; Tam, F.K. Bank branch benchmarking with quality as a component. In Data Envelopment Analysis in the Financial Services Industry; Springer: Cham, Switzerland, 2018; pp. 159–184. [Google Scholar]
  14. Avkiran, N.K. Measuring the systemic risk of regional banks in Japan with PLS-SEM. Theor. Econ. Lett. 2018, 8, 2024. [Google Scholar] [CrossRef] [Green Version]
  15. Dincer, H.; Hacioglu, Ü.; Celik, I.E. The Game Theory and Reflections on Competitive Strategies in the Banking Sector. In Managerial Issues in Finance and Banking; Springer: Cham, Switzerland, 2014; pp. 145–153. [Google Scholar]
  16. Dahlstrom, R.; Nygaard, A.; Kimasheva, M.; Ulvnes, A.M. How to recover trust in the banking industry? A game theory approach to empirical analyses of bank and corporate customer relationships. Int. J. Bank Mark. 2014, 32, 268–278. [Google Scholar] [CrossRef]
  17. Khanizad, R.; Montazer, G. Participation against competition in banking markets based on cooperative game theory. J. Financ. Data Sci. 2018, 4, 16–28. [Google Scholar] [CrossRef]
  18. Panjaitan, A. Application of Game Theory in Determining the Optimum Marketing Mix Strategy in Banking Companies. Int. J. Basic Appl. Sci. 2020, 9, 53–57. [Google Scholar]
  19. Zandi, F.; Tavana, M.; O’Connor, A. A strategic cooperative game-theoretic model for market segmentation with application to banking in emerging economies. Technol. Econ. Dev. Econ. 2012, 18, 389–423. [Google Scholar] [CrossRef]
  20. Wang, C.N.; Tsai, T.T.; Hsu, H.P.; Nguyen, L.H. Performance evaluation of major Asian airline companies using DEA window model and grey theory. Sustainability 2019, 11, 2701. [Google Scholar] [CrossRef] [Green Version]
  21. Wang, C.N.; Tibo, H.; Duong, D.H. Renewable Energy Utilization Analysis of Highly and Newly Industrialized Countries Using an Undesirable Output Model. Energies 2020, 13, 2629. [Google Scholar] [CrossRef]
  22. Novickytė, L.; Droždz, J. Measuring the efficiency in the Lithuanian banking sector: The DEA application. Int. J. Financ. Stud. 2018, 6, 37. [Google Scholar] [CrossRef] [Green Version]
  23. Xu, T.; You, J.; Shao, Y. Efficiency of China’s Listed Securities Companies: Estimation through a DEA-Based Method. Mathematics 2020, 8, 589. [Google Scholar] [CrossRef] [Green Version]
  24. Wang, C.N.; Hsu, H.P.; Wang, Y.H.; Nguyen, T.T. Eco-Efficiency Assessment for Some European Countries Using Slacks-Based Measure Data Envelopment Analysis. Appl. Sci. 2020, 10, 1760. [Google Scholar] [CrossRef] [Green Version]
  25. Liu, F.H.F.; Wang, P.H. DEA Malmquist productivity measure: Taiwanese semiconductor companies. Int. J. Prod. Econ. 2008, 112, 367–379. [Google Scholar] [CrossRef]
  26. Estache, A.; de la Fe, B.T.; Trujillo, L. Sources of efficiency gains in port reform: A DEA decomposition of a Malmquist TFP index for Mexico. Util. Policy 2004, 12, 221–230. [Google Scholar] [CrossRef]
  27. Odeck, J. Assessing the relative efficiency and productivity growth of vehicle inspection services: An application of DEA and Malmquist indices. Eur. J. Oper. Res. 2000, 126, 501–514. [Google Scholar] [CrossRef]
  28. Huang, J.; Du, D.; Hao, Y. The driving forces of the change in China’s energy intensity: An empirical research using DEA-Malmquist and spatial panel estimations. Econ. Model. 2017, 65, 41–50. [Google Scholar] [CrossRef]
  29. Chung, S.H.; Lee, A.H.I.; Kang, H.Y.; Lai, C.W. A DEA window analysis on the product family mix selection for a semiconductor fabricator. Expert Syst. Appl. 2008, 35, 379–388. [Google Scholar] [CrossRef]
  30. Vlontzos, G.; Pardalos, P.M. Assess and prognosticate greenhouse gas emissions from agricultural production of EU countries, by implementing, DEA Window analysis and artificial neural networks. Renew. Sustain. Energy Rev. 2017, 76, 155–162. [Google Scholar] [CrossRef]
  31. Halkos, G.E.; Tzeremes, N.G. Exploring the existence of Kuznets curve in countries’ environmental efficiency using DEA window analysis. Ecol. Econ. 2009, 68, 2168–2176. [Google Scholar] [CrossRef]
  32. Řepková, I. Efficiency of the Czech banking sector employing the DEA window analysis approach. Procedia Econ. Financ. 2014, 12, 587–596. [Google Scholar] [CrossRef] [Green Version]
  33. Le, T.N.; Wang, C.N. The integrated approach for sustainable performance evaluation in value chain of Vietnam textile and apparel industry. Sustainability 2017, 9, 477. [Google Scholar] [CrossRef] [Green Version]
  34. Wang, C.-N.; Nguyen, N.-A.-T.; Fu, H.-P.; Hsu, H.-P.; Dang, T.-T. Efficiency Assessment of Seaport Terminal Operators Using DEA Malmquist and Epsilon-Based Measure Models. Axioms 2021, 10, 48. [Google Scholar] [CrossRef]
  35. Charnes, A.; Cooper, W.W.; Rhodes, E. Measuring the efficiency of decision-making units. Eur. J. Oper. Res. 1979, 2, 429–444. [Google Scholar] [CrossRef]
  36. Wang, C.-N.; Dang, T.-T.; Nguyen, N.-A.-T.; Le, T.-T.-H. Supporting Better Decision-Making: A Combined Grey Model and Data Envelopment Analysis for Efficiency Evaluation in E-Commerce Marketplaces. Sustainability 2020, 12, 10385. [Google Scholar] [CrossRef]
  37. Jablonsky, J.; Fiala, P.; Smirlis, Y.; Despotis, D.K. DEA with interval data: An illustration using the evaluation of branches of a Czech bank. Cent. Eur. J. Oper. Res. 2004, 12, 323. [Google Scholar]
  38. Emrouznejad, A.; Anouze, A.L. Data envelopment analysis with classification and regression tree—A case of banking efficiency. Expert Syst. 2010, 27, 231–246. [Google Scholar] [CrossRef]
  39. Lin, T.Y.; Chiu, S.H. Using independent component analysis and network DEA to improve bank performance evaluation. Econ. Model. 2013, 32, 608–616. [Google Scholar] [CrossRef]
  40. Fujii, H.; Managi, S.; Matousek, R. Indian bank efficiency and productivity changes with undesirable outputs: A disaggregated approach. J. Bank. Financ. 2014, 38, 41–50. [Google Scholar] [CrossRef] [Green Version]
  41. Wang, K.; Huang, W.; Wu, J.; Liu, Y.N. Efficiency measures of the Chinese commercial banking system using an additive two-stage DEA. Omega 2014, 44, 5–20. [Google Scholar] [CrossRef]
  42. Wanke, P.; Barros, C.P.; Emrouznejad, A. Assessing productive efficiency of banks using integrated Fuzzy-DEA and bootstrapping: A case of Mozambican banks. Eur. J. Oper. Res. 2016, 249, 378–389. [Google Scholar] [CrossRef] [Green Version]
  43. Mahmoudabadi, M.Z.; Emrouznejad, A. Comprehensive performance evaluation of banking branches: A three-stage slacks-based measure (SBM) data envelopment analysis. Int. Rev. Econ. Financ. 2019, 64, 359–376. [Google Scholar] [CrossRef]
  44. Yu, M.M.; Lin, C.I.; Chen, K.C.; Chen, L.H. Measuring Taiwanese bank performance: A two-system dynamic network data envelopment analysis approach. Omega 2021, 98, 102145. [Google Scholar] [CrossRef]
  45. Sáez-Fernández, F.J.; Picazo-Tadeo, A.J.; Jiménez-Hernández, I. Performance and risk in the Brazilian banking industry. Heliyon 2021, 7, e06524. [Google Scholar] [CrossRef] [PubMed]
  46. Wang, C.-N.; Nguyen, T.-L.; Dang, T.-T. Analyzing Operational Efficiency in Real Estate Companies: An Application of GM (1,1) and DEA Malmquist Model. Mathematics 2021, 9, 202. [Google Scholar] [CrossRef]
  47. Wang, C.-N.; Nguyen, T.-L.; Dang, T.-T.; Bui, T.-H. Performance Evaluation of Fishery Enterprises Using Data Envelopment Analysis—A Malmquist Model. Mathematics 2021, 9, 469. [Google Scholar] [CrossRef]
  48. Charnes, A.; Clark, C.T.; Cooper, W.W.; Golany, B. A Developmental Study of Data Envelopment Analysis in Measuring the Efficiency of Maintenance Units in the U.S. Air Forces. Ann. Oper. Res. 1985, 2, 95–112. [Google Scholar] [CrossRef]
  49. Yue, P. Data Envelopment Analysis and Commercial Bank Performance: A Primer with Applications to Missouri Banks. Fed. Reserve Bank St. Louis Rev. 1992, 74, 31–45. [Google Scholar] [CrossRef] [Green Version]
  50. Charnes, A.; Cooper, W.W.; Lewin, A.Y.; Seiford, L.M. Data Envelopment Analysis: Theory, Methodology and Applications; Springer: New York, NY, USA, 1995. [Google Scholar]
  51. Vietnam Online Stock Market. Available online: http://vietstock.vn/ (accessed on 18 June 2020).
  52. VPBank in Sustainable Development Strategy. Available online: https://tuoitre.vn/vpbank-duy-tri-tang-truong-ben-vung-20200717151111649.htm (accessed on 1 June 2021).
  53. Top 10 Vietnamese Commercial Banks in 2020. Available online: https://vietnamnet.vn/vn/kinh-doanh/vef/top-10-ngan-hang-thuong-mai-viet-nam-uy-tin-nam-2020-657568.html (accessed on 4 June 2021).
  54. Vietnamese Commercial Banks in COVID-19. Available online: http://tapchinganhang.gov.vn/thach-thuc-cho-cac-ngan-hang-thuong-mai-trong-va-sau-dich-covid-19.htm?fbclid=IwAR3eK8PKYl2PO7l5yjGgMIhAsW7DRXnEyUgUQ52tPGgkjJQa99BfuZLpQtY (accessed on 1 June 2021).
Figure 1. The modeling framework of the research.
Axioms 10 00131 g001
Figure 2. The efficiency change indexes of the DMUs.
Axioms 10 00131 g002
Figure 3. The technological change indexes of the DMUs.
Axioms 10 00131 g003
Figure 4. Malmquist productivity indexes of the DMUs (2015–2019).
Axioms 10 00131 g004
Figure 5. Variation over a year of the DMUs (Window of 5 years).
Axioms 10 00131 g005
Figure 6. Average efficiency ranking of DMUs (2015–2019).
Axioms 10 00131 g006
Figure 7. Average productivity change and its components (2015–2019).
Axioms 10 00131 g007
Table 1. List of common input and output factors used in previous studies.
No.Authors [Citation]Input FactorsOutput Factors# of DMUsResearch Scopes
1Jablonsky et al., (2004) [37]Employees
Operating expense
Space
Number of accounts
Number of transactions
Savings
81Reflecting the productive efficiency of the branches in Czech Republic
2Emrouznejad and Anouze, (2010) [38]Assets
Equity
Deposit
Loan
Profit
36Assessing the efficiency and productivity of the banking sector in the Gulf Cooperation Council countries
3Lin and Chiu, (2013) [39]Fixed assets
Operating expense
Capital
Non-interest income
Interest income
Profit
30Investigating performance evaluation for the Taiwanese domestic banks
4Fujii et al., (2014) [40]Employees
Deposits
Fixed assets
Acquired assets
Customer loans
Bad loans
24Examining technical efficiency and productivity growth in the Indian banking sector
5Wang et al., (2014) [41]Employees
Fixed assets
Non-interest income
Interest income
Non-performing loans
16Measuring efficiency of the Chinese commercial banking system
6Wanke et al., (2016) [42]Total costs
Employee costs
Total deposits
Income before tax
Total credit
117Assessing productive efficiency of Mozambican banks
7Mahmoudabadi and Emrouznejad, (2019) [43]Employees
Fixed assets
Non-operating costs
Interest expenses
Bank facilities
Interest income
Non-interest income
37Evaluating operational efficiency, service effectiveness, and social effectiveness of commercial banks in Iran
8Yu et al., (2021) [44]Fixed assets
Labor
Operating expenses
Loan
Securities investment
Non-interest income
22Measuring Taiwanese bank performance
9Sáez-Fernández et al., (2021) [45]Staff expenses
Non-earning assets
Equity
Customer deposits
Market liabilities
Loan
Securities
124Assessing the technical performance of Brazilian banks
10This paperAssets
Deposits
Operating expenses
Liabilities
Loan
Net income
18Measuring technological and productivity growth of commercial banks in Vietnam
Source: defined by the authors.
Table 2. List of the top commercial banks in Vietnam.
DMUsName of BanksCodeNet Profit after Tax
in 2019 (Mil. USD)
Rank by Net Profit
after Tax in 2019
B1VietinbankCTG406.1192
B2BIDVBID366.2983
B3VietcombankVCB793.8971
B4ACBACB257.5456
B5SacombankSTB105.19911
B6SHBankSHB103.61412
B7TPBankTPB132.5819
B8HDBankHDB172.2847
B9MilitaryBankMBB345.7655
B10VPBankVPB353.9784
B11NationalCitizenNVB1.84918
B12OrientCommercialOCB110.65710
B13VietnamMaritimeMSB44.72013
B14SaigonBankSCB7.29214
B15VIBVIB139.9768
B16BaoVietBankBVB3.64116
B17SaigonCongThuongSGB6.19815
B18PetrolimexGroupPGB3.19817
Source: Finance.vietstock.vn [51].
Table 3. Statistical analysis for each year.
PeriodStatisticsInput FactorsOutput Factors
a1a2a3a4b1b2
2015Max36,453.8924,194.17475.1234,639.6825,322.68827.71
Min760.59563.1714.56615.28493.6820.30
Avg10,168.837065.65148.949329.916187.13248.47
SD10,904.517215.26143.5510,302.977386.57259.12
2016Max43,126.4731,112.33579.8941,236.1330,581.421002.49
Min816.26607.1816.94665.64532.7026.34
Avg12,030.808722.56176.6011,306.567572.66289.57
SD12,963.909476.58172.6012,288.678913.86318.27
2017Max51,521.6736,853.09664.4149,428.9733,527.681326.53
Min913.60636.3517.24767.16599.4528.14
Avg14,550.0010,128.80215.0413,698.368805.55371.36
SD15,672.6211,162.80202.5814,954.919859.45404.71
2018Max56,267.8242,410.54690.6653,930.1241,839.001497.97
Min873.07629.0219.25725.88581.0727.08
Avg15,980.4911,386.86244.2215,013.3510,396.45423.62
SD16,677.5012,595.49210.8915,886.9111,896.95443.57
2019Max63,849.3847,745.39739.5260,521.7147,239.861541.76
Min977.60671.4120.84824.99618.9030.76
Avg17,999.5912,972.07276.8616,818.5211,904.13518.52
SD18,522.9714,075.98235.7617,494.6913,242.19527.24
Source: calculated by the authors.
Table 4. Coefficients of correlation between factors.
PeriodFactorsInput FactorsOutput Factors
a1a2a3a4b1b2
2015Assets1
Deposits0.98601
Operating Expenses0.95940.95411
Liabilities0.99850.98200.95271
Loans0.99270.98610.96050.99091
Net Income0.96120.94610.99050.95640.95901
2016Assets1
Deposits0.99471
Operating Expenses0.95930.94571
Liabilities0.99980.99460.95681
Loans0.99410.98560.95780.99481
Net Income0.92190.89310.97320.91910.92051
2017Assets1
Deposits0.99481
Operating Expenses0.94150.92721
Liabilities0.99990.99550.93721
Loans0.98680.98220.94610.98601
Net Income0.89100.85800.96970.88630.89481
2018Assets1
Deposits0.99611
Operating Expenses0.91990.90481
Liabilities0.99980.99690.91411
Loans0.99070.98600.91050.99111
Net Income0.87080.84830.96280.86510.86551
2019Assets1
Deposits0.99631
Operating Expenses0.91020.89671
Liabilities0.99980.99690.90341
Loans0.99140.98540.90050.99161
Net Income0.87730.84870.96940.86890.87141
Source: calculated by the authors.
Table 5. The technical efficiency change indexes.
DMUsName of Banks2015–20162016–20172017–20182018–2019Average
B1Vietinbank1.00001.02350.98461.00441.0032
B2BIDV0.97920.86001.22140.95211.0032
B3Vietcombank0.84750.90611.05861.01520.9569
B4ACB0.83420.95531.00750.98560.9456
B5Sacombank0.92810.97920.99741.00620.9777
B6SHBank1.01051.02200.95800.99870.9973
B7TPBank1.03741.03111.05991.02791.0391
B8HDBank0.96460.99041.06261.24911.0667
B9MilitaryBank0.82900.94380.98361.03610.9481
B10VPBank1.42990.65821.43510.92531.1121
B11NationalCitizen0.90751.13061.04010.97811.0141
B12OrientCommercial0.96950.93201.00581.03070.9845
B13VietnamMaritime1.29330.82321.11561.12341.0889
B14SaigonBank1.09300.94610.98011.00291.0055
B15VIB0.98431.29810.93310.92191.0344
B16BaoVietBank0.99611.04350.97270.86570.9695
B17SaigonCongThuong0.99490.92310.97110.93420.9558
B18PetrolimexGroup1.11671.00270.99180.99861.0274
Average1.01200.97051.04331.00311.0072
Max1.42991.29811.43511.24911.1121
Min0.82900.65820.93310.86570.9456
SD0.15120.13060.11870.08310.0478
Source: calculated by the authors.
Table 6. The technological change indexes.
DMUsName of Banks2015–20162016–20172017–20182018–2019Average
B1Vietinbank1.00011.01751.02871.00541.0129
B2BIDV1.00641.09411.01501.02901.0361
B3Vietcombank1.08211.04071.02991.01141.0410
B4ACB1.06741.03781.02581.01271.0359
B5Sacombank1.00071.03211.02961.00941.0179
B6SHBank1.00921.02081.01231.03911.0204
B7TPBank1.04841.05161.00931.01181.0303
B8HDBank1.07241.05651.00410.97091.0260
B9MilitaryBank1.07511.05961.00361.00941.0369
B10VPBank1.03361.35780.83701.05401.0706
B11NationalCitizen1.01101.03191.03351.01061.0218
B12OrientCommercial1.03841.04631.00801.01171.0261
B13VietnamMaritime1.08471.05261.01011.01231.0400
B14SaigonBank1.00340.98000.96061.00120.9863
B15VIB1.03901.02761.00291.00861.0195
B16BaoVietBank1.01391.04241.02091.00901.0215
B17SaigonCongThuong0.98611.07141.02501.01601.0246
B18PetrolimexGroup1.01131.01121.00741.00781.0094
Average1.03241.05731.00351.01281.0265
Max1.08471.35781.03351.05401.0706
Min0.98610.98000.83700.97090.9863
SD0.03230.07900.04480.01660.0171
Source: calculated by the authors.
Table 7. Malmquist productivity indexes (2015–2019).
DMUsName of Banks2015–20162016–20172017–20182018–2019Average
B1Vietinbank1.00011.04151.01291.00991.0161
B2BIDV0.98550.94091.23970.97971.0365
B3Vietcombank0.91710.94291.09031.02680.9943
B4ACB0.89040.99141.03350.99810.9784
B5Sacombank0.92871.01071.02691.01560.9955
B6SHBank1.01981.04330.96981.03781.0177
B7TPBank1.08761.08431.06981.04011.0705
B8HDBank1.03451.04631.06701.21271.0901
B9MilitaryBank0.89131.00000.98711.04580.9810
B10VPBank1.47790.89371.20120.97521.1370
B11NationalCitizen0.91751.16661.07490.98851.0369
B12OrientCommercial1.00670.97511.01381.04281.0096
B13VietnamMaritime1.40280.86661.12691.13731.1334
B14SaigonBank1.09680.92730.94151.00410.9924
B15VIB1.02261.33400.93580.92981.0556
B16BaoVietBank1.00991.08770.99310.87350.9910
B17SaigonCongThuong0.98100.98900.99540.94910.9786
B18PetrolimexGroup1.12931.01390.99921.00641.0372
Average1.04441.01971.04331.01521.0306
Max1.47791.33401.23971.21271.1370
Min0.89040.86660.93580.87350.9784
SD0.15980.10710.08200.07380.0497
Source: calculated by the authors.
Table 8. The Window results of the whole period (2015–2019).
DMUsName of Banks20152016201720182019AverageRank
B1Vietinbank0.95150.95430.9889110.97891
B2BIDV0.99790.95390.8548110.96134
B3Vietcombank0.93840.81030.80410.87000.89660.863910
B4ACB10.93810.93880.94240.94490.95286
B5Sacombank0.84630.79590.80390.83850.86610.830112
B6SHBank0.91900.960510.971210.97013
B7TPBank0.71130.77600.80650.85690.88100.806315
B8HDBank0.72550.74760.76450.82940.96810.807014
B9MilitaryBank0.81530.82910.81510.81850.84590.824813
B10VPBank0.85290.93591110.95785
B11NationalCitizen0.56940.56780.65600.70580.66240.632317
B12OrientCommercial0.84400.82580.81720.82250.88530.839011
B13VietnamMaritime0.39690.55510.53940.61450.68560.558318
B14SaigonBank0.920110.95370.92230.91370.94207
B15VIB0.79510.864110.99600.95840.92279
B16BaoVietBank0.79010.69680.84210.88670.77520.798216
B17SaigonCongThuong0.93740.93670.94900.95420.91380.93828
B18PetrolimexGroup0.90920.98030.98510.994810.97392
Source: calculated by the authors.
Table 9. The Window results for a 3-year period.
DMUsName of Banks20152016201720182019AverageRank
B1Vietinbank0.97060.97301
0.95790.99061
0.988911
Average0.97060.96550.9932110.98592
B2BIDV10.99630.8996
0.96520.85601
0.854811
Average10.98070.8701110.97024
B3Vietcombank0.94010.85710.8266
0.81150.80530.8711
0.80410.87000.8966
Average0.94010.83430.81200.87060.89660.870710
B4ACB10.96430.9651
0.94040.94040.9450
0.93880.94240.9449
Average10.95240.94810.94370.94490.95787
B5Sacombank0.86940.81790.8262
0.80020.80760.8419
0.80390.83850.8661
Average0.86940.80900.81250.84020.86610.839512
B6SHBank0.96870.99711
0.979510.9843
10.97821
Average0.96870.988310.981310.98761
B7TPBank0.72770.77710.8072
0.77600.80650.8571
0.80650.85690.8810
Average0.72770.77650.80670.85700.88100.809815
B8HDBank0.74860.77230.7880
0.74900.76990.8300
0.76450.82940.9681
Average0.74860.76060.77410.82970.96810.816214
B9MilitaryBank0.84240.85920.8458
0.84260.83120.8224
0.81740.81850.8459
Average0.84240.85090.83150.82050.84590.838213
B10VPBank0.88700.96221
0.941711
111
Average0.88700.95191110.96785
B11NationalCitizen0.60230.56940.6572
0.56780.65600.7058
0.65600.70580.6646
Average0.60230.56860.65640.70580.66460.639517
B12OrientCommercial0.84720.84630.8241
0.83400.81810.8236
0.81720.82250.8853
Average0.84720.84020.81980.82310.88530.843111
B13VietnamMaritime0.40560.56920.5394
0.56140.53940.6145
0.53940.61450.6856
Average0.40560.56530.53940.61450.68560.562118
B14SaigonBank0.934910.9537
10.95370.9223
10.95540.9621
Average0.934910.96910.93880.96210.96106
B15VIB0.81350.86661
0.864410.9969
10.99600.9584
Average0.81350.865510.99640.95840.92689
B16BaoVietBank0.79140.71100.8461
0.70570.84370.8867
0.84210.88670.7752
Average0.79140.70840.84400.88670.77520.801116
B17SaigonCongThuong0.94910.94930.9669
0.97670.95760.9742
0.95420.96590.9191
Average0.94910.96300.95960.97010.91910.95228
B18PetrolimexGroup0.92740.99991
0.990811
0.99370.99921
Average0.92740.99530.99790.999610.98413
Source: calculated by the authors.
Publisher’s Note: MDPI stays neutral with regard to jurisdictional claims in published maps and institutional affiliations.

