Article

The Water Footprint of Heavy Oil Extraction in Colombia: A Case Study

by
Luis Gabriel Carmona
1,2,
Kai Whiting
1,3,* and
Angeles Carrasco
3
1
MARETEC, Department of Mechanical Engineering, Instituto Superior Técnico, Universidade de Lisboa, Avenida Rovisco Pais 1, 1049-001 Lisboa, Portugal
2
Faculty of Environmental Sciences, Universidad Piloto de Colombia, Carrera 9 No. 45A-44, 110231 Bogotá, Colombia
3
Mining and Industrial Engineering School of Almadén, Universidad de Castilla–La Mancha, Plaza Manuel Meca 1, 13400 Almadén, Spain
*
Author to whom correspondence should be addressed.
Water 2017, 9(5), 340; https://doi.org/10.3390/w9050340
Submission received: 20 April 2017 / Revised: 6 May 2017 / Accepted: 8 May 2017 / Published: 12 May 2017

Abstract

:
This paper is a Colombian case study that calculates the total water footprint (blue, green, and grey) for heavy crude production (11.5 average API gravity) occurring in three fields, located in the Magdalena watershed. In this case study, the highest direct blue footprint registers 0.19 m3/barrel and is heavily influenced by cyclic steam stimulation practices. This value could be reduced if the water coming out of the production well was to be cleaned with highly advanced wastewater treatment technologies. The highest grey water footprint, at 0.06 m3/barrel, is minimal and could be reduced with conventional wastewater treatment technologies and rigorous maintenance procedures. The green water footprint is negligible and cannot be reduced for legal reasons. The indirect blue water footprint is also considerable at 0.19–0.22 m3/barrel and could be reduced if electricity was produced onsite instead of purchased. In addition, the paper identifies methodological flaws in the Colombian National Water Study (2014), which wrongly calculated the direct blue water footprint, leading to a 5 to 32-fold sub-estimation. It also ignored the grey, with important implications for water resource policy and management. To rectify the situation, future National Surveys should follow the procedure published here.

1. Introduction

The interdependence between water and energy is growing as demand for both these resources increases. Almost all energy production requires copious amounts of water, whilst in turn the treatment and transport of water requires energy (mainly in the form of electricity). Via the water footprint, it is possible to implement tools which enable a company to develop opportunities for environmental impact reduction, via benchmarking, in line with sectorial standards.
Accounting for water use through the water footprint is likely to reduce costs and excessive waste through the optimization of processes, operations, and management. It may also lead to the introduction of environmental policies at the corporate level, as quantitative measurements allow for a better understanding of industrial activities and the influence such activities have on the local environment and surrounding community.
Big users of water such as the agriculture sector are known publically to contribute to acute local water shortages [1], but demands derived from hydrocarbon extraction remain largely invisible to the public eye [2], except when it comes to shale oil and gas extraction [3]. That said, and despite its limited role, when compared to other sectors, there is a widespread recognition, by insiders, that water scarcity presents a risk to business success [4]. This is especially true for heavy crude operations given that, as this paper shows, they require considerable quantities of water in enhanced recovery operations and will contribute to the cumulative effect of multiple abstractions within a catchment zone.
Yet, and despite their impact, there is a considerable hole in the literature regarding water use and the water footprint of heavy oil operations that do not occur in oil sands. The work by Rosa et al. [5] is a rare example of the latter, whilst Kondash and Vengosh [6] calculate the water footprint for hydraulic fracturing. These papers are however relatively new, and as commented by Spang et al. [7]:
For oil production we used an averaged water consumption factor for primary and secondary extraction since we did not have data on the deployment of more advanced technologies, such as Enhanced Oil Recovery (EOR).
This paper, which builds upon that of Carmona [8], comprehensively focuses on the water footprint associated with heavy crude extraction that does not occur in tar sands. This is both surprising and necessary given that, as is discussed in the literature review, heavy crude constitutes 15 percent of global oil resources and production is expected to increase [9,10]. In Colombia, where this case study is based, heavy oil makes up the majority of production [11].
For the present case study, a direct and indirect water footprint measurement was undertaken using data collected from a private company operating in three heavy oil fields (11.5 API gravity) in the Middle Magdalena sub-watershed, Colombia. The oil in these three fields is extracted using two different heavy oil extraction technologies (cyclic steam stimulation and secondary recovery). The year chosen for measurement of the water footprint was 2012, due to the completeness of information, although some extra analysis regarding the representativeness of the results is based on 2012–2015 data.
The method employed to calculate the footprint is the chain summation approach proposed by the Water Footprint Assessment Manual [12]. This method is the most appropriate as the company only produces one product (crude). It was the one adopted by the Colombian National Water Research Study undertaken by the Instituto de Hidrología, Meteorología y Estudios Ambientales (IDEAM) [13] and so makes the most sense, as it allows for comparisons.
Our methodological scope considers the blue, green and grey water footprints, which is the consumption of water in industrial processes, that which is used for reforestation as a legal form of environmental compensation, and wastewater discharge to water bodies, respectively. All water footprints are calculated from direct consumption (the water which comes from the local watershed) from well to barrel. In addition, the indirect blue water footprint was also measured, to ascertain the amount of water embodied in the energy and materials required to make the product.
The indirect blue water footprint is compared to the direct so to evaluate from where the consumed water was originally extracted. Following this measurement, a sustainability assessment of the product’s water footprint, based on the abundance of water relative to the local watershed, is considered and suggestions are made to reduce it.
This paper contributes to academic literature because it gives other researchers a baseline when it comes to non-tar sands heavy oil production processes and the quantities of water needed to produce heavy crude with both secondary and enhanced recovery. It is also the first non-corporate report that we know of that specifically expresses the total water footprint, and how it was calculated, for a heavy oil, non-tar sands operation. Furthermore, this paper also validates and improves upon Colombian national water policy because we compare our results to the average values calculated by the state. Our values, supported by secondary sources (see Section 5.1), helped identify flawed methodological practices in the calculation of the hydrocarbon’s sector direct blue water footprint (the others were not mentioned) in the 2014 Colombian National Water Study (NWS-2014) [13]. This study is very important at the national level and is used by the Colombian Government as a policy tool to manage water resources. Consequently, any sub-estimation of the water demand within a watershed will lead to poor policies being drawn up and environmental degradation. Our paper is therefore useful in that it identifies weaknesses in the government’s method and provides an alternative methodology to support ‘good water governance’ [14].

2. Literature Review

2.1. Water Scarcity and Water Footprint

It is estimated that by 2025 more than three billion people could be living in areas suffering water stress. In addition, it is expected that 14 countries will not only suffer water stress but water scarcity [15]. Water scarcity is both a natural and anthropogenically caused problem, and may be defined as an imbalance between supply and demand. It is a natural problem given that whilst there is enough fresh water on the planet to support seven billion people, its distribution is not even [16]. Furthermore, certain societal activities contribute to the issue of regional water access and scarcity through poor public planning, allocation and management, or inappropriate demands on an aquifer relative to the geographical location of a settlement and the size of a population’s water footprint. In other words, when the amount of water demanded by a local population exceeds the amount available at the current price, or in given access conditions, water becomes a scarce public good. Water scarcity can, in turn, be exacerbated by pollution or excessive irrigation by industrial, commercial or municipal users [17]. One way to keep checks on water policy, management and practice is through the water footprint calculation, which supports both the public and private sector in forming strategies aimed at improving water availability and quality.
According to the Water Footprint Network (2017) [18], the water footprint, which measures water use (in cubic meters per time unit), forms part of a larger family of concepts that have developed in the environmental discourse over the past two decades [19,20,21]. A “footprint” applied in the environmental sphere is a quantitative measure showing the appropriation of natural resources or the pressure societal places on the environment [22,23]. The ecological footprint, for example, measures the use of bio-productive space (hectares), whilst the carbon footprint measures the amount of greenhouse gases produced, measured in carbon dioxide equivalents (tons) [24,25]. For the water footprint specifically, it is important to specify the temporal-spatial relationship. This is necessary because the availability of water varies highly in space and time, and should always be considered in its local context [26].
The concept of the water footprint was created in 1996 by Allan [27]. It was conceived as a strategic indicator that could help solve the problem of water abstraction in countries, such as those in the Middle East and North Africa, where water availability is particularly acute. This concept was expanded by Hoekstra and Hung [28], who used it similarly to the ecological footprint as a tool to quantify the water used, directly or indirectly, in the production of agricultural or industrial goods, in order to state the water balance relative to water needs and availability. They established the idea of blue water (surface and subterranean) and green water (rainwater), as concepts along with the idea of a national level water index [29]. In 2008, the definition of the water footprint was clarified and became that water used to produce a given good in a certain production process and location. In 2009, the concept was expanded into a multidimensional indicator to include the indirect or direct water use by either a consumer or producer, throughout the supply chain [26]. Thus, whilst it can be an aggregate number, in order to have any meaning the footprint must be compared to available resources (through a sustainability assessment). Of the geographical environmental sustainability indicators (green and blue water scarcity and water pollution level), the blue water scarcity indicator is the most developed and is currently applied [30].
In Colombia, four similar indicators developed by the Colombian Institute for Hydrology, Meteorology and Environmental Studies (Instituto de Hidrología, Meteorología y Estudios Ambientales, IDEAM) and published in the National Water Studies are used nationally for water policy planning and resource management [13]. These are the water vulnerability index (índice de vulnerabilidad hídrica, IVH), non-returned water to the water basin index (índice de agua que no retorna a la cuenca, IARC), ecosystem water stress (índice de presiones hídricas a los ecosistemas, IPHE) and potential changes in water quality (índice de alteración potencial de la calidad del agua, IACAL).
The IVH evaluates the water supply and its variability relative to identified threats, such as those posed by the El Niño, at the local level, i.e., watershed and sub-basin. The IARC is similar to the “blue water scarcity index” proposed by Hoekstra el al. [12]. It is used to calculate the relation between all blue water footprints, across all sectors operating in the watershed relative to the available surface water for a given period of time, normally over a year. The IPHE (which is similar to the “green water scarcity index” proposed by Hoekstra el al. [12]) evaluates the vulnerability of the water resources in the subzone due to agricultural activities, fishing, and non-irrigated forestry. This index is estimated using the combination of the total green water footprint for the sub-basin and the available green water in the subzone. Finally, the IACAL determines potential threats which have the ability to alter water quality. This is useful as it evaluates contaminant load that may influence the health of the watershed.
A revision of literature measuring the Colombian water footprint shows a limited number of papers at the different levels: national, as part of the NSW-2014 [13,31], watershed, such as that of the Porce River [32], and sectorial i.e., the agricultural sector [33] and the sugar cane industry [34]. There are also studies at the corporate level such as those undertaken by Proyecto SuizAgua Colombia, an initiative which evaluated the water footprint of 20 companies with Swiss origins or partners [35], although the results are not publicly available. There is also research undertaken at the product/service level, such as for tea and coffee consumption and production, for beer beverages [36] and Japanese lily flowers [37].
Generally, the methodology for measuring the water footprint of a given product can be broken down into four stages [12]:
  • Establishment of objectives and scope: the decision to perform a study into one’s water footprint may be because of the particular goals of interested organizations, which are in turn defined by public or corporate policies. In terms of contextual scope, the study may consider an endless number of applications or entities, such as productive processes, goods or services. The value of the whole chain may be considered or it may be limited to a certain geographic area or a particular client etc. The organization should clearly state the scope of the water footprint itself i.e., if it will take into consideration all types (blue, green or grey or indirect and direct or only direct) or just one specifically. The spatial-temporal dimension of the study, as aforementioned, is essential.
  • Accounting (inventory): This step takes into consideration the sum of all kinds of water consumption expressed in terms of unit production (e.g., m3/crude oil barrel). Both direct and indirect (e.g., raw materials provided by the supply chain) company processes could be included with exact details dependent on the objective of the study.
  • Sustainability assessment: an approximation is made to analyze the degree of water stress relative to water availability, and for the determination of hotspots (e.g., especially vulnerable/sensitive areas).
  • Response to water footprint (reduction strategy): Establishment of an action plan to mitigate or compensate any detrimental impacts caused by the organization’s significant direct and indirect activities. In this paper, as the authors do not belong to a company, we simply made suggestions based on our personal experience within and knowledge of the sector.

2.2. Hydrocarbon Sector: Water Scarcity and Footprint

Around 70 percent of the blue water society abstracts is used for agriculture, about one-fifth is used by industry and about one-tenth is consumed by the domestic sector [38,39,40]. Of the industrial water withdrawals, about two-thirds are related to energy and power production [41]. Big users of water such as the agriculture sector are known publicly to contribute to shortages, whilst water requirements for the hydrocarbon sector are largely invisible [2], except when it comes to shale oil and gas extraction, given that 38 percent of the world’s shale resources are in areas that are either arid or experiencing extremely high levels of water stress [3]. That said, and despite its limited role, when compared to other sectors there is a widespread recognition as to the importance of water, with 72 percent of energy companies stating that water scarcity presents a risk to their success [4]. In 2013, 59 percent of companies surveyed in the sector, reported “to have already experienced water-related impacts on their business operations” [42].
The oil sector requires water in most operations involving well drilling and oil pumping. Gleick [43] estimated that approximately 2–8 m3 of water per 103 GJ (thermal) is used in the drilling, flooding and treating of crude, if conventional methods are used. For more complicated oil fields, crude extraction can be improved by enhanced recovery. Such methods are being used more often and thus are becoming more conventional, as the best resources have already been extracted. If thermal methods are used, such as cyclic steam stimulation (CSS), copious volumes of water are required in the form of steam, to improve the viscosity of the crude oil, which in turns supports pumping [44]. A typical thermal steam injection, according to Gleick [43] uses 100–180 m3 of water per 103 GJ (thermal).

3. Colombian Case Study

3.1. Colombian Water Resources

Colombia’s geographic location, topographic and neo-tropic climatic conditions means that it holds a privileged position when it comes to water availability, with a registered mean annual runoff of 2100 km3 [45]. However, and despite this water wealth, deforestation and pollution, beginning in the 1970s and continuing to the present day, have increased pressure on various water sources, in terms of quality and quantity. This issue has been exacerbated by the long-held perception of water invulnerability, which has delayed technical and political developments associated with its efficient use [46]. In fact, it is estimated that by 2025, 22 percent of the Colombian population will be exposed to water scarcity, if steps are not taken to improve water management [47]. As identified by the Colombian Ministry of the Environment and Sustainable Development [48], part of the problem is that the Colombian government has limited knowledge when it comes to water use, contamination, and abstraction by social agents. Few hydrological models exist, whilst the impact of contamination is largely unknown, given that only 5 percent of subterranean waters have been mapped. Furthermore, it is estimated that only 24 percent of those abstracting water hold a valid permit and that very few users monitor flow or any other parameters indicative of water quality and quantity. Other issues include insufficient indicators and political objectives with which to strategize and improve water resource policy and management. Limited implementation and planning and inefficient legal procedures also compound matters. This had led to water scarcity and public unrest, as reported in the national media [49]. One such case was in the Department of Casanare, where the hydrocarbon sector was blamed for the exacerbation of droughts, as a consequence of failing to follow the National Hydrocarbon Agency’s recommended procedures [50]. Socio-political issues are particularly acute in El Niño years, where the drop in flow for Colombia’s largest river—the Magdalena—can be as high as 55 percent. Even in non-El Niño dry years, the national river runoff average can be reduced to 1400 km3 [51].
Of all the Colombian watersheds, that of the Magdalena, with a total area of 273,459 km2, is the most important. Despite representing less than 25 percent of the annual freshwater resource in the country, it is estimated that around 95 percent of the water extracted in industrial and domestic processes is taken from the Magdalena-Cauca basins and its tributaries flowing into the Caribbean Sea [52]. It is also of significance because it constitutes 24% of the national territory and is home to 79% of the country’s population. In addition, in 2004, the area generated approximately 85% of Colombia’s gross domestic product [53]. This intensity of GDP has generated many of the negative effects, including considerable changes in land cover and ecosystem conditions. In this case study, the cumulative impact of anthropogenic activities are something the hydrocarbon company has to consider carefully given that its economic activities are performed in the Magdalena-Cauca watershed.
Specifically, the hydrocarbon operations in this present case study are performed in the Middle Magdalena (Figure 1), which has the second highest level of crude production in the country [54]. The principal refinery in Colombia (Barrancabermeja) is also located in this watershed. In 1922, it produced 1500 crude oil barrels, a figure that increased to 213.2 million in 2016 [55].
The Middle Magdalena hydrographic area is the portion of the Magdalena water basin situated in a valley that lies between the Eastern and Central mountain chains of the Andes. It extends 386 km and covers 32,000 km2, which corresponds to 22.5 percent of the total Colombian land surface and in turn can be broken down into 21 sub-hydrographic zones. The region is tropical and is exposed to a bimodal hydrological regime. The most significant parameters of both the Middle Magdalena and the sub-zone where the company operates are presented in Tables S1–S3 (Supplementary Material).
In terms of water quantity and quality conditions, the Middle Magdalena’s IVH is low, which means that demand relative to supply is less than 10 percent and that the variability in the natural water resource supply is low both in terms of “normal” conditions and in times of extreme drought. For the IPHE, the Middle Magdalena falls into the category “very high”, (approx. 67.6 million m3/year of green water availability) which means that the watershed is highly affected by competing demands for the water resource. The demand is shared unequally between the agricultural sector and protected natural areas, including the Parque Regional Natural de la Serranía de las Quinchas, which contains important ecosystems and ecosystem services. The latter are adversely by agricultural irrigation, as much of the available water is diverted for the watering of crops and for the sustenance of livestock [13,56,57,58]. The IARC for the Middle Magdalena is categorized as “very low”, meaning that the blue water footprint does not exceed water availability and corresponds to less than 10 percent of the surface water resource.

3.2. Heavy Crude Oil Extraction

Produced water, in other words, that which is extracted together with the oil (as it occurs naturally in the deposit) is the largest by-product associated with oil extraction. Consequently, the cost of managing the large volumes generated is an important component of the overall cost of crude production, particularly for heavy oils or mature conventional oil fields [59].
In conventional crude production, oil is driven from the geological formation up through the production wells by the pressure of dissolved natural gas. If that pressure is not sufficient, as is the case for heavier oils, then improved production techniques need to be used. These methods and processes use thermal, chemical, or fluid phase behavior effects to decrease, or remove, the capillary forces that trap viscous oil within the pore spaces. They may also be used to reduce oil’s viscosity. Either way, they are designed to improve the mobility of heavy oil and increase production [60]. Heavy oils are asphaltic, dense and viscous in nature. To classify as a “heavy oil” they must have an API gravity of between 10 and 20 degrees (the lower the figure, the heavier they are) and the viscosity must be > 100 cP.
One method used by the company to produce crude is secondary recovery. The purpose of this is to maintain reservoir pressure and force the crude to flow towards the production well. The most common techniques involve gas injection or waterflooding. The latter is used by the company in the older oil field, as is common elsewhere [61]. For heavy crudes however, enhanced recovery techniques are used to obtain higher levels of production.
A common type of enhanced recovery (also known as tertiary recovery or enhanced oil recovery—EOR) for heavy oils is thermal flooding with steam injections. There are two main methods that fall under the umbrella of steam injection: steam flooding (which is simpler and not used by the company in the case study) and CSS, that is to say cyclic steam stimulation (also known as the huff and puff method). In CSS, heavy oil is heated by injecting steam into a single well for a period of several weeks prior to production. Afterwards, the flow is reversed, and the oil exits, along with the production water, through the same well. This process is repeated several times until it becomes too difficult to obtain more oil [62]. It typically demands a lot of energy and water, hence the company’s interest in measuring the water footprint. The exact amount of treated freshwater (as salinity, hardness and other impurities cause problems) used in thermal techniques depends on the ability to substitute saline water sources, the characteristics of the crude and reservoir conditions and the efficiency and degree of water recycling [41].

3.3. Company Specifics

In this case study, the company in question explores, exploits and transports heavy crude in three oil fields of differing ages. The crude extracted has a viscosity of between 1000 cP and 10,000 cP and an average API gravity of 11.5. Two of the fields use enhanced recovery (CSS) and the other uses secondary recovery. The water used in the production process is taken from the neighboring rivers, and from subterranean waters, the latter being more representative in terms of volume (98% of abstracted water).
Of the two fields that produce oil via CSS, one produces 55 percent of the total and the other, 36 percent. In terms of field age, those operating with CSS were established in 2002 and 2008 respectively, whilst that using secondary recovery was first used for production in 1940. The CSS fields are joint ventures with the state-owned hydrocarbon company Ecopetrol, and are licensed out to the company. These licenses are up for renewal within the next five years. Production prospects for the newest fields are reasonable and economically viable, even if the market price remains low (between $35 and $60 USD).
The following are the main facilities at the three oil fields (with the exception of the vapor production facilities which are only found at two), which affect the local surface and subterranean water availability include production clusters, vapor production, collection and transference plants, treatment and pumping modules, residual water treatment plants (domestic, industrial and production wastewater), and auxiliary industrial processes. Readers requiring detailed information regarding the processes are asked to refer to the Supplementary Material.

4. Methodology

As discussed in the literature review, the water footprint is an index used to evaluate the direct and indirect consumption of freshwater for a product or a process. For this case study, its calculation is composed of blue water (direct consumption), green (evapotranspiration) and grey (wastewater), within the scope presented in Section 3.3. In this paper the water footprint is calculated using the guidance stated in the Water Footprint Assessment Manual [12], as shown in Figure 2. The water footprint per unit barrel for each oil field is calculated seperately. The direct blue and grey water footprints are calculated using primary data obtained from the various metres on site. The indirect blue and direct green footprints are estimated using computer models.

4.1. Project Objectives and Scope

The company’s objectives are to evaluate and manage, via the blue, green and grey water footprints, the potential effect that their heavy crude oil exploitation has on the environment, particularly the surface waters of the River Magdalena and the surrounding aquifers. The approximation of this analysis is expected to support the company’s wider sustainability goals and the construction of strategies directed at improving corporate image and public relations with shareholders, employees, sub-contractors, clients and society at large. In addition, the calculation of the water footprint is also undertaken to meet goals linked to the optimization of field processes and operations, through the reduction of avoidable costs and resource consumption.
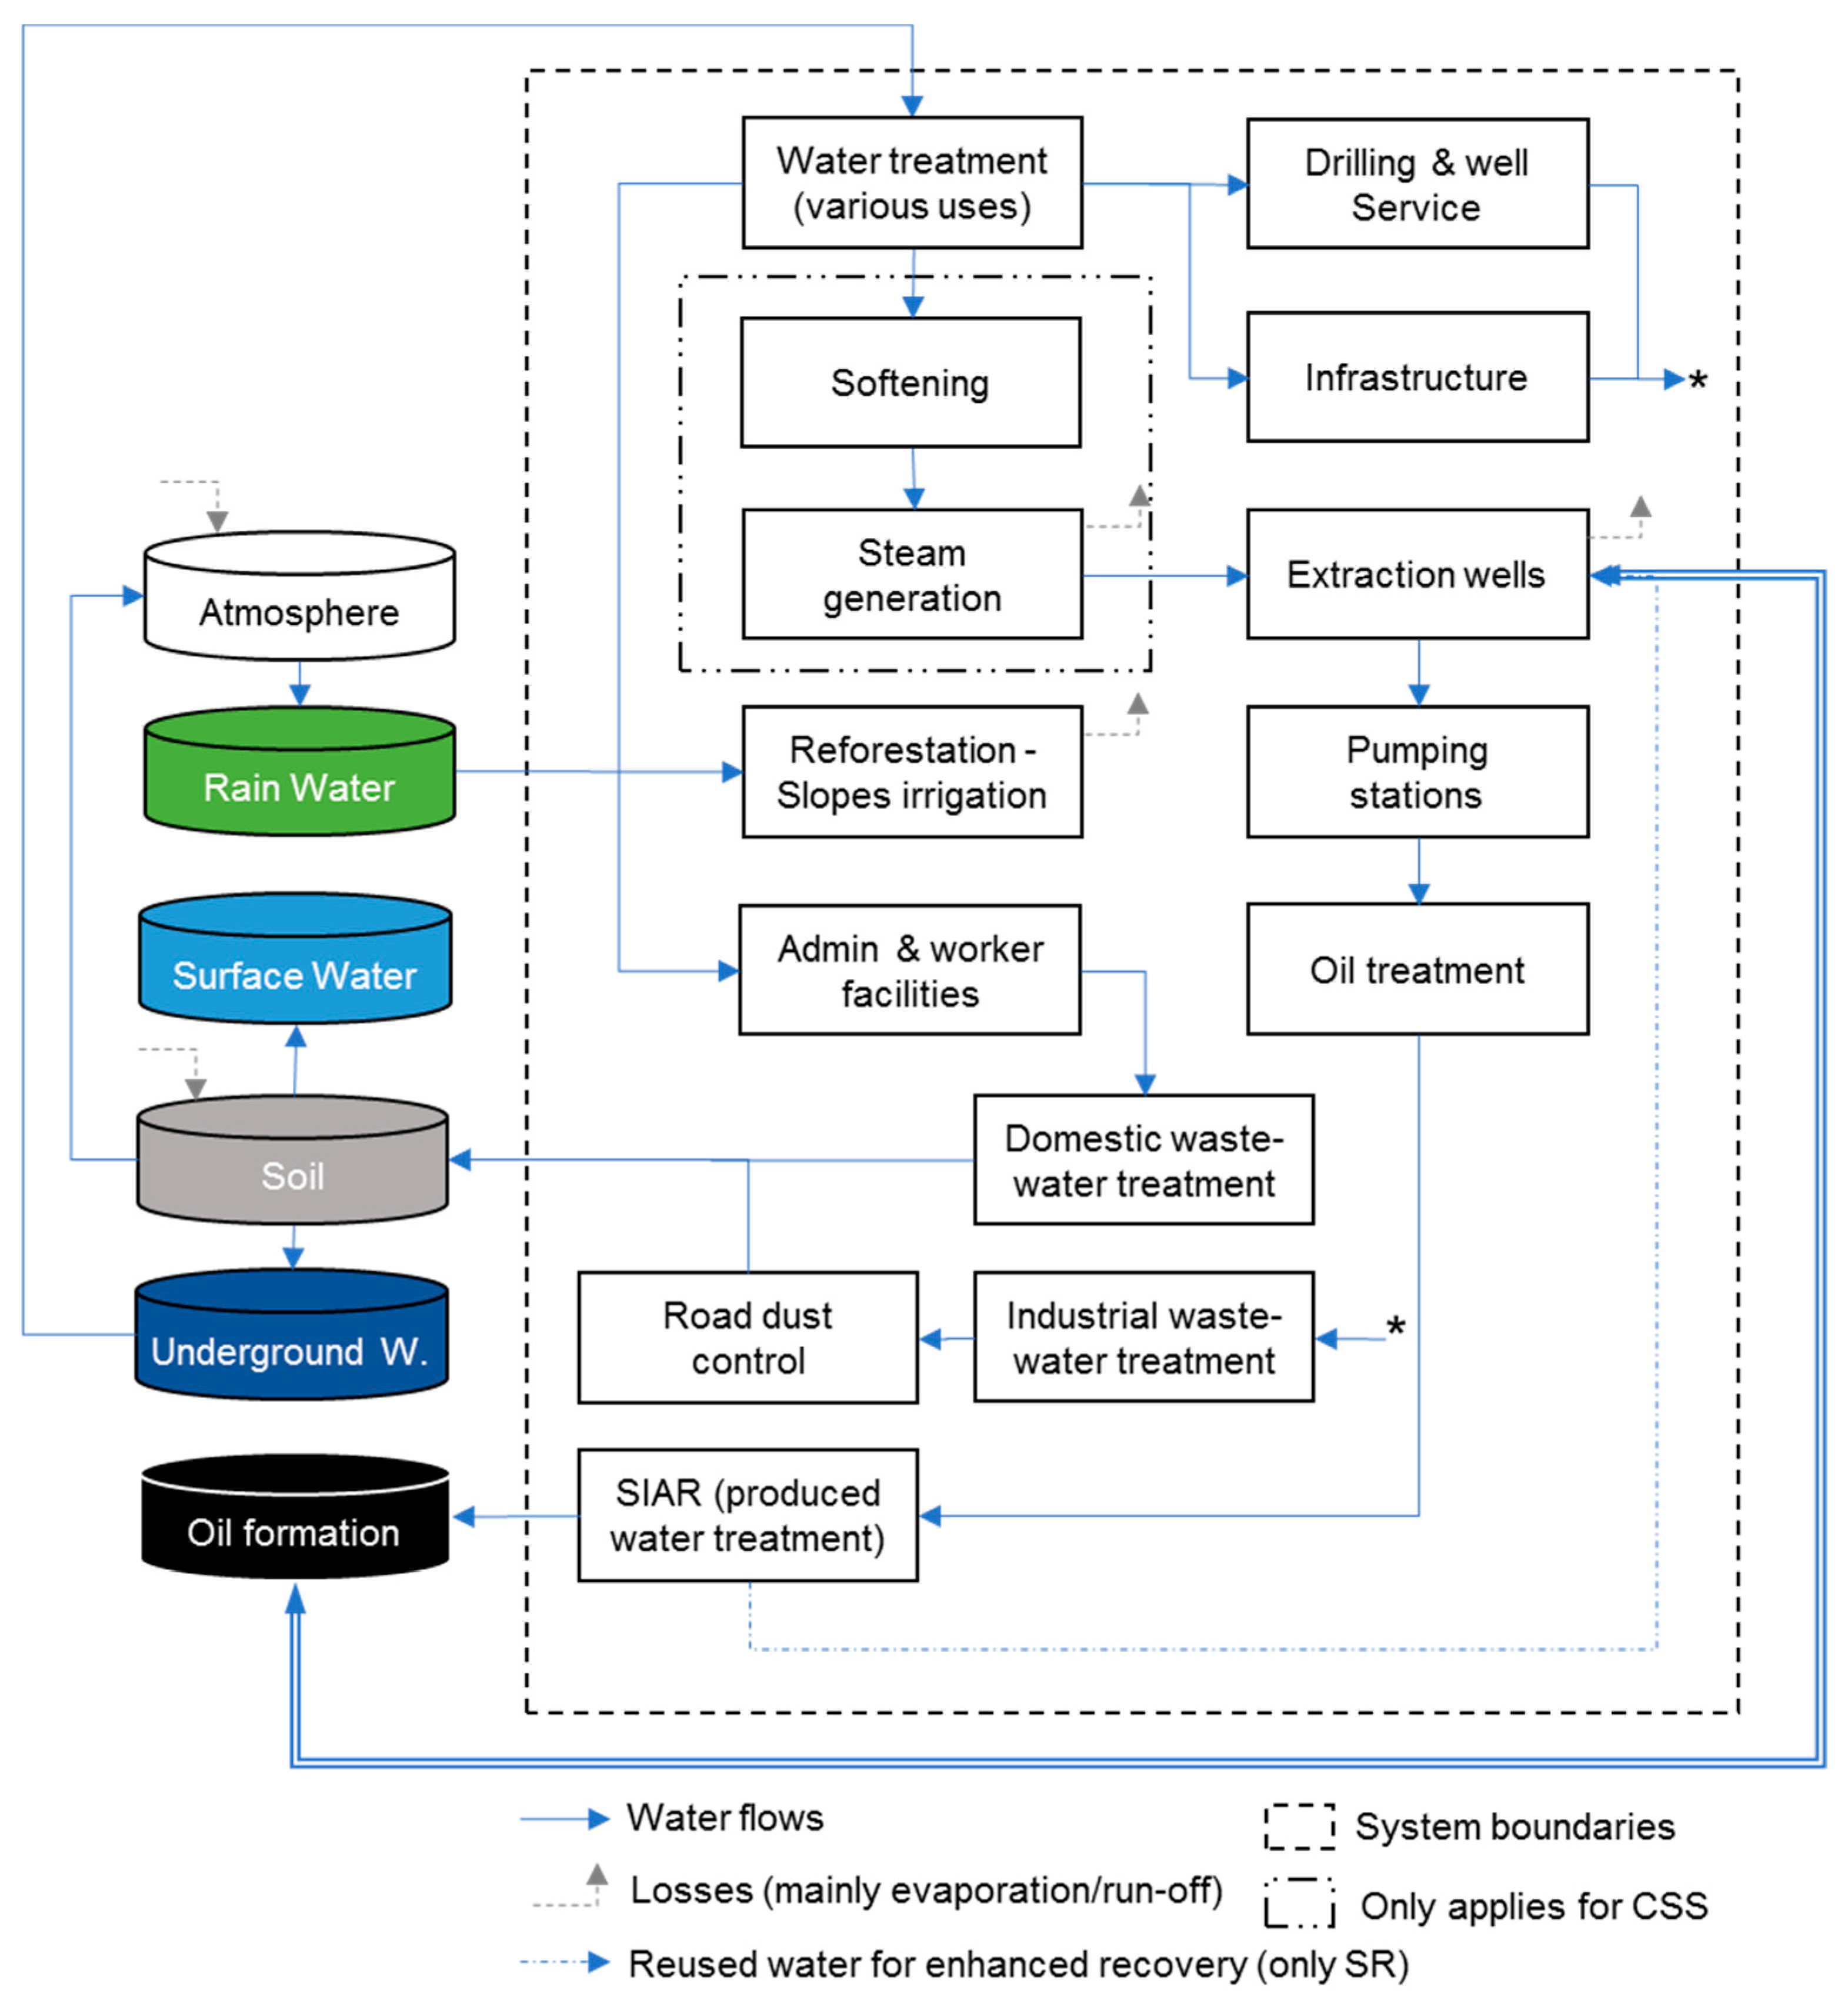
The scope of the water footprint calculation is delimited by Figure 3 which shows the system boundaries and water inputs/outputs.

4.2. Water Inventory

In line with the company’s objectives and scope the blue, green and grey footprints are ascertained. For the blue footprint, the water consumption for each installation is calculated and differentiated according to use. The calculation of the direct water footprint is performed only for those operations and processes directly executed by the company, within the watershed. The indirect water footprint takes into account the water consumed to manufacture the auxiliary material and energy products, used by the core processes (Figure 3) and which make the crude extraction supply chain possible.

4.2.1. Direct Blue

The direct blue water footprint is that which corresponds to the freshwater taken from the surface or subterranean flows and is consumed in a determined process/operation [12]. In this case, it relates to all those activities associated with the extraction of oil in the three monitored fields. The aspects that constitute the blue footprint, in this case study, include the water used in steam injection, regardless of whether it evaporates on injection, which remains in the oil formation or leaks into the surrounding environment, or flows back out with the crude and is collected and disposed, via re-injection, into the geological formation, as is intended, or escapes with the crude and is not re-injected. It also takes in consideration water from auxiliary activities, as explained in the Supplementary Material.
One of the limitations of this method is that whilst we can account for the total blue footprint, based on the data readings from the various meters operating in the system, we cannot differentiate with precision where the water injected in the cyclic steam stimulation ends up. We can only state with certainly that 99 percent of the water consumed does not return to the watershed, given that it is either injected as part of the CSS process, through the production well, and condenses and becomes trapped in the formation, or is exported in the crude (between 0.3% and 0.8% of the final product is either water or basic sediments), or is re-collected, treated and disposed of in the formation, but not through the production well.
As aforementioned in the literature review, the water footprint is relative and linked not only to a geographical location but also a time period. That said, given that the water consumed by the company does not return to the watershed this aspect is not relevant to the calculation and was thus not included.

4.2.2. Green

The green water footprint typically applies to those organizations that produce agricultural or forestry products. It represents the precipitation that reaches the soil and that which is not lost through erosion, but instead temporarily stored in the upper part of soil, or in the vegetation [12]. For a hydrocarbon company this convention does not apply. Legally in Colombia, however, a hydrocarbon company must reforest, as part of environmental compensation, in order to maintain an operating license, as stipulated by Decree 1900/2006. Consequently, in this case study, the green water footprint takes into consideration the reforestation program that is planted within the boundaries of the three fields and the water consumed to support it, despite the fact that the company does not sell the product (hence why it is unconventional). It is worth stating that here that this program does not have a blue water footprint because the plants are not watered by the company. Likewise, the grey water footprint is zero because there is no application of pesticides, insecticides or fertilizer, that would otherwise contaminate the water.
The green water footprint was estimated using the CROPWAT 8.0 model, which calculates water evapotranspiration based on land area, the Middle Magdalena climate data provided by IDEAM, and the plant species on site. These species include Acacia leucocephala, Tabebuia rosea, Anacardium excelsum and Ceiba sp.

4.2.3. Grey

The grey water footprint is an indicator of freshwater contamination caused by a certain process [12]. Generally, it is limited to the existence of residual water, mainly domestic. The concept typically relates to the volume of freshwater used in contaminate dilution. Normally dilution occurs to the point that pollutants are rendered harmless, or meet the acceptable concentration level for COD (Chemical oxygen demand), BOD5 (Biological oxygen demand in 5 days), suspended solids, oils, and greases, as dictated by the national or regionally environmental authority and as stated in national, federal or local law (for this case study the applicable law is Resolution 631 of 2015).
The measurement takes as a baseline reference the level of contamination that exists in the aquifer or surface water under normal conditions. For the grey footprint to measure zero, the contaminant level in the wastewater stream must be equal or less than that of the natural water body, in which the effluent is being discharged.
For this paper, given that the majority of the treated domestic wastewater is sent to irrigation fields and permeates into the soil, and that the residual water produced in drilling and well servicing operation is used to reduce dust levels and not returned directly to the original source (Middle Magdalena watershed), the conventional “definition” is not applied. Instead, the footprint is calculated using the quantity of wastewater produced on site which would have re-entered the water body directly, if it had not have been diverted into the aforementioned activities, shown in Figure 3. The production water is not included in the calculation of the grey water footprint because it is re-injected into the geological formation and not disposed of into the surface or subterranean water bodies. In terms of the reference baseline, the parameters used are that of the aquifer because this where the majority of the extracted water comes from (Table 1).

4.2.4. Indirect Water Footprint

The calculation of the indirect blue water footprint is made taking into account data corresponding to both the materials and energy required to produce the supporting goods and services required in the core crude extraction processes. The main primary energy form is that of piped natural gas (93%). The fields require secondary energy inputs in the form of purchased electricity (4%). Diesel makes up one percent of the energy consumed on site. Iron/steel pipes, hydrated lime, cement, polyethylene, cooper, brass, PVC (polyvinyl chloride) and aluminum represent the most important resources, in terms of the quantities involved in hydrocarbon extraction.
The data used to ascertain the impact of materials was taken from the Ecoinvent 2.2 database and calculated through SimaPro 7.3 software. The water footprints for energy carriers, were taken from Arévalo [63], Wilson et al. [64] and the NWS-2014 [13]. There was no data available with which to calculate the indirect green and grey footprints.

4.3. Sustainability Assessment

The third step of calculating the water footprint involves comparing the data collected/modelled in the previous step with the relative water scarcity of the watershed [12]. This is done to determine socio-environmental issues and water stress hotspots in the area of company operations. This is ascertained through the worksheets published in the water footprint assessment manual. The maps and indexes used, in conjunction with the worksheets, are the IARC for the direct blue footprint, IPHE for the green water footprint and the IACAL for the grey footprint. These maps and indexes are published in the NWS-2014 [13].

4.4. Response to Water Footprint

This step is very important to the organization, as it gives them the opportunity to re-position themselves to enhance product sustainability. We discuss potential opportunities for improvement in Section 5.3.

5. Results and Discussion

This section shows the results and compares them with other relevant studies. We discuss the implication of our results relative to the wider issues of measuring water use and scarcity. We also provide suggestions as to how the crude product’s water footprint could be reduced and briefly discuss how corporate decisions may influence the energy-water nexus.

5.1. Direct Water Footprint

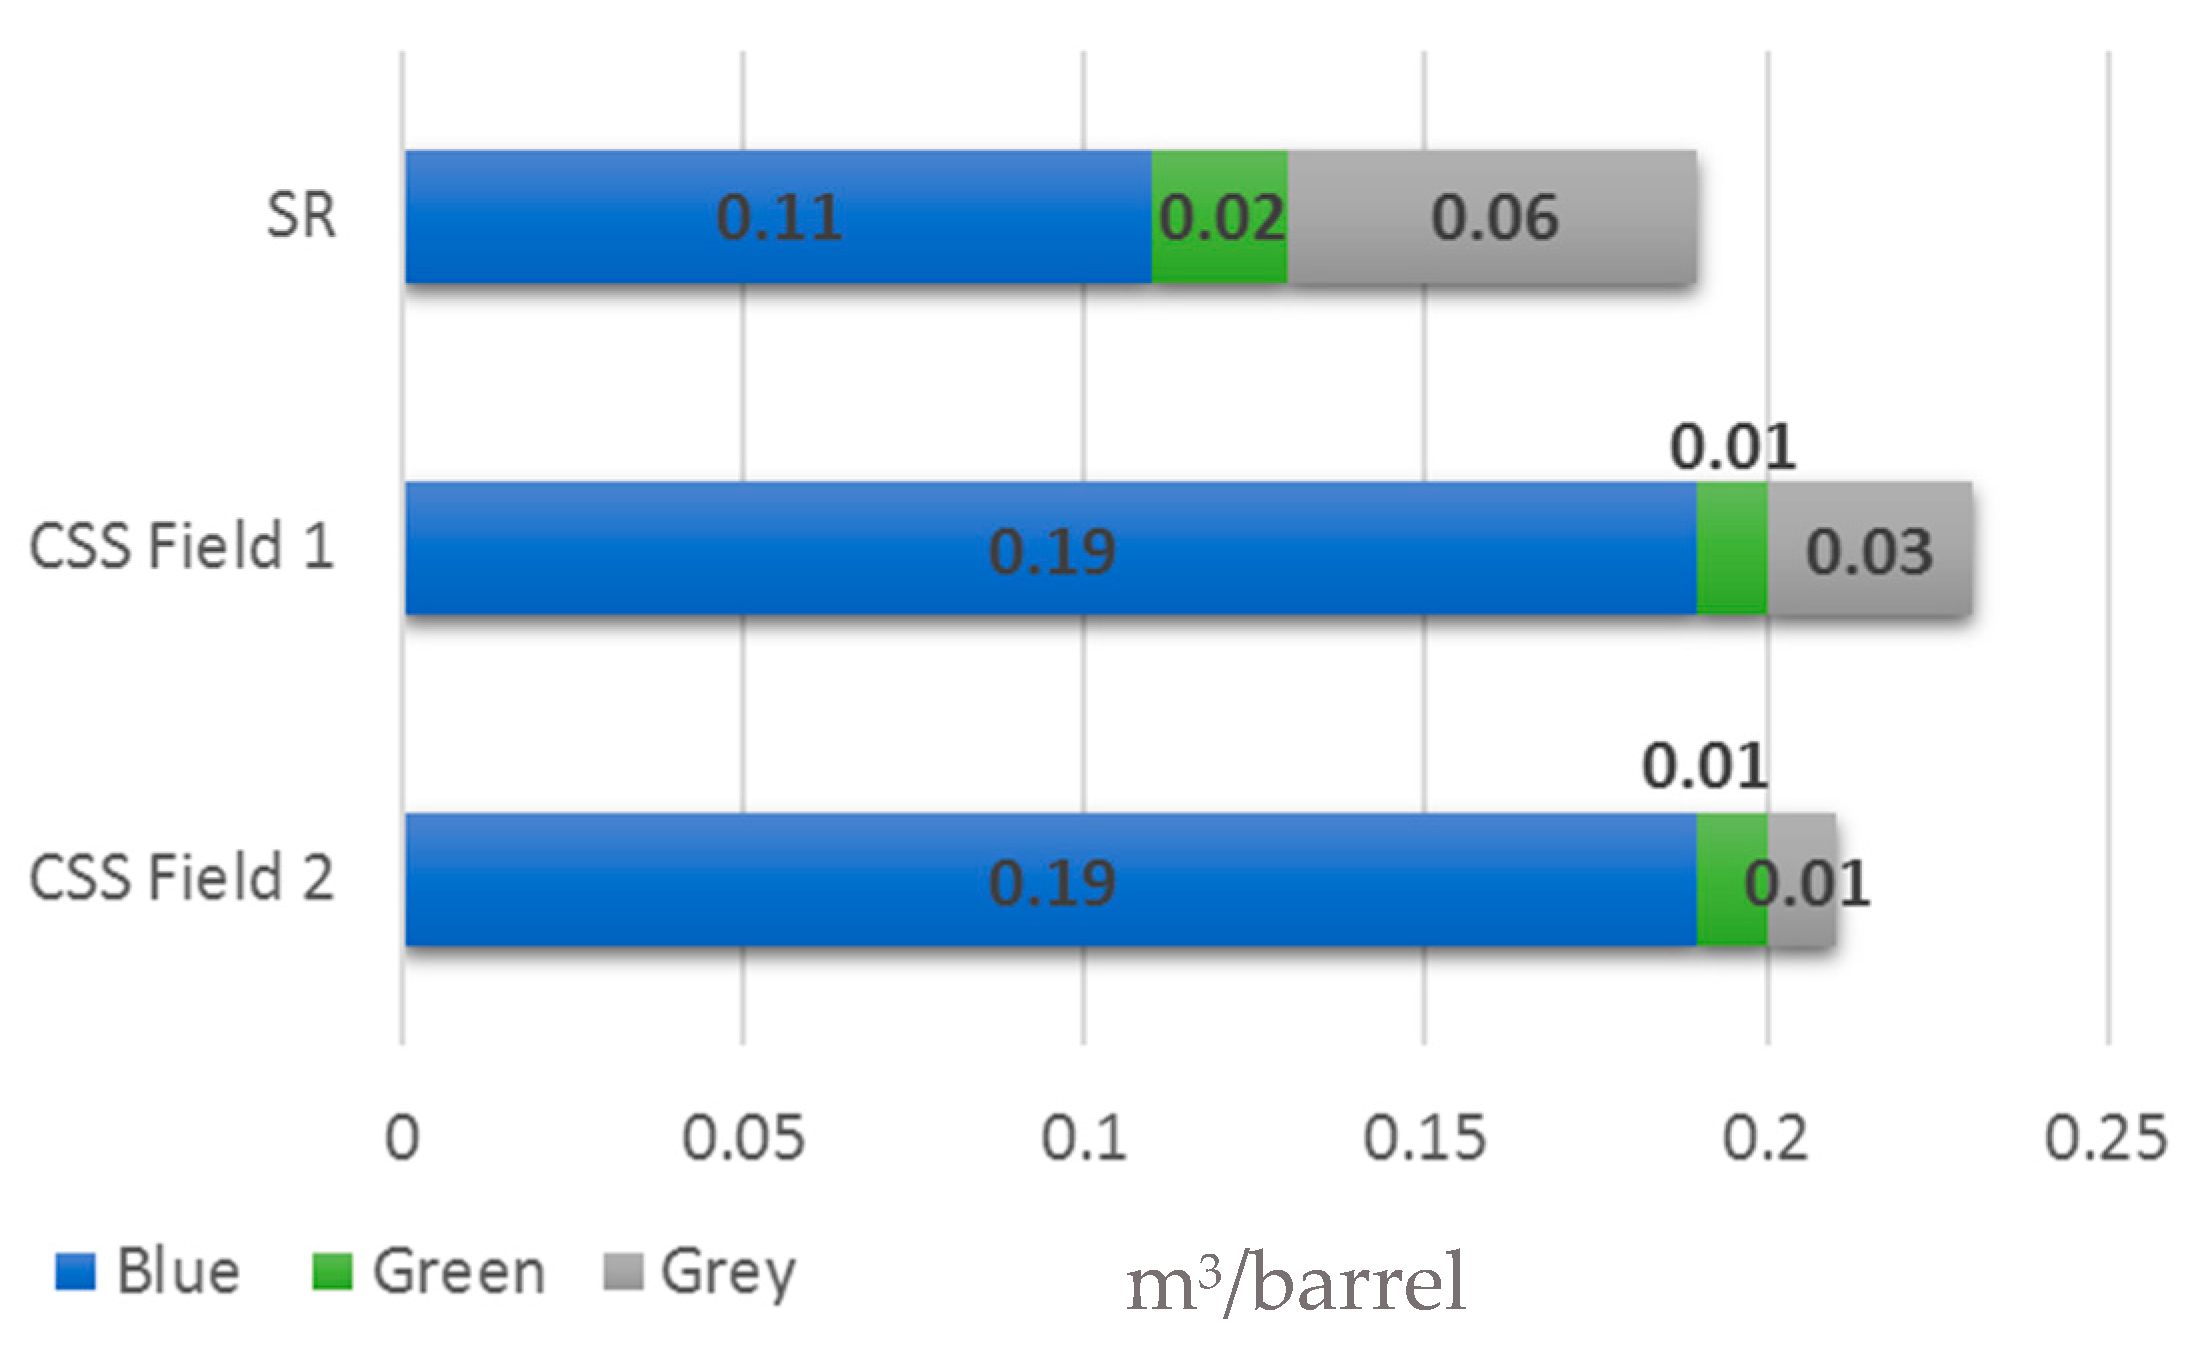
For this case study, the total direct water footprint for the different crude barrels produced by the company corresponds to 0.23 m3/barrel for CSS 1 field, 0.22 m3/barrel for CSS 2 and 0.19 m3/barrel for the field with secondary recovery. As expected, the heavy crude product’s total water footprint is predominantly represented by the blue component, due to the high volume required for steam and water injection. Steam injections contribute to 82 percent in each of two CSS fields’ total footprint. Waterflooding accounts for 40 percent of the total secondary recovery (SR) field footprint. While the two fields with a CSS system herald similar results for the blue water footprint, that with a secondary recovery system has a smaller blue and a larger grey water footprint per unit barrel, as shown in Figure 4.
In terms of blue water footprint, the principal difference between the CSS and SR operating fields result from the following aspects: Firstly, the secondary recovery field possesses a natural flow of crude, which reduces the volume of water needed in the production process. A reduction in water is also helped by the fact that the production water, which is naturally present in the geological formation, is re-injected into the production well. This reduces the amount of water that would otherwise be abstracted from water bodies, by approximately 0.17 m3 per barrel. The production water cannot be used in the CSS field so easily, giving the high level of purity required in the vapor generation process. Consequently, treated subterranean water is preferred over production water. The green footprint is minimal for all three fields and is considered irrelevant. It is slightly higher for the SR field because of the larger reforestation area that is included within its boundaries.
The grey footprint for the SR field is higher than the CSS fields due to a difference in water treatment system efficiency, given that the older field has less sophisticated technology operating. The overall grey footprint is much lower, as can be seen in Figure 4, because the majority of water extracted from the catchment area is not returned to the surrounding water bodies or the subsoil. Instead it is diverted back into steam production and re-injected into the geological formation on disposal—and neither of these practices contribute to the water footprint.
Table 1 presents the quality of both the aquifer, as this is the reference point with which to gauge the grey footprint, as discussed in the methodology, and that of the wastewater discharge following treatment. The analysis was undertaken by an independent certified laboratory.
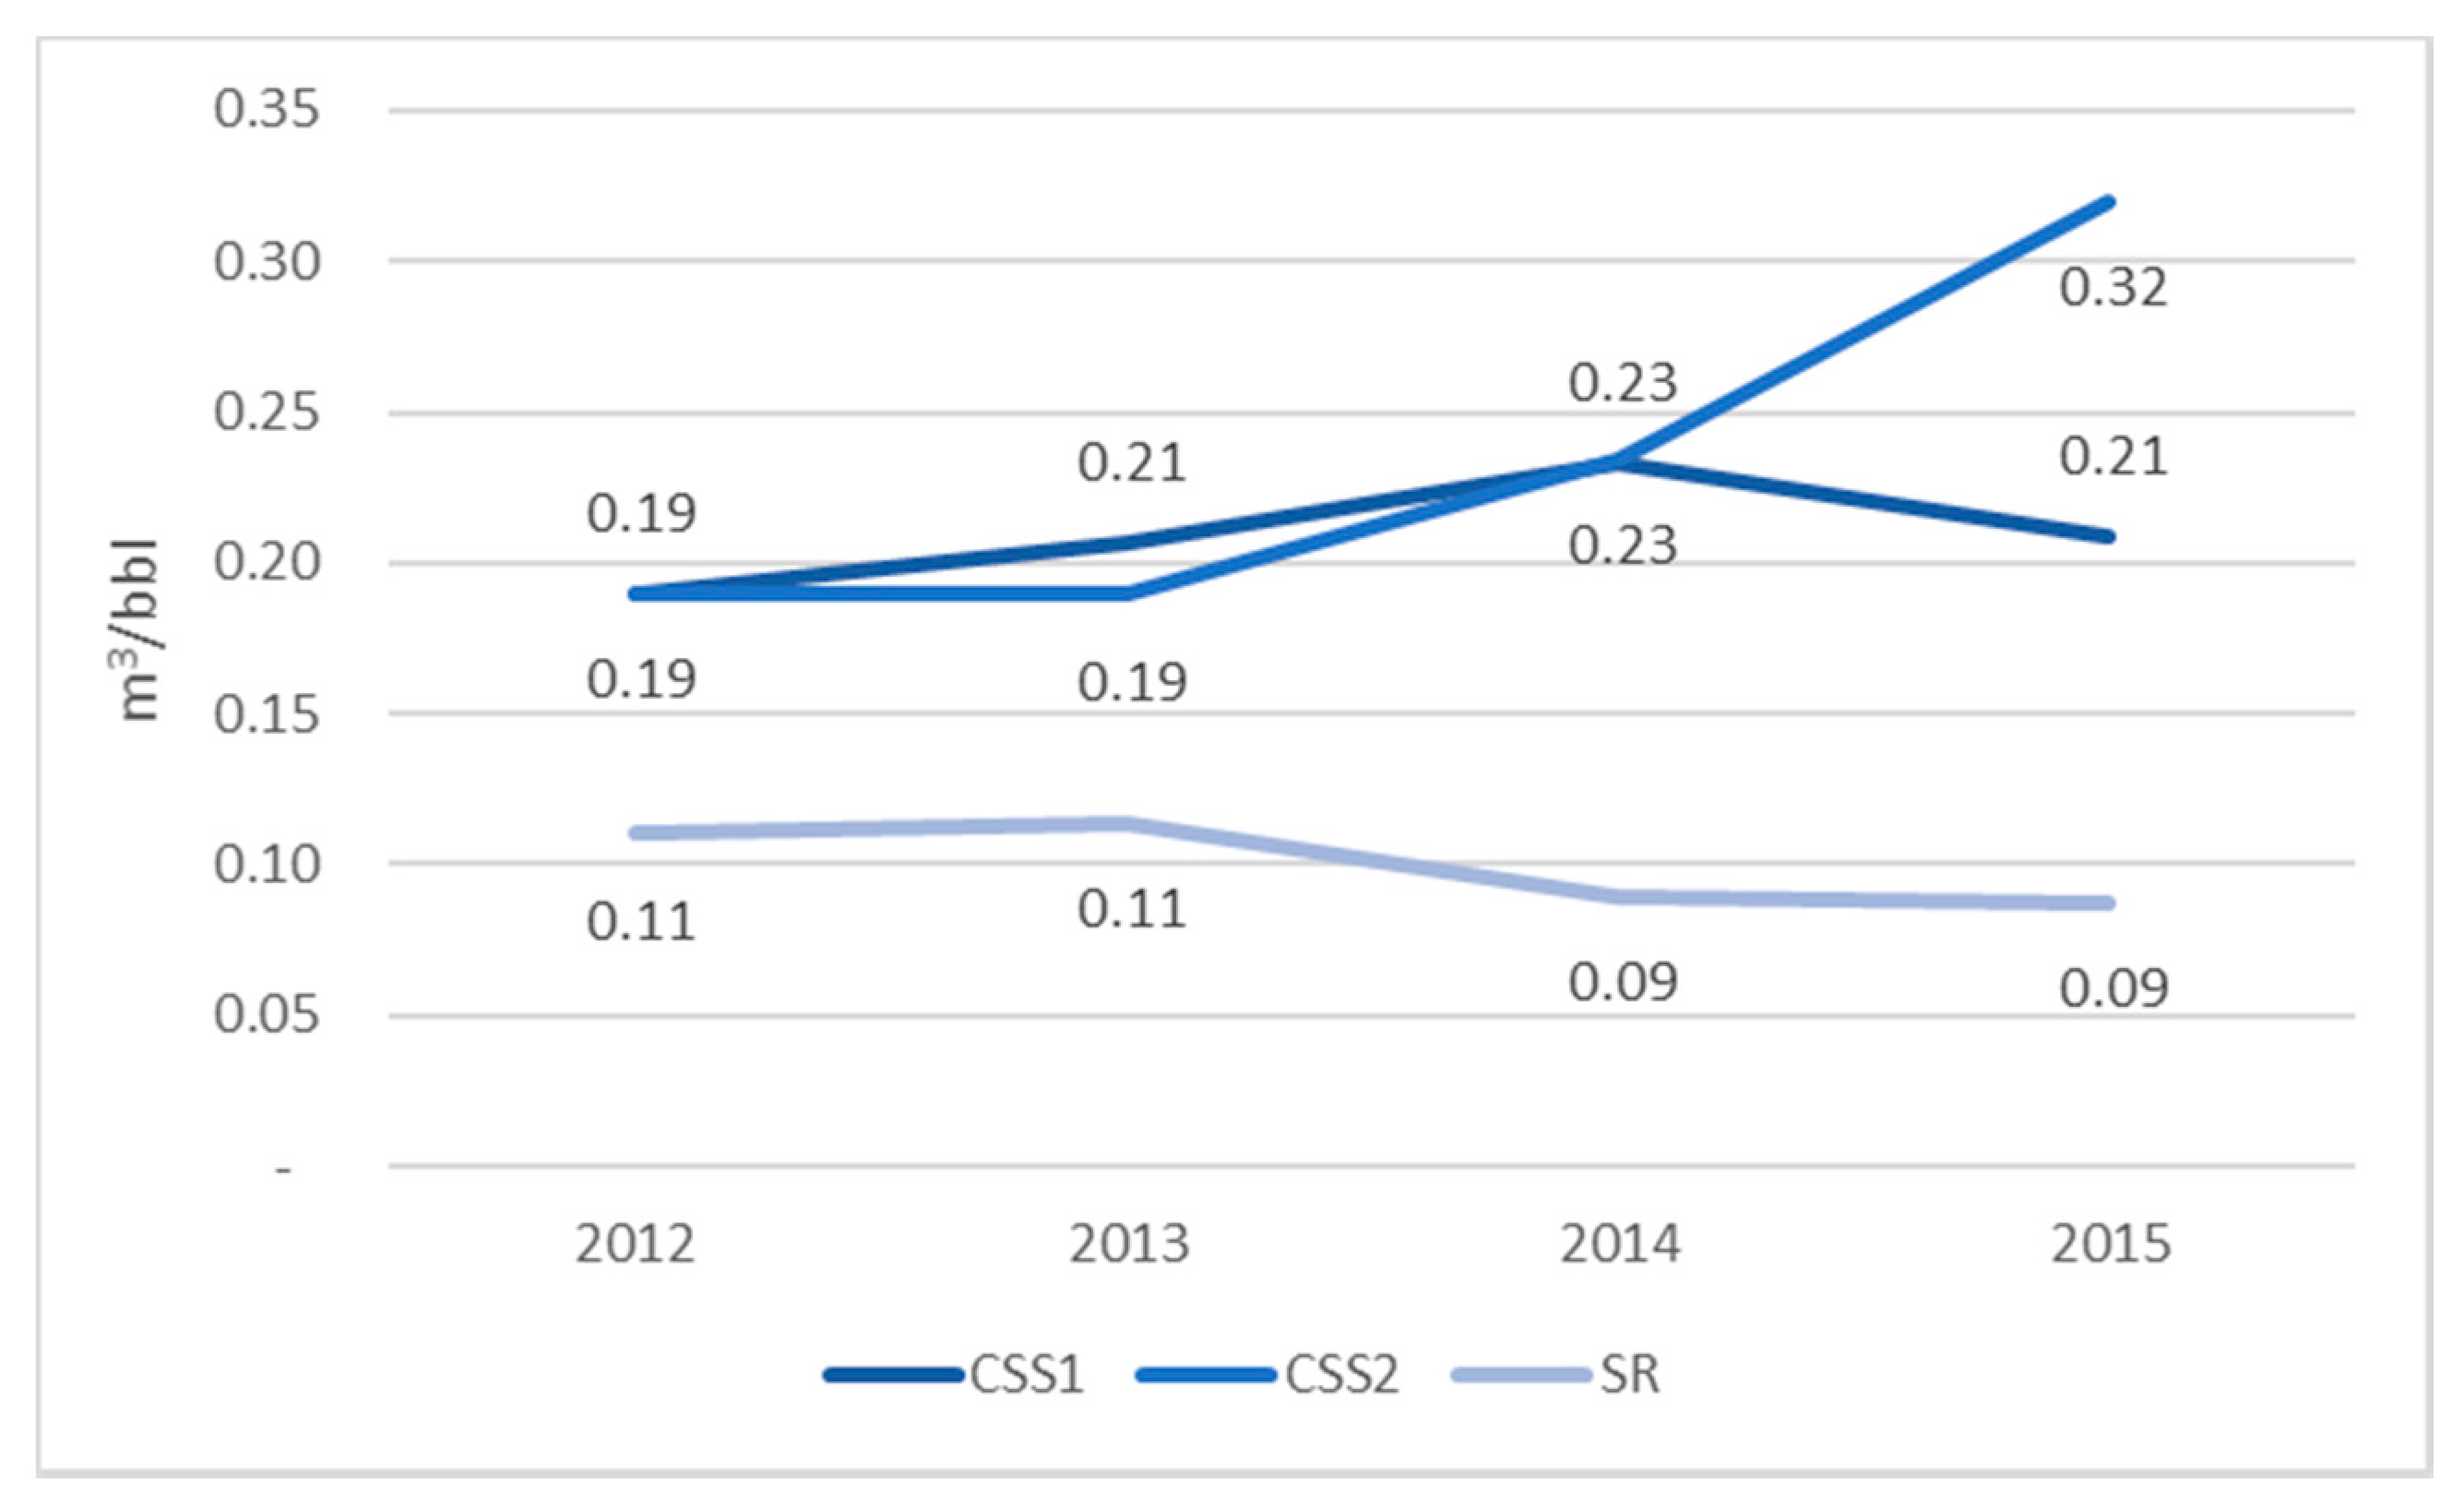
With the goal of evaluating the potential uncertainty/variability of the results obtained for this case study, we compare the 2012 blue water footprint with that for the years 2012, 2014 and 2015 (Figure 5). The grey and green water footprints were not measured in subsequent years and so cannot be compared. The principal reason for changes in field CSS 1 relates to the increase in production wells in operation, which went from 382 to 607 over the last four years, in line with business development plans. For CSS 2, the 41 percent increase in blue water footprint is derived from the undertaking of tests aimed at increasing well productivity. One test, for example, has seen the company assess whether it is worth incrementing the CSS from three to five steam cycles. This test has resulted from the reduction of internal pressures within the geological formation, something which inhibits oil flow to the production well. The drop in blue water footprint for the SR field is associated with the increased re-use of water injected into the field to support crude production.

Comparison of the Direct Footprint with Other Studies

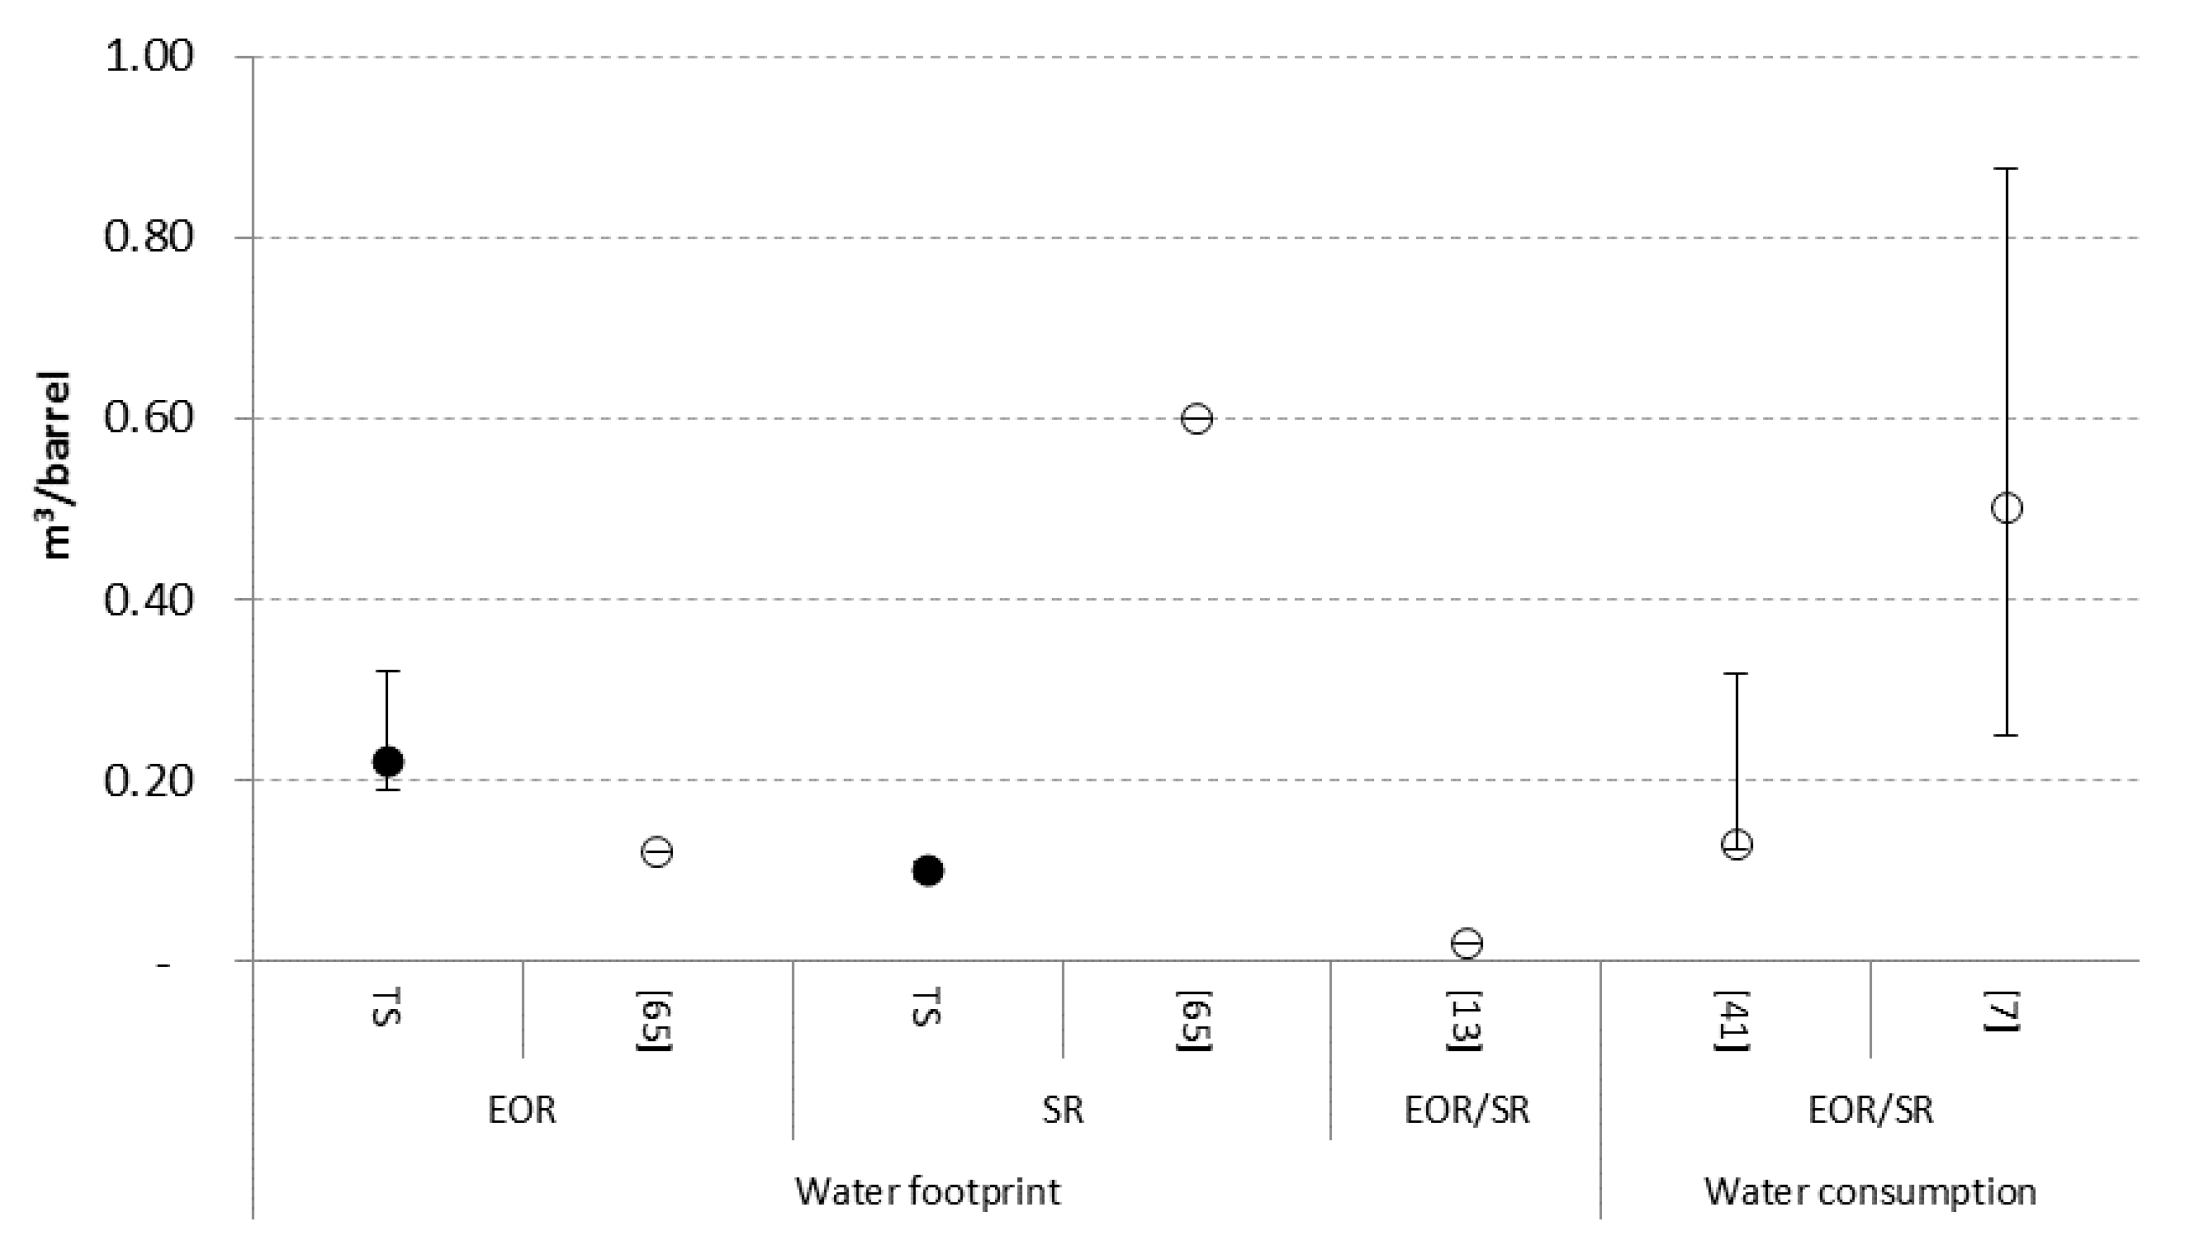
When the results from the case study are compared to the values presented by the NWS-2014 calculation of the Colombian Hydrocarbon Sector water footprint (Table 2) we can state that the total water footprint calculated for this case study is 10 times greater than the value published by IDEAM (2015). One may argue that this is because the average calculation will involve lighter/sweeter crudes, which by definition require less water (as they do not need enhanced recovery operations). This observation does not make sense though given the quantity of heavy oil operations in Colombia, which corresponds to 55 percent of the total production [11]. Also, and on close inspection of the study, it appears that the methodology applied is fundamentally flawed. Firstly, those undertaking the NWS-2014 calculations and analysis failed to account for the grey water footprint and applied incorrect methods to calculate the blue. This observation is supported by the results reported in other studies in Figure 6, given that our results are found within the range (in the middle in fact) and those calculated in the NWS-2014, seem unreasonably low.
To explain, the NWS-2014 method subtracts the wastewater from that consumed to measure blue water consumption, which is acceptable, if the water once consumed is returned to the watershed and the grey footprint is calculated. The grey water footprint is only zero if the wastewater level of contamination is equal or less than that of the water body, under normal conditions. This is one possible reason why the grey footprint does not appear in the NWS-2014, although it should have been stated as such. Furthermore, it is very naïve to believe that the hydrocarbon sector could send the water collected back in the exact same condition, without treatment. Upon treatment, it should be measured as part of the grey. Therefore, failing to account for the grey is erroneous and will naturally lead to a sub-estimation of water scarcity. Furthermore, the NWS-2014 fails to adhere to standardized practices in the way information is presented. For example, there is no specific destination as to where industrial and domestic wastewater is discharged (although this information is available for certain categories). In fact, it appears that the NWS-2014 is partaking in “double accounting” practices. This is seen in Table 2 and the fact that the wastewater effluent seems to be accounted for in more than two categories e.g., “industrial wastewater” and “watering roads for dust and suspended matter reduction”. As the NWS-2014 subtracts the wastewater to gain the blue, without calculating the grey, this kind of practice significantly diminishes the water footprint. Another issue we identified is the assumption that water re-injected for disposal back into the geological formation will return to the catchment. This is incorrect. The water does not return (apart from negligible leakages into the surrounding rock) and consequently should not be calculated as part of either the blue or grey water footprint. Lastly, we advise that the next NWS practitioners refer to the legal framework and that those conducting the study request water samples to compare the quality of the surrounding water bodies with that of the wastewater discharges from the hydrocarbon sector, following treatment.
Figure 6 presents the direct blue water footprint and water consumption comparisons among onshore conventional crude oil production [7,41,65]. Our result is at the same level of magnitude of the other studies, which provides further validation to the method followed in this paper. The graph clearly shows to what extent the methods employed in the national study sub-estimated the water footprint. The degree of sub-estimation varies between 5 and 32 times.

5.2. Calculation of Indirect Water Footprint

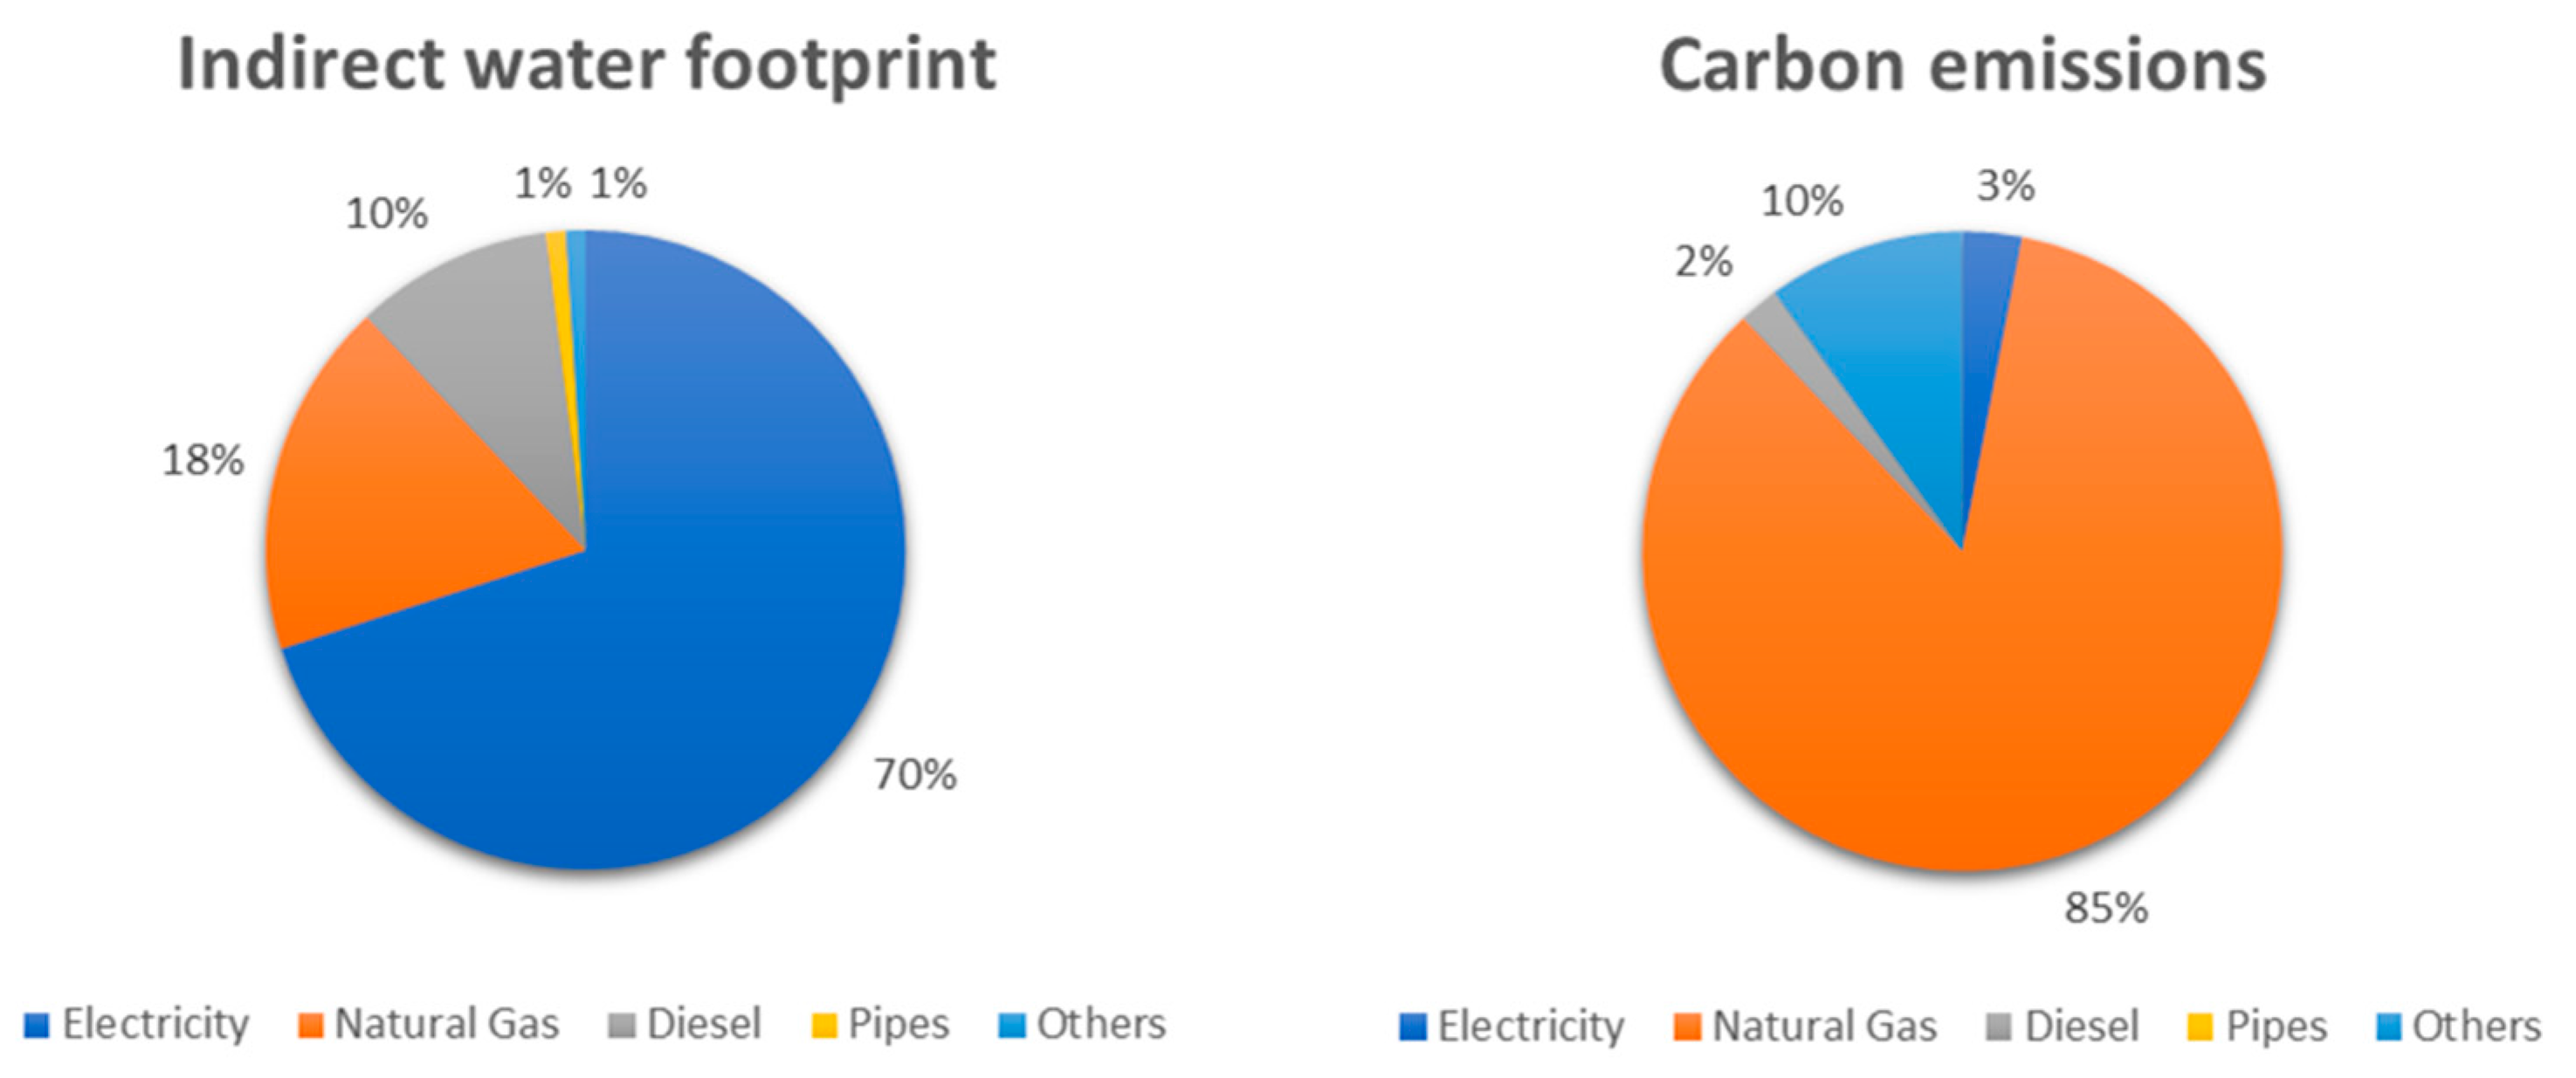
The indirect blue footprint is higher than the direct at 0.22 m3/barrel, as shown in Table 3 (this figure is predominantly composed of the average value for electricity produced in Colombia from hydroelectric plants). The main contributor to the indirect blue water footprint is electricity, at 70 percent, despite its limited use (for compressors, machinery, etc.) at 4 percent of the total energy consumed on site. This is because in Colombia, electricity generation relies heavily on hydroelectricity plants (75 percent of the total [63]). Most of the indirect water footprint is derived from the evaporation losses that occur at hydroelectricity stations. Natural gas, as the second contributor, is not used in the supplier’s electricity generation but is used for the steam generation on site. Diesel, as the third contributor, is mainly used in the transportation of employees on site and between the site and the surrounding villages. It is used in emergencies as fuel for back-up generators. In Colombia, it is worth noting that diesel is mixed with biodiesel (as stipulated by the Ministry of Mining and Energy in Decree 4892 of 2011 and Resolution 91664 of 2012), and that the mixed blend is 7 percent (B7), accounting for 90% of the indirect water footprint generated by diesel. This is why, despite the relatively limited use of diesel, compared to say gas at 93 percent, it constitutes 10 percent of the total indirect water footprint. The non-energy resources that were taken into consideration for the calculation include the steel used in pipes, the sands and cement, etc., used in construction materials, the materials used in machines and chemical substances (lubricants, demulsifiers, etc.). A complete breakdown is shown in Figure 7.

5.3. Sustainability Assessment and Response to the Water Footprint

Table 4 presents the sustainability assessment of the crudes produced in the three fields. Specifically, it highlights hotspots and non-sustainable elements identified in the calculation of the water footprint. Quantitatively, if one integrates the blue water footprint results of the three oil fields (based on the relative oil barrel production) with that of average of those produced within the same sub-hydrographic zone, as calculated by NWS-2014, then the product of this case study is responsible for 12 percent of the total. In terms of the average monthly water resource availability in the sub-hydrographic region, total oil production from the company’s three fields consumes around 0.2% of that present in an average dry year. As for the green water footprint, the consumption of the total available water is 0.01 percent. The grey footprint cannot be compared, as an average was not calculated by the NWS-2014, as explained above.
In our opinion, certain aspects of the water footprint can be reduced (either avoided or mitigated) for the CSS field operations. The biggest non-sustainable use of water is that which was used in the vapor injection process. It returns through the production well, with the crude, as a mixture of processed water and pre-existing water contained within the formation. Currently, this water is treated but is simply sent back into the formation because even though its treatment is complex, the final quality is not sufficient to be re-used for any purpose, as can be seen by Table 1. This practice has a huge impact on the blue water footprint. If the company invested in more advanced water treatment then it is possible to re-divert the water back into the vapor production processes or use it for the watering of non-food crops, such as palm oil destined for biodiesel. Using the product’s wastewater for the latter would alleviate water stress in the hydrographic sub-zone by reducing both the green and blue water footprints.
There have been successful tests elsewhere on the complex treatment of production water. One example, which met the re-use requirements of an oil company operating in California, was via an electrolysis system for initial oil and solids removal followed by an ultrafiltration membrane system for further polishing [66]. A different method using falling film, vertical tube and vapor compression evaporation has been successfully implemented in Alberta, Canada, to recover up to 98 percent of the production water [67]. A more detailed cost-benefit analysis would need to be undertaken to see if similar schemes could be tested and implemented on site in Colombia. One of the ways in which this technological instalment could be ensured is if it were stipulated by Ecopetrol in the license renewal conditions.
Another technology which has the potential to increase oil production rates, whilst also reducing water and energy demands and carbon emissions within the CSS cycles is a method known as a hybrid steam-solvent process. As the name suggests, it combines thermal enhanced recovery with chemical options, whereby a small quantity of solvents enhance the effectiveness of the vapor injections. It has however not been fully tested beyond the lab and in models. Early pilot studies have heralded mixed results in terms of the method’s ability to enhance oil recovery and improve environmental performance [68].
Cheaper and less innovative measures could also be taken. The company could, for instance, look into better management programs and control systems to prevent leaks. The water in the boiler tanks could be reduced if there were a water return mechanism, which would lead to reduced gas consumption when it comes to heating water—consequently improving overall process efficiency.
The product’s green water footprint cannot be reduced, as reforestation represents a legal requirement and the way in which the company must compensate the environment for its crude production activities. The grey water footprint can be reduced with good water treatment and could, in practice, reach zero. This would require a degree of technological renovation and more rigorous maintenance routines.
In terms of the indirect water footprint, the relationship between energy and water holds important policy implications and comes down to corporate preference. In Figure 7, there is a clear inverse relationship between the carbon and indirect water footprint. The use of electricity in the CSS 1 field, given that it is derived from hydroelectric sources, contributes only 0.3 percent overall. It does however weigh heavily in the water footprint. The result would be substantially different if natural gas was used to generate electricity. Gas has a high carbon footprint but a negligible water one. The company would need to decide how best to improve sustainable performance. This would depend on the criticality of resources and the relationship it has with its various stakeholders. It would also depend on the environmental performance indicators it wanted to improve on. One way of reducing both the water and carbon footprint would be to install solar panels instead of relying on an electricity supplier. The company does have some solar-based energy production but this is currently limited to lighting.

6. Conclusions

For this Colombian case study, the total direct water footprint (blue, green and grey) for the crude product is 0.225 m3/barrel for that extracted via CSS methods. For that obtained via waterflooding, the total footprint is 0.19 m3/barrel. The CSS method contributed significantly to the direct blue water footprint (97 percent of the total). This percentage could be reduced if the water coming out of the production well, following a steam cycle, was to be cleaned with highly advanced water treatment. The largest grey water footprint is that associated with waterflooding, at 0.06 m3/barrel. It may be reduced with convention wastewater treatment operations. The green water footprint is negligible and cannot be reduced for legal reasons.
This paper adapts the water footprint methodology to make it suitable for the sector and consequently calculates the water footprint associated with non-tar sands heavy oil operations. It thus provides a significant contribution to academic literature because it gives other researchers a baseline. It is also very important on a national level given that the Colombian National Water Study (2014) did not distinguish between the water demands of sweeter and heavier crudes even though, given the popularity of CSS enhanced recovery techniques, this would make sense. Furthermore, the NWS-2014 fails to calculate the grey water footprint and commits severe methodological flaws in calculating the direct blue water footprint, leading to a 5- to 32-fold sub-estimation. Our paper attempts to support government initiatives to hold the oil sector accountable for its water resource use and wastewater treatment. Finally, it gives a greater visibility as to the socio-environmental impact on natural resources and sustainable development.

Supplementary Materials

The following are available online at www.mdpi.com/2073-4441/9/5/340/s1.

Acknowledgments

We acknowledge the support of Fundação para a Ciência e a Tecnologia (FCT) through the grants PD/BP/113742/2015 and PD/BD/128038/2016; and the support of UCLM in making this research possible.

Author Contributions

Kai Whiting and Luis Gabriel Carmona conceived this study, led the narrative framing for the paper and coordinated its writing. Luis Gabriel Carmona, Kai Whiting and Angeles Carrasco provided substantial inputs to writing and significant feedback on numerous drafts.

Conflicts of Interest

The authors declare no conflict of interest.

References

  1. Mancosu, N.; Snyder, R.L.; Kyriakakis, G.; Spano, D. Water scarcity and future challenges for food production. Water 2015, 7, 975–992. [Google Scholar] [CrossRef]
  2. Sohns, A.A.; Rodriguez, D.J.; Delgado, A. Thirsty Energy (ii): The Importance of Water for Oil and Gas Extraction, 2016. World Bank Group. Available online: https://openknowledge.worldbank.org/bitstream/handle/10986/23635/Thirsty0energy0l0and0gas0extraction.pdf?sequence=1 (accessed on 15 April 2017).
  3. Reig, P.; Luo, T.; Proctor, J.N. Global Shale Gas Development: Water Availability and Business Risks, 2014. World Resources Institute. Available online: http://www.wri.org/publication/global-shale-gas-development-water-availability-business-risks (accessed on 15 April 2017).
  4. CDP. Thirsty Business: Why Water is Vital to Climate Action. 2016 Annual Report of Corporate Water Disclosure. Available online: https://b8f65cb373b1b7b15feb-c70d8ead6ced550b4d987d7c03fcdd1d.ssl.cf3.rackcdn.com/cms/reports/documents/000/001/306/original/CDP-Global-Water-Report-2016.pdf?1479747926 (accessed on 15 April 2017).
  5. Rosa, L.; Davis, K.F.; Rulli, M.C.; D’Odorico, P. Environmental consequences of oil production from oil sands. Earth’s Future 2017, 5, 158–170. [Google Scholar] [CrossRef]
  6. Kondash, A.; Vengosh, A. Water footprint of hydraulic fracturing. Environ. Sci. Technol. Lett. 2015, 2, 276–280. [Google Scholar] [CrossRef]
  7. Spang, E.S.; Moomaw, W.R.; Gallagher, K.S.; Kirshen, P.H.; Marks, D.H. The water consumption of energy production: An international comparison. Environ. Res. Lett. 2014, 9, 105002. [Google Scholar] [CrossRef]
  8. Carmona, L.G. Water Footprint for Heavy Oil Extraction in Colombia: Relationship between Oil and Water. In Proceedings of the SPE E&P Health, Safety, Security and Environmental Conference-Americas, Denver, CO, USA, 16–18 March 2015; Society of Petroleum Engineers: Richardson, TX, USA, 2015. [Google Scholar]
  9. Dusseault, M.B. Comparing Venezuelan and Canadian heavy oil and tar sands. In Proceedings of the Canadian International Petroleum Conference, Calgary, AB, Canada, 12–14 June 2001; Petroleum Society of Canada: Calgary, AB, Canada, 2001. [Google Scholar]
  10. CERI–Canadian Energy Research Institute. Canadian Oil Sands Supply Costs and Development Projects (2011–2045); Study No. 128; CERI: Calgary AB, Canada, 2012. [Google Scholar]
  11. Campetrol. El 55% del Petróleo que se Produce en Colombia es Crudo Pesado. 2015. Available online: http://campetrol.org/el-55-del-petroleo-que-se-produce-en-colombia-es-crudo-pesado/ (accessed on 15 April 2017).
  12. Hoekstra, A.; Chapagain, A.; Aldaya, M.; Mekonnen, M. The Water Footprint Assessment Manual. Setting the Global Standard; Earthscan: London, UK; Washington, DC, USA, 2011. [Google Scholar]
  13. IDEAM. Estudio Nacional del Agua 2014; Instituto de Hidrología, Meteorología y Estudios Ambientales—IDEAM: Bogotá, DC, Colombia, 2015.
  14. Hoekstra, A.Y. The global dimension of water governance: Why the river basin approach is no longer sufficient and why cooperative action at global level is needed. Water 2010, 3, 21–46. [Google Scholar] [CrossRef]
  15. Watkins, K. Human Development Report 2006-Beyond Scarcity: Power, Poverty and the Global Water Crisis; United Nations Development Programme: New York, NY, USA, 2006. [Google Scholar]
  16. United Nations. Water Scarcity Factsheet. 2013. Available online: http://www.un.org/waterforlifedecade/scarcity.shtml (accessed on 15 April 2017).
  17. FAO and WWC. Towards a Water and Food Secure Future: Critical Perspectives for Policy-Makers. Natural Resources and Environment Department, 2015. Available online: http://www.fao.org/3/a-i4560e.pdf (accessed on 15 April 2017).
  18. Water Foorpritn Network 2017. Available online: http://waterfootprint.org/en/water-footprint/frequently-asked-questions/ (accessed on 22 March 2017).
  19. Hoekstra, A.Y.; Mekonnen, M.M. The water footprint of humanity. Proc. Natl. Acad. Sci. USA 2012, 109, 3232–3237. [Google Scholar] [CrossRef] [PubMed]
  20. Hoekstra, A.Y.; Chapagain, A.K. Water footprints of nations: Water use by people as a function of their consumption pattern. Water Resour. Manag. 2007, 21, 35–48. [Google Scholar] [CrossRef]
  21. Hoekstra, A.Y. Human appropriation of natural capital: A comparison of ecological footprint and water footprint analysis. Ecol. Econ. 2009, 68, 1963–1974. [Google Scholar] [CrossRef]
  22. Čuček, L.; Klemeš, J.J.; Kravanja, Z. A review of footprint analysis tools for monitoring impacts on sustainability. J. Clean. Prod. 2012, 34, 9–20. [Google Scholar] [CrossRef]
  23. Fang, K.; Heijungs, R.; de Snoo, G.R. Theoretical exploration for the combination of the ecological, energy, carbon, and water footprints: Overview of a footprint family. Ecol. Indic. 2014, 36, 508–518. [Google Scholar] [CrossRef]
  24. Galli, A.; Wiedmann, T.; Ercin, E.; Knoblauch, D.; Ewing, B.; Giljum, S. Integrating ecological, carbon and water footprint into a “footprint family” of indicators: definition and role in tracking human pressure on the planet. Ecol. Indic. 2012, 16, 100–112. [Google Scholar] [CrossRef]
  25. Galli, A.; Weinzettel, J.; Cranston, G.; Ercin, E. A footprint family extended MRIO model to support Europe’s transition to a one planet economy. Sci. Total Environ. 2013, 461, 813–818. [Google Scholar] [CrossRef] [PubMed]
  26. Hoekstra, A.Y.; Chapagain, A.K.; Aldaya, M.M.; Mekonnen, M.M. Water Footprint Manual: State of the Art 2009; Water Footprint Network: Enschede, The Netherlands, 2009. [Google Scholar]
  27. Allan, J.A. Virtual water: A strategic resource. Ground Water 1998, 36, 545–547. [Google Scholar] [CrossRef]
  28. Hoekstra, A.Y.; Hung, P.Q. Virtual Water Trade. A Quantification of Virtual Water Flows between Nations in Relation to International Crop Trade; Value of Water Research Report Series, 11; UNESCO–IHE: Delft, The Netherlands, 2002. [Google Scholar]
  29. Hoekstra, A. Virtual Water Trade: Proceedings of the International Expert Meeting on Virtual Water Trade; Value of Water Research Report Series, 12; UNESCO–IHE: Delft, The Netherlands, 2002. [Google Scholar]
  30. Vanham, D.; Bidoglio, G. A review on the indicator water footprint for the EU28. Ecol. Indic. 2013, 26, 61–75. [Google Scholar] [CrossRef]
  31. CTA; GSI-LAC; COSUDE; IDEAM. Evaluación Multisectorial de la Huella Hídrica en Colombia. Resultados por Subzonas Hidrográficas en el Marco del Estudio Nacional del Agua 2014. Medellín, Colombia. 2015. Available online: http://documentacion.ideam.gov.co/openbiblio/bvirtual/023272/HH_ENA2014.pdf (accessed on 15 April 2017).
  32. Centro de Ciencia y Tecnología de Antioquia. Evaluación de la Huella Hídrica en la Cuenca del Río Porce. Resumen de Resultados. 2013. Available online: http://www.goodstuffinternational.com/images/PDF/LibroHuellahidrica.pdf (accessed on 15 April 2017).
  33. Arévalo, D.; Lozano, J.; Sabogal, J. Estudio nacional de huella hídrica Colombia sector agrícola. Revista Internacional de Sostenibilidad Tecnología y Humanismo 2011, 6, 101–126. [Google Scholar]
  34. Pérez, M.A.; Peña, M.R.; Álvarez, P. Agro-industria cañera y uso del agua: análisis crítico en el contexto de la política de agrocombustibles en Colombia. Ambiente Soc. 2011, 14, 153–178. [Google Scholar] [CrossRef]
  35. Swiss Agency for Development and Cooperation (SDC) in Colombia. Water Footprint Assessment Results for SuizAgua Colombia, Pilot Project Phase I and II; Swiss Agency for Development and Cooperation (SDC): Bogotá, Colombia, 2012. [Google Scholar]
  36. WWF. Huella hídrica en Bavaria: Identificando Riesgos para una Cadena de Custodia del Agua. 2014. Available online: http://d2ouvy59p0dg6k.cloudfront.net/downloads/huella_hidrica_bavaria_1.pdf (accessed on 15 April 2017).
  37. Vanegas, Y.; Ramírez, L. Evaluación de la Huella Hídrica para la Producción de Flores Lirio Japonés (Hemerocallis) en la Vereda Ricaurte del Municipio de Rondón–Boyacá. Bachelor’s Thesis, Trabajo de grado Ingeniera Ambiental y Sanitaria, Universidad de La Salle, Bogotá, Colombia, 2015. [Google Scholar]
  38. Rost, S.; Gerten, D.; Bondeau, A.; Lucht, W.; Rohwer, J.; Schaphoff, S. Agricultural green and blue water consumption and its influence on the global water system. Water Resour. Res. 2008, 44. [Google Scholar] [CrossRef]
  39. Calzadilla, A.; Rehdanz, K.; Tol, R.S. The economic impact of more sustainable water use in agriculture: A computable general equilibrium analysis. J. Hydrol. 2010, 384, 292–305. [Google Scholar] [CrossRef]
  40. Liu, J.; Yang, H. Spatially explicit assessment of global consumptive water uses in cropland: Green and blue water. J. Hydrol. 2010, 384, 187–197. [Google Scholar] [CrossRef]
  41. Williams, E.; Simmons, J.E. Water in the Energy Industry: An Introduction; BP Global: London, UK, 2013; Available online: http://www.bp.com/content/dam/bp/pdf/sustainability/group-reports/BP-ESC-water-handbook.pdf (accessed on 15 April 2017).
  42. World Bank. Will Water Constrain Our Energy Future? 2014. Available online: http://pubdocs.worldbank.org/en/905381435867523914/Thirsty-ENERGY-general-english.pdf (accessed on 15 April 2017).
  43. Gleick, P.H. Water and energy. Annu. Rev. Energy Environ. 1994, 19, 267–299. [Google Scholar] [CrossRef]
  44. Blok, K. Introduction to Energy Analysis; Techne Press: Amsterdam, The Netherlands, 2006. [Google Scholar]
  45. Domínguez, E.; Moreno, J.; Ivanova, Y. Water scarcity in a tropical country? Revisiting the Colombian water resources. Int. Assoc. Hydrol. Sci. 2010, 340, 335–342. [Google Scholar]
  46. Bolivar Lobato, M.I.; Schneider, U.A. Managing water scarcity in the Magdalena river basin in Colombia. An economic assessment. In Proceedings of the European Geosciences Union General Assembly, Vienna, Austria, 27 April–2 May 2014; Volume 16, p. 2683. [Google Scholar]
  47. Calle, E.D.; Rivera, H.G.; Sarmiento, R.V.; Moreno, P. Relaciones demanda-oferta de agua y el índice de escasez de agua como herramientas de evaluación del recurso hídrico colombiano. Rev. Acad. Colomb. Cienc. 2008, 32, 195–212. [Google Scholar]
  48. Ministerio de Ambiente, Vivienda y Desarrollo Territorial. Política Nacional para la Gestión Integral del Recurso Hídrico; Ministerio de Ambiente, Vivienda y Desarrollo Territorial: Bogotá, DC, Colombia, 2010. [Google Scholar]
  49. Semana. ¿Qué tan Responsables son las Petroleras de la Tragedia Ambiental? 2014. Available online: http://www.semana.com/nacion/articulo/sequia-en-casanare-el-papel-de-las-petroleras/381584-3 (accessed on 15 April 2017).
  50. CGN. Informe de Actuación Especial de Fiscalización: Problemática Ambiental Presentada en el Municipio de paz de Ariporo, Departamento del Casanare—2014. CGR-CDMA No. 029. Contraloría General de la República; 2012. Available online: http://www.anh.gov.co/la-anh/Control-y-Rendicion/Informes%20de%20Auditora%20de%20Gestin/Informe%20Actuación%20Especial%20Problemática%20Ambiental%20Municipio%20de%20Paz%20de%20Ariporo%20(agosto%202014).pdf (accessed on 15 April 2017).
  51. IDEAM. Estudio Nacional del Agua 2010; Instituto de Hidrología, Meteorología y Estudios Ambientales: Bogotá, DC, Colombia, 2010.
  52. Dyoulgerov, M.; Bucher, A.; Zermoglio, F. Climate Risk and Adaptation Country Profile. Colombia; World Bank: Washington, DC, USA, 2011; Available online: http://sdwebx.worldbank.org/climateportalb/doc/GFDRRCountryProfiles/wb_gfdrr_climate_change_country_profile_for_COL.pdf (accessed on 15 April 2017).
  53. Restrepo, J.D. Los Sedimentos del Río Magdalena: Reflejo de la Crisis Ambiental; Fondo editorial Universidad de EAFIT: Medellín, Colombia, 2005. [Google Scholar]
  54. UPME. Escenarios de Oferta y Demanda de Hidrocarburos en Colombia; Ministerio de Minas y Energía: Bogota, Colombia, 2012. Available online: http://www.upme.gov.co/docs/publicaciones/2012/escenarios_oferta_demanda_hidrocarburos.pdf (accessed on 15 April 2017).
  55. Ecopetrol. Reporte Integrado de Gestión sostenible 2016. 2017. Available online: http://www.ecopetrol.com.co/documentos/reporte-integrado-gestion-sostenible-2016.pdf (accessed on 15 April 2017).
  56. Pareja-Carmona, M.I.; Jiménez-Segura, L.F.; Ochoa-Orrego, L.E. Variación espacio-temporal de las larvas de tres especies de peces migratorios en el cauce del río Magdalena (Colombia), durante el ciclo hidrológico 2006–2007. Actualidades Biológicas 2014, 36, 33. [Google Scholar]
  57. Carmona, L.G.; Cardenas, J.; Navarreta, M.; Cardenas, L.; Montenegro, P. Monitoring ad conservation program for umbrella species: The northern screamer as a strategic element for floodplain biodiversity in the middle Magdalena region, Colombia. In Proceedings of the 2015 SPE E&P Health, Safety, Security and Environmental Conference-Americas, Denver, CO, USA, 16–18 March 2015. [Google Scholar]
  58. Carmona, L.G.; Correa, F.; Perdomo, K. A Joint Strategy between the Hydrocarbon Sector and Colombian Environmental Authorities for the Conservation of a Regional Natural Park. In Proceedings of the SPE International Conference and Exhibition on Health, Safety, Security, Environment, and Social Responsibility, Stavanger, Norway, 11–13 April 2016; Society of Petroleum Engineers: Richardson, TX, USA. [Google Scholar]
  59. Veil, J.; Quinn, J. Water Issues Associated with Heavy Oil Production; US Department of Energy, National Energy Technology Laboratory. Environmental Science Division, Argonne National Laboratory: Lemont, IL, USA, 2008. Available online: http://www.perf.org/images/Archive_HeavyOilReport.pdf (accessed on 15 April 2017).
  60. Speight, J.G. Natural bitumen (tar sands) and heavy oil. G. Jinsheng, Coal, Oil Shale, Natural Bitumen, Heavy Oil and Peat. In Encyclopedia of Life Support Systems (EOLSS); UNESCO, EOLSS: Oxford, UK, 2005. [Google Scholar]
  61. Alagorni, A.H.; Yaacob, Z.B.; Nour, A.H. An Overview of Oil Production Stages: Enhanced Oil Recovery Techniques and Nitrogen Injection. Int. J. Environ. Sci. Dev. 2015, 6, 693. [Google Scholar] [CrossRef]
  62. IEA. Resources to. Reserves. Oil, Gas and Coal Technologies for the Energy Markets of the Future; International Energy Agency: Paris, France, 2013; Available online: https://www.iea.org/publications/freepublications/publication/Resources2013.pdf (accessed on 15 April 2017).
  63. Arévalo, D. Huella Hídrica y Energía. Medellín. April 2014. Available online: http://cta.org.co/images/PDF/HH.pdf (accessed on 15 April 2017).
  64. Wilson, W.; Leipzig, T.; Griffiths-Sattenspiel, B. Burning Our Rivers: The Water Footprint of Electricity; River Network (Austin, TX: Comptroller of Public Accounts, Data Division Services) Publication, (96-1704); River Network: Portland, OR, USA, 2012; p. 62. [Google Scholar]
  65. Gerbens-Leenes, P.W.; Hoekstra, A.Y.; Meer, T.H. Water Footprint of Bio-Energy and Other Primary Energy Carriers; UNESCO–IHE: Delft, The Netherlands, 2008. [Google Scholar]
  66. Wiles, L.; Portillo, L.; Nichols, E. Produced Water Treatment for Reuse in Cyclic Steam Boilers and Crop Irrigation. In Proceedings of the 2015 International Water Conference, Orlando, FL, USA, 15–19 November 2015; IWC 15-29. Available online: http://www.originclear.com/wp-content/uploads/2016/03/iwc-15-29-final.pdf (accessed on 15 April 2017).
  67. Heins, W.; Peterson, D. Use of Evaporation for Heavy Oil Produced Water Treatment; GE Water & Process Technologies RCC: Washington, DC, USA, 2005; Available online: https://www.gewater.com/kcpguest/salesedge/documents/Technical%20Papers_Cust/Americas/English/TP1042EN.pdf (accessed on 15 April 2017).
  68. Law, D.H.-S. A New Heavy Oil Recovery Technology to Maximize Performance and Minimize Environmental Impact; SPE International, 2011. Available online: http://www.spe.org/dl/docs/2011/Law.pdf (accessed on 15 April 2017).
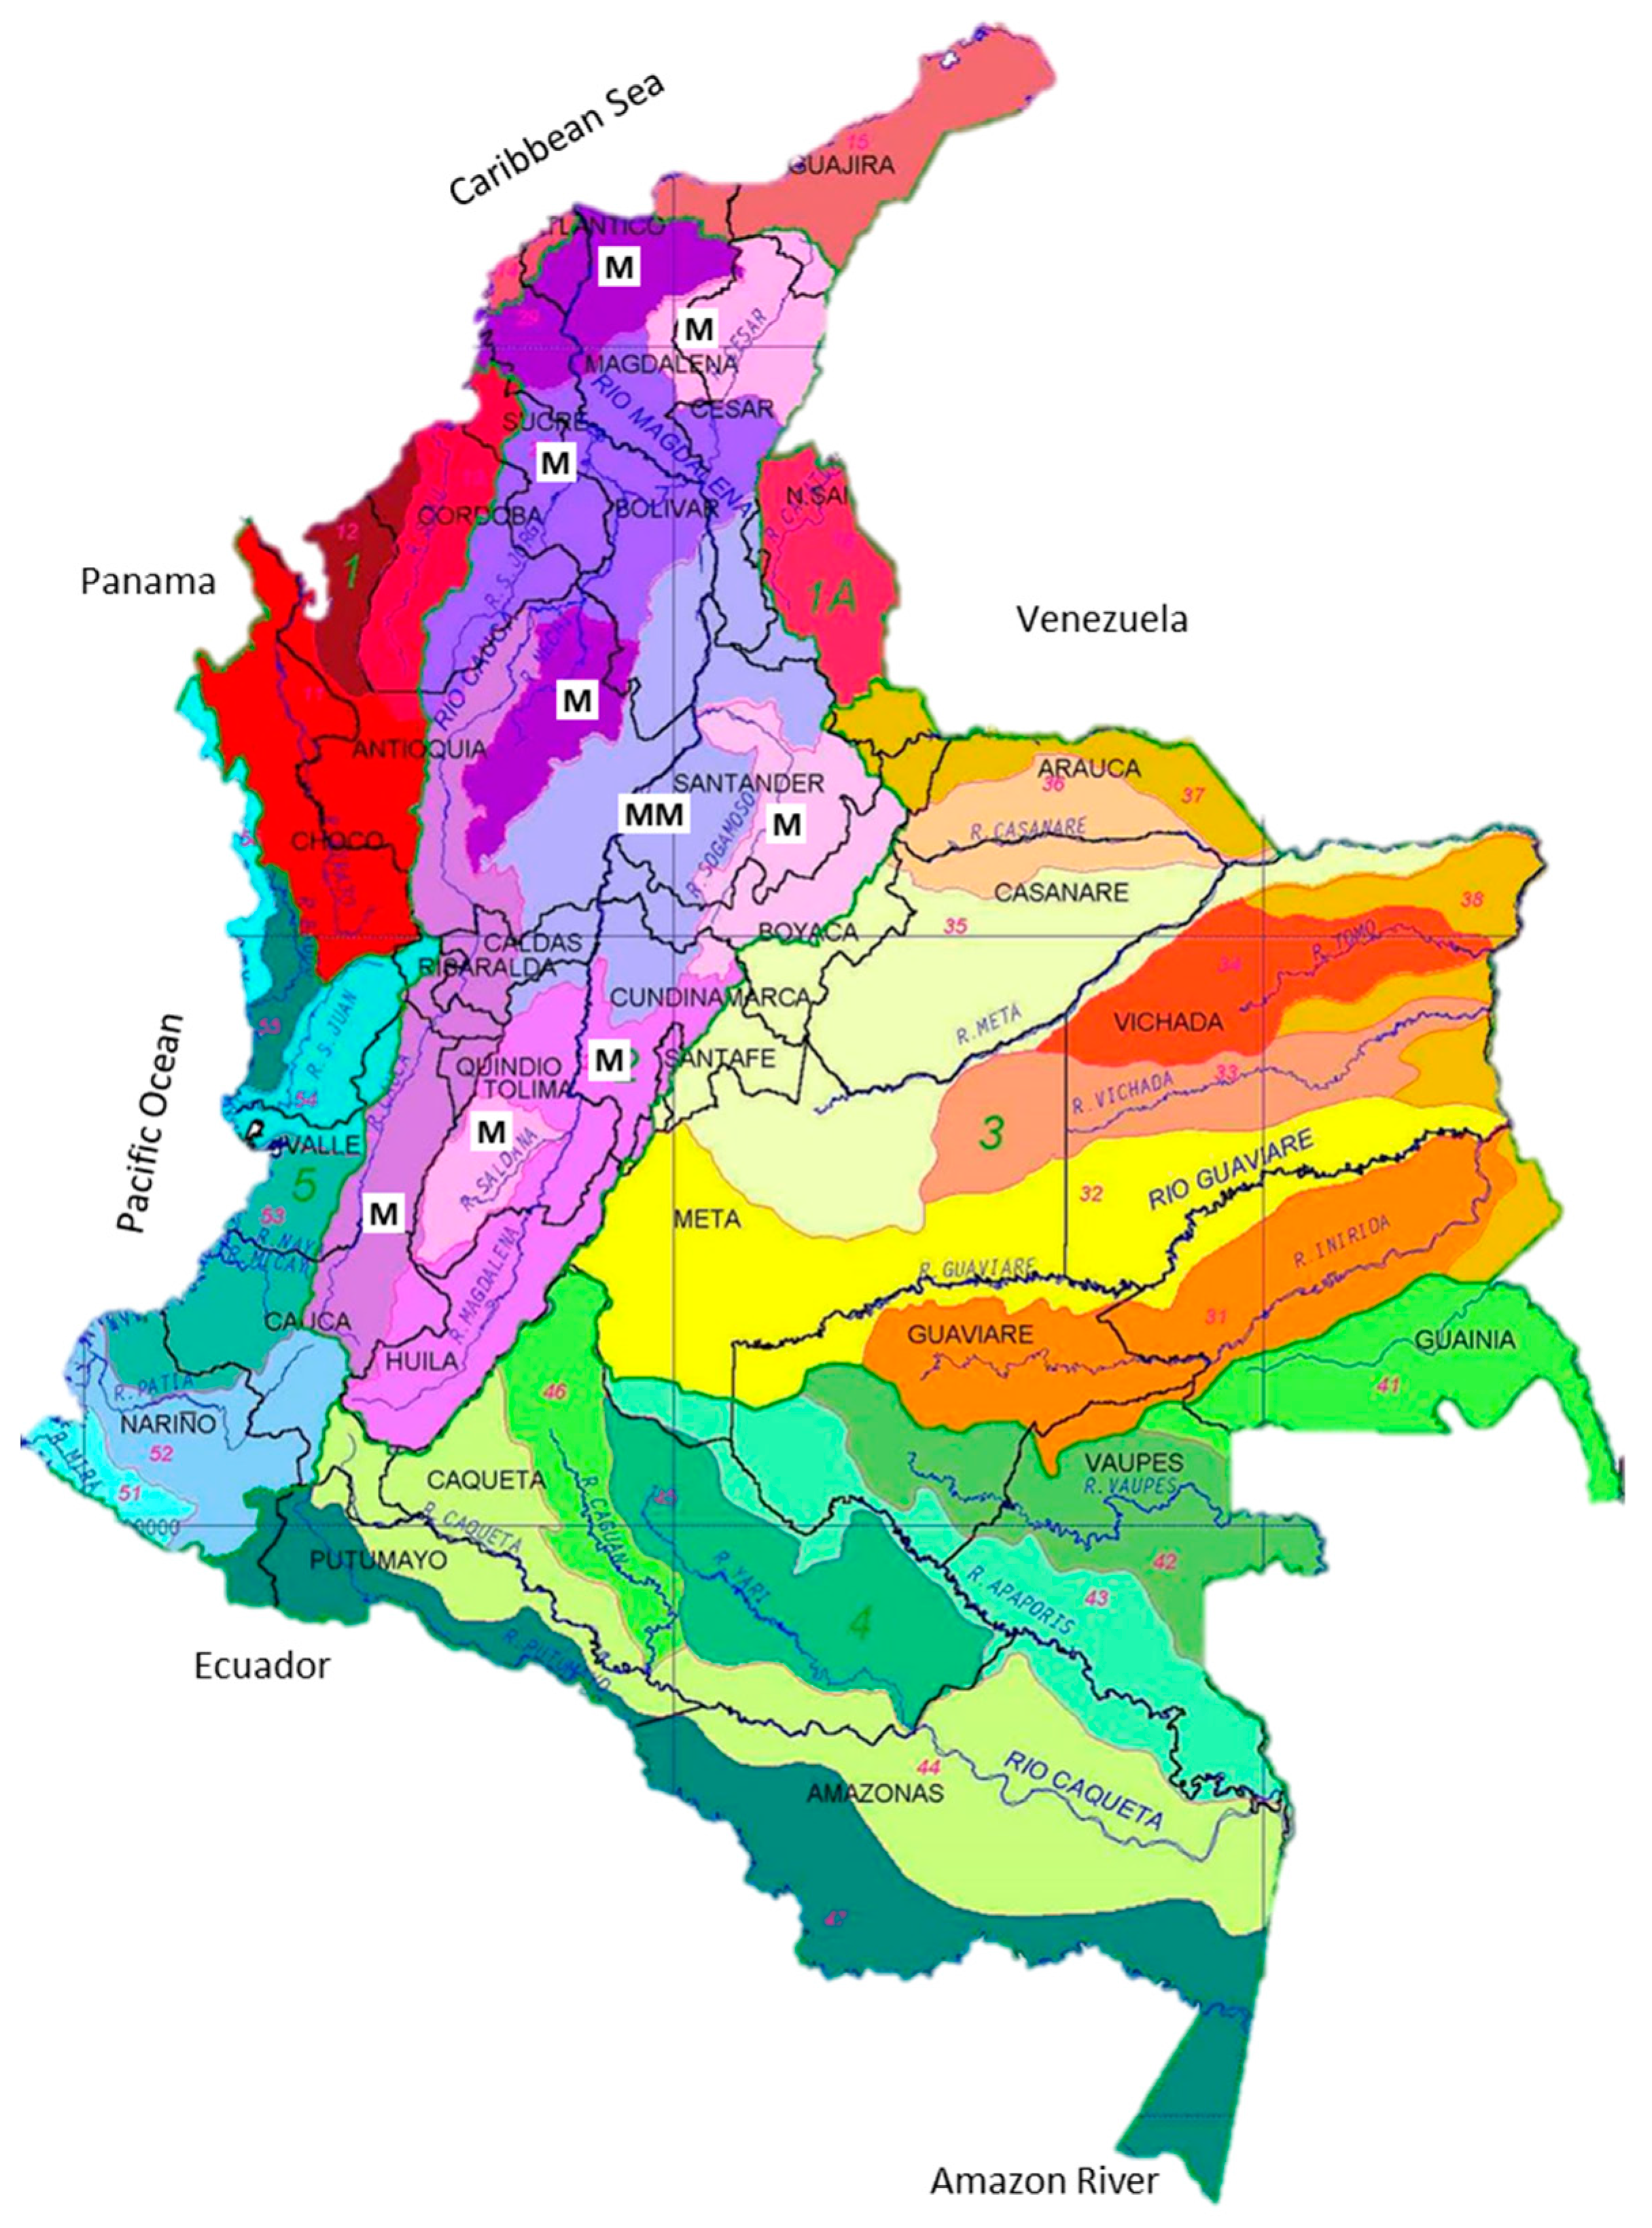
Figure 1. Watersheds distribution in Colombia. Note: Basins with the letter M belong to the Magdalena catchment. Basins with “MM” indicate that they come under the Middle Magdalena sub-area.
Water 09 00340 g001
Figure 2. Product water footprint assessment stages.
Water 09 00340 g002
Figure 3. System scope, core processes and direct water footprint flows. CSS: cyclic steam stimulation; SIAR: Produced wastewater treatment plant.
Water 09 00340 g003
Figure 4. Water footprint of a produced barrel in m3. SR: secondary recovery; CSS: cyclic steam simulation).
Water 09 00340 g004
Figure 5. Blue water footprint evolution 2012–2015.
Water 09 00340 g005
Figure 6. Water footprint and water consumption comparisons for onshore conventional crude oil production. Note: TS: this study. SR: secondary recovery. EOR: enhanced oil recovery.
Water 09 00340 g006
Figure 7. The contribution of energy and materials to the indirect blue water footprint in CSS 1 vs. the disaggregated carbon emissions of the same field.
Water 09 00340 g007
Table 1. Aquifer quality, wastewater parameters and the legal limits for CSS 2 oil field.
ParameterUnitNatural State of AquiferProduced Wastewater Treatment *Domestic Wastewater TreatmentIndustrial Wastewater TreatmentLegal Max 2015 **
Total aciditymg/L1NE37NE-
Total alkalinitymg/L190583412222-
Chlorine (Cl-)mg/L26.55827925881200
ConductivityuS/cm527280015292991-
BOD5mg/L153451935960
CODmg/L564524680180
Total hardnessmg/L2224955117-
Phenolsmg/L<0.0010.9<0.0010.20.2
Fats and oilsmg/L<0.5998105515
Total hydrocarbonsmg/L<0.5460.3224910
Total suspended solidsmg/L2575.314710450
Total solidsmg/L4972380NE2405-
Notes: All values are averages over a 12-month period (2012). * Destined for re-injection into the geological formation. ** Wastewater parameters to surface water bodies and the sewage system according to the Colombian legislation governing hydrocarbon production (Resolution 631/2015). NE: not evaluated.
Table 2. Comparison of case study results with those of the Colombian Hydrocarbon Sector water footprint, as reported by the 2014 Colombian National Water Study (NWS-2014).
NWS-2014 Flow Categories (m3/barrel)This StudyNWS-2014NWS-2014 Assumptions
CSS 1CSS 2SR
Industrial water consumption0.1940.1860.0750.106
Domestic water consumption0.0040.0040.0340.004
Industrial wastewater0.0030.0020.00050.095
Domestic wastewater0.0020.00090.0300.002
Partial indicator NWS-2014---0.013This is difference between water consumption and wastewater discharge.
Production water0.1480.2821.041.56
Re-injected water into the production well to enhance oil recovery0.0000.0000.1670.184Water returned to catchment area
Re-injected into geological formation for final disposal0.1440.2820.8680.719Water returned to catchment area
Wastewater discarded into natural water bodies0.00040.0000.0000.651Water returned to catchment area
Watering roads for dust and suspended matter reduction0.0050.00030.0000.003Evaporated
Sprinkling0.0010.0020.030.002Evaporated
Wastewater sent to third parties0.000030.0000.0000.001Water returned to catchment area
LossesNENENE0.0007Evaporated
Partial indicator of production waters (NWS-2014)---0.006The water footprint of NWA-2014 corresponds to the evaporated water in either sprinkling or road cleaning operations.
They calculate that this constitutes 0.34 percent of the water used in crude production.
Total crude production water footprint0.2300.2110.1900.019The water footprint of NWA-2014 corresponds to the sum of the two partial indicators
Note: NE: not evaluated.
Table 3. Comparison between the direct and indirect blue water footprint for a produced barrel in m3.
FieldDirect Blue Water FootprintIndirect Blue Water Footprint *
SR0.110.12
CSS Field 10.190.22
CSS Field 20.190.23
Note: * This figure can vary and is predominantly based on season and the location of the hydroelectric plant that provides the electricity. We took an average national value.
Table 4. Sustainability assessment summary of the crude product extracted in the three fields.
Sustainability of the WF in the Basin—Hotspots in CatchmentNon-Sustainable FractionPriority Response
IARC *IPHE **IACAL ***
Very LowVery HighLow
WFBlueGreenGrey
Product
SRNoYesNo37%Yes
CSS 1NoYesNo71%Yes
CSS 2NoYesNo68%Yes
Notes: * Catchment risk category for blue footprint. ** Catchment risk category for green footprint. *** Catchment risk category for grey footprint. IARC: non-returned water to the water basin index (índice de agua que no retorna a la cuenca); IPHE: ecosystem water stress (índice de presiones hídricas a los ecosistemas); IACAL: potential changes in water quality (índice de alteración potencial de la calidad del agua).