Multi-Level Contact Oxidation Process Performance When Treating Automobile Painting Wastewater: Pollutant Removal Efficiency and Microbial Community Structures

Abstract
:1. Introduction
2. Materials and Methods
2.1. Experimental Wastewater
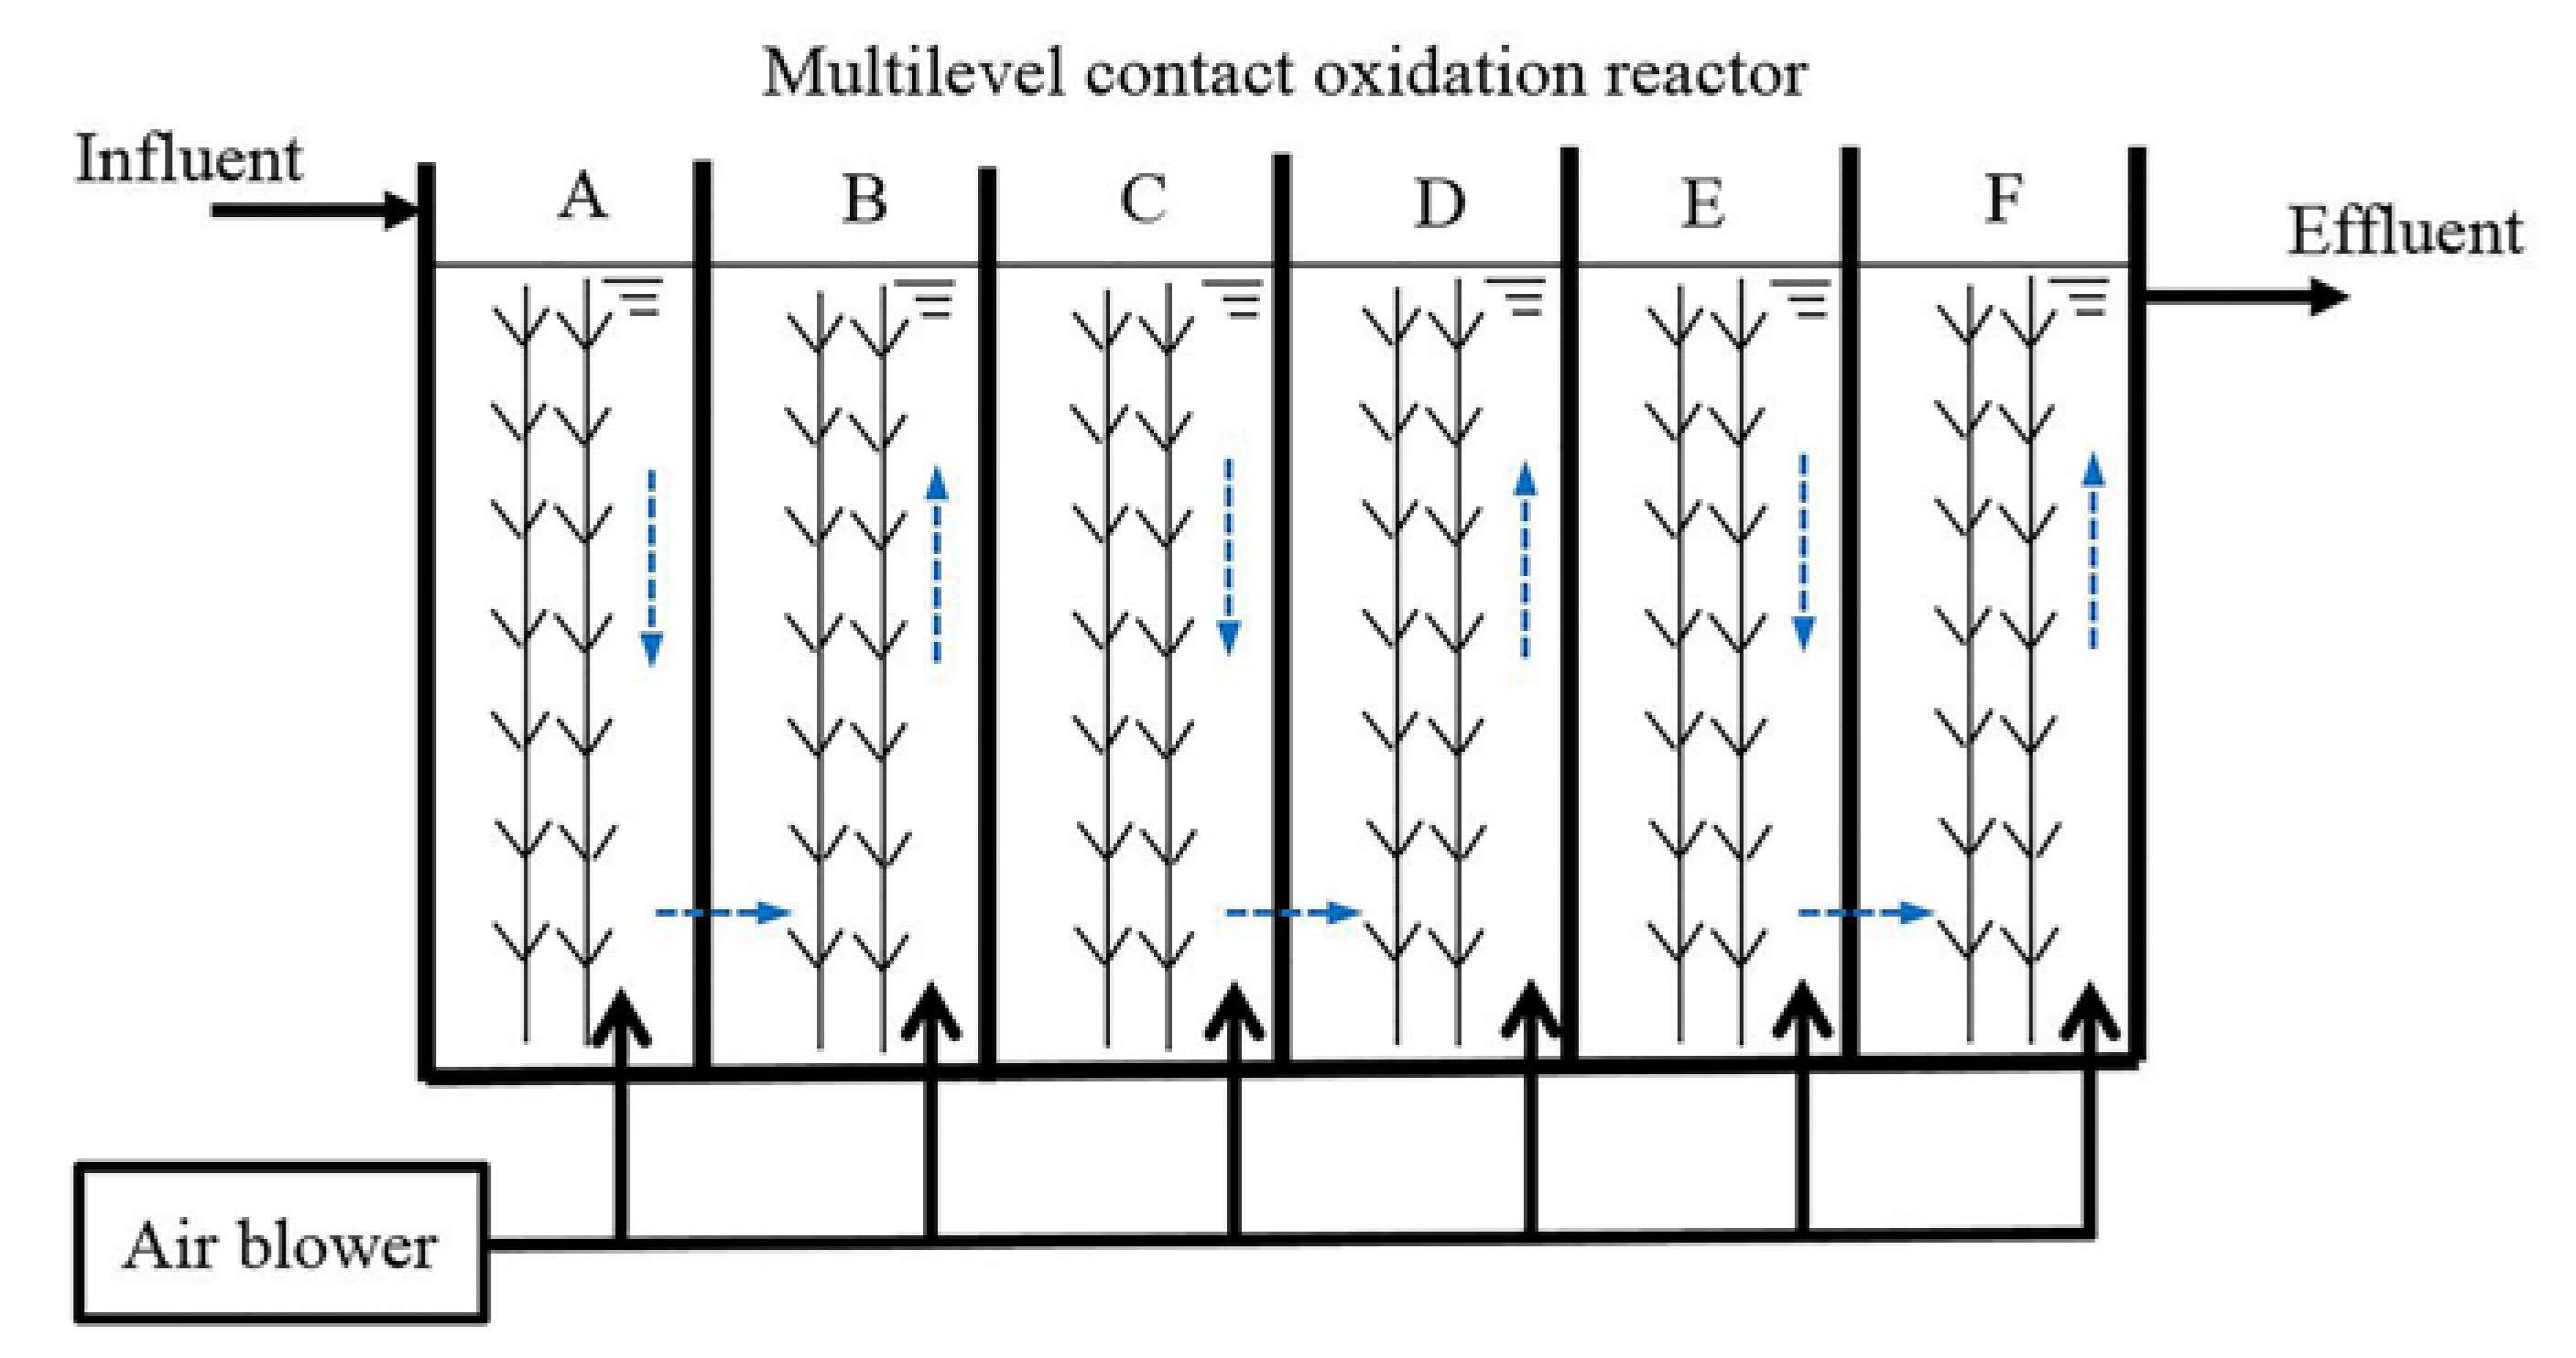
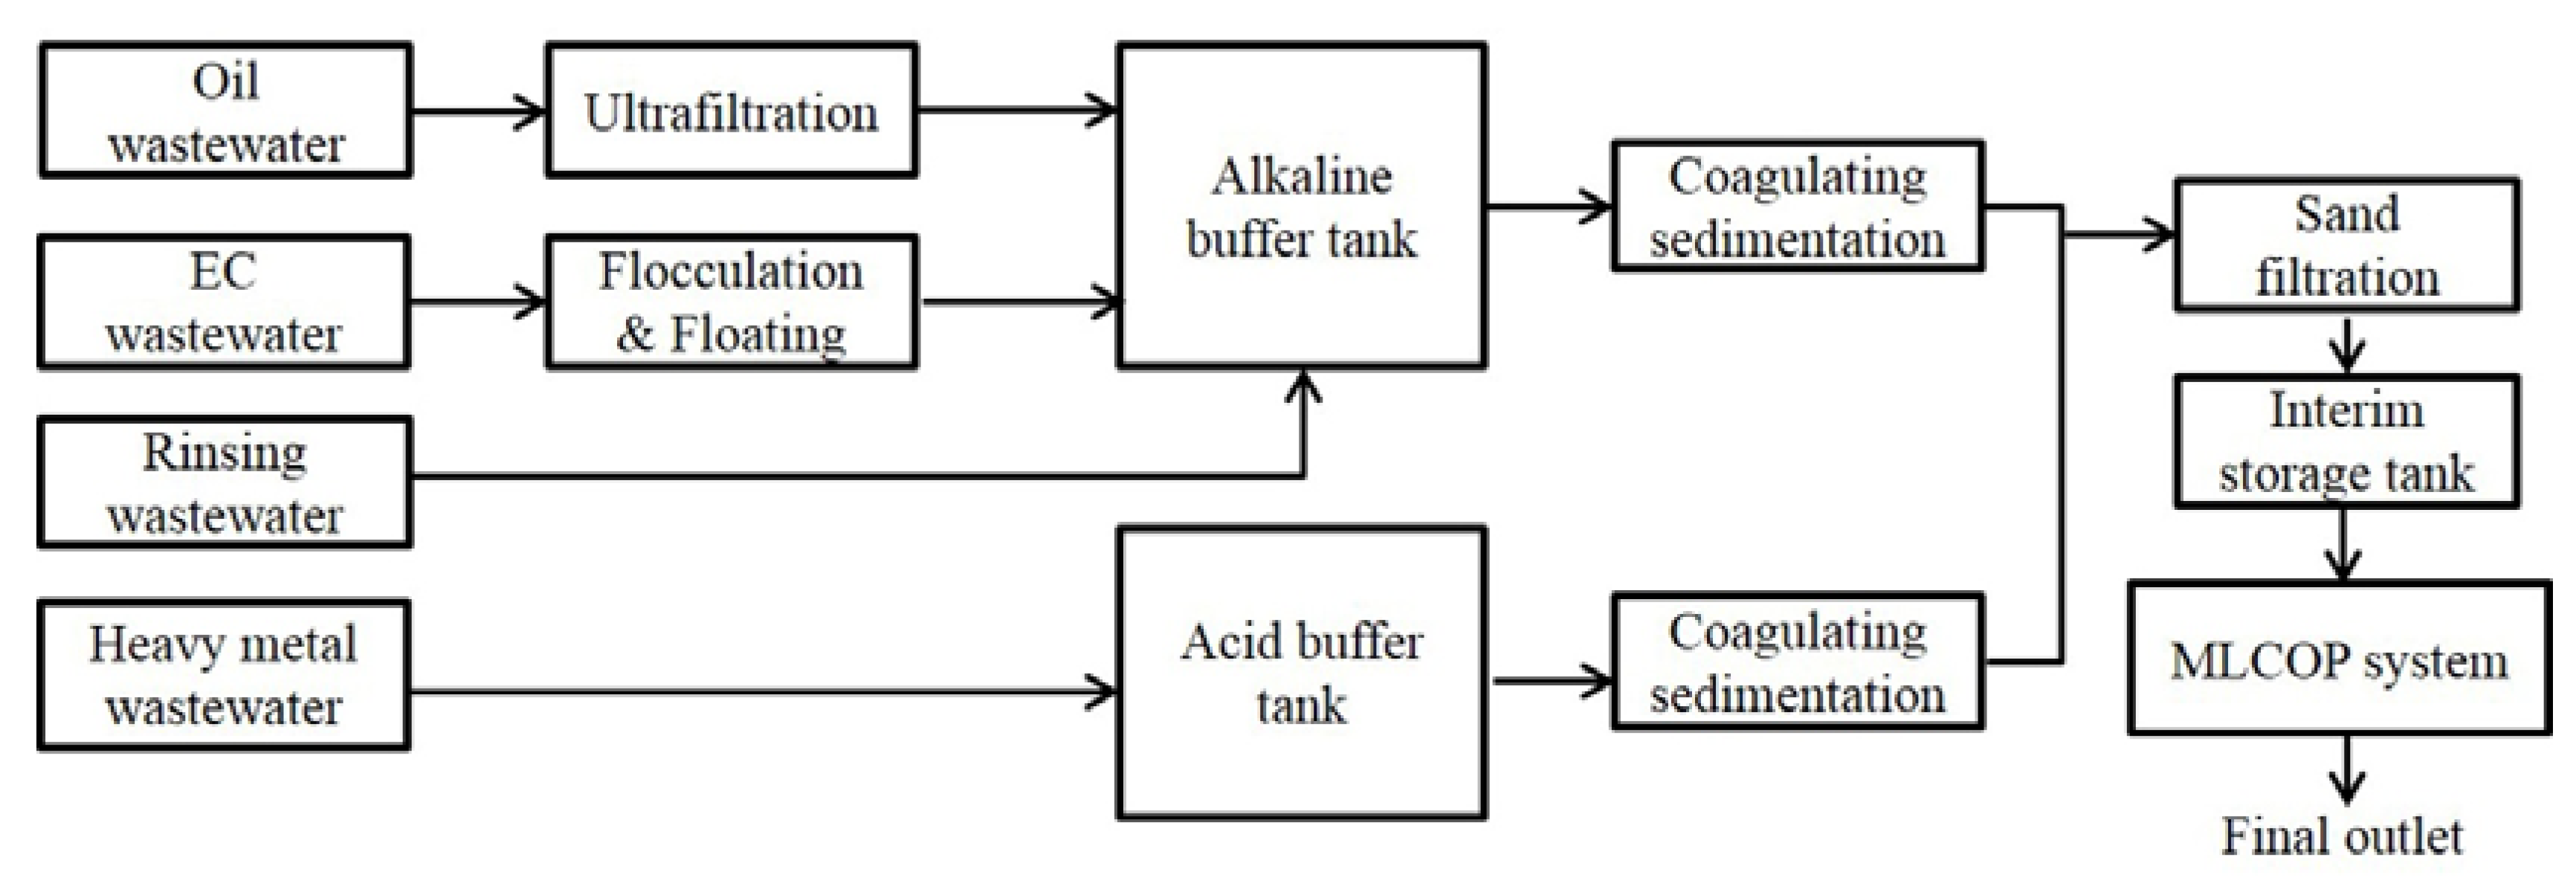
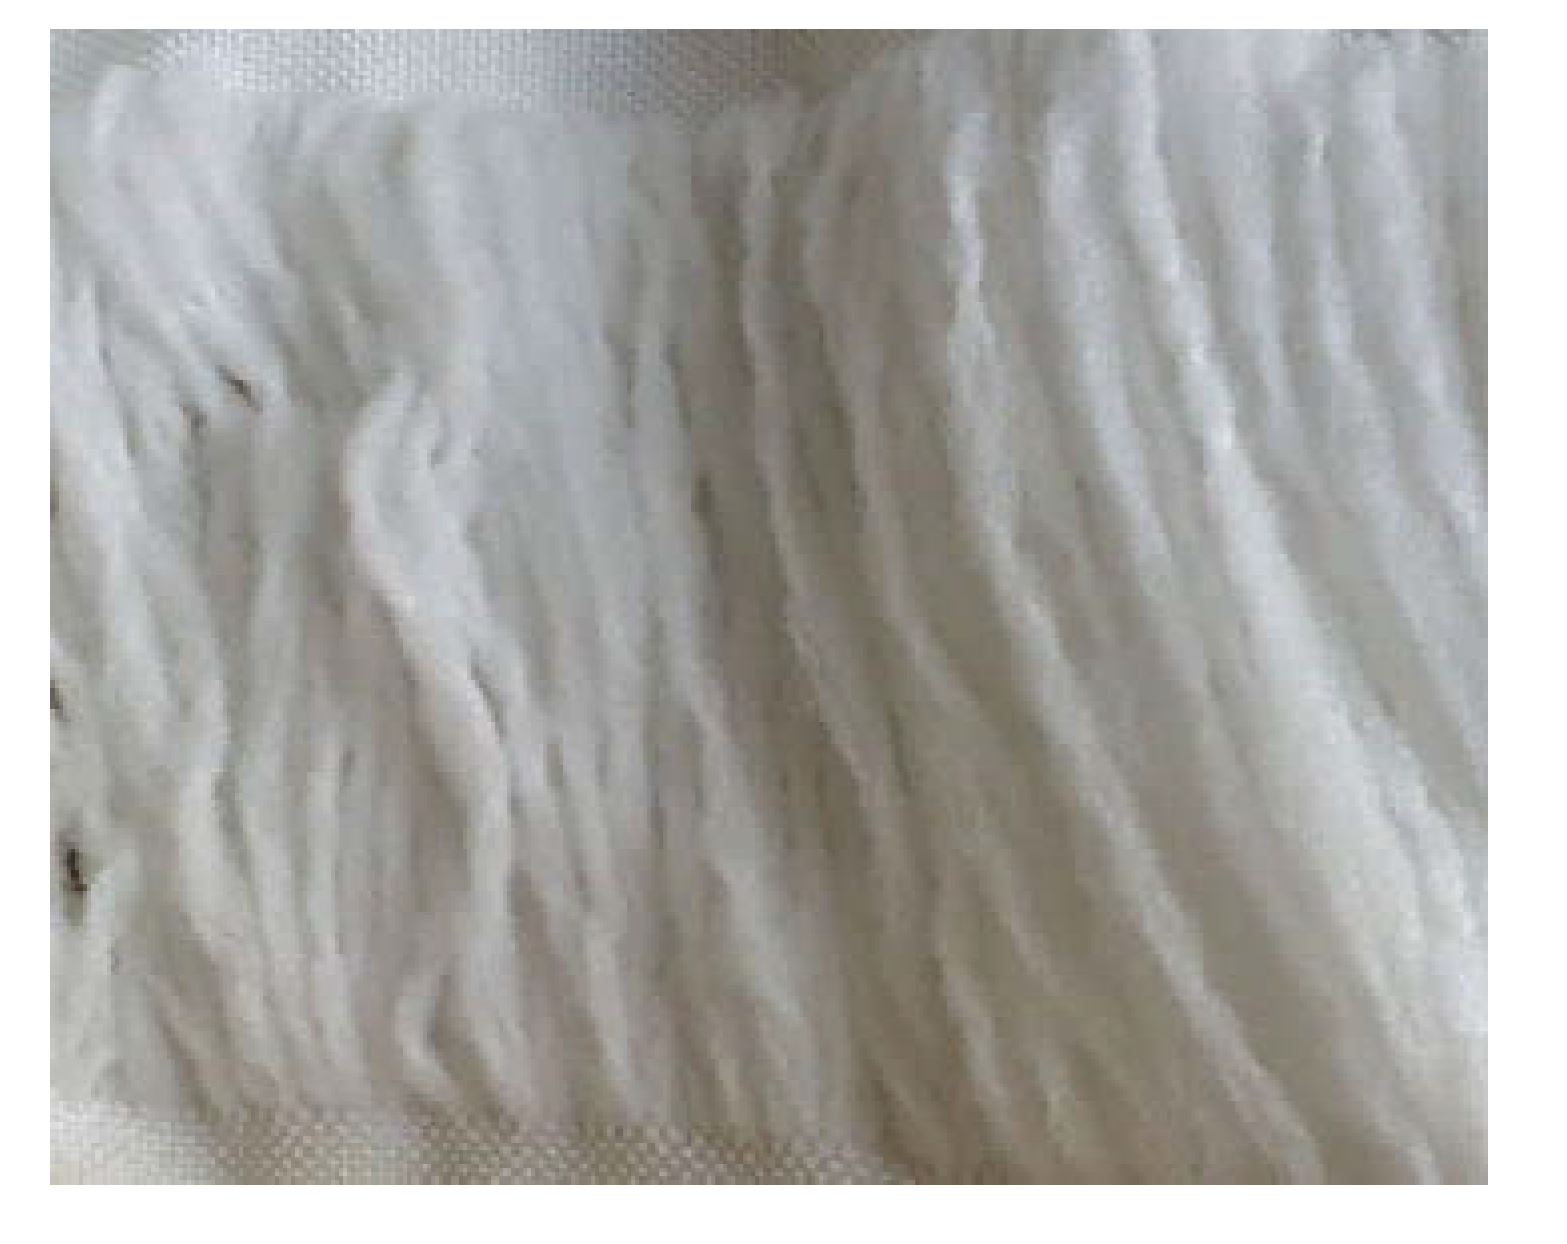
2.2. Experimental Apparatus
2.3. Experimental Set-Up Procedure
2.4. Analytical Methods
2.5. Bacterial Community Analysis
2.5.1. Sample Collection
2.5.2. DNA Extraction and PCR Amplification
2.5.3. Pyrosequencing and Sequence Data Analysis
3. Results and Discussion
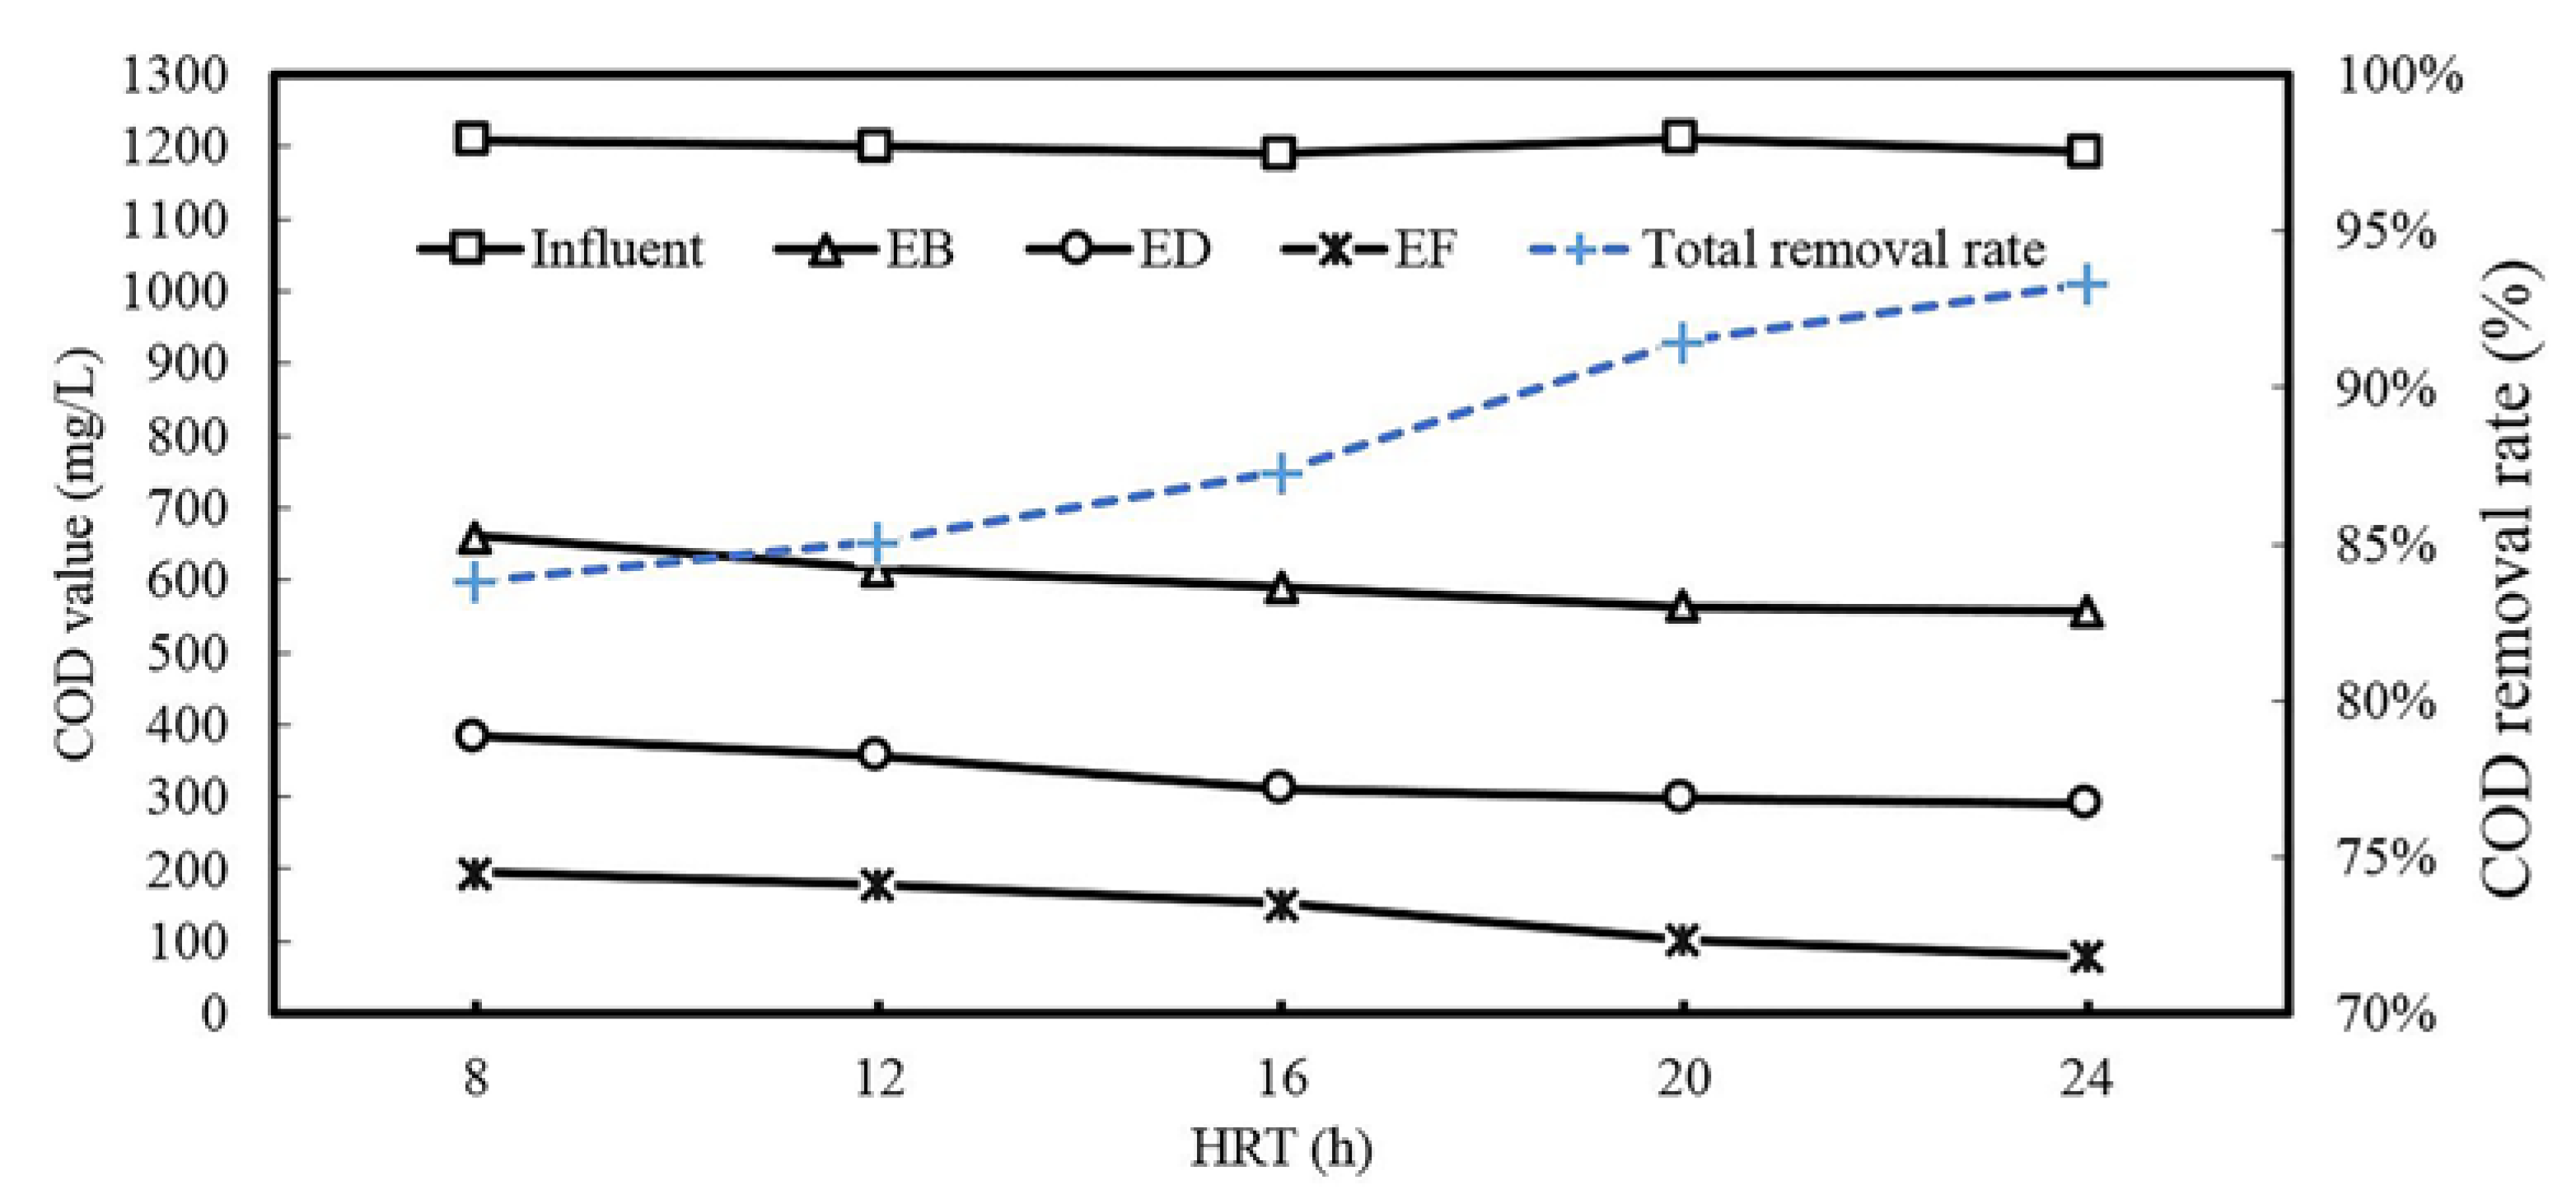
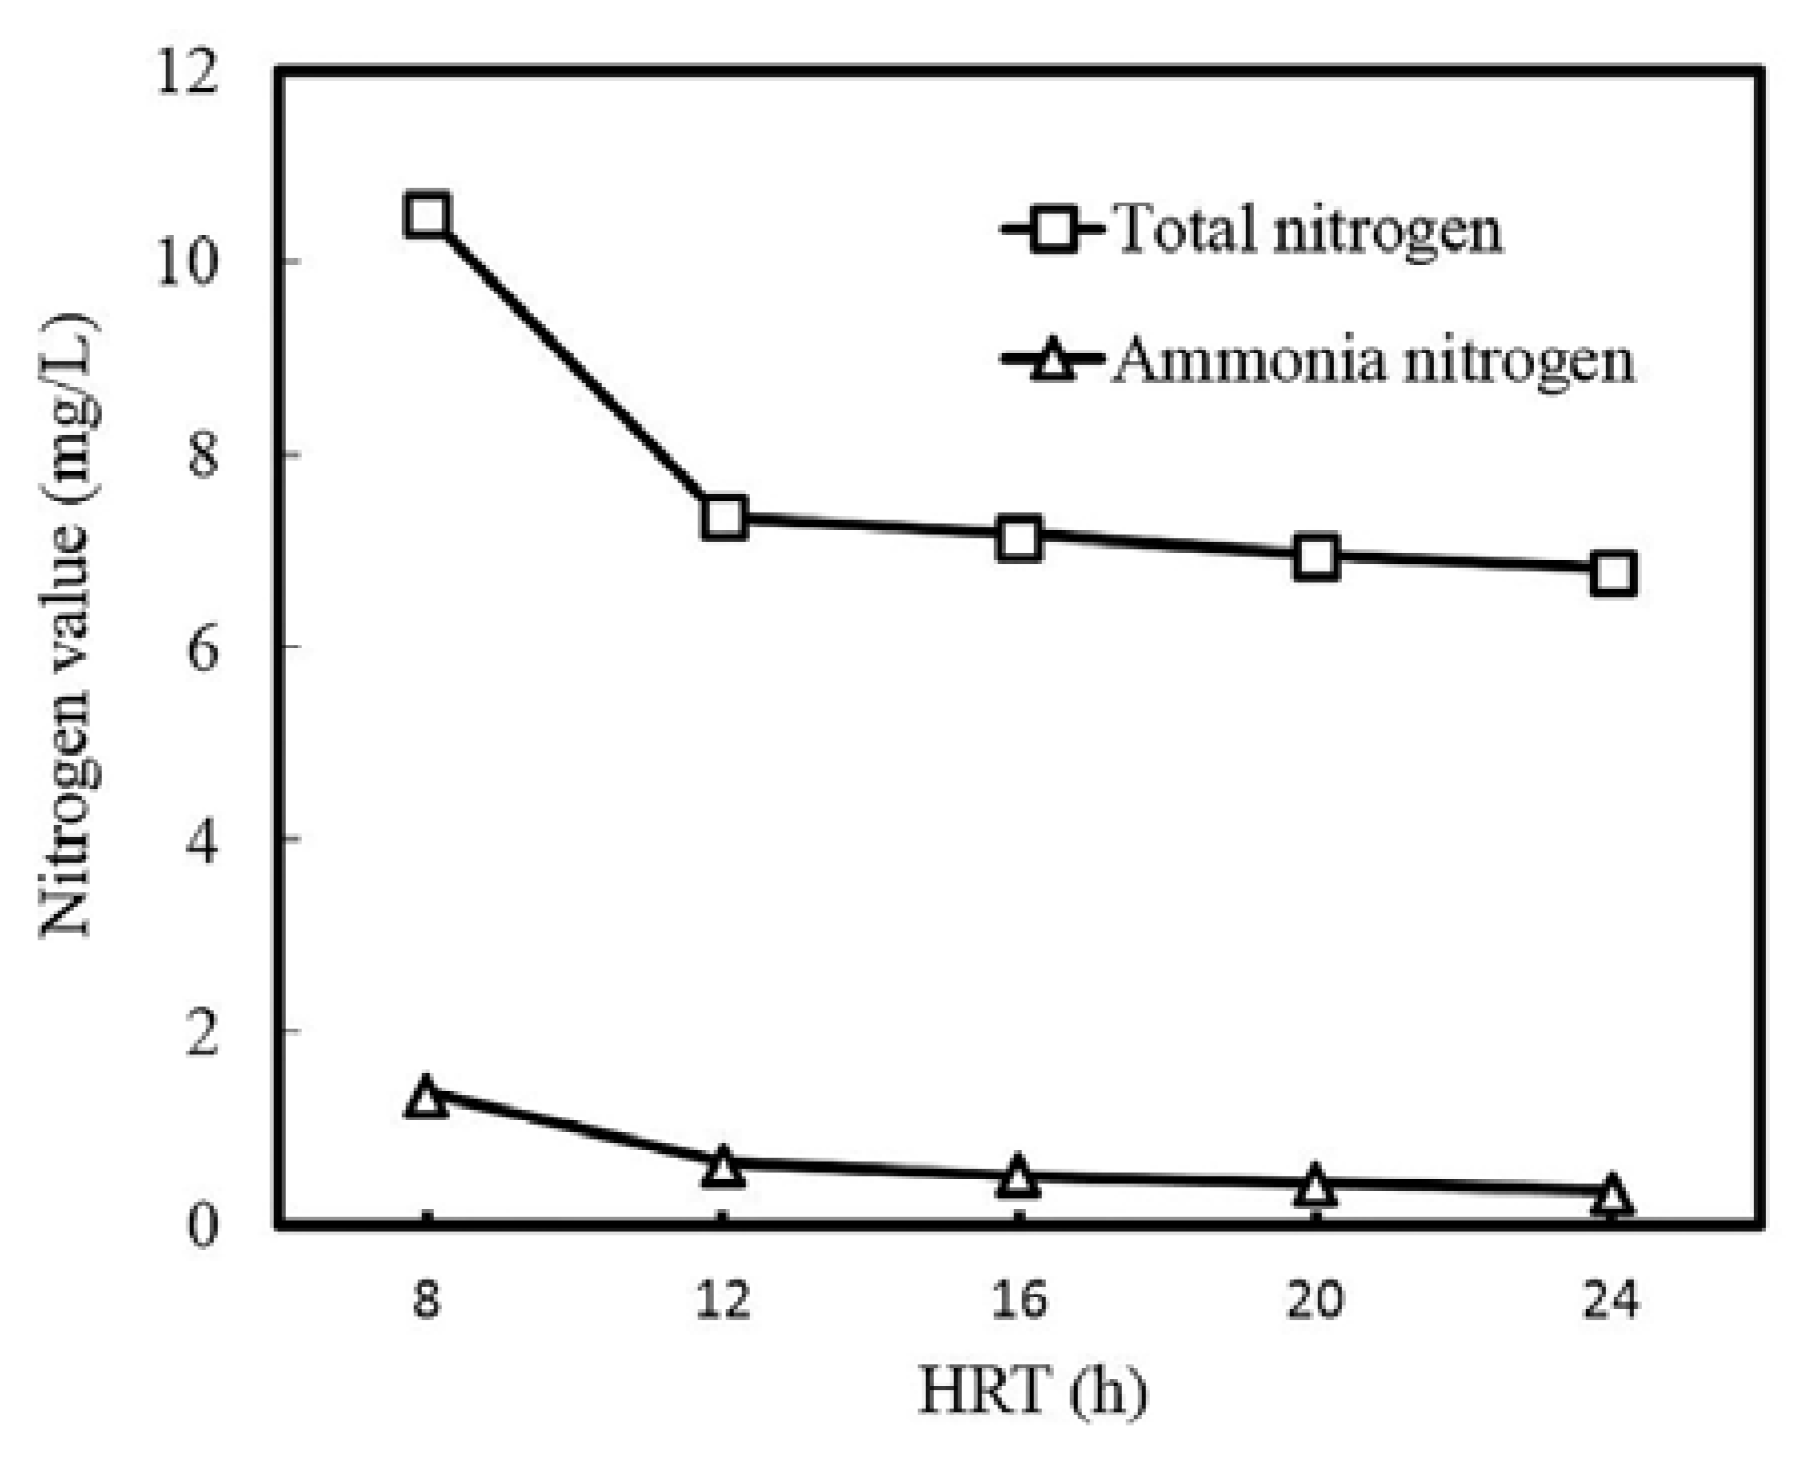
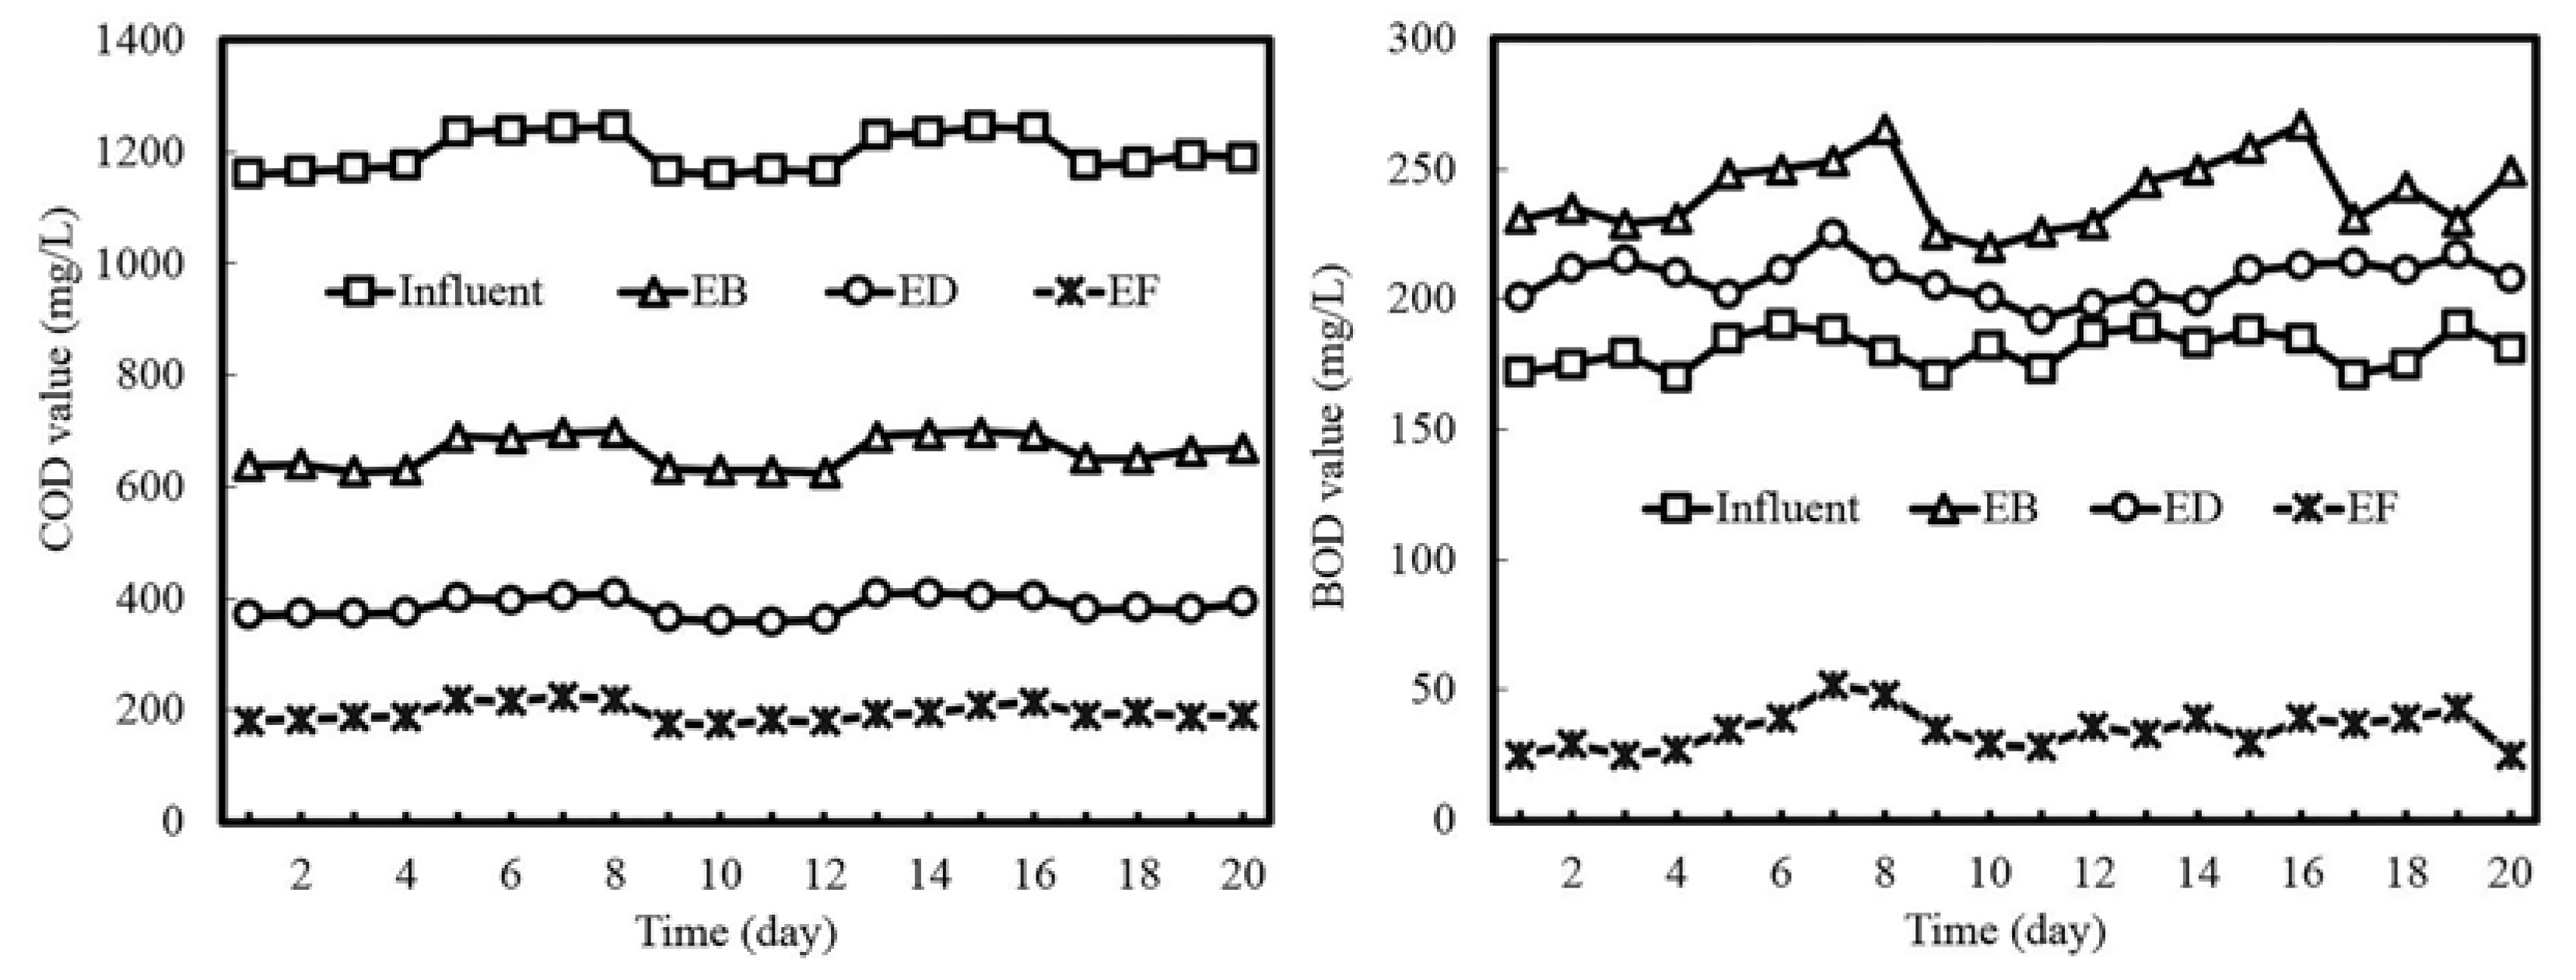
3.1. Process Performance
3.2. Microbial Community Structure Analysis
3.2.1. Microbial Abundance and Diversity
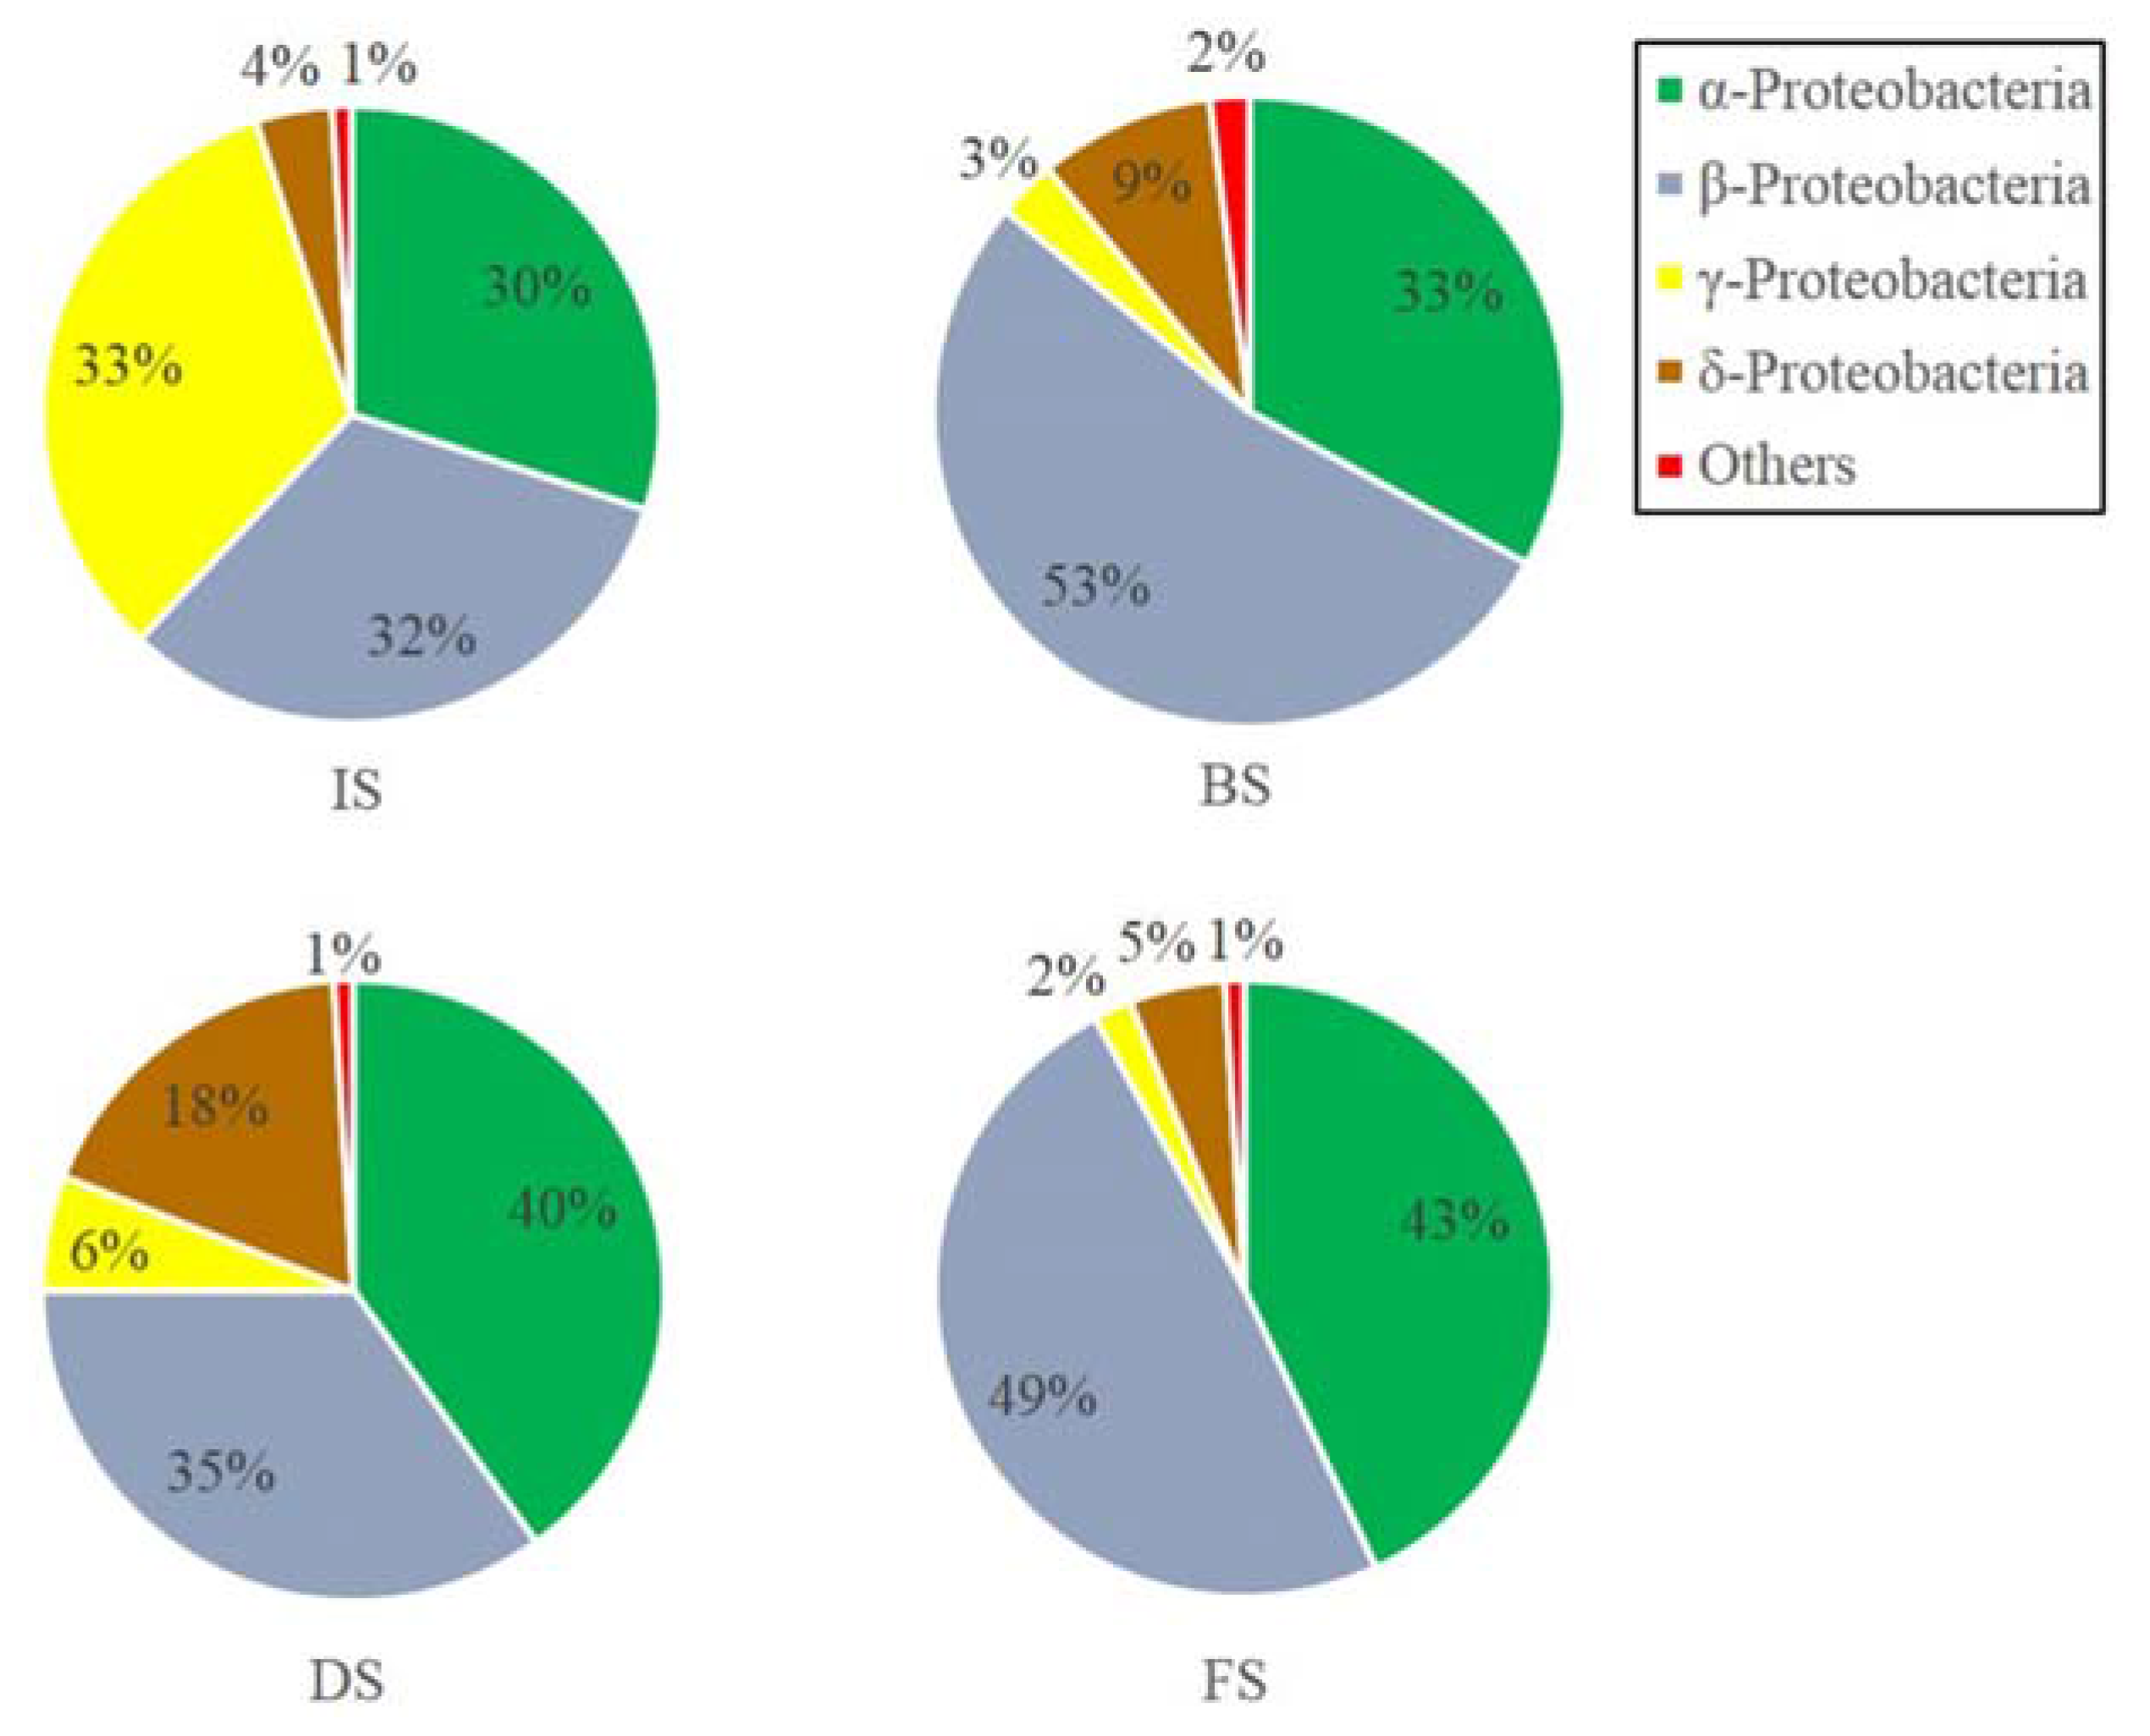
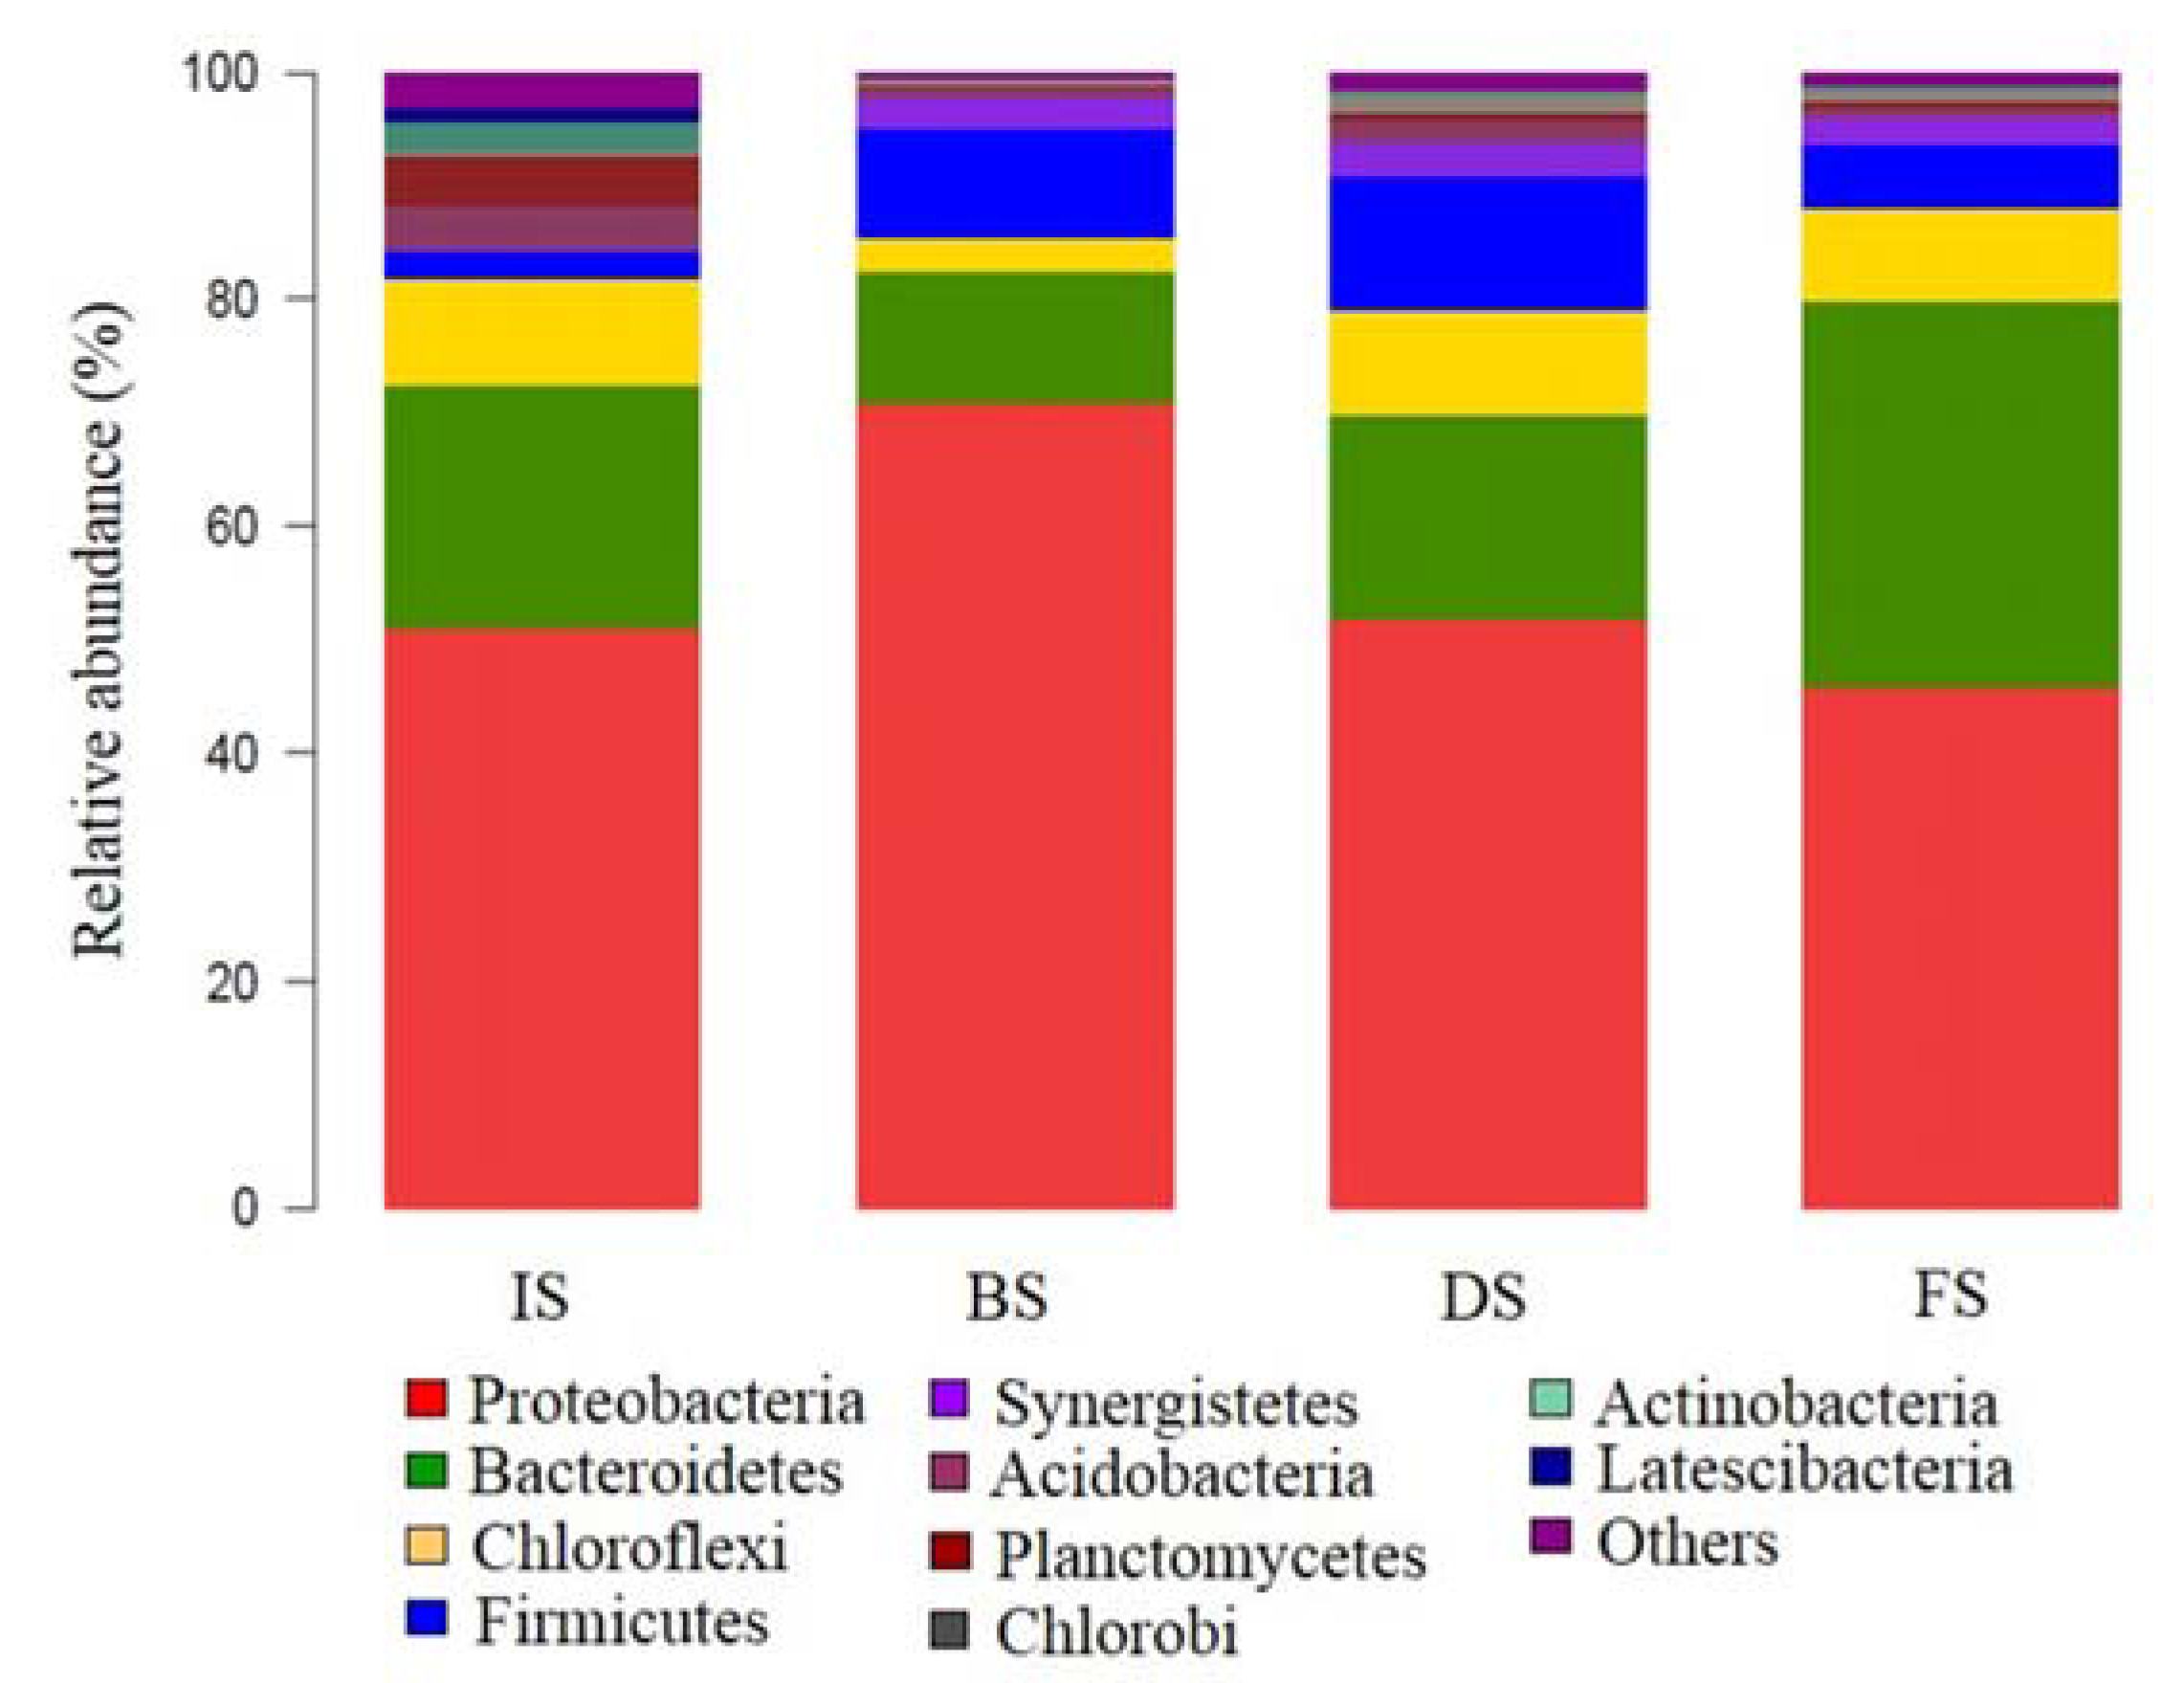
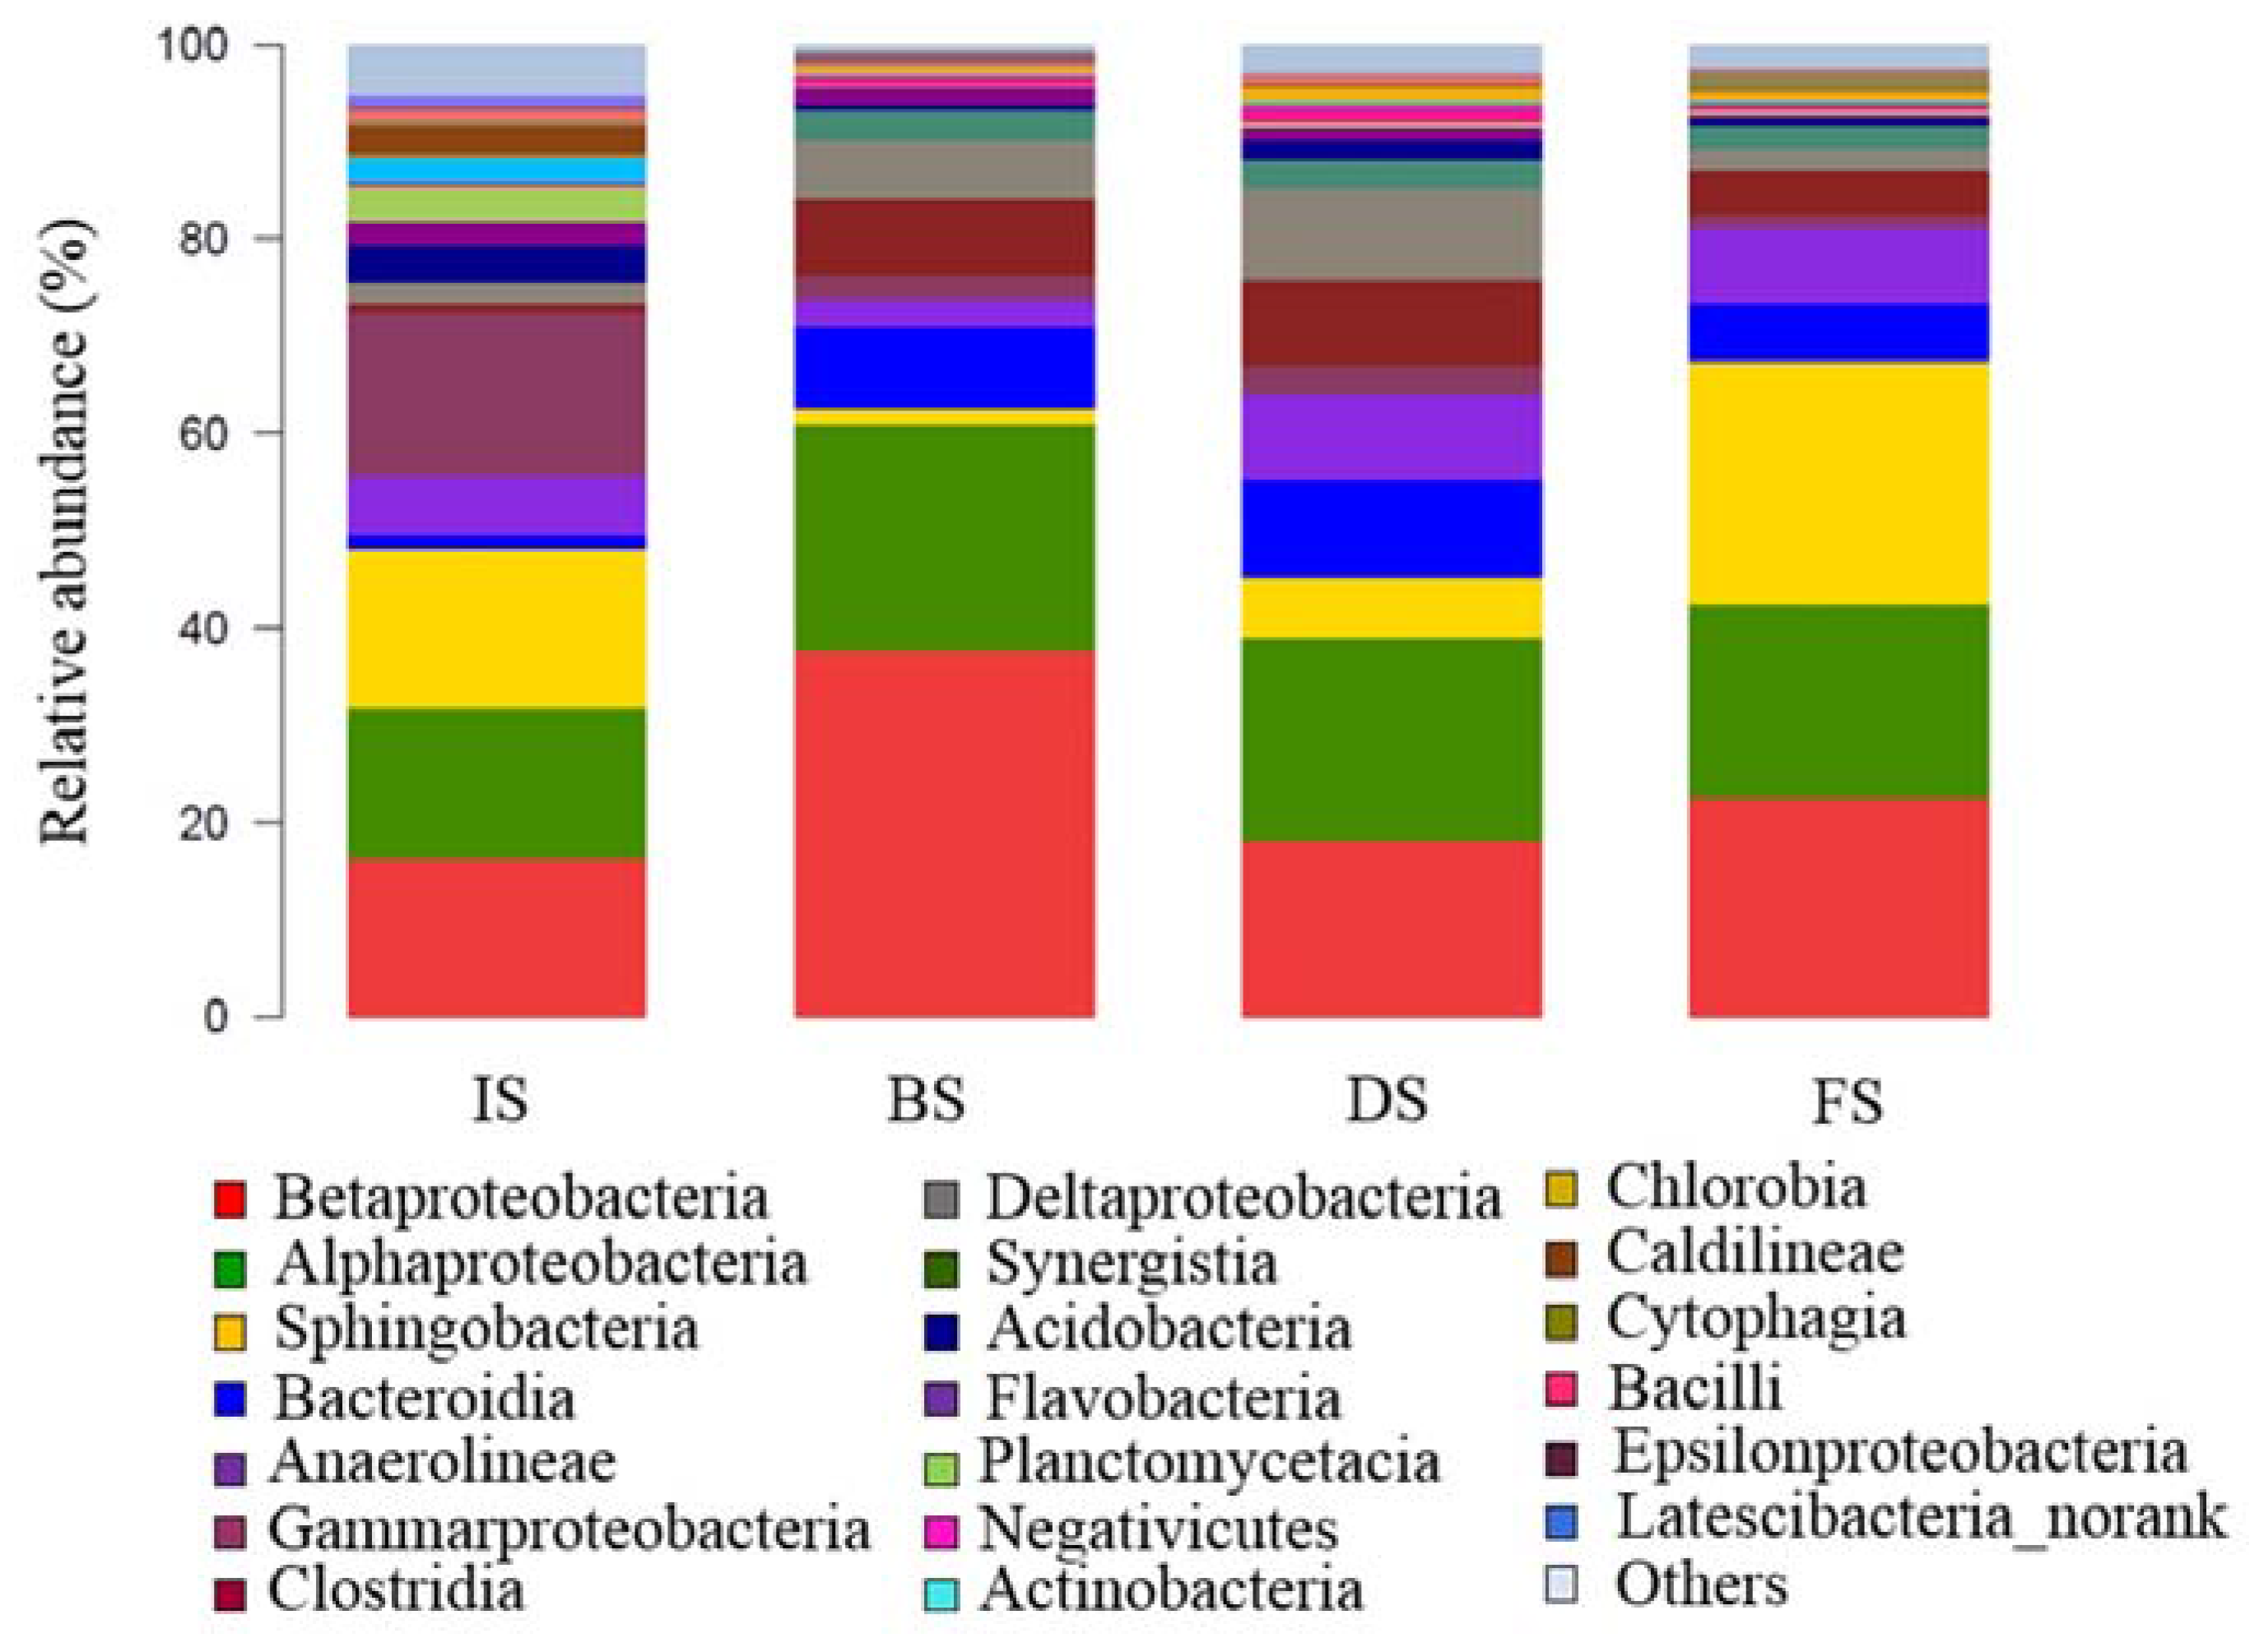
3.2.2. Microbial Community Composition
4. Conclusions
Acknowledgments
Author Contributions
Conflicts of Interest
References
- Dey, B.K.; Hashim, M.A.; Hasan, S.; Gupta, B.S. Microfiltration of water-based paint effluents. Adv. Environ. Res. 2004, 8, 455–466. [Google Scholar] [CrossRef]
- Güven, D.; Hanhan, O.; Aksoy, E.C.; Insel, G.; Çokgör, E. Impact of paint shop decanter effluents on biological treatability of automotive industry wastewater. J. Hazard. Mater. 2017, 330, 61–67. [Google Scholar] [CrossRef] [PubMed]
- Oliveira, R.P.; Ghilardi, J.A.; Ratusznei, S.M.; Rodrigues, J.A.D.; Zaiat, M.; Foresti, E. Anaerobic sequencing batch biofilm reactor applied to automobile industry wastewater treatment: Volumetric loading rate and feed strategy effects. Chem. Eng. Process. 2008, 47, 1374–1383. [Google Scholar] [CrossRef]
- Balik, O.Y.; Aydin, S. Coagulation/flocculation optimization and sludge production for pre-treatment of paint industry wastewater. Desalin. Water Treat. 2016, 57, 12692–12699. [Google Scholar] [CrossRef]
- Lopez-Grimau, V.; Gutierrez, M.C. Decolourisation of simulated reactive dyebath effluents by electrochemical oxidation assisted by UV light. Chemosphere 2006, 62, 106–112. [Google Scholar] [CrossRef] [PubMed]
- Zhang, J.C.; Giorno, L.; Drioli, E. Study of a hybrid process combining PACs and membrane operations for antibiotic wastewater treatment. Desalination 2006, 194, 101–107. [Google Scholar] [CrossRef]
- Akyol, A. Treatment of paint manufacturing wastewater by electrocoagulation. Desalination 2012, 285, 91–99. [Google Scholar] [CrossRef]
- Krithika, D.; Philip, L. Treatment of wastewater from water based paint industries using submerged attached growth reactor. Int. Biodeterior. Biodegrad. 2016, 107, 31–41. [Google Scholar] [CrossRef]
- Mathur, A.K.; Majumder, C.B. Biofiltration and kinetic aspects of a biotrickling filter for the removal of paint solvent mixture laden air stream. J. Hazard. Mater. 2008, 152, 1027–1036. [Google Scholar] [CrossRef] [PubMed]
- Schoenberg, T.; Veltman, S.; Switzenbaum, M. Kinetics of anaerobic degradation of glycol-based type I aircraft deicing. Biodegradation 2001, 12, 59–68. [Google Scholar] [CrossRef] [PubMed]
- Liu, H.; Yang, F.; Wang, T.; Liu, Q.; Hu, S. Carbon membrane-aerated biofilm reactor for synthetic wastewater treatment. Bioproc. Biosyst. Eng. 2007, 30, 217–224. [Google Scholar] [CrossRef] [PubMed]
- Choi, Y.Y.; Baek, S.R.; Kim, J.I.; Choi, J.W.; Hur, J.; Lee, T.U.; Park, C.J.; Lee, B.J. Characteristics and Biodegradability of Wastewater Organic Matter in Municipal Wastewater Treatment Plants Collecting Domestic Wastewater and Industrial Discharge. Water 2017, 9, 409. [Google Scholar] [CrossRef]
- Zheng, T.L.; Li, P.; Wang, Q.H.; Li, X.S.; Ai, H.Y. Pilot-scale experiments on brewery wastewater treatment and sludge reduction based on food chain predation. Desalin. Water Treat. 2014, 55, 1–10. [Google Scholar] [CrossRef]
- Li, P.; Zheng, T.L.; Wang, Q.H.; Yang, S.; Liu, S.; Li, L.J.; Huang, P.K. Treatment of real high-concentration dyeing wastewater using a coagulation-hydrolysis acidification-multilevel contact oxidation system. Environ. Prog. Sustain. 2015, 34, 339–345. [Google Scholar] [CrossRef]
- GB21/1627-2008. The Integrated Wastewater Discharge Standard of Liaoning Province, 1st ed.; Environmental Protection Bureau: Liaoning, China, 2008.
- Miura, Y.; Hiraiwa, M.N.; Itonaga, T.; Watanabe, Y. Bacterial community structures in MBRs treating municipal wastewater: Relationship between community stability and reactor performance. Water Res. 2007, 41, 627–637. [Google Scholar] [CrossRef] [PubMed]
- Zhu, T.; Zhu, Y.F.; Fienko, U.; Xie, Y.H.; Zhang, K. Performance of multilevel contact oxidation in the treatment of wastewater from automobile painting industry. IOP Conf. Ser. Earth Environ. Sci. 2017, 51, 12–18. [Google Scholar] [CrossRef]
- American Public Health Association (APHA). Standard Methods for the Examination of Water and Wastewater, 21st ed.; APHA: Washington, DC, USA, 2005. [Google Scholar]
- Hu, M.; Wang, X.H.; Wen, X.H.; Xia, Y. Microbial community structures in different wastewater treatment plants as revealed by 454-pyrosequencing analysis. Bioresour. Technol. 2012, 117, 72–79. [Google Scholar] [CrossRef] [PubMed]
- Xiong, J.B.; Liu, Y.Q.; Lin, X.G.; Zhang, H.Y.; Zeng, J. Geographic distance and PH drive bacterial distribution in alkaline lake sediments across Tibetan Plateau. Environ. Microbiol. 2012, 14, 2457–2466. [Google Scholar] [CrossRef] [PubMed]
- Marzorati, M.; Wittebolle, L.; Boon, N.; Daffonchio, D.; Verstraete, W. How to get more out of molecular fingerprints: Practical tools for microbial ecology. Environ. Microbiol. 2008, 10, 1571–1581. [Google Scholar] [CrossRef] [PubMed]
- Münch, E.V.; Lant, P.; Keller, J. Simultaneous nitrification and denitrification in bench-scale sequencing batch reactors. Water Res. 1996, 30, 277–284. [Google Scholar] [CrossRef]
- Zeng, R.J.; Lemaire, Z.; Yuan, Z.; Keller, J. Simultaneous nitrification, denitrification, and phosphorus removal in a lab-scale sequencing batch reactor. Biotechnol. Bioeng. 2003, 84, 170–178. [Google Scholar] [CrossRef] [PubMed]
- Ma, J.X.; Wang, Z.W.; Yang, Y.; Mei, X.J.; Wu, Z.C. Correlating microbial community structure and composition with aeration intensity in submerged membrane bioreactors by 454 high-throughput pyrosequencing. Water Res. 2013, 47, 859–869. [Google Scholar] [CrossRef] [PubMed]
- Chiu, Y.C.; Lee, L.L.; Chang, C.N.; Chao, A.C. Control of carbon and ammonium ratio for simultaneous nitrification and denitrification in a sequencing batch bioreactor. Int. Biodeterior. Biodegrad. 2007, 59, 1–7. [Google Scholar] [CrossRef]
- Ghyoot, W.; Verstraete, W. Reduced sludge production in a two-stage membrane assisted bioreactor. Water Res. 2000, 34, 205–215. [Google Scholar] [CrossRef]
- Lee, N.M.; Welander, T. Reducing sludge production in aerobic wastewater treatment through manipulation of the ecosystem. Water Res. 1996, 30, 1781–1790. [Google Scholar] [CrossRef]
- Wong, M.T.; Mino, T.; Seviour, R.J.; Onuki, M.; Liu, W.T. In situ identification and characterization of the microbial community structure of full-scale enhanced biological phosphorous removal plants in Japan. Water Res. 2005, 39, 2901–2914. [Google Scholar] [CrossRef] [PubMed]
- Wolf, M.; Müller, T.; Dandekar, T.; Pollack, J.D. Phylogeny of Firmicutes with special reference to Mycoplasma( Mollicutes) as inferred from phosphoglycerate kinase amino acid sequence data. Int. J. Syst. Evol. Microbiol. 2004, 54, 871–875. [Google Scholar] [CrossRef] [PubMed]
- Bertin, L.; Bettini, C.; Zanaroli, G.; Fraraccio, S.; Negroni, A.; Fava, F. Acclimation of an anaerobic consortium capable of effective biomethanization of mechanically-sorted organic fraction of municipal solid waste through a semi-continuous enrichment procedure. J. Chem. Technol. Biotechnol. 2012, 87, 1312–1319. [Google Scholar] [CrossRef]
- Prashanthini, V.; Bui, X.T.; Chettiyappan, V. Simultaneous nitrification denitrification in a Batch Granulation Membrane Airlift Bioreactor. Int. Biodeterior. Biodegrad. 2014, 95, 139–143. [Google Scholar] [CrossRef]
- Akao, S.; Tsuno, H.; Horie, T.; Mori, S. Effects of pH and temperature on products and bacterial community in L-lactate batch fermentation of garbage under unsterile condition. Water Res. 2007, 41, 2636–2642. [Google Scholar] [CrossRef] [PubMed]
- Ahn, Y.; Choi, J. Bacterial communities and antibiotic resistance communities in a full-scale hospital wastewater treatment plant by high-throughput pyrosequencing. Water 2016, 8, 580. [Google Scholar] [CrossRef]


| Main Pollutant | pH | CODCr (mg/L) | BOD5 (mg/L) | TP a (mg/L) | TN (mg/L) | NH4+-N (mg/L) | SS b (mg/L) |
|---|---|---|---|---|---|---|---|
| Test value | 7 ± 0.5 | 1200 ± 50 | 180 ± 10 | 0.5 ± 0.1 | 30 ± 5 | 10 ± 2 | 150 ± 10 |
| Discharge standard | 6–9 | 300 | 250 | 5 | 50 | 30 | 300 |
| Carrier Parameters | Value |
|---|---|
| Filling quantity | 4.2 kg/m3 |
| Filling ratio | 20% |
| Volume density | 21 kg/m3 |
| Specific surface area | 1200 m2/kg |
| Porosity | 97% |
| Items | Influent | EB a | ED b | EF c | Total Removal Ratio |
|---|---|---|---|---|---|
| BOD | 180 | 240 | 208 | 35 | 80.6% |
| COD | 1200 | 661 | 385 | 195 | 83.8% |
| BOD/COD | 0.15 | 0.36 | 0.54 | 0.18 | --- |
| SS | 145 | 186 | 78 | 25 | 82.8% |
| Sample ID | OTU | Chao | Shannon | Coverage |
|---|---|---|---|---|
| IS | 678 | 750 | 5.19 | 0.9965 |
| BS | 391 | 532 | 3.78 | 0.9967 |
| DS | 558 | 705 | 4.54 | 0.9951 |
| FS | 525 | 631 | 4.15 | 0.9962 |
© 2017 by the authors. Licensee MDPI, Basel, Switzerland. This article is an open access article distributed under the terms and conditions of the Creative Commons Attribution (CC BY) license (http://creativecommons.org/licenses/by/4.0/).
Share and Cite
Zhu, Y.; Zhu, T.; Groetzbach, M.; Han, H.; Ma, Y. Multi-Level Contact Oxidation Process Performance When Treating Automobile Painting Wastewater: Pollutant Removal Efficiency and Microbial Community Structures. Water 2017, 9, 881. https://doi.org/10.3390/w9110881
Zhu Y, Zhu T, Groetzbach M, Han H, Ma Y. Multi-Level Contact Oxidation Process Performance When Treating Automobile Painting Wastewater: Pollutant Removal Efficiency and Microbial Community Structures. Water. 2017; 9(11):881. https://doi.org/10.3390/w9110881
Chicago/Turabian StyleZhu, Yufang, Tong Zhu, Michael Groetzbach, Hui Han, and Yongguang Ma. 2017. "Multi-Level Contact Oxidation Process Performance When Treating Automobile Painting Wastewater: Pollutant Removal Efficiency and Microbial Community Structures" Water 9, no. 11: 881. https://doi.org/10.3390/w9110881
APA StyleZhu, Y., Zhu, T., Groetzbach, M., Han, H., & Ma, Y. (2017). Multi-Level Contact Oxidation Process Performance When Treating Automobile Painting Wastewater: Pollutant Removal Efficiency and Microbial Community Structures. Water, 9(11), 881. https://doi.org/10.3390/w9110881