The Impact of a Check Dam on Groundwater Recharge and Sedimentation in an Ephemeral Stream

 ,
,  and
and
Abstract
1. Introduction
2. Materials and Methods
2.1. Study Area
2.1.1. Transient Zone
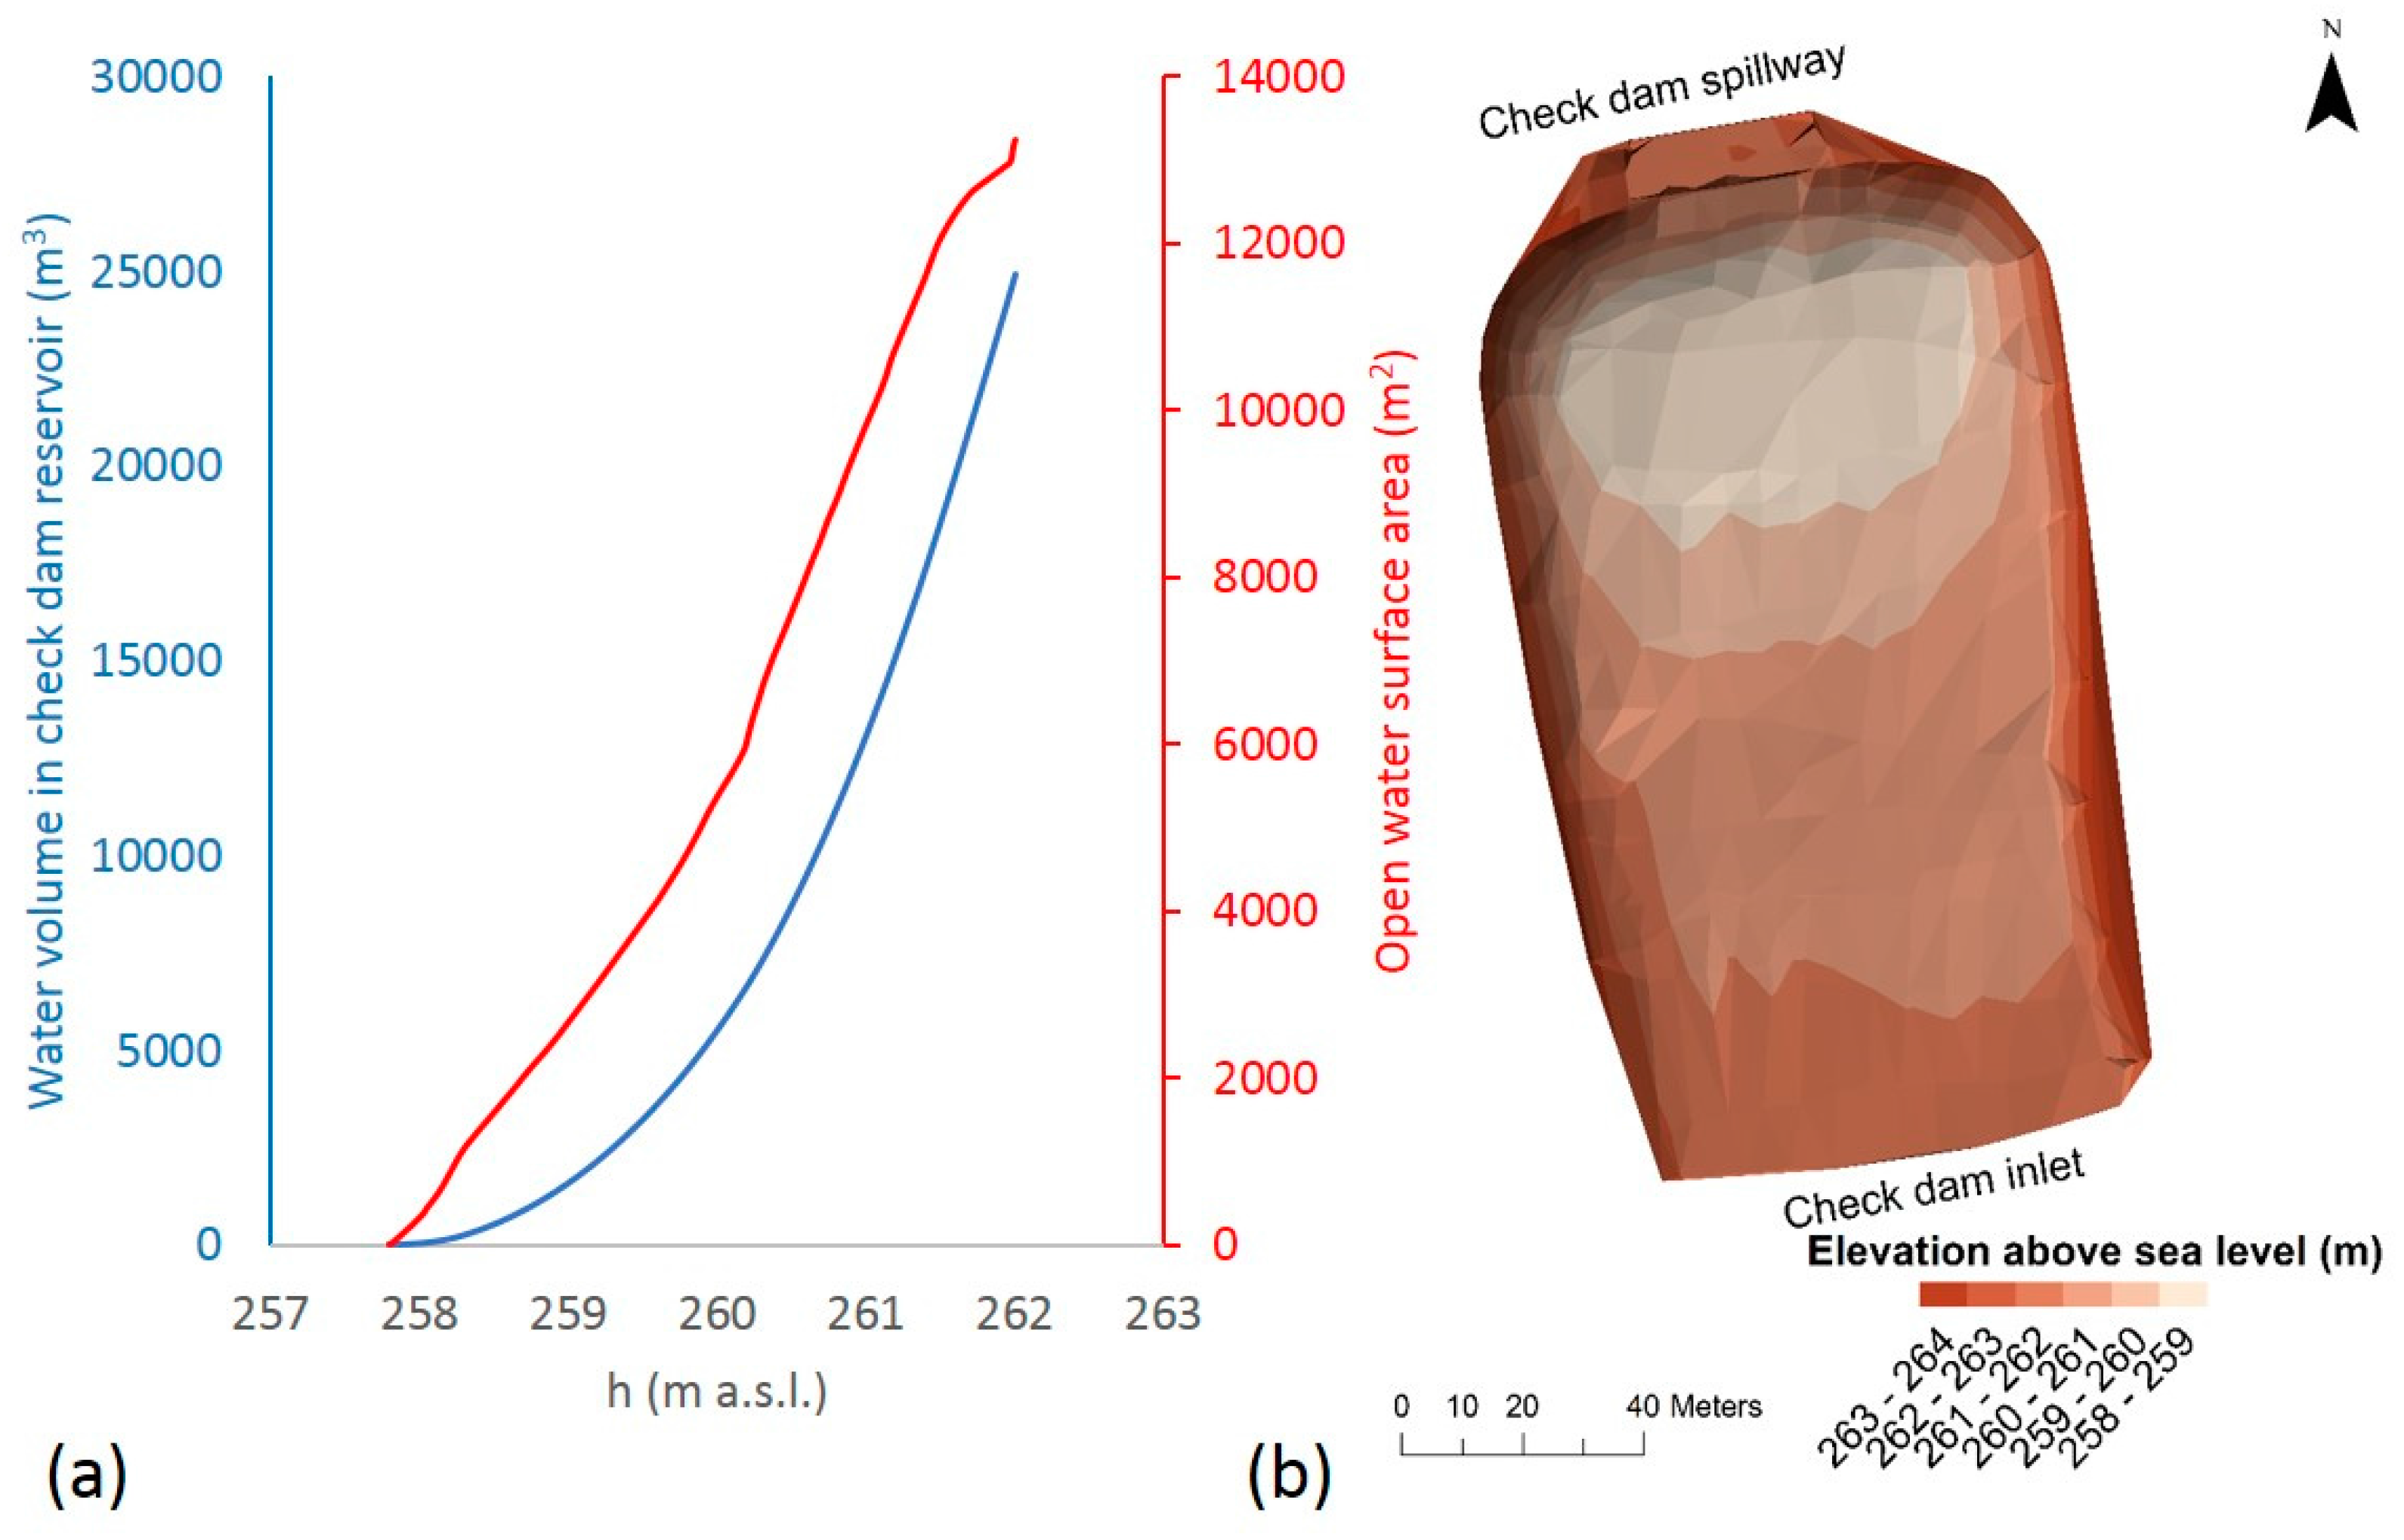
2.1.2. Check Dam Zone
2.2. Field Monitoring
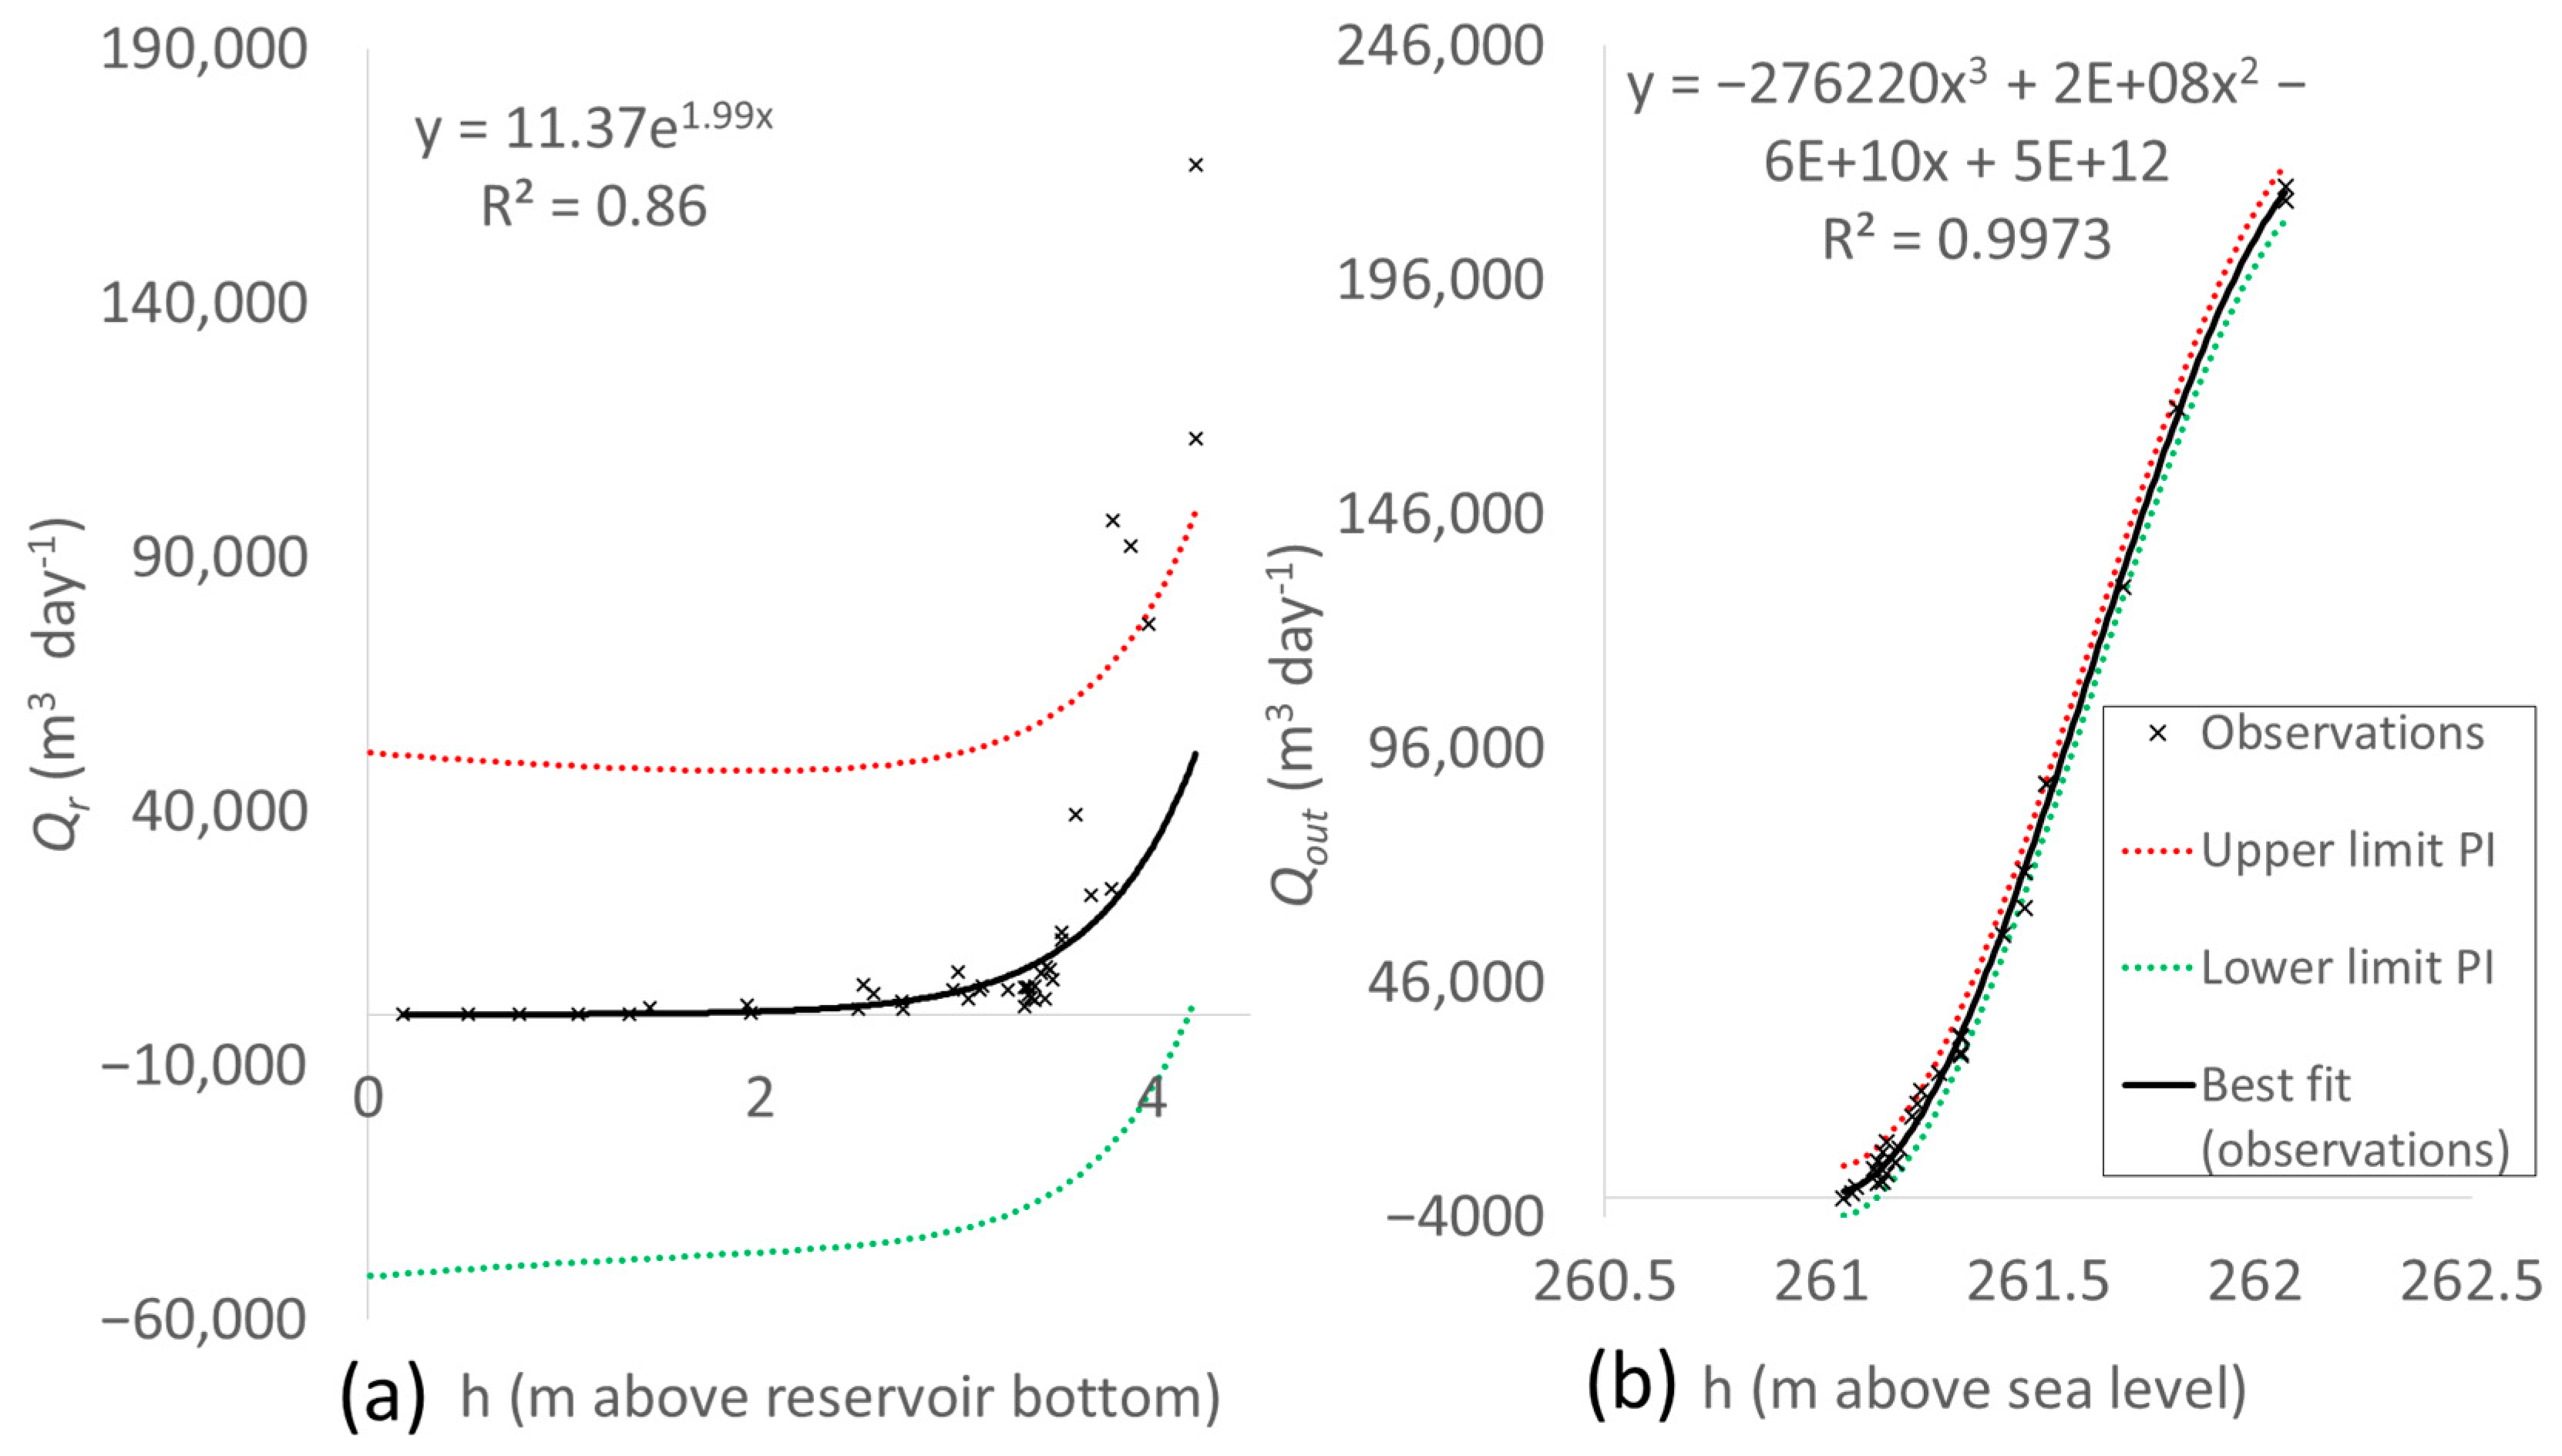
2.3. Water Balance Computations
2.4. Uncertainty Analyses
3. Results and Discussion
3.1. Transient Zone
3.2. Check Dam Zone
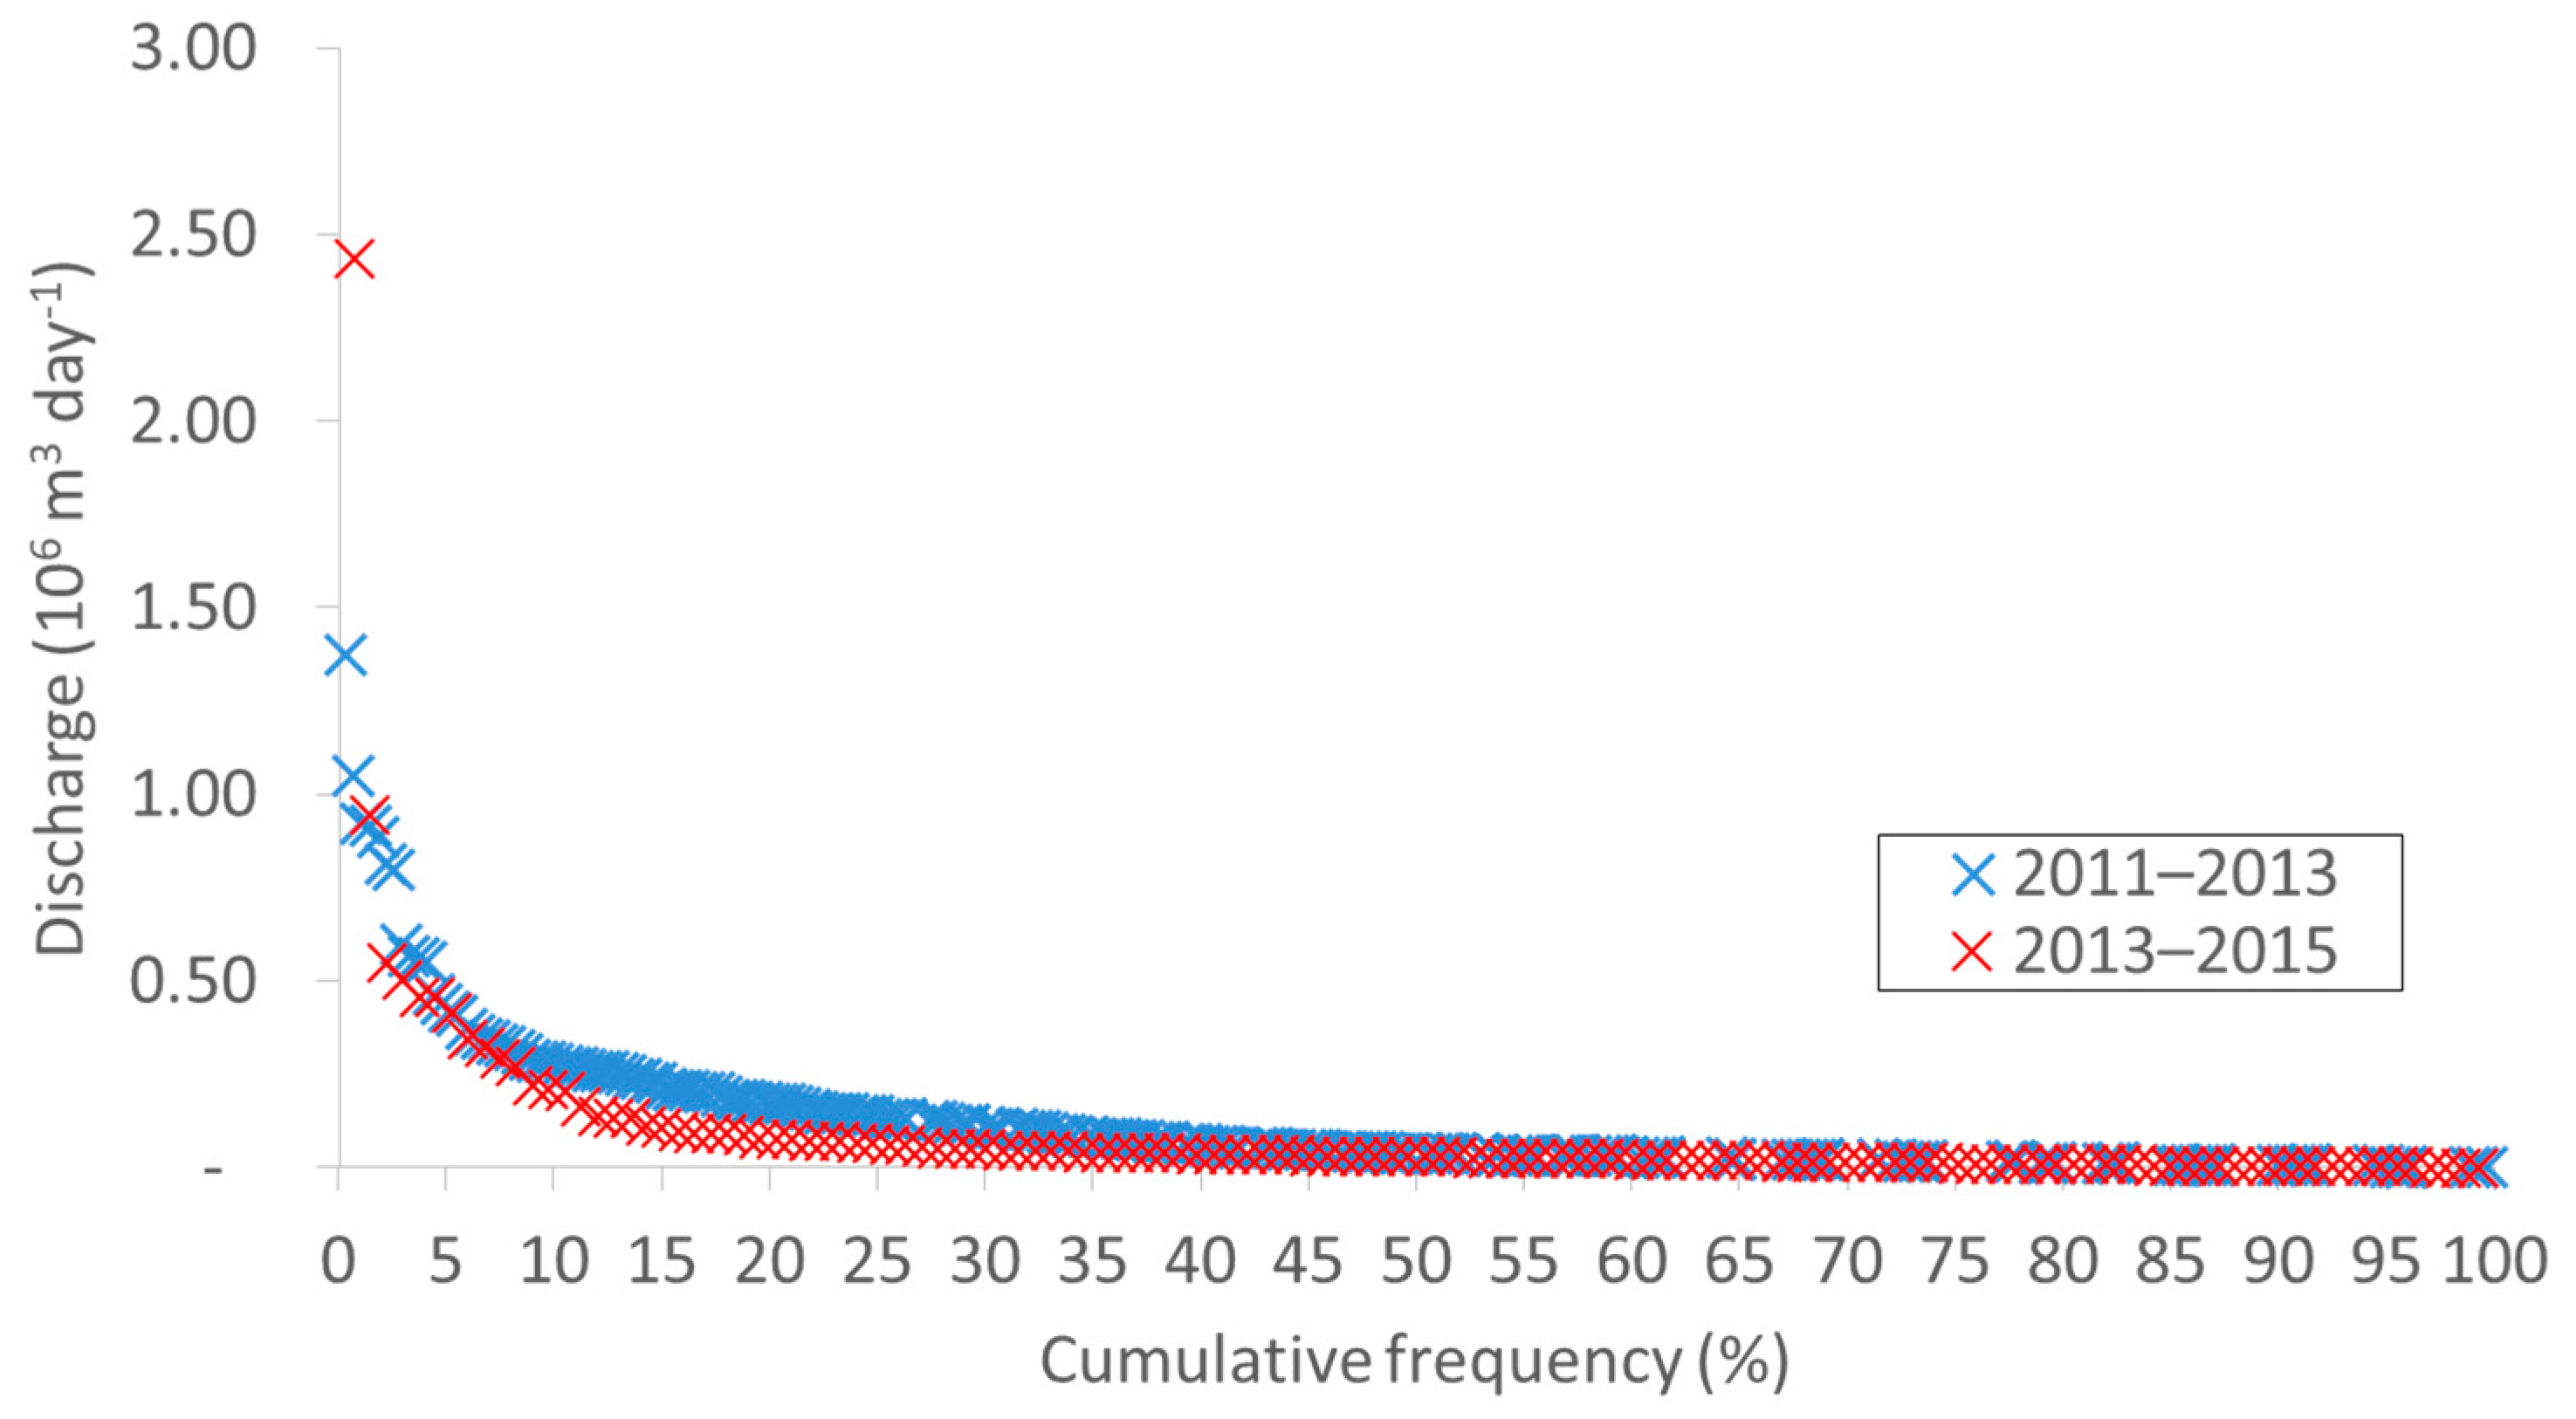
3.3. Water Balance Components
3.4. Sediment Build-up in the Check Dam Reservoir
4. Conclusions
Acknowledgments
Author Contributions
Conflicts of Interest
References
- Chung, I.; Sophocleous, M.; Mitiku, D.; Kim, N. Estimating groundwater recharge in the humid and semi-arid African regions: Review. Geosci. J. 2016, 20, 731–744. [Google Scholar] [CrossRef]
- Ringleb, J.; Sallwey, J.; Stefan, C. Assessment of managed aquifer recharge through modeling—A review. Water 2016, 8, 579. [Google Scholar] [CrossRef]
- Steinel, A.; Schelkes, K.; Subah, A.; Himmelsbach, T. Spatial multi-criteria analysis for selecting potential sites for aquifer recharge via harvesting and infiltration of surface runoff in north Jordan. Hydrogeol. J. 2016, 24, 1753–1774. [Google Scholar] [CrossRef]
- Guyennon, N.; Salerno, F.; Portoghese, I.; Romano, E. Climate change adaptation in a Mediterranean semi-arid catchment: Testing managed aquifer recharge and increased surface reservoir capacity. Water 2017, 9, 689. [Google Scholar] [CrossRef]
- Rupérez-Moreno, C.; Pérez-Sánchez, J.; Senent-Aparicio, J.; Flores-Asenjo, P.; Paz-Aparicio, C. Cost-benefit analysis of the managed aquifer recharge system for irrigation under climate change conditions in Southern Spain. Water 2017, 9, 343. [Google Scholar] [CrossRef]
- Martin-Rosales, W.; Gisbert, J.; Pulido-Bosch, A.; Vallejos, A.; Fernandez-Cortes, A. Estimating groundwater recharge induced by engineering systems in a semiarid area (southeastern Spain). Environ. Geol. 2007, 52, 985–995. [Google Scholar] [CrossRef]
- Mussi, M.; Nanni, T.; Tazioli, A.; Vivalda, P.M. The Mt Conero limestone ridge: The contribution of stable isotopes to the identification of the recharge area of aquifers. Ital. J. Geosci. 2017, 136, 186–197. [Google Scholar] [CrossRef]
- Alderwish, A.M. Induced recharge at new dam sites-Sana’a Basin, Yemen. Arab. J. Geosci. 2010, 3, 283–293. [Google Scholar] [CrossRef]
- Racz, A.J.; Fisher, A.T.; Schmidt, C.M.; Lockwood, B.S.; Los Huertos, M. Spatial and temporal infiltration dynamics during managed aquifer recharge. Ground Water 2012, 50, 562–570. [Google Scholar] [CrossRef] [PubMed]
- Huang, J.; Hinokidani, O.; Yasuda, H.; Ojha, C.S.P.; Kajikawa, Y.; Li, S. Effects of the check dam system on water redistribution in the Chinese Loess Plateau. J. Hydrol. Eng. 2013, 18, 929–940. [Google Scholar] [CrossRef]
- Agarwal, R.; Garg, P.K.; Garg, R.D. Remote sensing and GIS based approach for identification of artificial recharge sites. Water Resour. Manag. 2013, 27, 2671–2689. [Google Scholar] [CrossRef]
- Conesa-García, C.; García-Lorenzo, R. Bed scouring-sedimentation balance induced by check dams in semiarid catchments with different lithology. In Check Dams, Morphological Adjustments and Erosion Control in Torrential Streams; Conesa-García, C., Lenzi, M.A., Eds.; Nova Science Publisher: Hauppauge, NY, USA, 2013; pp. 283–306. [Google Scholar]
- García-Lorenzo, R.; Conesa-García, C.; Martínez-Salvador, A. Assessing soil erosion in semi-arid check dam watersheds using GeoWEPP (South-East Spain). In Geomorphology: Processes Taxonomy and Applications; Miguel, H.S., Phillip, D.C., Eds.; Nova Science Publisher: Hauppauge, NY, USA, 2013; pp. 115–146. [Google Scholar]
- Mandana, A.; Azlin, S.; Fauziah, A. Effectiveness of check dam to control soil erosion in a tropical catchment (The Ulu Kinta Basin). Catena 2012, 97, 63–70. [Google Scholar] [CrossRef]
- Spalevic, V.; Lakicevic, M.; Radanovic, D.; Billi, P.; Barovic, G.; Vujacic, D.; Sestras, P.; Khaledi Darvishan, A. Ecological-Economic (Eco-Eco) Modelling in the River Basins of Mountainous Regions: Impact of Land Cover Changes on Sediment Yield in the Velicka Rijeka, Montenegro. Not. Bot. Horti Agrobot. Cluj-Napoca 2017, 45, 602–610. [Google Scholar] [CrossRef]
- Tazioli, A. Evaluation of erosion in equipped basins: Preliminary results of a comparison between the Gavrilovic model and direct measurements of sediment transport. Environ. Geol. 2009, 56, 825–831. [Google Scholar] [CrossRef]
- Rodriguez-Lloveras, X.; Bussi, G.; Francés, F.; Rodriguez-Caballero, E.; Solé-Benet, A.; Calle, M.; Benito, G. Patterns of runoff and sediment production in response to land-use changes in an ungauged Mediterranean catchment. J. Hydrol. 2015, 531, 1054–1066. [Google Scholar] [CrossRef]
- Djuma, H.; Bruggeman, A.; Camera, C.; Zoumides, C. Combining qualitative and quantitative methods for soil erosion assessments: An application in a sloping Mediterranean watershed, Cyprus. Land Degrad. Dev. 2017, 28, 243–254. [Google Scholar] [CrossRef]
- Camera, C.; Bruggeman, A.; Hadjinicolaou, P.; Michaelides, S.; Lange, M.A. Evaluation of a spatial rainfall generator for generating high resolution precipitation projections over orographically complex terrain. Stoch. Environ. Res. Risk A 2016, 31, 757–773. [Google Scholar] [CrossRef]
- Boronina, A.; Renard, P.; Balderer, W.; Christodoulides, A. Groundwater resources in the Kouris catchment (Cyprus): Data analysis and numerical modelling. J. Hydrol. 2003, 271, 130–149. [Google Scholar] [CrossRef]
- Mederer, J. Water Resources and Dynamics of the Troodos Igneous Aquifer-System, Cyprus—Balanced Groundwater Modelling. Ph.D. Thesis, Julius-Maximilians University of Würzburg, Würzburg, Germany, July 2009. [Google Scholar]
- Zoumides, C.; Bruggeman, A.; Giannakis, E.; Camera, C.; Djuma, H.; Eliades, M.; Charalambous, K. Community-based rehabilitation of mountain terraces in Cyprus. Land Degrad. Dev. 2017, 28, 95–105. [Google Scholar] [CrossRef]
- Cyprus Geological Survey Department. Hydrogeological Map of Cyprus; Cyprus Geological Survey Department: Nicosia, Cyprus, 1970.
- United Nations Development Program. Survey of Groundwater and Mineral Resources: Cyprus; United Nations: New York, NY, USA, 1970; p. 231. [Google Scholar]
- Karydas, C.G.; Tzoraki, O.; Panagos, P. A new spatiotemporal risk index for heavy metals: Application in Cyprus. Water 2015, 7, 4323–4342. [Google Scholar] [CrossRef]
- Water Development Department. Provision of Consultancy Services for the Implementation of Articles 11, 13 and 15 of the Water Framework Directive (2000/60/ec) in Cyprus—WDD 97/2007-Final Report on Water Policy, Annex VII; Ministry of Agriculture, Natural Resources and Environment, Water Development Department: Athens, Greece, 2011.
- OTT Electromagnetic Flowmeter Manual. Available online: http://www.ott.com/en-us/products/download/ott-mf-pro-operating-instructions/ (accessed on 17 October 2017).
- Harbeck, G.E. A Practical Field Technique for Measuring Reservoir Evaporation Utilizing Mass-Transfer Theory; USGS Professional Paper 272-E:101-105; US Geological Survey: Reston, VA, USA, 1962.
- De Bruin, H.A.R. A simple model for shallow lake evaporation. J. Appl. Meteorol. 1978, 17, 1132–1134. [Google Scholar] [CrossRef]
- Holtslag, A.A.M.; Van Ulden, A.P. A simple scheme for daytime estimates of the surface fluxes from routine weather data. J. Clim. Appl. Meteorol. 1983, 22, 517–529. [Google Scholar] [CrossRef]
- Whitmore, G. Prediction limits for a univariate normal observation. Am. Stat. 1986, 40, 141–143. [Google Scholar]
- ISO. Measurement of Liquid Flow in Open Channels—Velocity-Area Methods; Standard ISO 748; International Organization for Standardization (ISO): Geneva, Switzerland, 1997. [Google Scholar]
- Tazioli, A. Experimental methods for river discharge measurements: Comparison among tracers and current meter. Hydrol. Sci. J. 2011, 56, 1314–1324. [Google Scholar] [CrossRef]
- Boning, C.W. Policy Statement on Stage Accuracy; Technical Memorandum No. 93-07; USGS, Office of Water: Washington, DC, USA, 1992.
- Stewart, R.B.; Rouse, W.R. A simple method for determining the evaporation from shallow lakes and ponds. Water Resour. Res. 1976, 12, 623–628. [Google Scholar] [CrossRef]
- Ivkovic, K.M. A top-down approach to characterise aquifer-river interaction processes. J. Hydrol. 2009, 365, 145–155. [Google Scholar] [CrossRef]
- Costa, A.C.; Bronstert, A.; De Araújo, J.C. A channel transmission losses model for different dryland rivers. Hydrol. Earth Syst. Sci. 2012, 16, 1111–1135. [Google Scholar] [CrossRef]
- Barthel, R.; Banzhaf, S. Groundwater and surface water interaction at the regional-scale—A review with focus on regional integrated models. Water Resour. Manag. 2016, 30, 1–32. [Google Scholar] [CrossRef]
- Dahan, O.; Shani, Y.; Enzel, Y.; Yechieli, Y.; Yakirevich, A. Direct measurements of floodwater infiltration into shallow alluvial aquifers. J. Hydrol. 2007, 344, 157–170. [Google Scholar] [CrossRef]
- Le Coz, M.; Bruggeman, A.; Camera, C.; Lange, M.A. Impact of precipitation variability on the performance of a rainfall–runoff model in Mediterranean mountain catchments. Hydrol. Sci. J. 2016, 61, 507–518. [Google Scholar] [CrossRef]
- Udluft, P.; Dünkeloh, A.; Mederer, J. Task 8: Groundwater Modelling on Selected Areas. In Re-Evaluation of Groundwater Resources of Cyprus for the Republic of Cyprus; Ministry of Agriculture, Natural Resources and Environment Geological Survey Department: Nicosia, Cyprus, 2004. Available online: http://www.hydrogeologie-wuerzburg.de/projects/grc_extended_abstract.pdf (accessed on 22 October 2017).
- Ali, M.; Sterk, G.; Seeger, M.; Boersema, M.; Peters, P. Effect of hydraulic parameters on sediment transport capacity in overland flow over erodible beds. Hydrol. Earth Syst. Sci. 2012, 16, 591–601. [Google Scholar] [CrossRef]
- Rovira, A.; Batalla, R.; Sala, M. Fluvial sediment budget of a Mediterranean river: The lower Tordera (Catalan Coastal Ranges, NE Spain). Catena 2005, 60, 19–42. [Google Scholar] [CrossRef]
- Rovira, A.; Batalla, R. Temporal distribution of suspended sediment transport in a Mediterranean basin: The Lower Tordera (NE SPAIN). Geomorphology 2006, 79, 58–71. [Google Scholar] [CrossRef]
- Vericat, D.; Batalla, R. Sediment transport from continuous monitoring in a perennial Mediterranean stream. Catena 2010, 82, 77–86. [Google Scholar] [CrossRef]
- Achite, M.; Ouillon, S. Recent changes in climate, hydrology and sediment load in the Wadi Abd, Algeria (1970–2010). Hydrol. Earth Syst. Sci. 2016, 20, 1355–1372. [Google Scholar] [CrossRef]
- Verstraeten, G.; Poesen, J. Estimating trap efficiency of small reservoirs and ponds: Methods and implications for the assessment of sediment yield. Prog. Phys. Geog. 2000, 24, 219–251. [Google Scholar] [CrossRef]


| Year | Precip. a (106 m3) | Transient Zone | Check Dam Zone | |||||||||
|---|---|---|---|---|---|---|---|---|---|---|---|---|
| Flow at PB (Observed) | Flow at AS (Modelled) | Flow at OB = Qin (Modelled) | Qr | Qe | Qout | |||||||
| (106 m3) | (106 m3) | (106 m3) | (106 m3) | (106 m3) | (106 m3) | |||||||
| B b | L-U b | B | L-U | B | L-U | B | L-U | B | L-U | |||
| 2011–2012 | 75.56 | 23.99 | 23.13 | 19.56–28.74 | 23.84 | 20.24–30.43 | 5.86 | 0.26–13.04 | 0.007 | 0.014–0.014 | 17.98 | 17.38–19.96 |
| 2012–2013 | 52.38 | 8.61 | 7.22 | 4.46–12.65 | 6.25 | 3.97–12.62 | 2.93 | 0.04–8.56 | 0.004 | 0.014–0.013 | 3.31 | 4.05–3.92 |
| 2013–2014 | 37.95 | 1.63 | 0.41 | 0.01–6.26 | 0.04 | 0.00–6.90 | 0.04 | 0.00–6.87 | 0.001 | 0.004–0.017 | 0.00 | 0.01–0.00 |
| 2014–2015 | 65.54 | 13.39 | 11.95 | 8.99–18.09 | 11.54 | 8.91–18.74 | 3.62 | 0.07–10.14 | 0.004 | 0.008–0.013 | 7.91 | 8.57–8.83 |
| Total | 231.43 | 47.62 | 42.72 | 33.03–65.73 | 41.66 | 33.13–68.69 | 12.44 | 0.37–38.61 | 0.02 | 0.004–0.06 | 29.21 | 30.00–32.71 |
© 2017 by the authors. Licensee MDPI, Basel, Switzerland. This article is an open access article distributed under the terms and conditions of the Creative Commons Attribution (CC BY) license (http://creativecommons.org/licenses/by/4.0/).
Share and Cite
Djuma, H.; Bruggeman, A.; Camera, C.; Eliades, M.; Kostarelos, K. The Impact of a Check Dam on Groundwater Recharge and Sedimentation in an Ephemeral Stream. Water 2017, 9, 813. https://doi.org/10.3390/w9100813
Djuma H, Bruggeman A, Camera C, Eliades M, Kostarelos K. The Impact of a Check Dam on Groundwater Recharge and Sedimentation in an Ephemeral Stream. Water. 2017; 9(10):813. https://doi.org/10.3390/w9100813
Chicago/Turabian StyleDjuma, Hakan, Adriana Bruggeman, Corrado Camera, Marinos Eliades, and Konstantinos Kostarelos. 2017. "The Impact of a Check Dam on Groundwater Recharge and Sedimentation in an Ephemeral Stream" Water 9, no. 10: 813. https://doi.org/10.3390/w9100813
APA StyleDjuma, H., Bruggeman, A., Camera, C., Eliades, M., & Kostarelos, K. (2017). The Impact of a Check Dam on Groundwater Recharge and Sedimentation in an Ephemeral Stream. Water, 9(10), 813. https://doi.org/10.3390/w9100813