Investigation of Geochemical Characteristics and Controlling Processes of Groundwater in a Typical Long-Term Reclaimed Water Use Area


Abstract
:1. Introduction
2. Materials and Methods
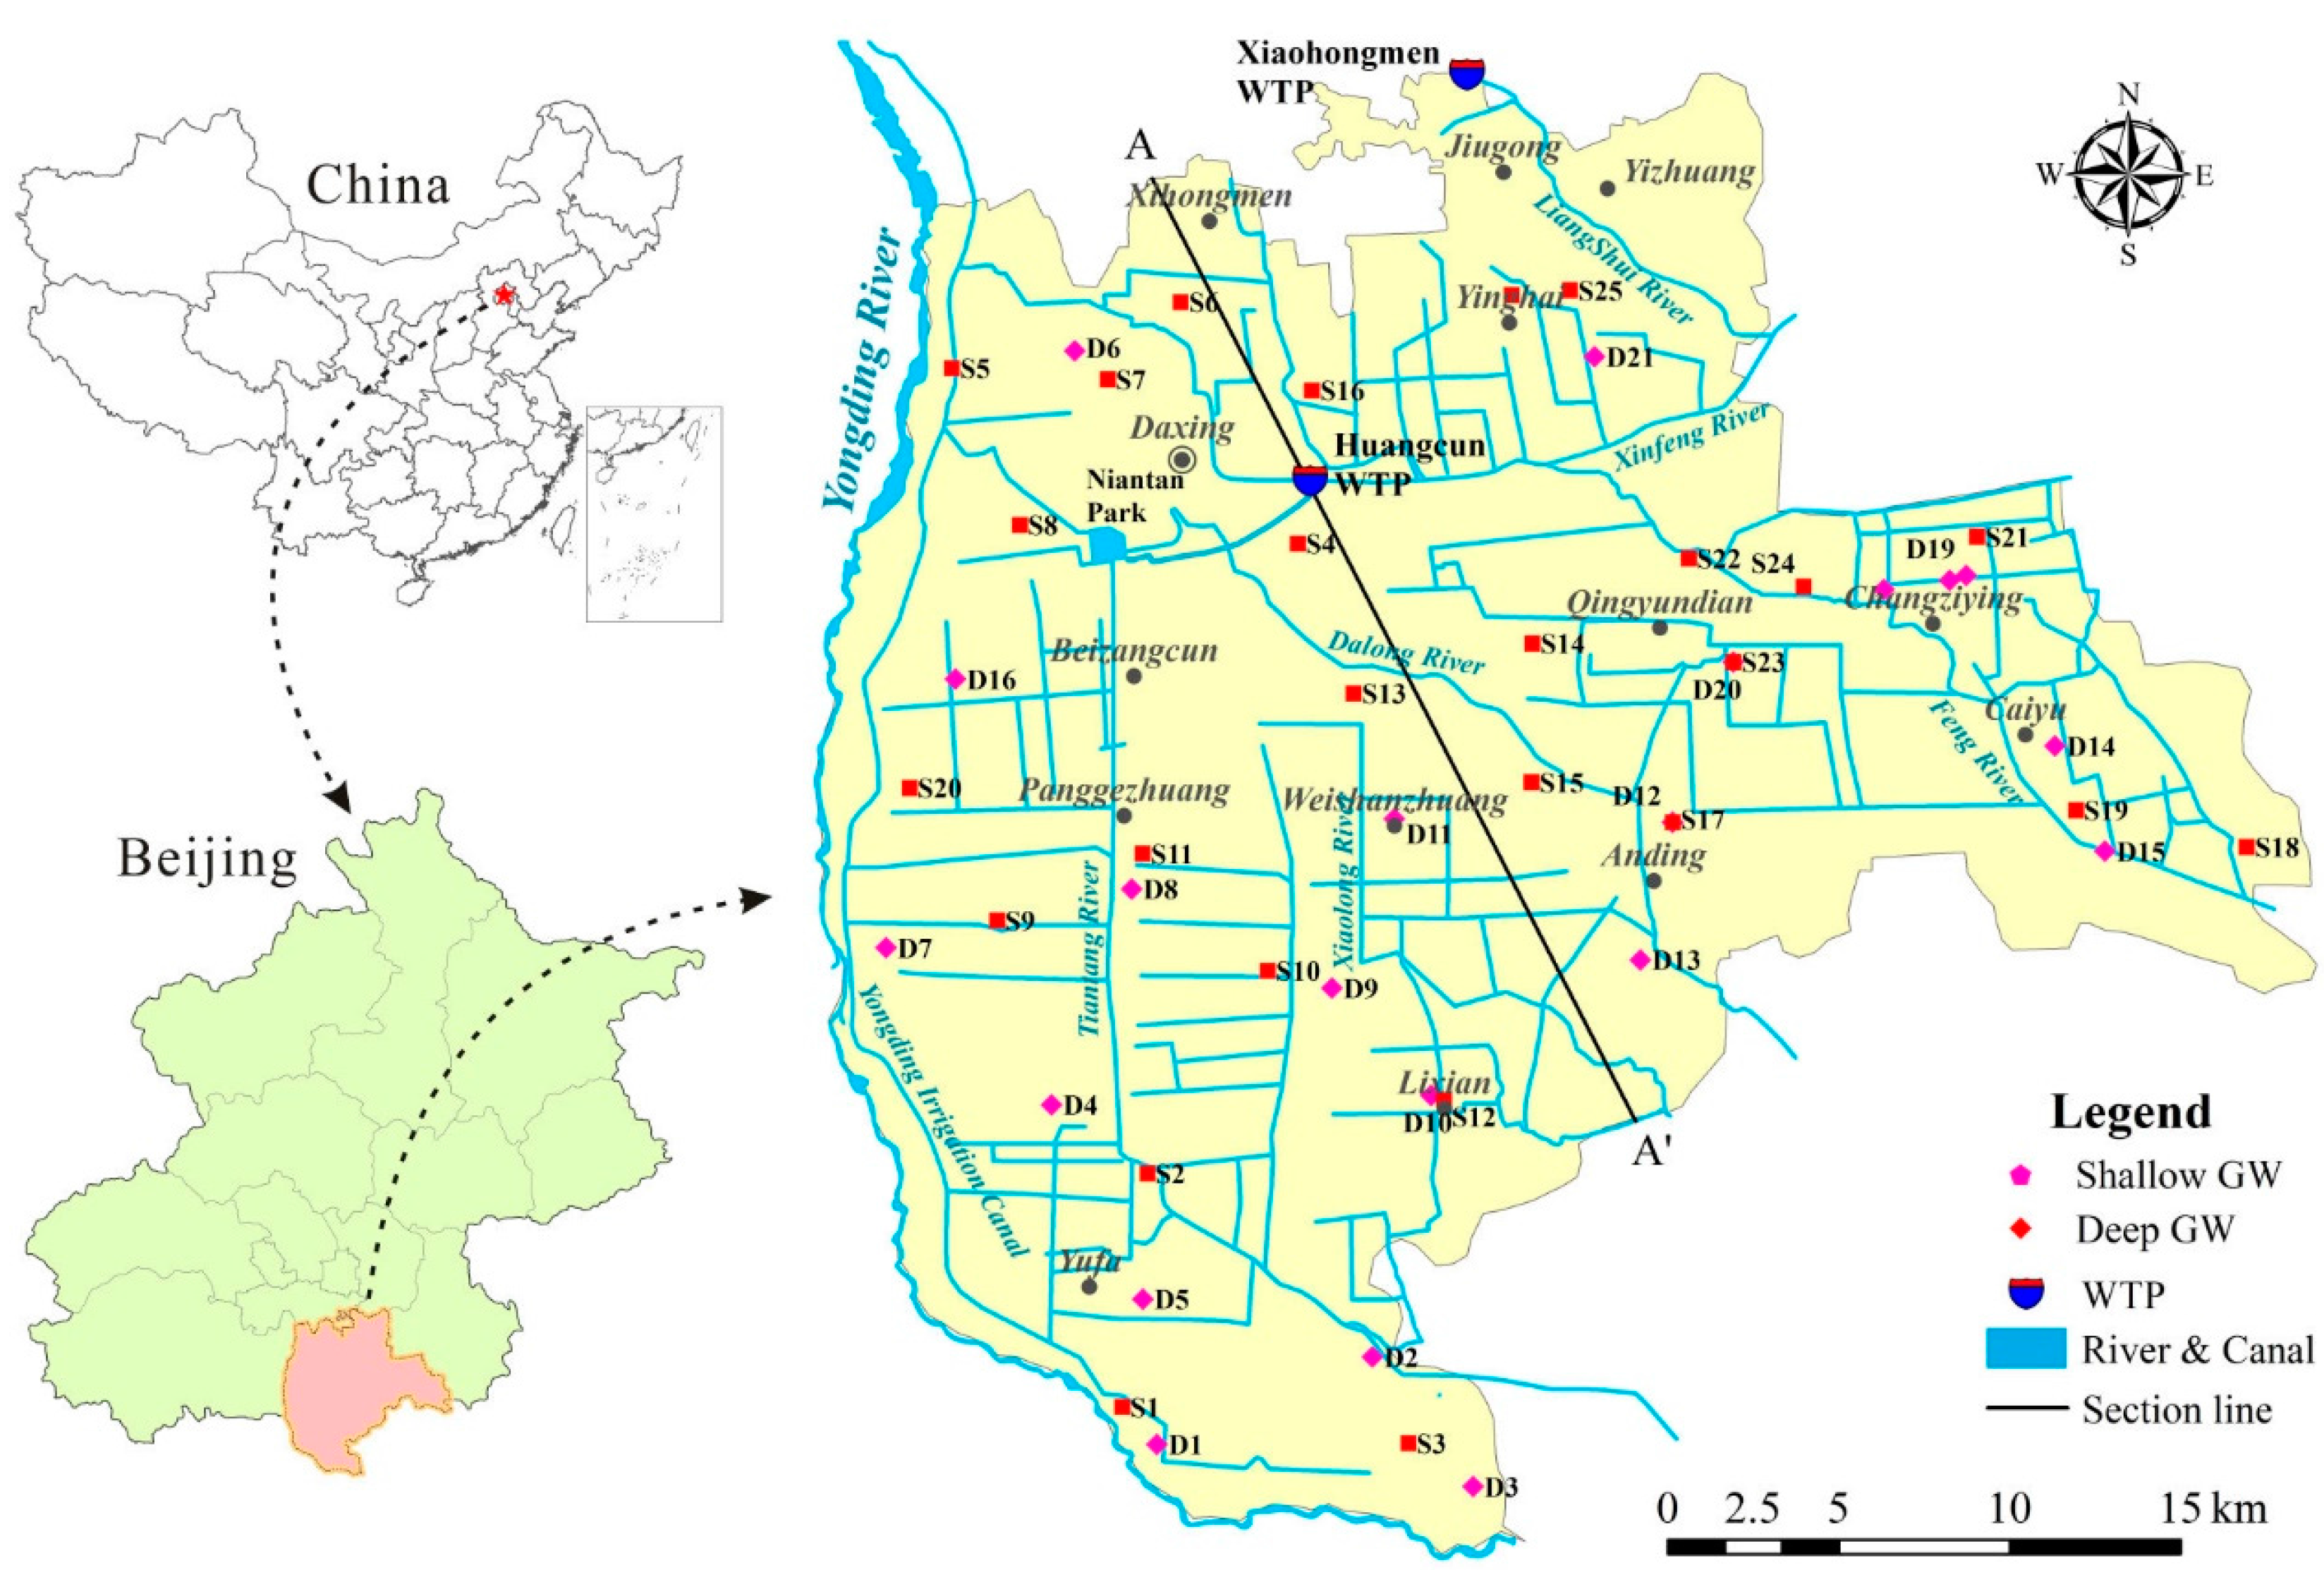
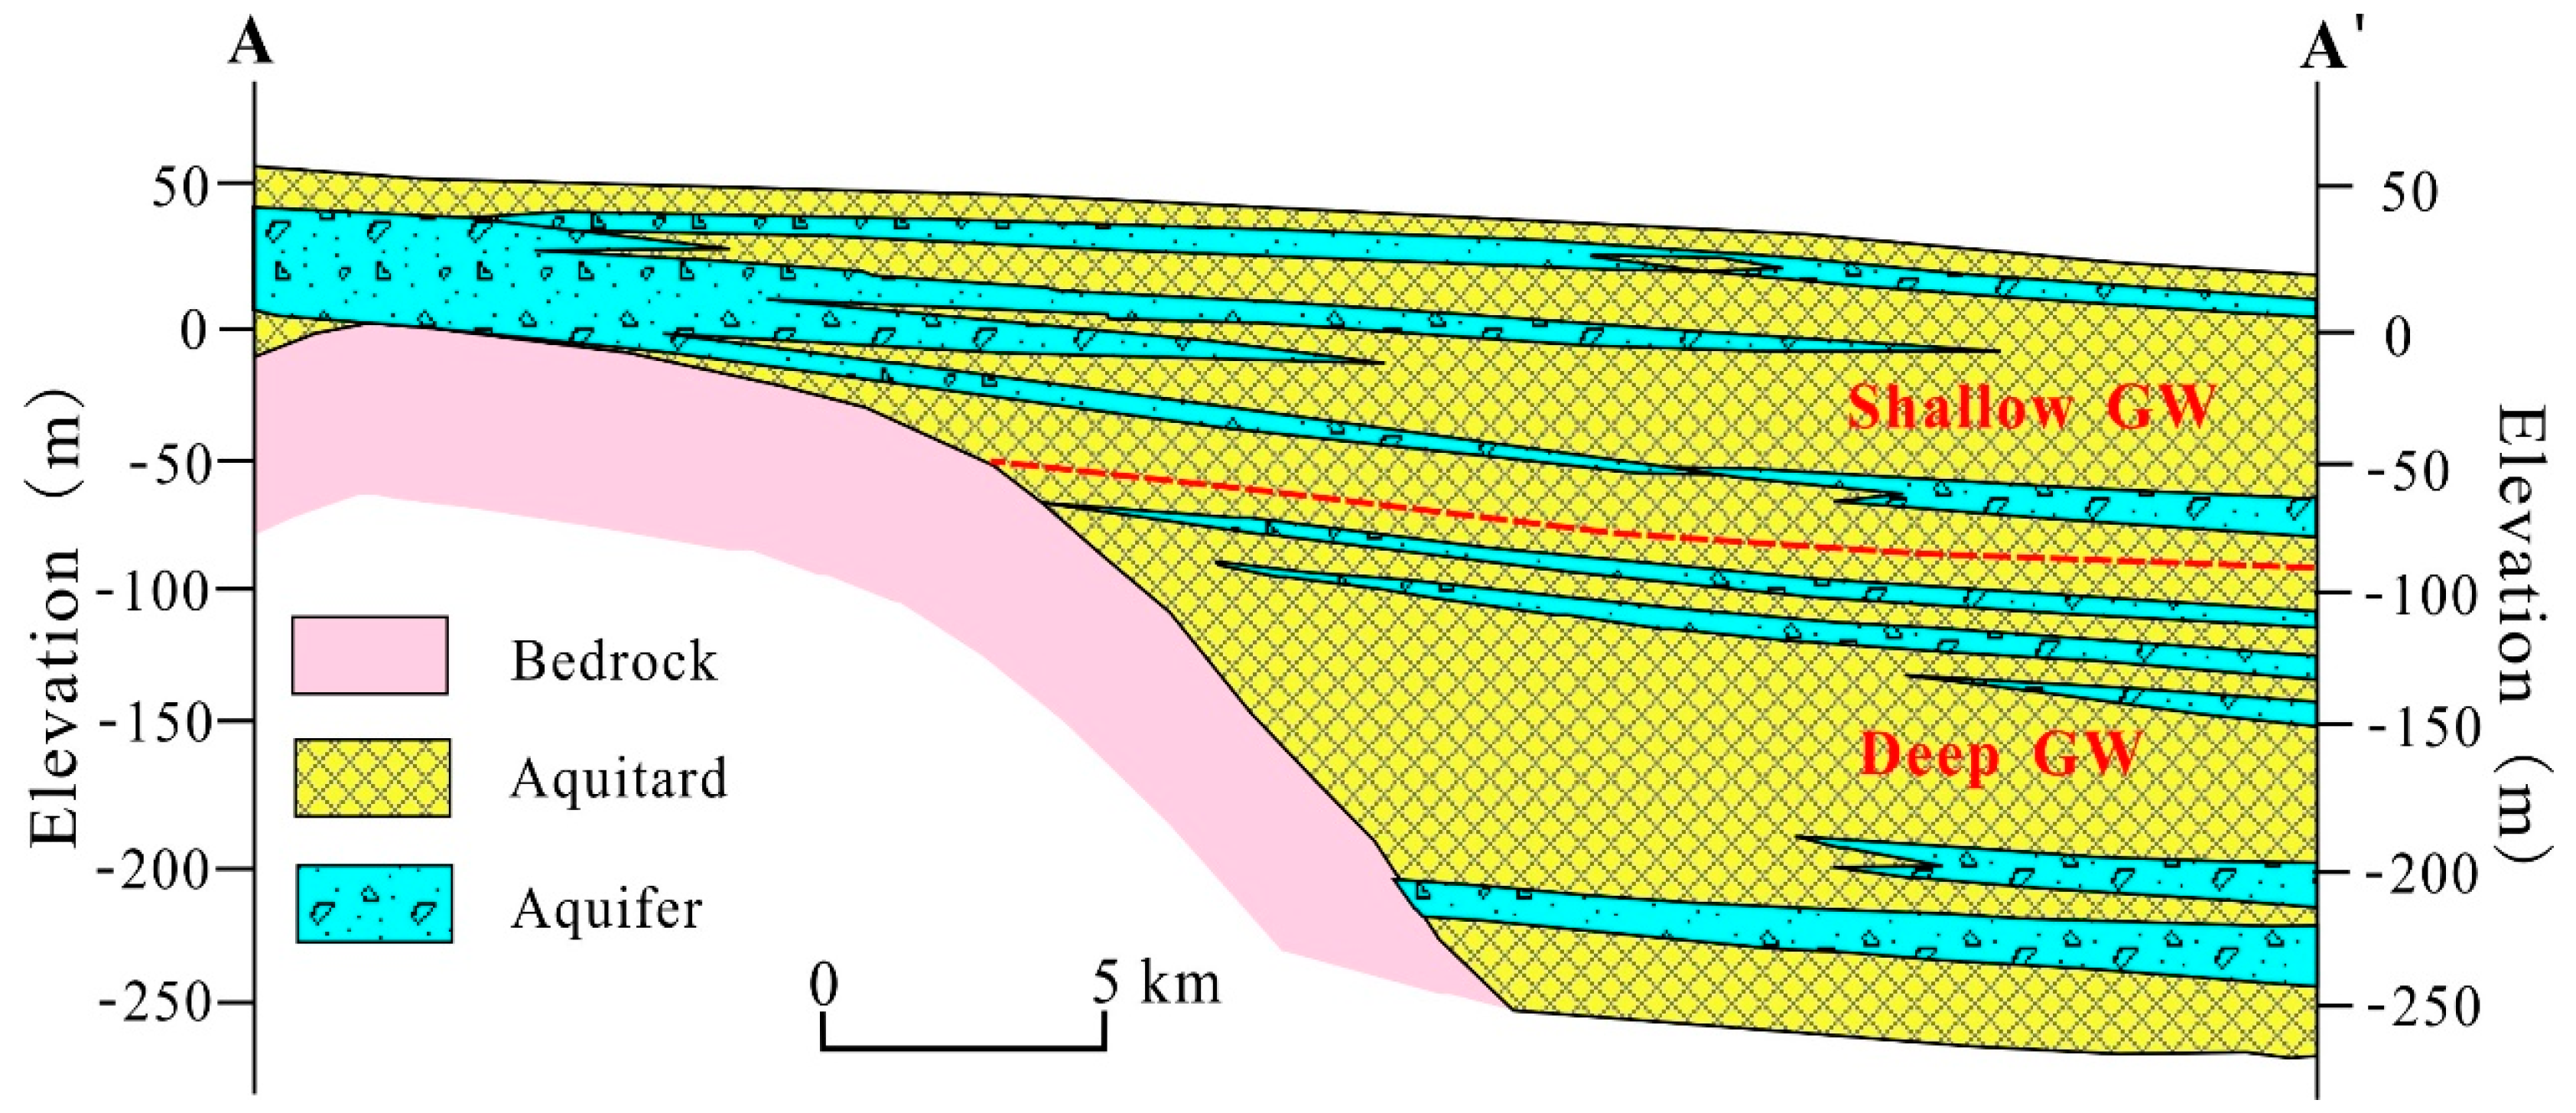
2.1. Description of the Study Area
2.2. Sample Collection and Analysis
3. Results and Discussion
3.1. Groundwater Chemistry
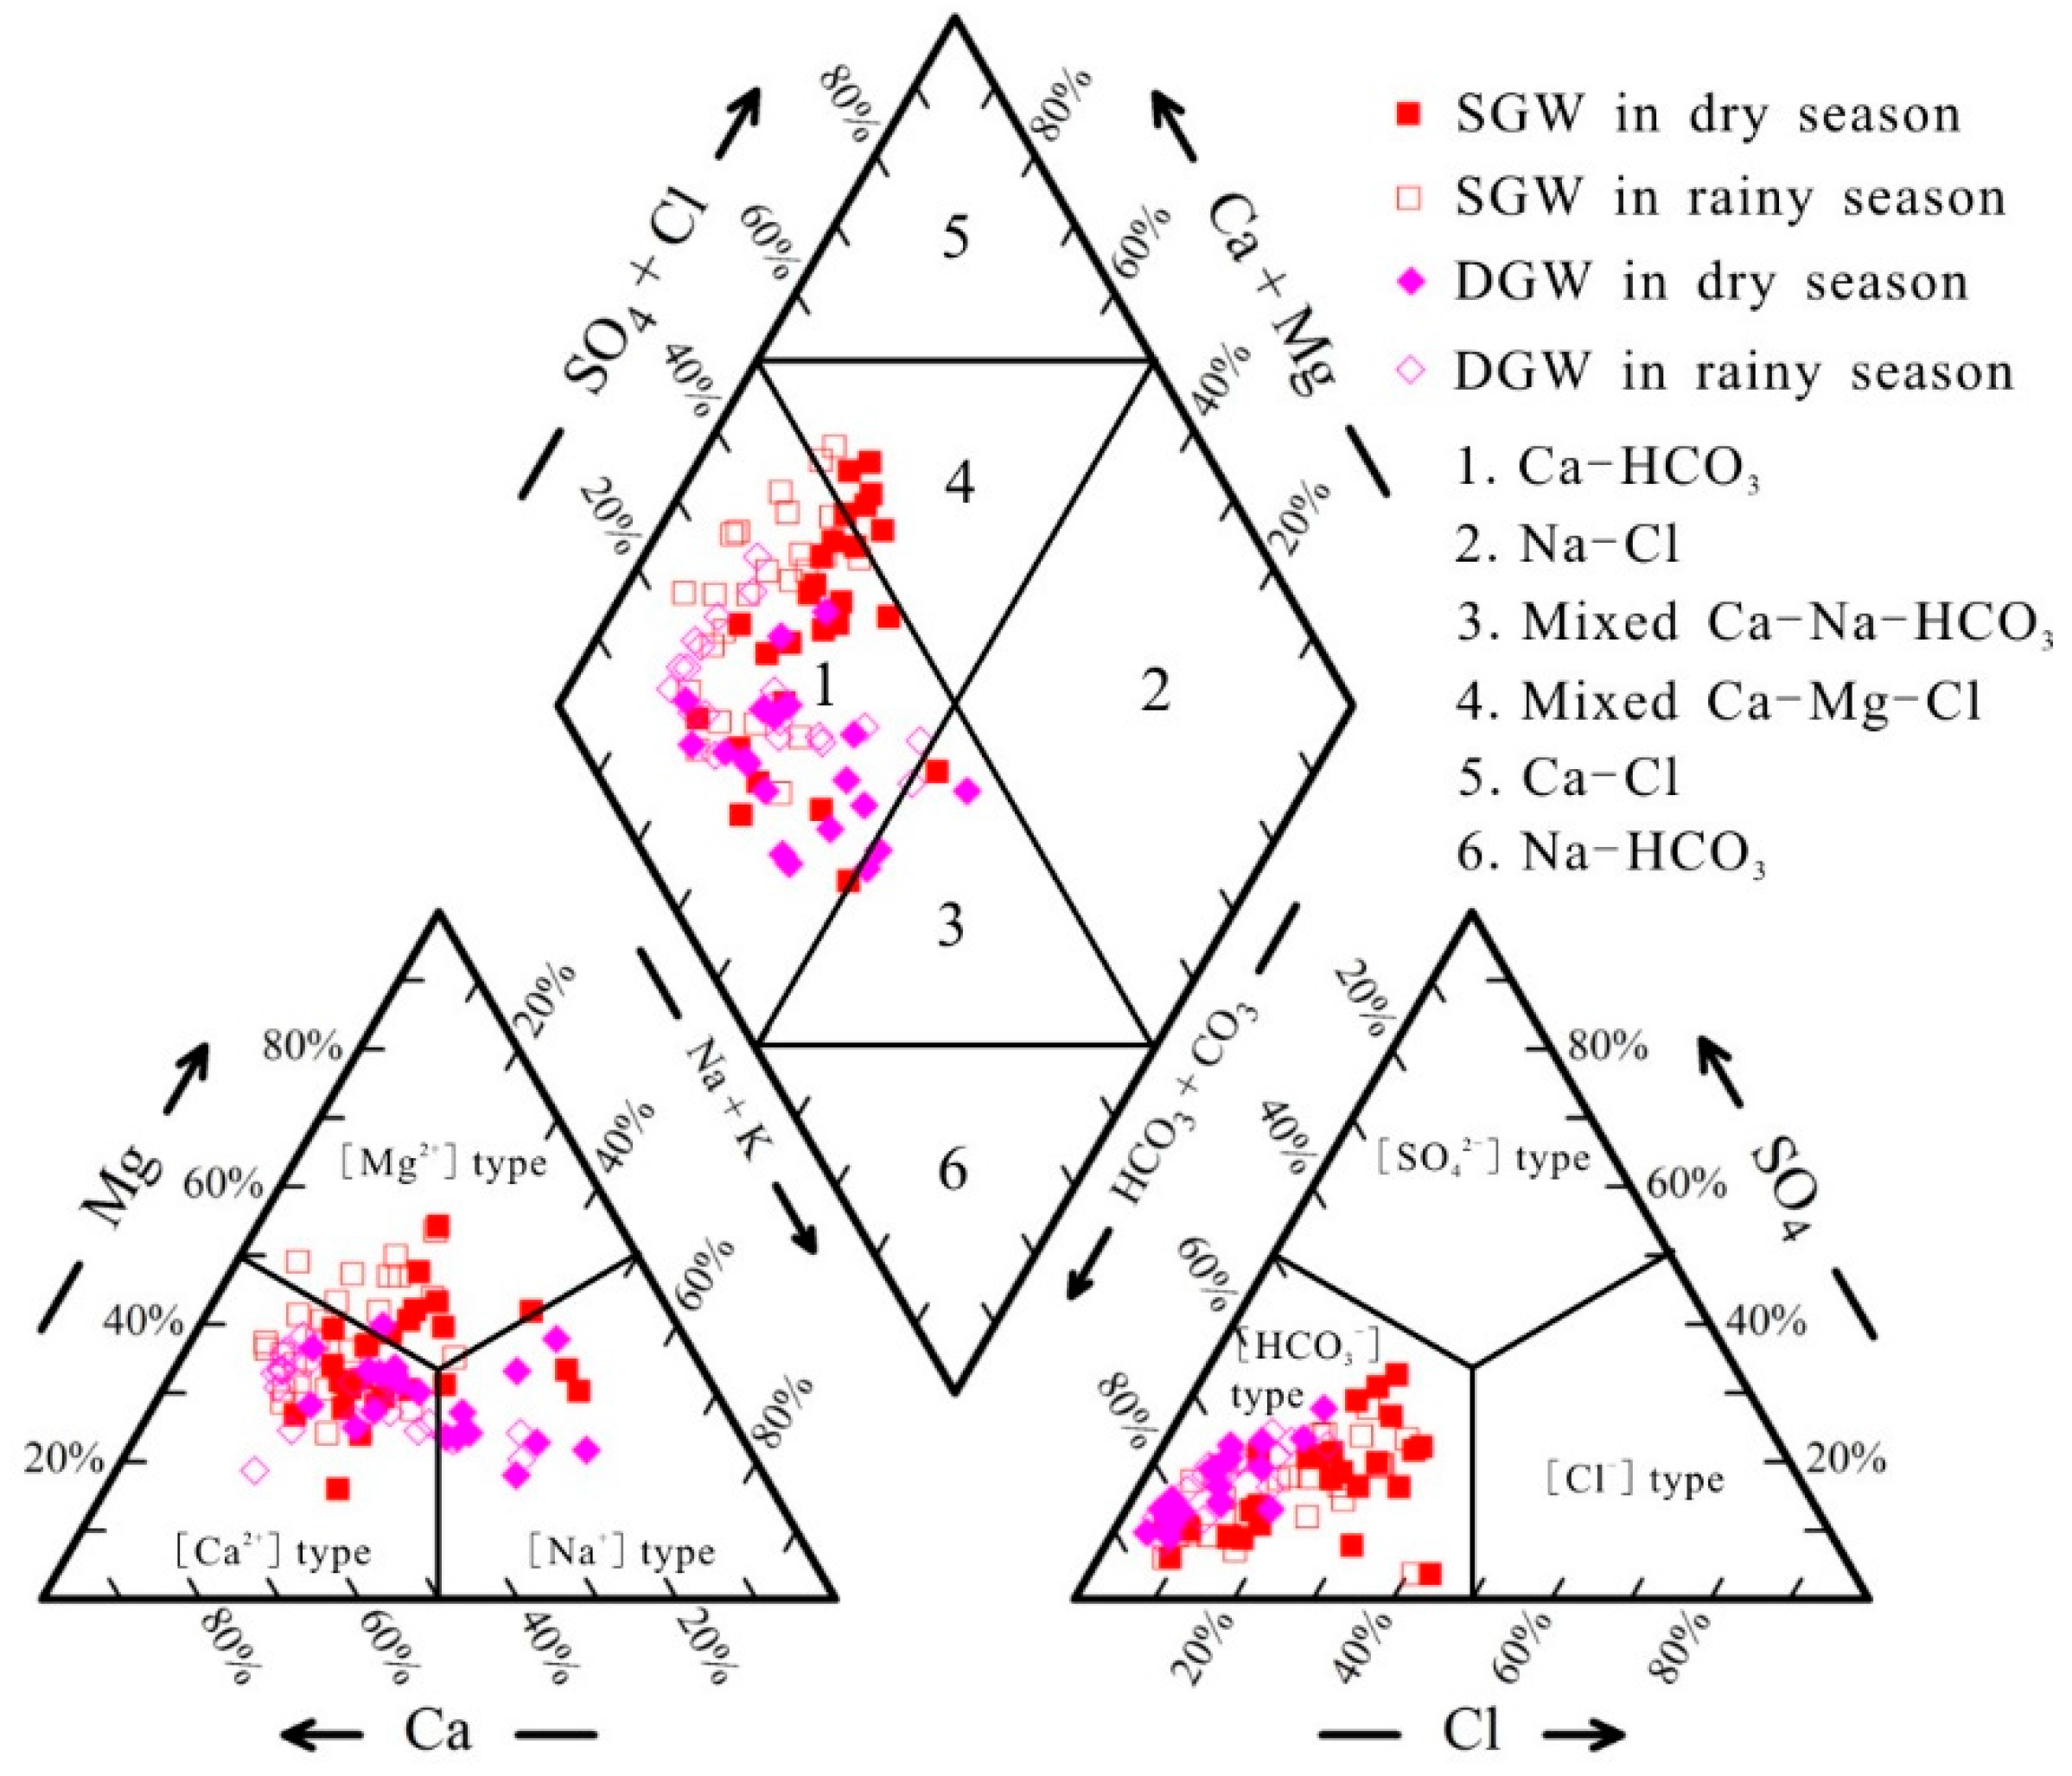
3.2. Hydrogeochemical Facies
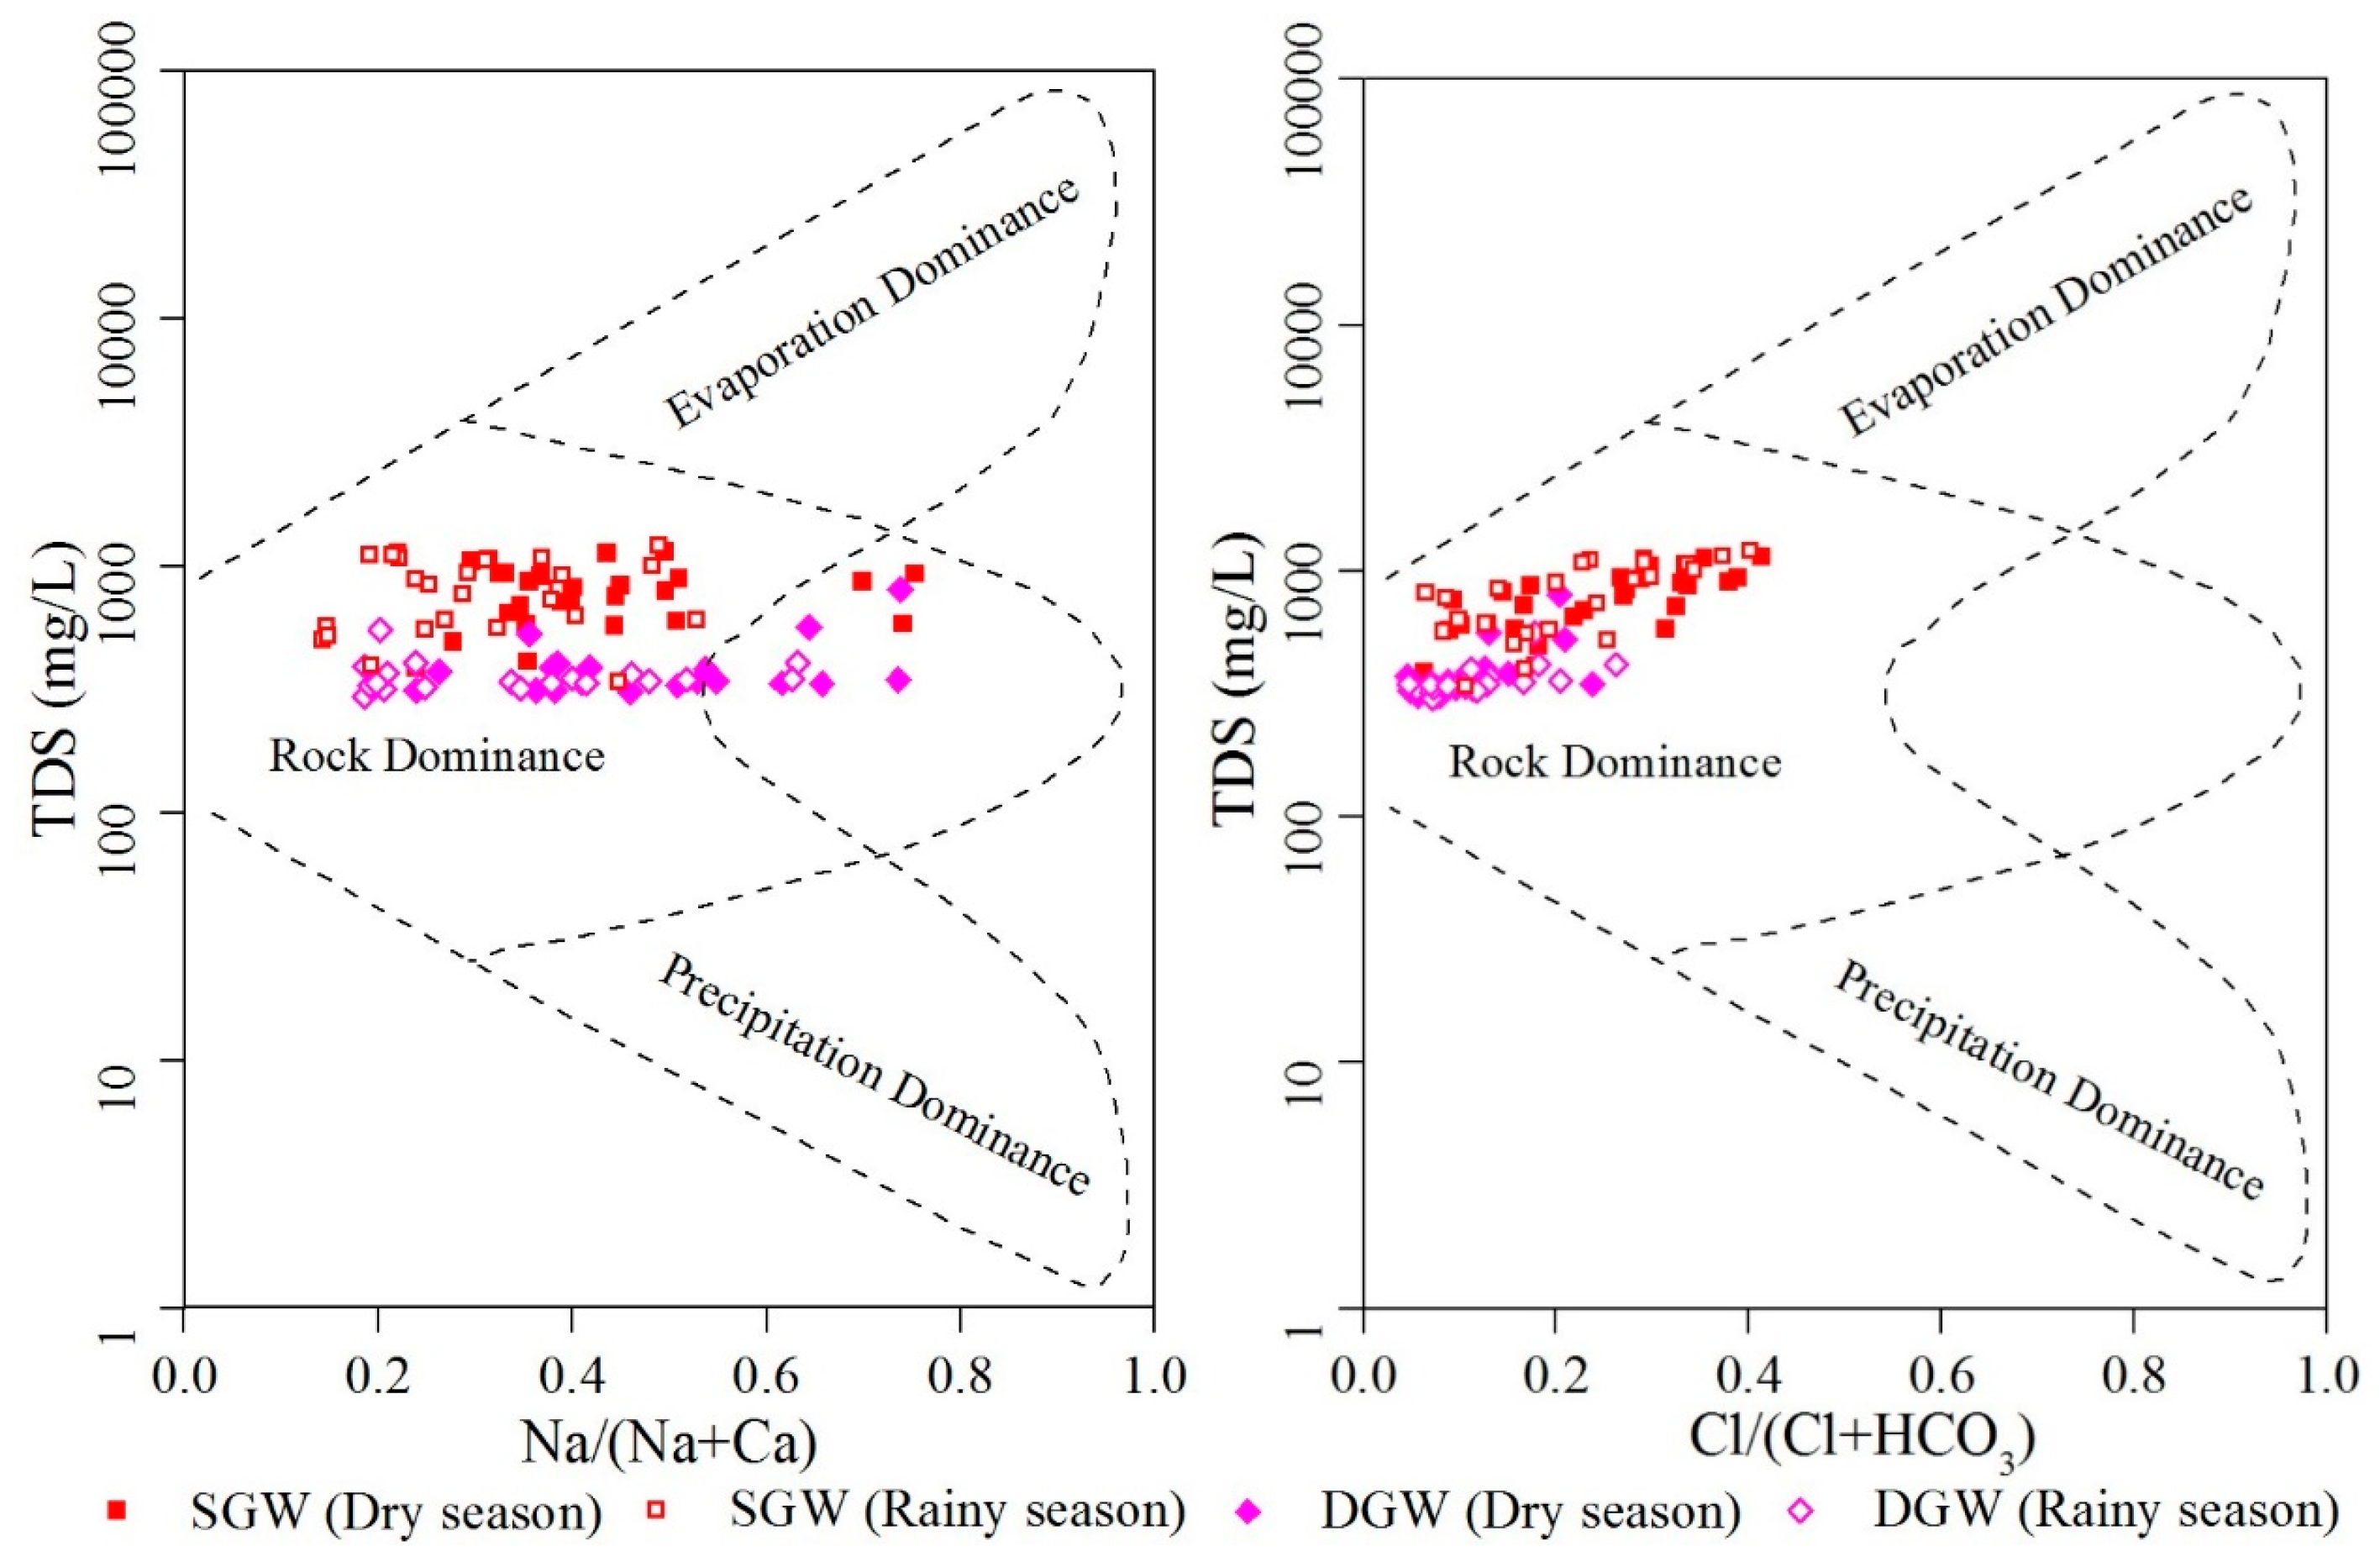
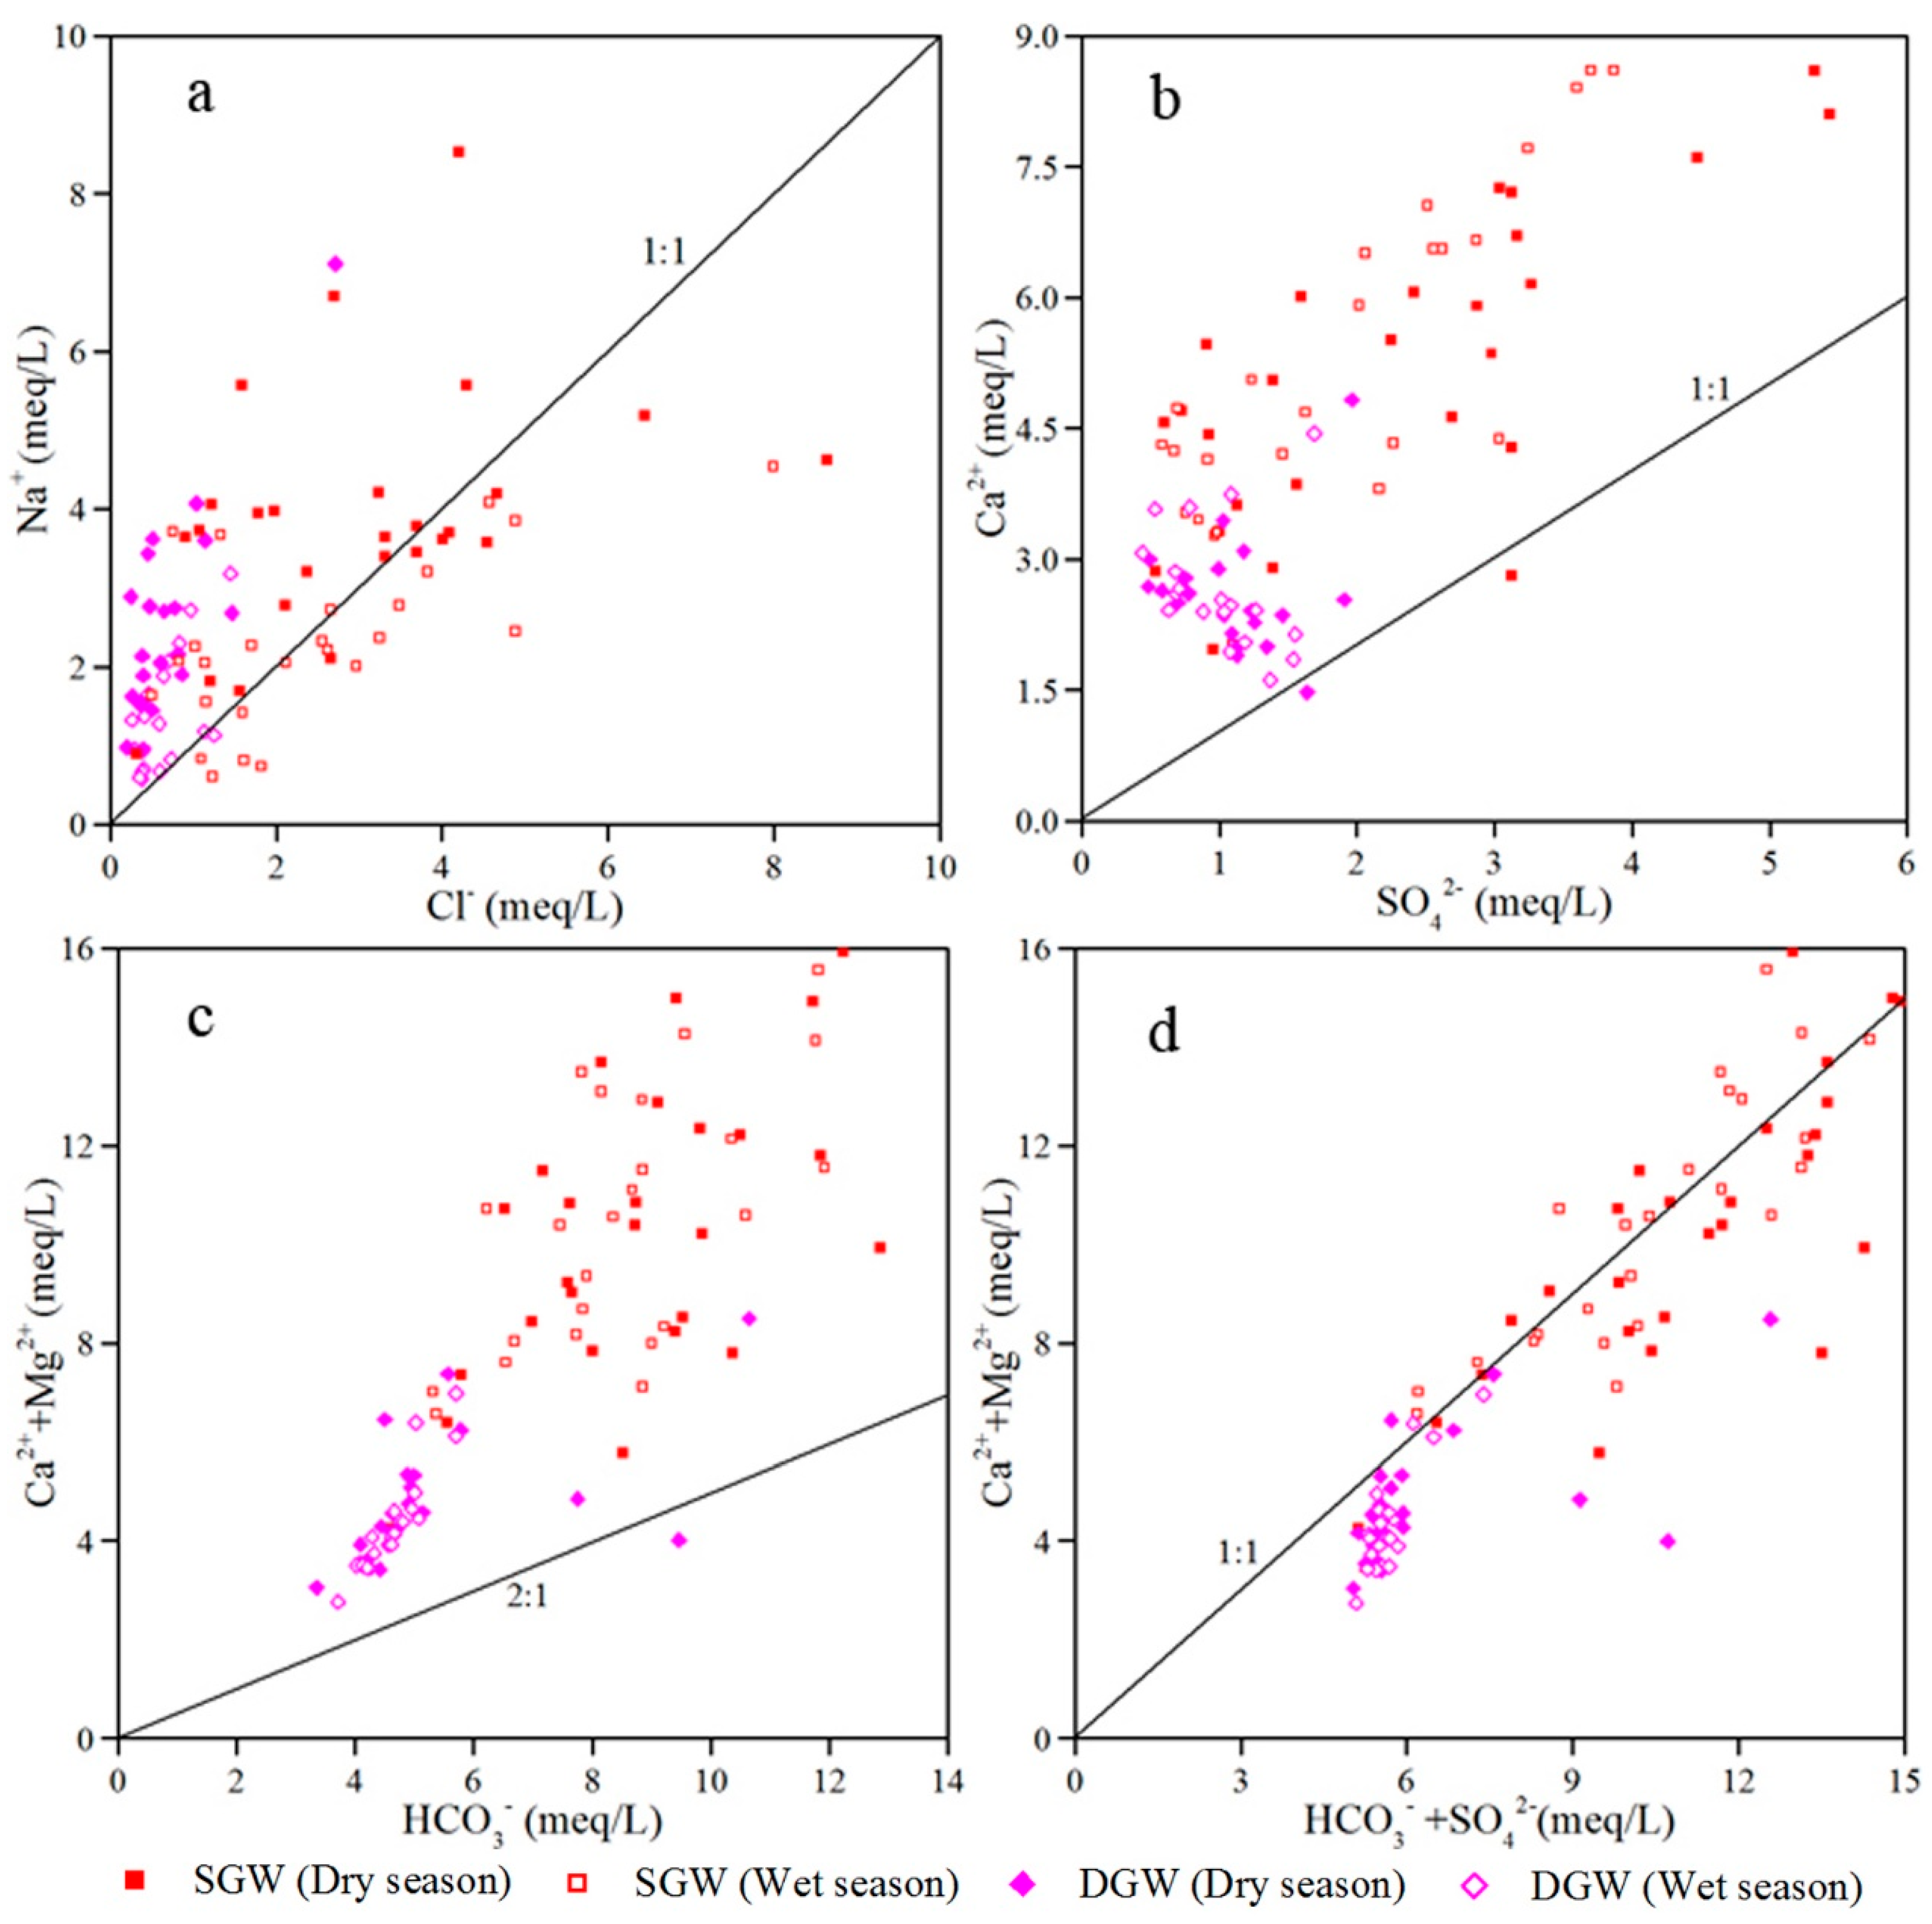
3.3. Mechanisms Controlling Groundwater Chemistry
3.3.1. Natural Factors
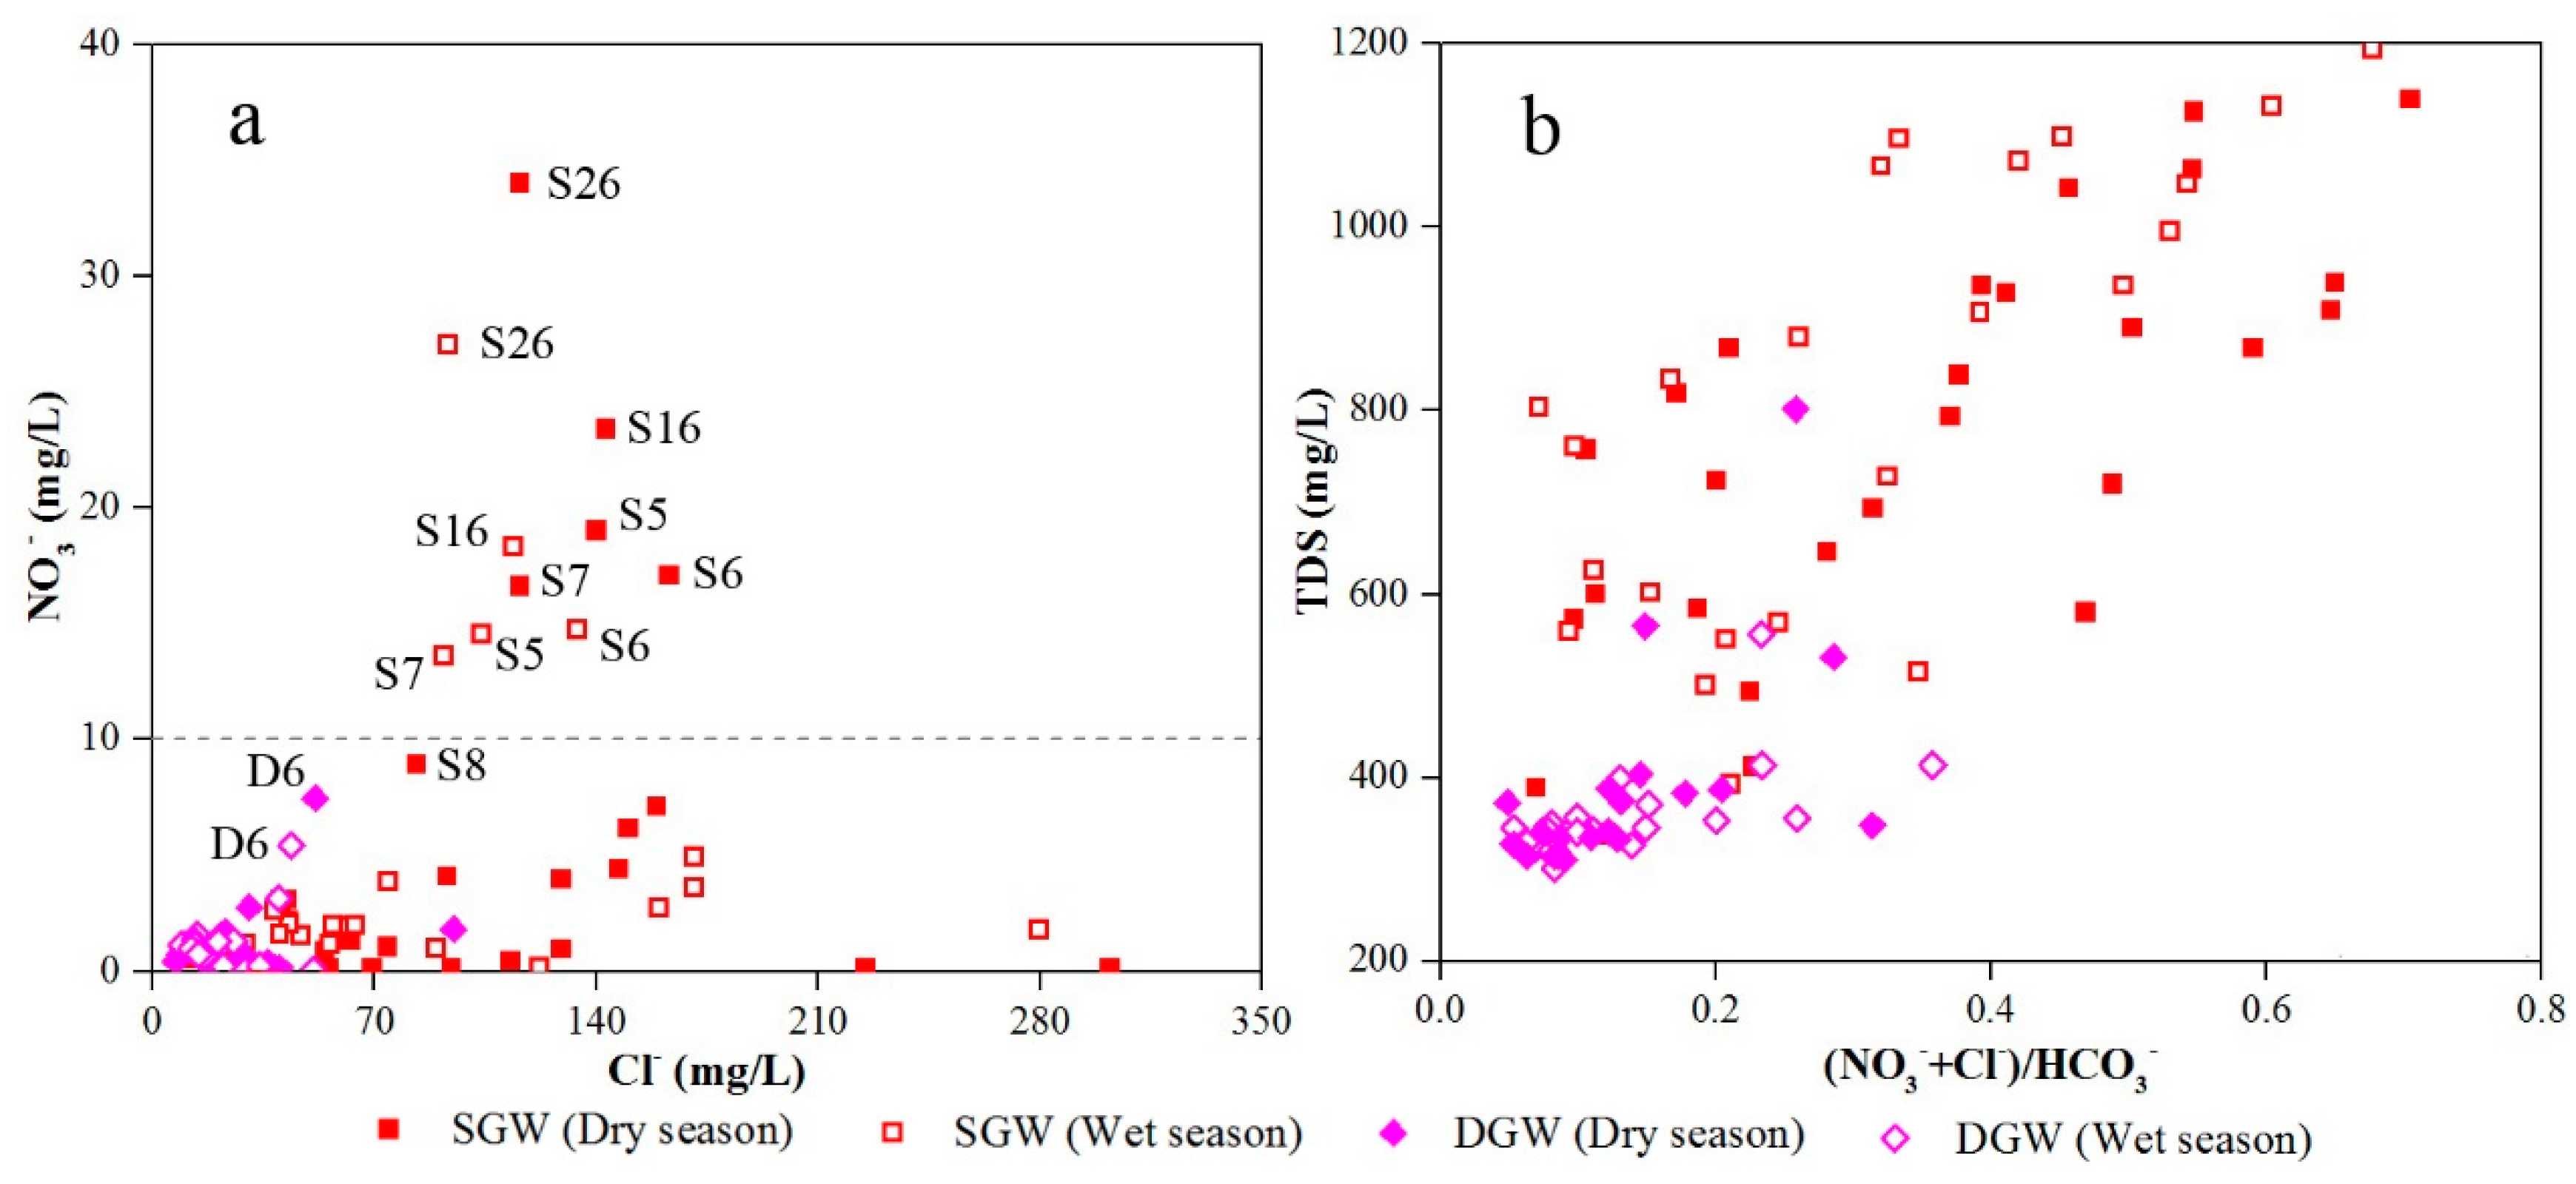
3.3.2. Human Activities
4. Conclusions
Acknowledgments
Author Contributions
Conflicts of Interest
References
- Elgallal, M.; Fletcher, L.; Evans, B. Assessment of potential risks associated with chemicals in wastewater used for irrigation in arid and semiarid zones: A review. Agric. Water Manag. 2016, 177, 419–431. [Google Scholar] [CrossRef]
- Lu, S.; Zhang, X.; Liang, P. Influence of drip irrigation by reclaimed water on the dynamic change of the nitrogen element in soil and tomato yield and quality. J. Clean. Prod. 2016, 139, 561–566. [Google Scholar] [CrossRef]
- Wang, L.; Dong, Y.; Xie, Y.; Song, F.; Wei, Y.; Zhang, J. Distinct groundwater recharge sources and geochemical evolution of two adjacent sub-basins in the lower shule river basin, northwest China. Hydrogeol. J. 2016, 24, 1967–1979. [Google Scholar] [CrossRef]
- Gu, X.; Xiao, Y.; Yin, S.; Shao, J.; Pan, X.; Niu, Y.; Huang, J. Groundwater level response to hydrogeological factors in a semi-arid basin of Beijing, China. J. Water Supply: Res. Technol. AQUA 2017, 66, 266–278. [Google Scholar] [CrossRef]
- Esmaeili-Vardanjani, M.; Rasa, I.; Amiri, V.; Yazdi, M.; Pazand, K. Evaluation of groundwater quality and assessment of scaling potential and corrosiveness of water samples in Kadkan aquifer, Khorasan-e-Razavi Province, Iran. Environ. Monit. Assess. 2015, 187, 53. [Google Scholar] [CrossRef] [PubMed]
- Xiao, Y.; Gu, X.; Yin, S.; Shao, J.; Cui, Y.; Zhang, Q.; Niu, Y. Geostatistical interpolation model selection based on ArcGIS and spatio-temporal variability analysis of groundwater level in piedmont plains, northwest China. SpringerPlus 2016, 5, 425. [Google Scholar] [CrossRef] [PubMed]
- Zhou, Y.; Xiao, W.; Wang, J.; Zhao, Y.; Huang, Y.; Tian, J.; Chen, Y. Evaluating spatiotemporal variation of groundwater depth/level in Beijing plain, a groundwater-fed area from 2001 to 2010. Adv. Meteorol. 2016, 2016, 8714209. [Google Scholar] [CrossRef]
- Akponikp, P.I.; Wima, K.; Yacouba, H.; Mermoud, A. Reuse of domestic wastewater treated in macrophyte ponds to irrigate tomato and eggplant in semi-arid West-Africa: Benefits and risks. Agric. Water Manag. 2011, 98, 834–840. [Google Scholar] [CrossRef]
- Yu, Y.; Song, X.; Zhang, Y.; Zheng, F.; Ji, L.; Liu, L. Identifying spatio-temporal variation and controlling factors of chemistry in groundwater and river water recharged by reclaimed water at Huai River, North China. Stoch. Environ. Res. Risk Assess. 2014, 28, 1135–1145. [Google Scholar] [CrossRef]
- Tunc, T.; Sahin, U. The changes in the physical and hydraulic properties of a loamy soil under irrigation with simpler-reclaimed wastewaters. Agric. Water Manag. 2015, 158, 213–224. [Google Scholar] [CrossRef]
- Al Kuisi, M.; Aljazzar, T.; Rüde, T.; Margane, A. Impact of the use of reclaimed water on the quality of groundwater resources in the Jordan Valley, Jordan. CLEAN Soil Air Water 2008, 36, 1001–1014. [Google Scholar] [CrossRef]
- Shang, F.; Ren, S.; Yang, P.; Li, C.; Xue, Y.; Huang, L. Modeling the risk of the salt for polluting groundwater irrigation with recycled water and ground water using HYDRUS-1 D. Water Air Soil Pollut. 2016, 227, 189. [Google Scholar] [CrossRef]
- Wu, W.; Yin, S.; Liu, H.; Niu, Y.; Bao, Z. The geostatistic-based spatial distribution variations of soil salts under long-term wastewater irrigation. Environ. Monit. Assess. 2014, 186, 6747–6756. [Google Scholar] [CrossRef] [PubMed]
- Yin, S.; Wu, W.; Liu, H.; Zhe, B. The impact of river infiltration on the chemistry of shallow groundwater in a reclaimed water irrigation area. J. Contam. Hydrol. 2016, 193, 1–9. [Google Scholar] [CrossRef] [PubMed]
- Yu, Y.; Song, X.; Zhang, Y.; Zheng, F.; Liang, J.; Han, D.; Ma, Y. Identification of key factors governing chemistry in groundwater near the water course recharged by reclaimed water at Miyun County, Northern China. J. Environ. Sci. 2013, 25, 1754–1763. [Google Scholar] [CrossRef]
- Rosenqvist, H.; Dawson, M. Economics of using wastewater irrigation of willow in Northern Ireland. Biomass Bioenergy 2005, 29, 83–92. [Google Scholar] [CrossRef]
- Bao, Z.; Wu, W.; Liu, H.; Chen, H.; Yin, S. Impact of long-term irrigation with sewage on heavy metals in soils, crops, and groundwater—A case study in Beijing. Pol. J. Environ. Stud. 2014, 23, 309–318. [Google Scholar]
- Adhikari, P.; Shukla, M.K.; Mexal, G.J. Spatial variability of hydraulic conductivity and sodium content of desert soils: Implications for management of irrigation using treated wastewater. Trans. ASABE 2012, 55, 1711–1721. [Google Scholar] [CrossRef]
- Goncharenko, A.M.; Garanovich, I.L. Impact of field application of treated wastewater on hydraulic properties of vertisols. Water Air Soil Pollut. 2007, 184, 347–353. [Google Scholar]
- Qadir, M.; Wichelns, D.; Raschid-Sally, L.; Mccornick, P.G.; Drechsel, P.; Bahri, A.; Minhas, P.S. The challenges of wastewater irrigation in developing countries. Agric. Water Manag. 2010, 97, 561–6568. [Google Scholar] [CrossRef]
- Kalavrouziotis, I.K.; Koukoulakis, P.H.; Papadopoulos, A.H.; Mehra, A. Heavy metal accumulation in brussels sprouts after irrigation with treated municipal waste water. J. Plant Interact. 2009, 4, 41–48. [Google Scholar] [CrossRef]
- Khan, S.; Cao, Q.; Zheng, Y.M.; Huang, Y.Z.; Zhu, Y.G. Health risks of heavy metals in contaminated soils and food crops irrigated with wastewater in Beijing, China. Environ. Pollut. 2008, 152, 686–692. [Google Scholar] [CrossRef] [PubMed]
- Xu, J.; Wu, L.S.; Chang, A.C.; Zhang, Y. Impact of long-term reclaimed wastewater irrigation on agricultural soils: A preliminary assessment. J. Hazard. Mater. 2010, 183, 780–786. [Google Scholar] [CrossRef] [PubMed]
- Wu, W. Research on Groundwater Vulnerability Experiment of Reclaimed Wastewater District and Irrigation Allocation. Ph.D. Thesis, China University of Geosciences (Beijing), Beijing, China, 2009. [Google Scholar]
- Bao, Z.; Wu, W.; Liu, H.; Yin, S.; Chen, H. Geostatistical analyses of spatial distribution and origin of soil nutrients in long-term wastewater-irrigated area in beijing, china. Acta Agric. Scand. Sect. B Soil Plant Sci. 2014, 64, 235–243. [Google Scholar] [CrossRef]
- Wang, S.; Wu, W.; Liu, F.; Yin, S.; Bao, Z.; Liu, H. Spatial distribution and migration of nonylphenol in groundwater following long-term wastewater irrigation. J. Contam. Hydrol. 2015, 177–178, 85–92. [Google Scholar] [CrossRef] [PubMed]
- Niu, Y.; Yin, S.; Liu, H.; Wu, W.; Li, B. Use of geostatistics to determine the spatial variation of groundwater quality: A case study in Beijing’s reclaimed water irrigation area. Pol. J. Environ. Stud. 2015, 24, 611–618. [Google Scholar]
- Zhang, X.; Sun, M.; Wang, N.; Huo, Z.; Huang, G. Risk assessment of shallow groundwater contamination under irrigation and fertilization conditions. Environ. Earth Sci. 2016, 75, 603. [Google Scholar] [CrossRef]
- Li, S.; Wang, X.; Zhou, J.; Tang, X.; Wang, Z. Distribution law of high fluoride groundwater in quaternary in daxing district of Beijing. Geoscience 2012, 26, 407–414. [Google Scholar]
- Huang, G.; Chen, Z.; Liu, F.; Sun, J.; Wang, J. Impact of human activity and natural processes on groundwater arsenic in an urbanized area (South China) using multivariate statistical techniques. Environ. Sci. Pollut. Res. 2014, 21, 13043–13054. [Google Scholar] [CrossRef] [PubMed]
- Alam, F. Evaluation of hydrogeochemical parameters of groundwater for suitability of domestic and irrigational purposes: A case study from central ganga plain, India. Arab. J. Geosci. 2014, 7, 4121–4131. [Google Scholar] [CrossRef]
- Li, P.; Wu, J.; Qian, H. Hydrochemical appraisal of groundwater quality for drinking and irrigation purposes and the major influencing factors: A case study in and around Hua County, China. Arab. J. Geosci. 2016, 9, 15. [Google Scholar] [CrossRef]
- Nematollahi, M.J.; Ebrahimi, P.; Razmara, M.; Ghasemi, A. Hydrogeochemical investigations and groundwater quality assessment of Torbat-Zaveh plain, Khorasan Razavi, Iran. Environ. Monit. Assess. 2016, 188, 2. [Google Scholar] [CrossRef] [PubMed]
- Saxena, V.K.; Singh, V.S.; Mondal, N.C.; Jain, S.C. Use of hydrochemical parameters for the identification of fresh groundwater resources, Potharlanka Island, India. Environ. Geol. 2003, 44, 516–521. [Google Scholar] [CrossRef]
- Zhai, Y.; Wang, J.; Zhang, Y.; Teng, Y.; Zuo, R.; Huan, H. Hydrochemical and isotopic investigation of atmospheric precipitation in Beijing, China. Sci. Total Environ. 2013, 456–457, 202–211. [Google Scholar] [CrossRef] [PubMed]
- Wagh, V.M.; Panaskar, D.B.; Varade, A.M.; Mukate, S.V.; Gaikwad, S.K.; Pawar, R.S.; Muley, A.A.; Aamalawar, M.L. Major ion chemistry and quality assessment of the groundwater resources of nanded tehsil, a part of Southeast Deccan Volcanic Province, Maharashtra, India. Environ. Earth Sci. 2016, 75, 1418. [Google Scholar] [CrossRef]
- Esmaeili, A.; Moore, F.; Keshavarzi, B. Nitrate contamination in irrigation groundwater, Isfahan, Iran. Environ. Earth Sci. 2014, 72, 2511–2522. [Google Scholar] [CrossRef]
- Karagüzel, R.; Irlayici, A. Groundwater pollution in the Isparta Plain, Turkey. Environ. Geol. 1998, 34, 303–308. [Google Scholar] [CrossRef]
- Piper, A. A graphic procedure in the geochemical interpretation of water analysis. Eos Trans. Am. Geophys. Union 1944, 25, 914–928. [Google Scholar] [CrossRef]
- Zhai, Y.; Lei, Y.; Zhou, J.; Li, M.; Wang, J.; Teng, Y. The spatial and seasonal variability of the groundwater chemistry and quality in the exploited aquifer in the Daxing District, Beijing, China. Environ. Monit. Assess. 2015, 187, 43. [Google Scholar] [CrossRef] [PubMed]
- Gibbs, R.J. Mechanisms controlling world water chemistry. Science 1970, 170, 1088–1090. [Google Scholar] [CrossRef] [PubMed]
- Xiao, Y.; Shao, J.; Cui, Y.; Zhang, G.; Zhang, Q. Groundwater circulation and hydrogeochemical evolution in Nomhon of Qaidam Basin, Northwest China. J. Earth Syst. Sci. 2017, 126, 26. [Google Scholar] [CrossRef]
- Kanagaraj, G.; Elango, L. Hydrogeochemical processes and impact of tanning industries on groundwater quality in Ambur, Vellore District, Tamil Nadu, India. Environ. Sci. Pollut. Res. Int. 2016, 23, 24364–24383. [Google Scholar] [CrossRef] [PubMed]
- Farid, I.; Zouari, K.; Rigane, A.; Beji, R. Origin of the groundwater salinity and geochemical processes in detrital and carbonate aquifers: Case of Chougafiya Basin (central Tunisia). J. Hydrol. 2015, 530, 508–532. [Google Scholar] [CrossRef]
- Li, P.; Zhang, Y.; Yang, N.; Jing, L.; Yu, P. Major ion chemistry and quality assessment of groundwater in and around a mountainous tourist town of China. Expo. Health 2016, 8, 239–252. [Google Scholar] [CrossRef]
- Schoeller, H. Qualitative evaluation of groundwater resources. In Methods and Techniques of Groundwater Investigations and Development; The United Nations Educational, Scientific and Cultural Organization (UNESCO): Paris, France, 1965; pp. 54–83. [Google Scholar]
- Abdesselem, K.; Azedine, H.; Lynda, C. Groundwater hydrochemistry and effects of anthropogenic pollution in Béchar city (SW Algeria). Desalin. Water Treat. 2015, 57, 14034–14043. [Google Scholar] [CrossRef]
- Patel, P.; Raju, N.J.; Reddy, B.C.S.R.; Suresh, U.; Gossel, W.; Wycisk, P. Geochemical processes and multivariate statistical analysis for the assessment of groundwater quality in the Swarnamukhi River Basin, Andhra Pradesh, India. Environ. Earth Sci. 2016, 75, 611. [Google Scholar] [CrossRef]
- Marghade, D.; Malpe, D.B.; Zade, A.B. Major ion chemistry of shallow groundwater of a fast growing city of central India. Environ. Monit. Assess. 2012, 184, 2405–2418. [Google Scholar] [CrossRef] [PubMed]


| Shallow GW | Dry Season | Rainy Season | ||||||||
| Min | Max | Mean | SD 1 | C.V. (%) 2 | Min | Max | Mean | SD 1 | C.V. (%) 2 | |
| T (°C) | 9.5 | 19.1 | 14.7 | 2.7 | 18.08 | 13.0 | 23.5 | 19.5 | 2.8 | 14.53 |
| pH | 7.10 | 7.60 | 7.30 | 0.15 | 2.10 | 7.10 | 7.90 | 7.40 | 0.17 | 2.34 |
| EC (μS/cm) | 585 | 1716 | 1175 | 279 | 23.76 | 547 | 1794 | 1174 | 311 | 26.46 |
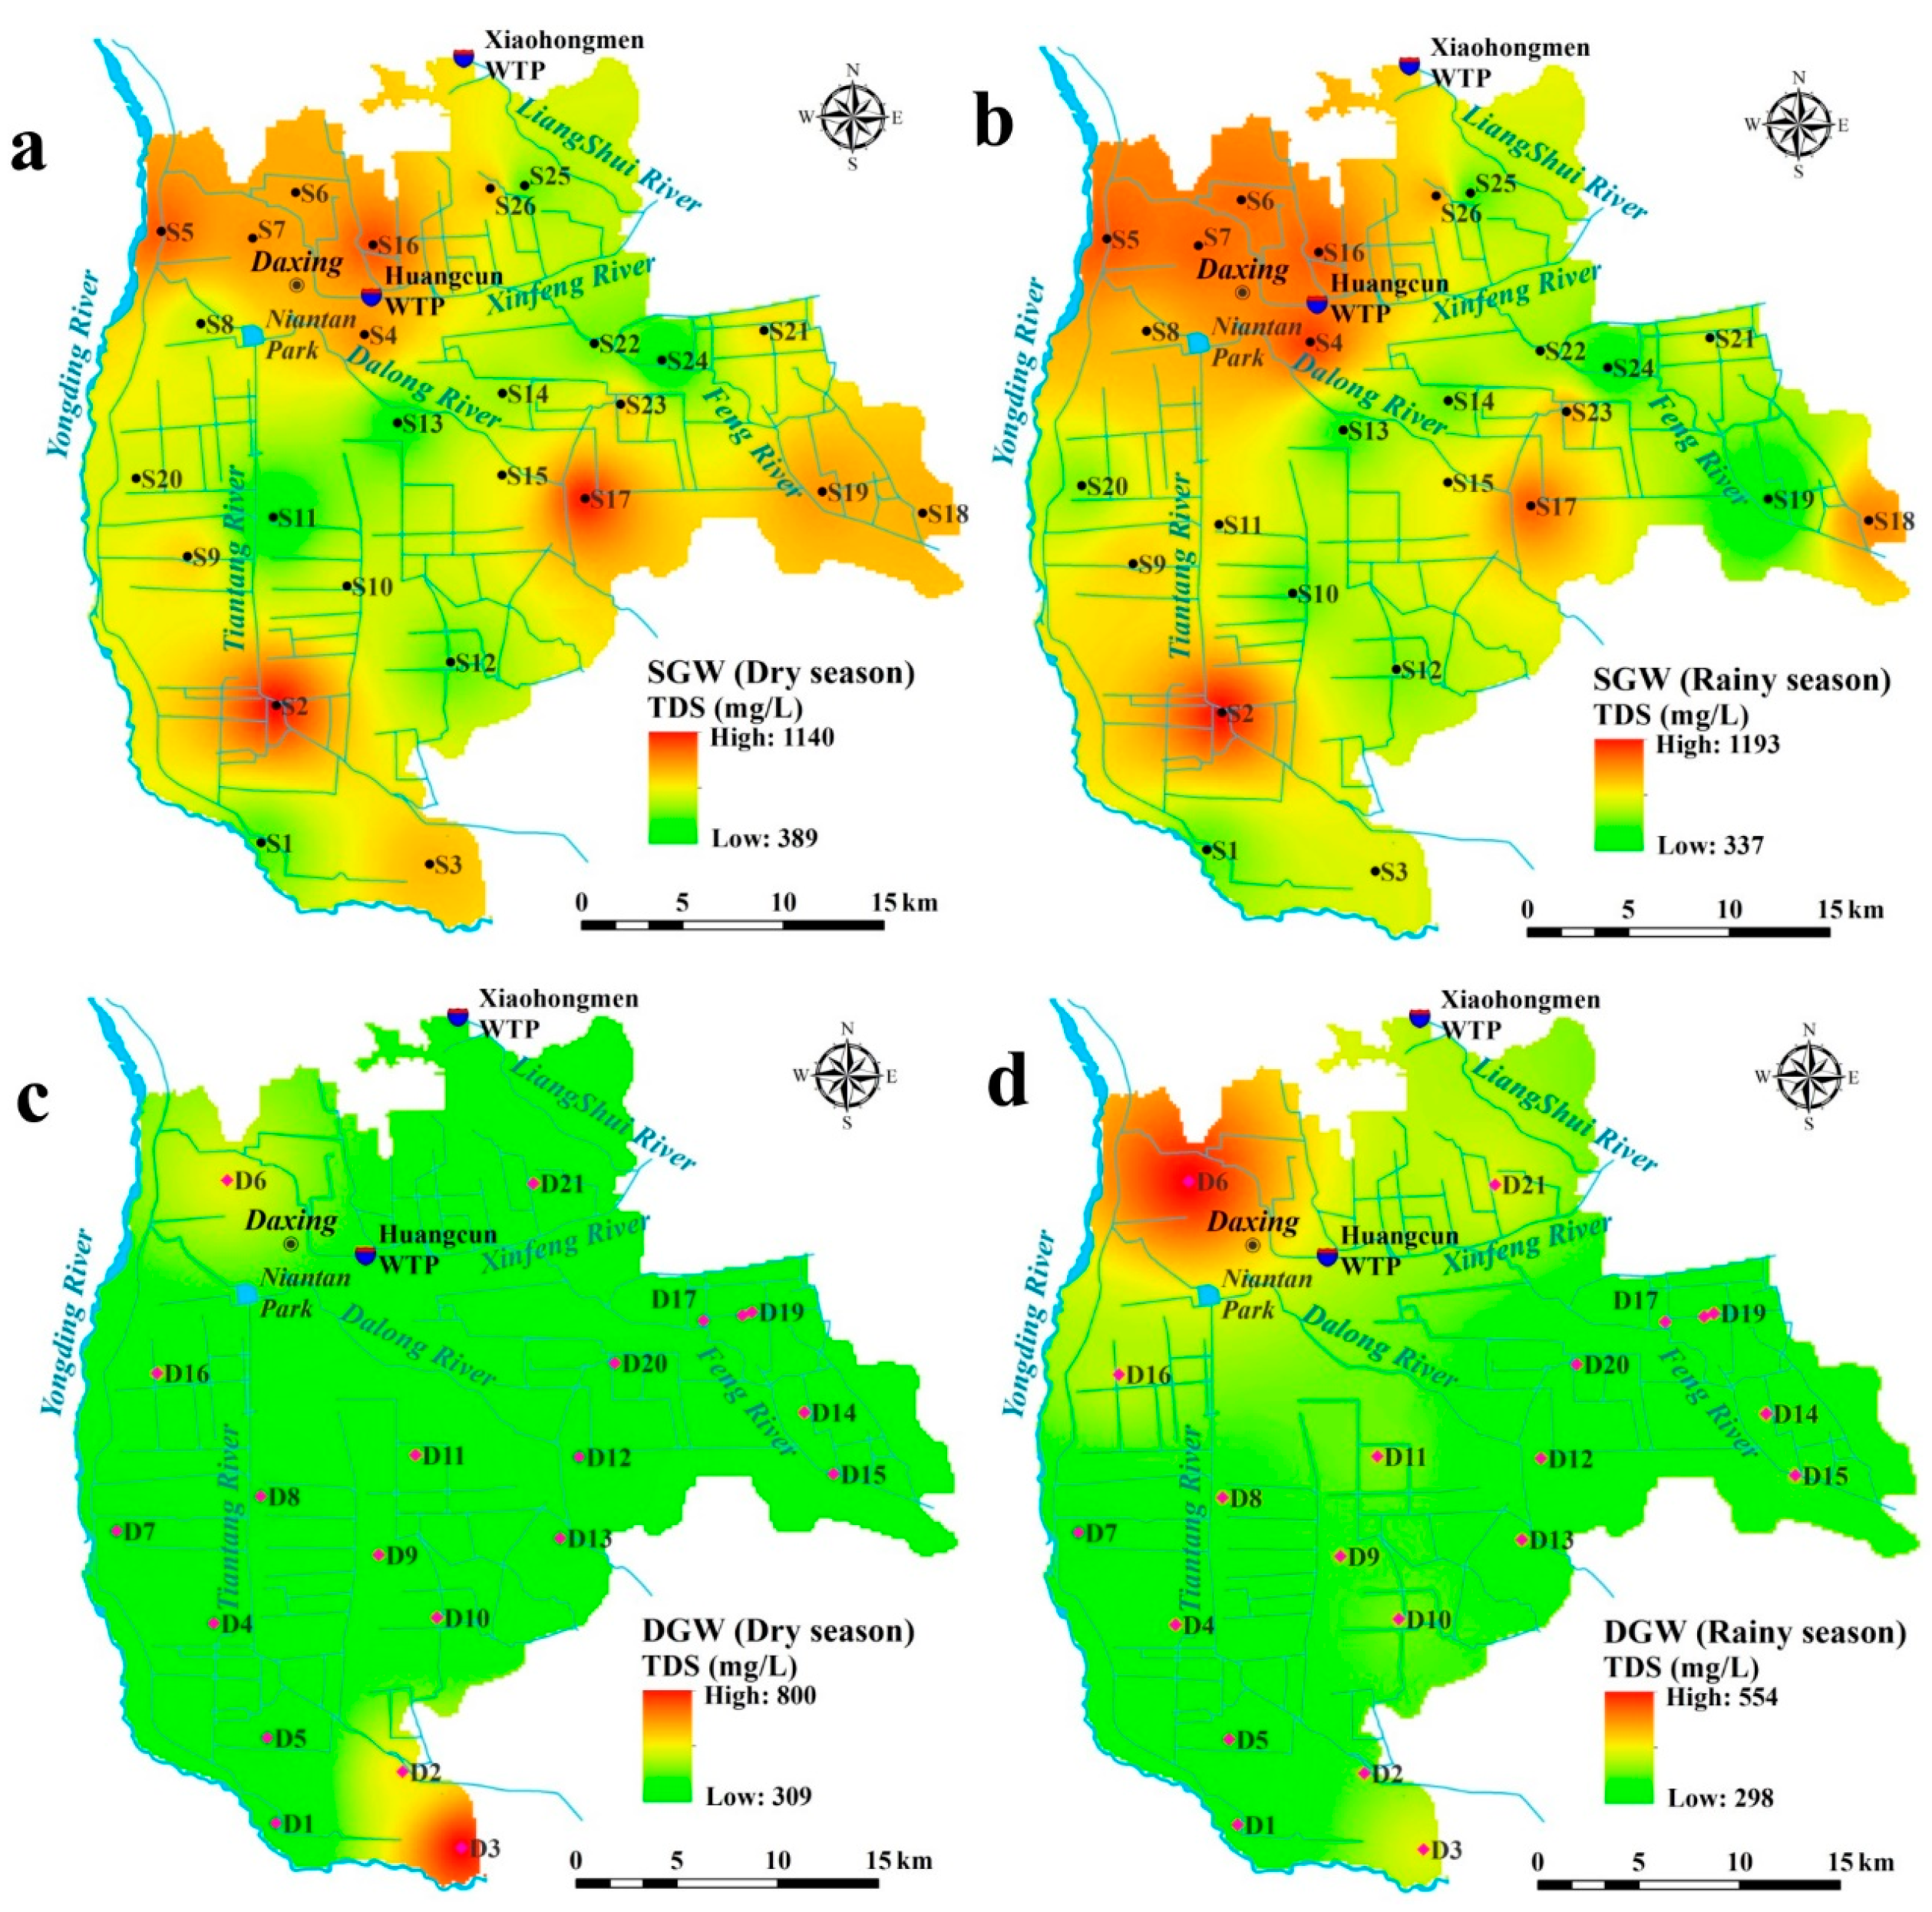
| TDS (mg/L) | 389 | 1140 | 782 | 208 | 26.54 | 337 | 1194 | 792 | 255 | 32.24 |
| K (mg/L) | 1.26 | 3.24 | 2.06 | 0.55 | 26.85 | 1.03 | 2.92 | 1.78 | 0.53 | 29.79 |
| Na (mg/L) | 20.4 | 196.0 | 89.7 | 36.0 | 40.19 | 13.6 | 104.0 | 53.2 | 24.6 | 46.13 |
| Ca (mg/L) | 38.9 | 172.0 | 103.6 | 35.1 | 33.85 | 40.1 | 172.0 | 105.5 | 37.0 | 35.07 |
| Mg (mg/L) | 16.9 | 135.0 | 60.7 | 25.3 | 41.68 | 17.0 | 130.0 | 58.5 | 22.7 | 38.79 |
| Cl (mg/L) | 11.0 | 302.0 | 107.1 | 64.4 | 60.10 | 17.6 | 280.0 | 86.4 | 61.0 | 70.59 |
| SO4 (mg/L) | 25.5 | 261.0 | 110.8 | 67.2 | 60.64 | 28.5 | 186.0 | 93.1 | 50.6 | 54.38 |
| HCO3 (mg/L) | 282.0 | 785.0 | 536.1 | 127.1 | 23.72 | 255.0 | 728.0 | 510.8 | 122.8 | 24.03 |
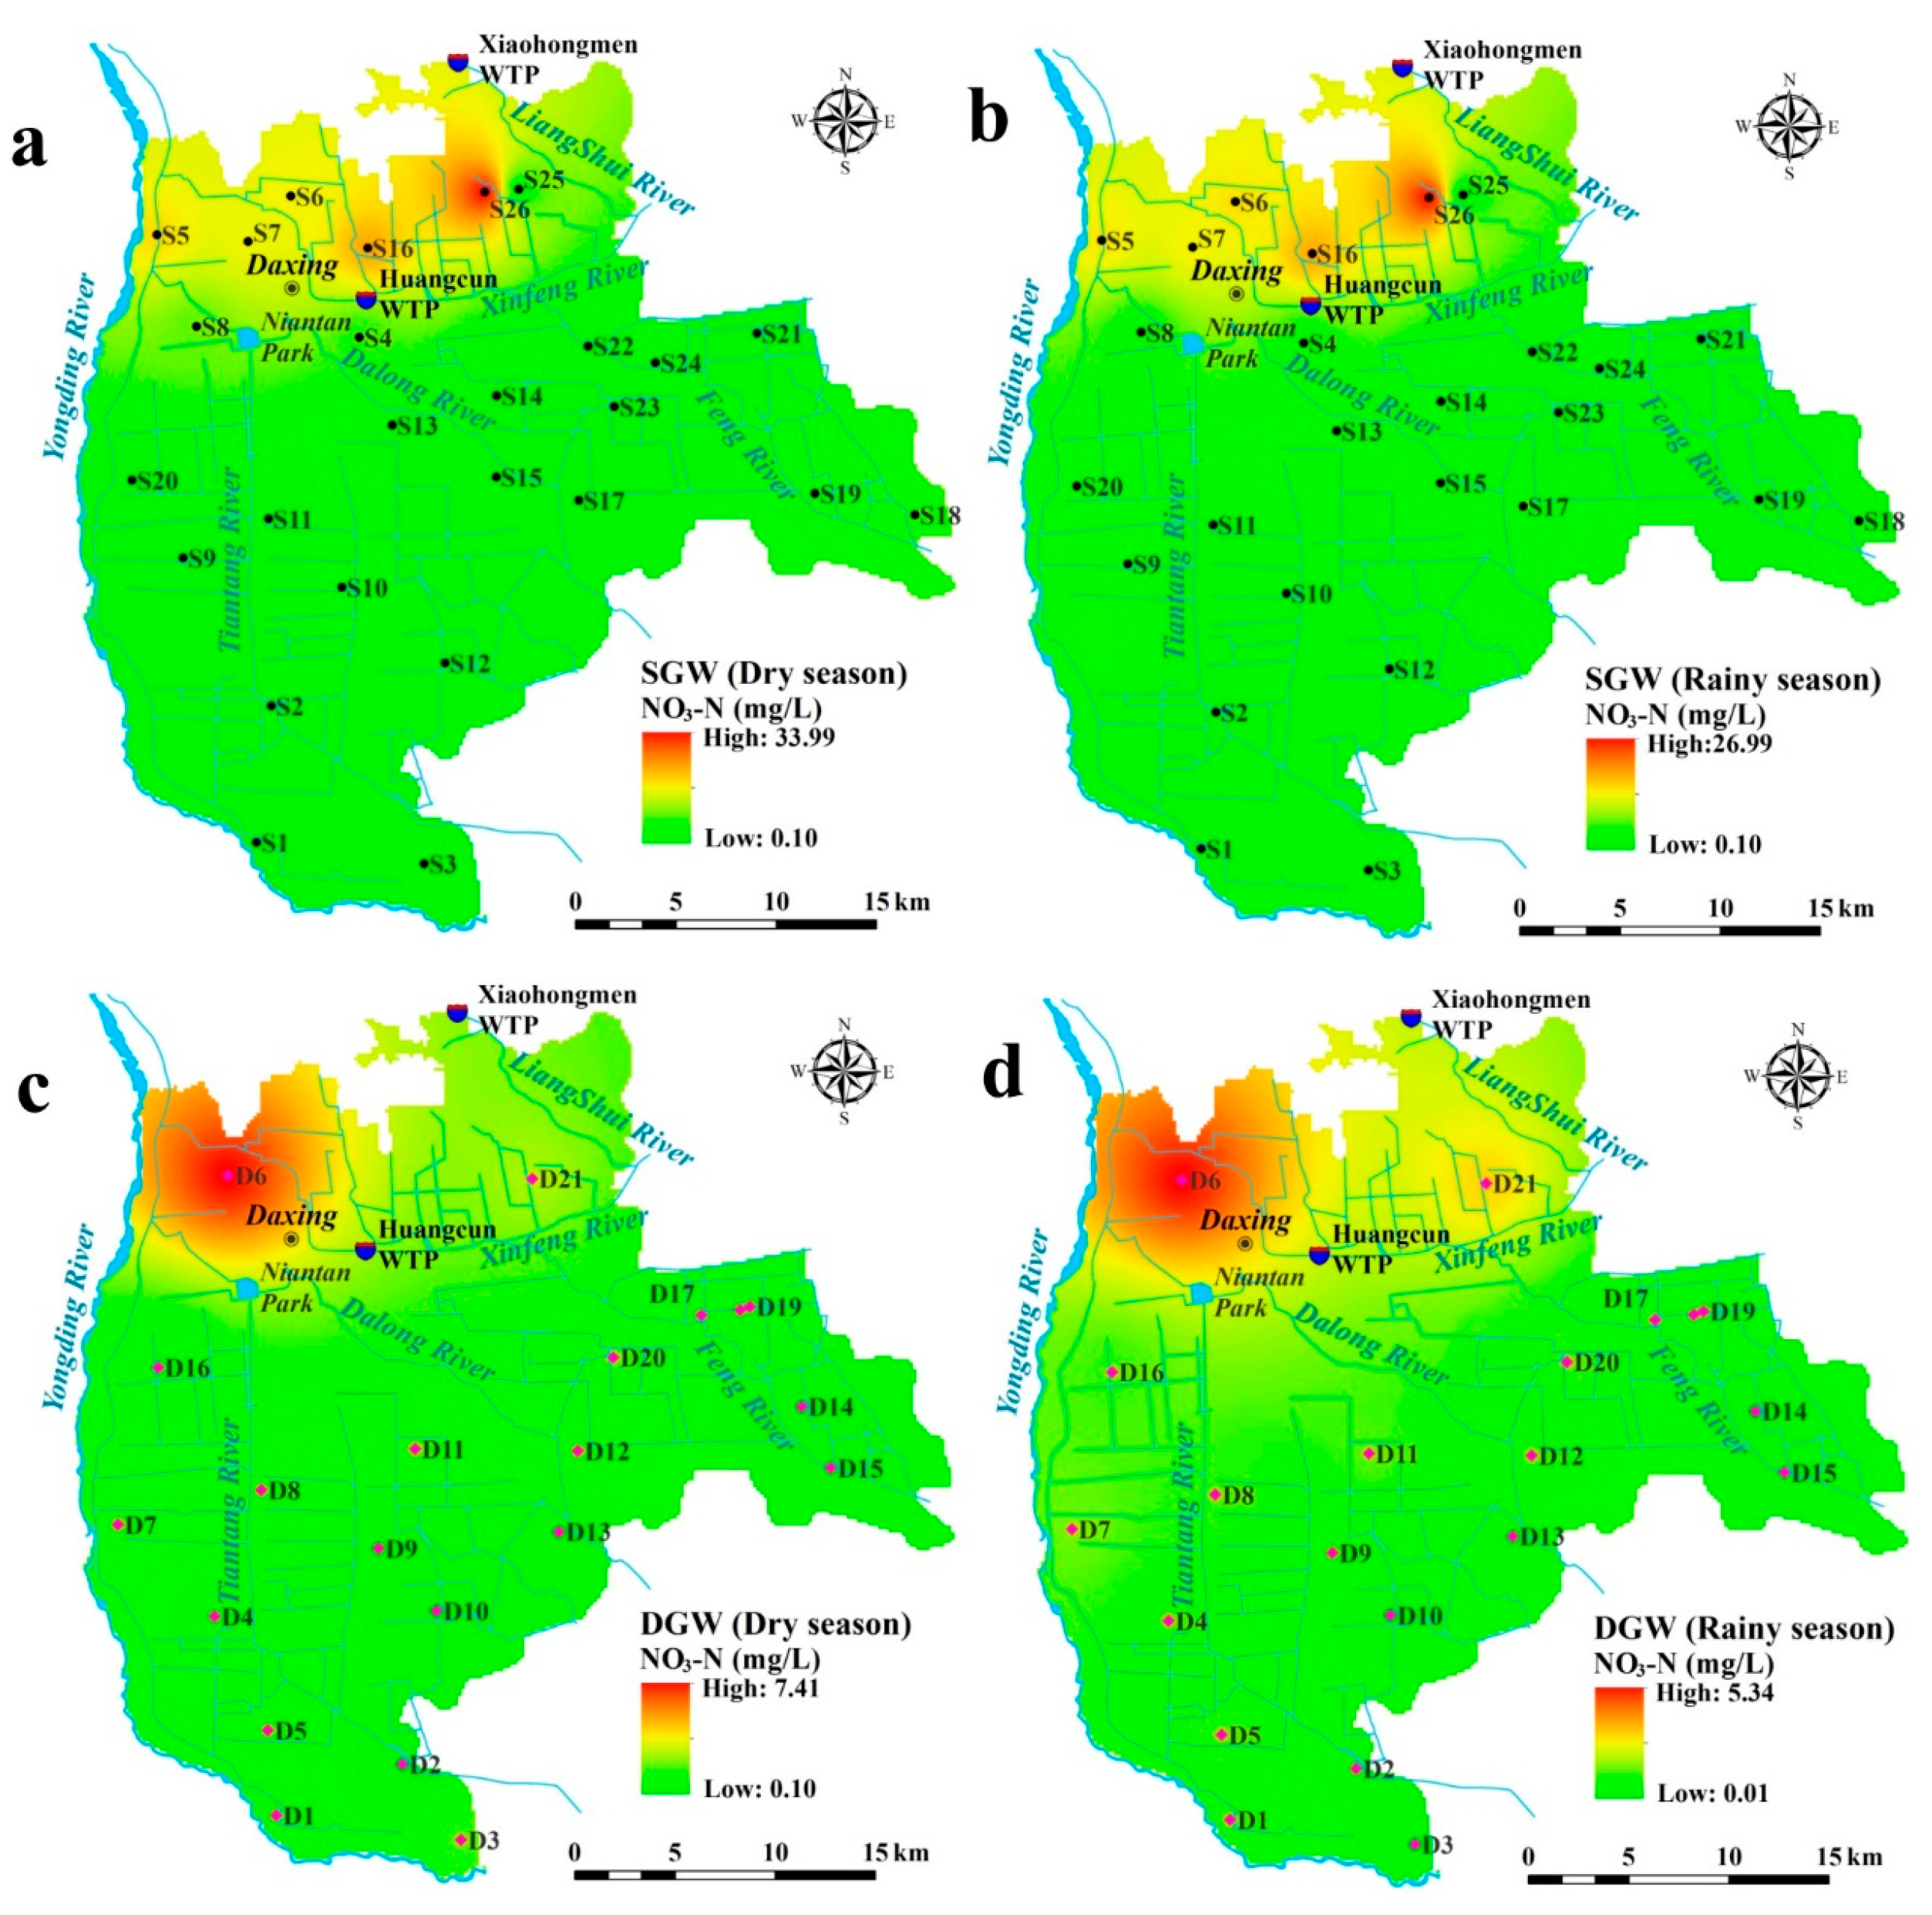
| NO3 (mg/L) | 0.10 | 34.00 | 6.00 | 8.80 | 146.79 | 0.00 | 27.00 | 5.02 | 6.91 | 137.87 |
| NO2 (mg/L) | 0.001 | 0.014 | 0.002 | 0.003 | 156.27 | 0.000 | 0.044 | 0.003 | 0.009 | 330.38 |
| NH4 (mg/L) | 0.01 | 0.19 | 0.03 | 0.06 | 164.08 | 0.00 | 0.63 | 0.04 | 0.13 | 325.07 |
| Deep GW | Dry Season | Rainy Season | ||||||||
| Min | Max | Mean | SD 1 | C.V. (%) 2 | Min | Max | Mean | SD 1 | C.V. (%) 2 | |
| T (°C) | 12.5 | 18.1 | 15.3 | 1.7 | 11.08 | 15.5 | 22.5 | 19.1 | 2.2 | 11.29 |
| pH | 7.30 | 7.70 | 7.51 | 0.10 | 1.36 | 7.30 | 8.00 | 7.68 | 0.19 | 2.46 |
| EC (μS/cm) | 526 | 1228 | 634 | 167 | 26.33 | 531 | 836 | 605 | 76 | 12.53 |
| TDS (mg/L) | 309 | 800 | 389 | 118 | 30.33 | 298 | 554 | 361 | 54 | 14.97 |
| K (mg/L) | 1.23 | 2.84 | 1.97 | 0.43 | 21.66 | 1.02 | 3.75 | 1.57 | 0.66 | 42.16 |
| Na (mg/L) | 21.5 | 163.0 | 59.6 | 31.6 | 53.05 | 13.2 | 73.2 | 31.6 | 16.9 | 53.49 |
| Ca (mg/L) | 29.1 | 96.3 | 51.9 | 13.9 | 26.70 | 32.1 | 88.7 | 52.9 | 14.2 | 26.87 |
| Mg (mg/L) | 15.0 | 71.4 | 26.9 | 12.3 | 45.99 | 12.7 | 31.5 | 20.2 | 5.3 | 26.43 |
| Cl (mg/L) | 7.7 | 95.3 | 25.5 | 20.0 | 78.31 | 9.2 | 50.7 | 22.2 | 11.8 | 53.09 |
| SO4 (mg/L) | 23.4 | 94.4 | 52.7 | 20.5 | 39.02 | 21.5 | 81.3 | 48.9 | 16.8 | 34.36 |
| HCO3 (mg/L) | 206.0 | 650.0 | 328.1 | 111.8 | 34.06 | 227.0 | 348.0 | 284.1 | 31.0 | 10.92 |
| NO3 (mg/L) | 0.10 | 7.41 | 1.27 | 1.59 | 125.13 | 0.01 | 5.35 | 1.13 | 1.22 | 107.92 |
| NO2 (mg/L) | 0.001 | 0.005 | 0.001 | 0.001 | 129.04 | 0.001 | 0.003 | 0.001 | 0.001 | 92.47 |
| NH4 (mg/L) | 0.01 | 0.18 | 0.02 | 0.04 | 186.24 | 0.01 | 0.10 | 0.02 | 0.03 | 129.04 |
| Percent | Shallow GW | Deep GW | |||
|---|---|---|---|---|---|
| Water Type | Dry Season | Rainy Season | Dry Season | Rainy Season | |
| Ca-HCO3 | 73.08% | 95.83% | 85.00% | 100.00% | |
| Na-Cl | |||||
| Mixed Ca-Na-HCO3 | 3.85% | 15.00% | |||
| Mixed Ca-Mg-Cl | 23.08% | 4.17% | |||
| Ca-Cl | |||||
| Na-HCO3 | |||||
© 2017 by the authors. Licensee MDPI, Basel, Switzerland. This article is an open access article distributed under the terms and conditions of the Creative Commons Attribution (CC BY) license (http://creativecommons.org/licenses/by/4.0/).
Share and Cite
Xiao, Y.; Gu, X.; Yin, S.; Pan, X.; Shao, J.; Cui, Y. Investigation of Geochemical Characteristics and Controlling Processes of Groundwater in a Typical Long-Term Reclaimed Water Use Area. Water 2017, 9, 800. https://doi.org/10.3390/w9100800
Xiao Y, Gu X, Yin S, Pan X, Shao J, Cui Y. Investigation of Geochemical Characteristics and Controlling Processes of Groundwater in a Typical Long-Term Reclaimed Water Use Area. Water. 2017; 9(10):800. https://doi.org/10.3390/w9100800
Chicago/Turabian StyleXiao, Yong, Xiaomin Gu, Shiyang Yin, Xingyao Pan, Jingli Shao, and Yali Cui. 2017. "Investigation of Geochemical Characteristics and Controlling Processes of Groundwater in a Typical Long-Term Reclaimed Water Use Area" Water 9, no. 10: 800. https://doi.org/10.3390/w9100800
APA StyleXiao, Y., Gu, X., Yin, S., Pan, X., Shao, J., & Cui, Y. (2017). Investigation of Geochemical Characteristics and Controlling Processes of Groundwater in a Typical Long-Term Reclaimed Water Use Area. Water, 9(10), 800. https://doi.org/10.3390/w9100800