Article

Using Dual Isotopes and a Bayesian Isotope Mixing Model to Evaluate Nitrate Sources of Surface Water in a Drinking Water Source Watershed, East China

1
College of Hydrology and Water Resources, Hohai University, Nanjing 210098, China
2
Department of Ecosystem Science and Management, The Pennsylvania State University, 116 ASI, University Park, State College, PA 16802, USA
*
Author to whom correspondence should be addressed.
Water 2016, 8(8), 355; https://doi.org/10.3390/w8080355
Submission received: 16 June 2016 / Revised: 1 August 2016 / Accepted: 10 August 2016 / Published: 19 August 2016

Abstract

:
A high concentration of nitrate (NO3) in surface water threatens aquatic systems and human health. Revealing nitrate characteristics and identifying its sources are fundamental to making effective water management strategies. However, nitrate sources in multi-tributaries and mix land use watersheds remain unclear. In this study, based on 20 surface water sampling sites for more than two years’ monitoring from April 2012 to December 2014, water chemical and dual isotopic approaches (δ15N-NO3 and δ18O-NO3) were integrated for the first time to evaluate nitrate characteristics and sources in the Huashan watershed, Jianghuai hilly region, China. Nitrate-nitrogen concentrations (ranging from 0.02 to 8.57 mg/L) were spatially heterogeneous that were influenced by hydrogeological and land use conditions. Proportional contributions of five potential nitrate sources (i.e., precipitation; manure and sewage, M & S; soil nitrogen, NS; nitrate fertilizer; nitrate derived from ammonia fertilizer and rainfall) were estimated by using a Bayesian isotope mixing model. The results showed that nitrate sources contributions varied significantly among different rainfall conditions and land use types. As for the whole watershed, M & S (manure and sewage) and NS (soil nitrogen) were major nitrate sources in both wet and dry seasons (from 28% to 36% for manure and sewage and from 24% to 27% for soil nitrogen, respectively). Overall, combining a dual isotopes method with a Bayesian isotope mixing model offered a useful and practical way to qualitatively analyze nitrate sources and transformations as well as quantitatively estimate the contributions of potential nitrate sources in drinking water source watersheds, Jianghuai hilly region, eastern China.

1. Introduction

Nitrate is essential for the growth and survival of plants, animals, and humans. However, a high concentration of nitrate in surface and ground water brings risks to aquatic systems (e.g., eutrophication and hypoxia) and human health (e.g., reducing oxygen supply of red blood cells) [1]. Furthermore, excess nitrate in drinking water is regarded as a health hazard as it is linked to infant methemoglobinemia and esophageal cancer [2]. Therefore, the World Health Organization (WHO), the United States Environmental Protection Agency, and the Ministry of Environmental Protection of China have set NO3-N concentration of 10 mg/L (measured as nitrogen) as the upper limit for drinking water [3,4,5]. Nitrate contamination has increasingly become an environmental problem worldwide, particularly in developing countries where drinking water is often polluted by intensive anthropogenic activities.
Revealing nitrate pollution characteristics and identifying its sources are fundamental to making effective water management strategies [6]. However, due to the wide variety of potential nitrate sources and complicated nitrogen transformation during nitrogen cycling, it is a challenge to determine nitrate sources and quantify the contribution of each source using traditional water quality monitoring methods [7]. Fortunately, the stable N isotope of nitrate provides information for nitrate sources identification and quantification, as different nitrate sources have different nitrogen isotope signatures. For example, synthetic fertilizers are produced by fixing atmosphere N2 and have a small fractionation with a δ15N-NO3 value from −4‰ to +4‰ [8]. Manure and sewage are often enriched with δ15N-NO3 (isotope vales from +5‰ to 25‰), because depleted isotope is volatized more easily than heavy isotope during ammonia volatilization process [5,9,10]. Nevertheless, it may be ambiguous to differentiate nitrate sources by using only nitrogen isotope of nitrate because of some overlaps of δ15N-NO3 among different nitrate sources. With the development of analytical techniques for δ18O-NO3, bacterial denitrification method provides an accurate, inexpensive, and convenient way to determine dual isotopes of nitrate (δ15N-NO3 and δ18O-NO3) simultaneously [11,12,13]. Values of δ18O-NO3 provide further information for nitrate sources and transformation. For instance, the value of δ15N-NO3 from soil microbial production (0‰–6‰) and atmospheric deposition (−13‰–13‰) may be overlapped at a certain point, but their δ18O-NO3 values often show different ranges (−10‰–15‰ from soil nitrate and 25‰–75‰ for precipitation) [5,9,14,15,16]. Moreover, dual isotopes of nitrate also provide evidence to evaluate the occurrence and level of denitrification process. Denitrifiers tend to use light isotopes of nitrate during denitrification process, which cause the enrichment of δ15N-NO3 and δ18O-NO3 with the remaining nitrate in a ratio of 1:1 to 2:1, thus the denitrification process can be evaluated by this ratio [5,17]. It provides a valuable way for qualitative analysis of nitrate sources and transformation by analyzing dual isotopes of nitrate.
The contribution proportion of each nitrate source cannot be fully elucidated without mathematical models. The basic mass balance mixing model can solve three sources using dual isotopes of δ15N-NO3 and δ18O-NO3 [3]. However, this method cannot calculate contribution proportions of nitrate from different sources when there are more than three sources, and the temporal and spatial variability of δ15N-NO3 and δ18O-NO3 in sources is not incorporated [18]. Hereafter, Bayesian framework isotope mixing models provide a way to simulate proportional contribution from multiple sources along with probability estimations. These models are the best tools for evaluating mathematically underdetermined systems nowadays, where there are more sources than isotope types [19]. A Bayesian stable isotope mixing model was developed in R statistical computing programs, which is referred to as Stable Isotope Analysis in R (SIAR) [3,18,20]. This model estimates proportions in mixtures with more than three sources and takes into account the uncertainties in tempo-spatial variabilities as well as isotopic fractionations. It has been widely applied in quantifying the diet of organisms on food sources and successfully used to estimate nitrate sources in different watersheds [7,20].
Jianghuai hilly region in eastern China is an area with a population of 13.4 million or more and covers an area of 2 × 10⁴ km2. It is located between the Yangtze and Huaihe Rivers, and belongs to a climate transitional zone alternately affected by subtropical and temperate monsoons. Due to complicated hydrogeological conditions, groundwater resources are insufficient for routine use. As a result, surface water is the main drinking water source. However, seasonal distribution of rainfall is asymmetrical, and surface water resources are seriously scarce in this area [21]. Average available water is below 500 m3 per capita per year, which is often insufficient for basic needs. Adding to the pressure, surface water quality is sensitively affected by human activities, including agriculture and livestock breeding. With the rapid increase of fertilizer application in the region, as well as manure and sewage discharge, nitrogen concentrations in surface water of downstream areas have been rising. Despite this pressing need, to our knowledge, no research has been done in this region to understand nitrogen pollution and nitrate sources. In order to protect aquatic system health, and to provide effective management strategies to reduce N contamination, assessment of nitrogen pollution and nitrate sources is badly needed in the watersheds.
The objectives of this work were to (1) understand the spatiotemporal characteristics of nitrogen in surface water across the Jianghuang hilly watersheds; (2) analyze the nitrate sources and transformations using δ15N-NO3 and δ18O-NO3; and (3) evaluate proportional contributions of different nitrate sources based on a Bayesian isotope mixing model.

2. Materials and Methods

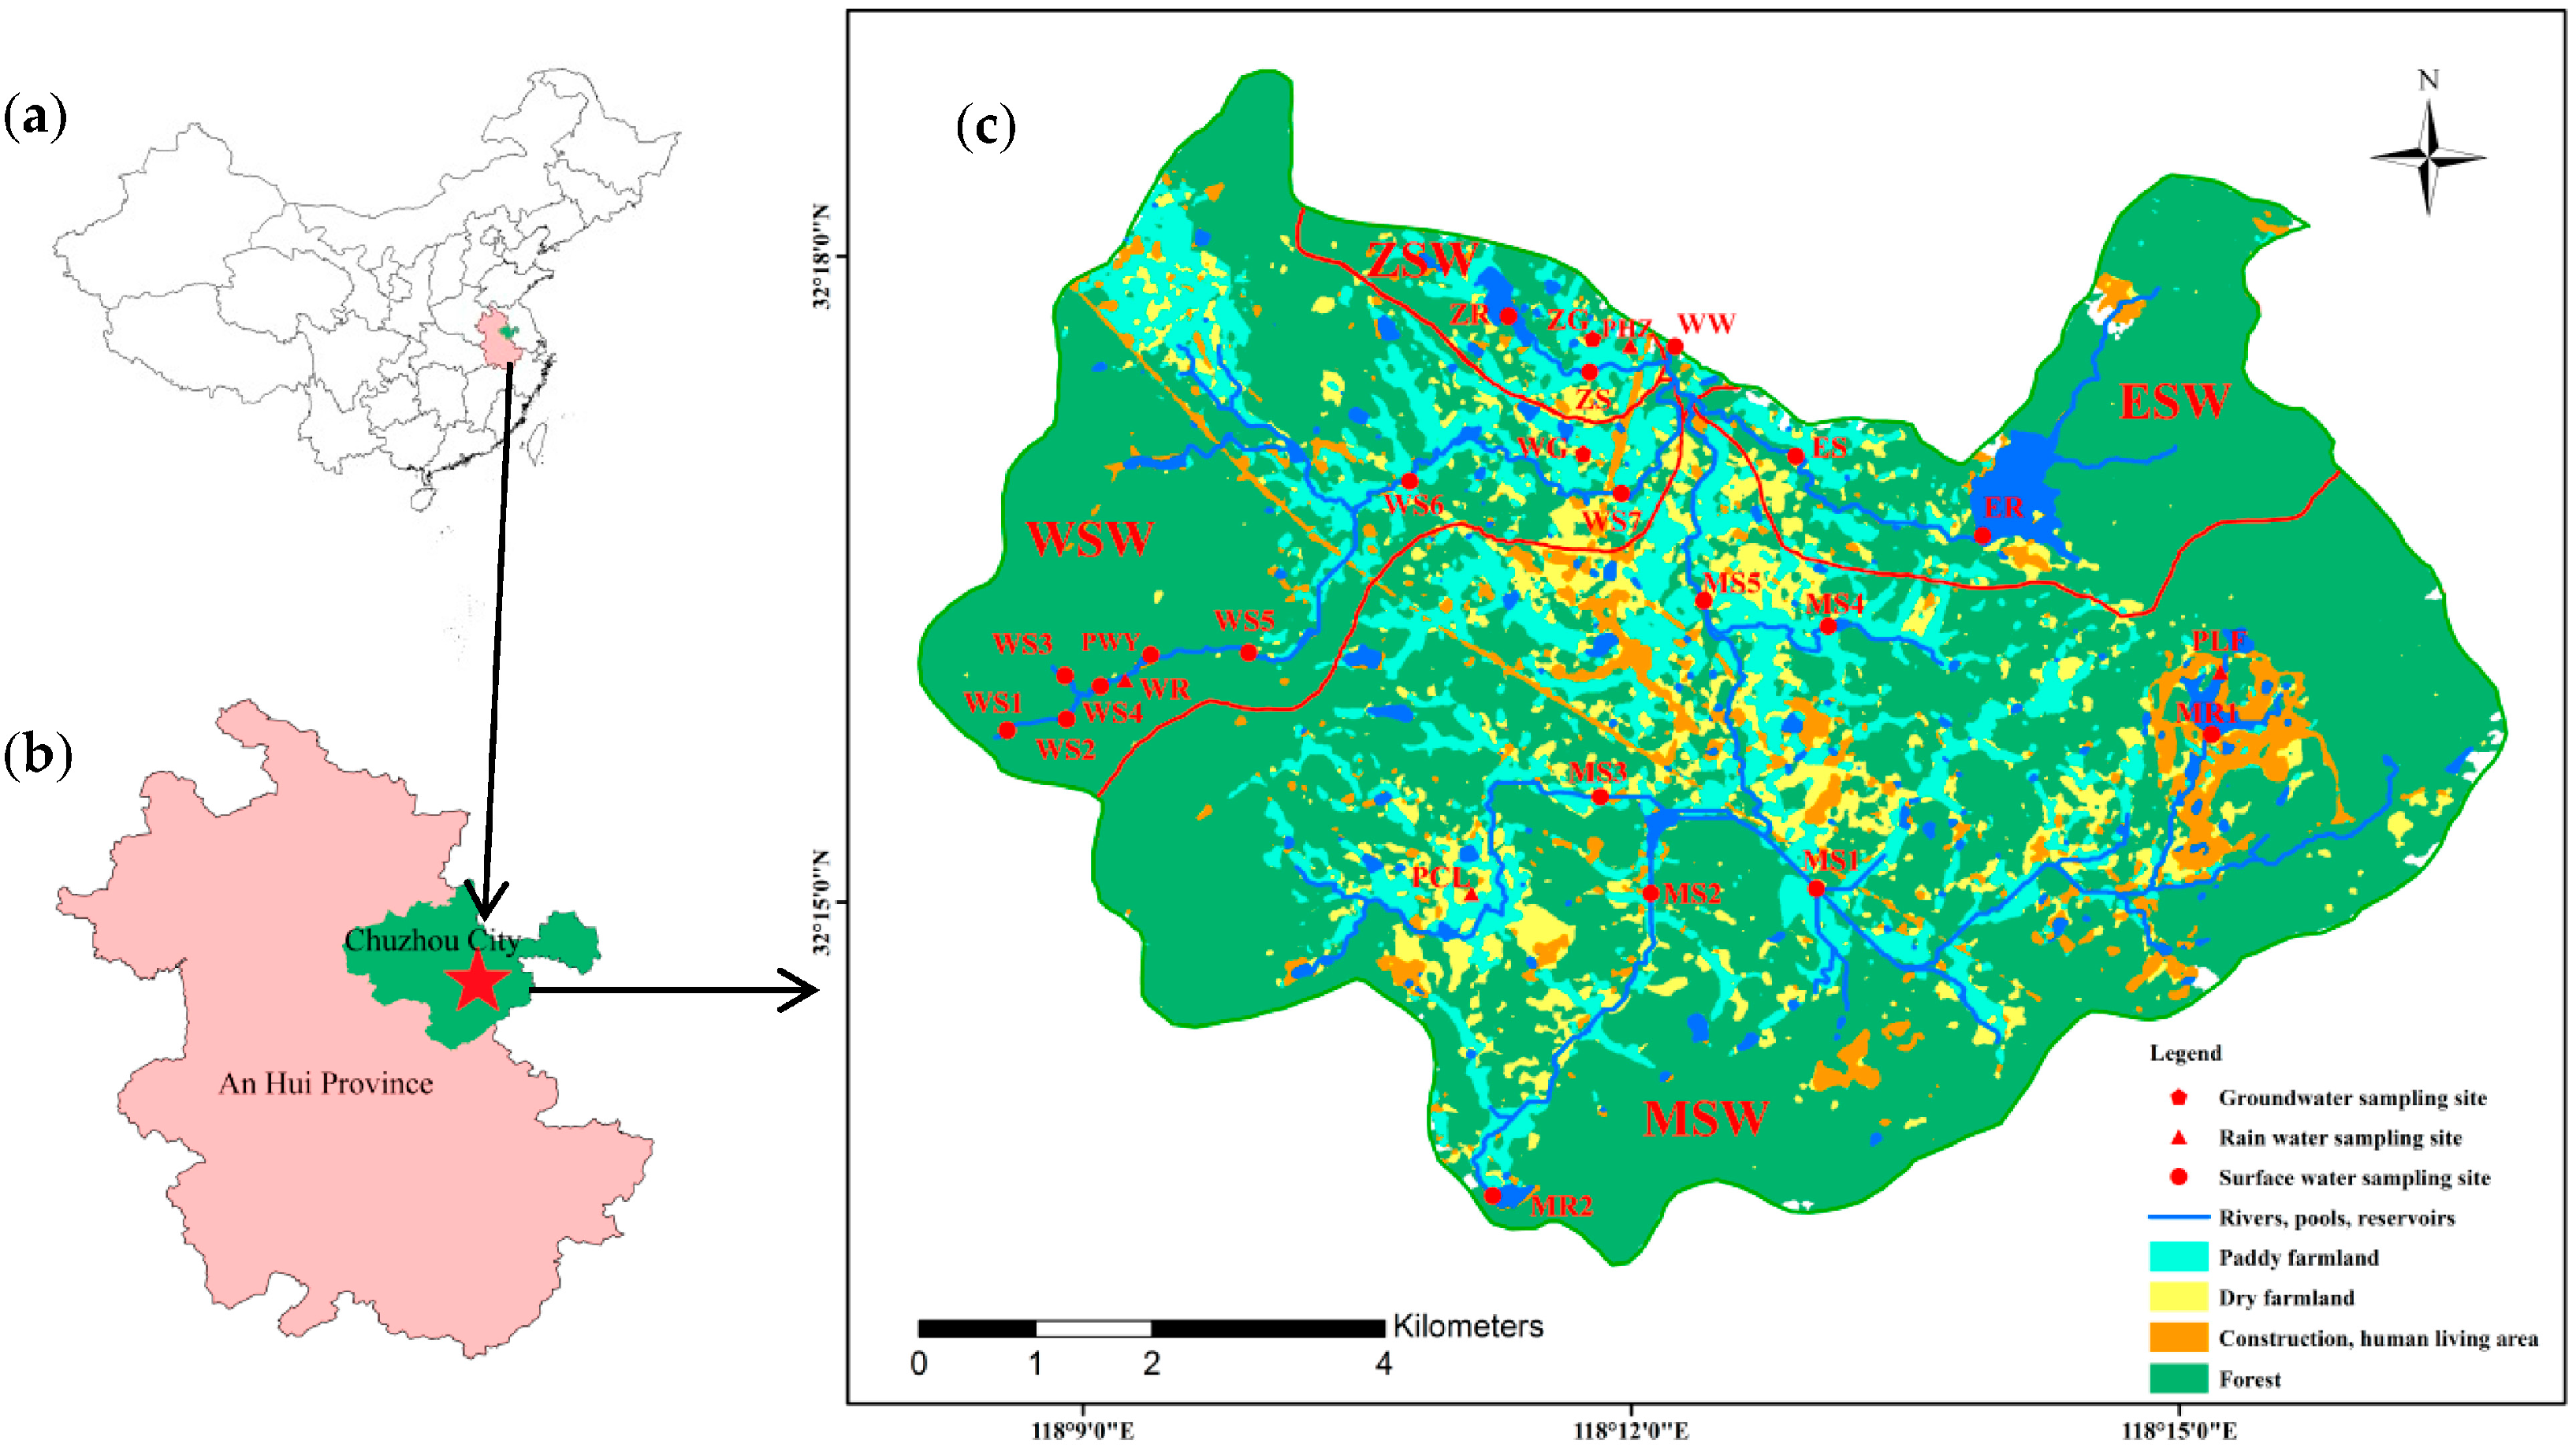
2.1. Study Area Description

The Huashan watershed, located in Jianghuai hilly region, is a drinking water source protection area for Chuzhou city in Anhui Province, East China. It covers an area of 80.13 km2 (from 32°13′15′′ N to 32°18′55′′ N, and from 118°8′7′′ E to 118°16′51′′ E), and has a population of about 12,000. Xiaoshahe River, the main channel about 12 km long, is a tributary to the Yangtze River. About 16 km downstream from the watershed is the Chengxi reservoir, which holds 85.3 million cubic meters of water as drinking water for Chuzhou city. Agricultural farming and livestock breeding are intensive in the study area. Furthermore, the watershed does not have any non-agricultural industries and their impacts on nitrogen in surface water can be ignored.
The watershed is located in a transition region from subtropical zone to warm temperate zone, with an average annual temperature of 15.2 °C, sunshine duration of 2218 h, evaporation of 922 mm, and precipitation of 1048 mm. Wet season (high flow period) occurs from May to September, during which rainfall accounts for about 70% of annual precipitation amount.
The whole watershed (WW) is fan-shaped, which is composed of four sub-watersheds, namely, eastern sub-watershed (ESW), middle sub-watershed (MSW), western sub-watershed (WSW), and Zhuyuangou sub-watershed (ZSW) (Figure 1). Key sites for hydrology and water chemistry monitoring were Zhangying (ES) for ESW, Caijiqiao (MS5) for MSW, Sanchahe (WS7) for WSW, Zhuyuangou (ZS) for ZSW and Huzhang for WW (Figure 1).
The watershed is a typical mixed forest and agriculture (Figure 1 and Table 1), with 68.33% of land covered by forest, 22.66% for agriculture, 4.85% as barren, 2.84% by surface water, and 1.32% for residential area. Rice, rape, and wheat are the dominant crops in the area. Heavy application of NPK (Nitrogen, Phosphorus and Potash) compound fertilizer (containing about 18% of nitrogen) and manure (mainly animal wastes) takes place as base fertilizers for rice around May to June and for wheat around October to November when rice is transplanted and wheat is sowed into field. Urea (CO[NH2]2) is used for wheat growth in early March. Septic tanks are used to dispose human excretions on-site, which may permeate to the groundwater and may overflow to surface water when heavy storms occur. Sewage and septic waste usually flow into streams directly and animal waste accumulations transfer into rivers after rainfall. Considering the isotopic signatures of N in sewage and manure are similar, those two sources are treated as one source in this study [5,22]. In addition, groundwater resource was insufficient in this area and nitrogen concentration in ground water was much lower than that in surface water. The impact of nitrate discharging from ground water to surface water can be ignored.

2.2. Samplings Collection

Precipitation was sampled at four monitoring sites located in three sub-watersheds (Longfeng precipitation monitor site (PLF) and Chunlei precipitation monitor site (PCL) in MSW, Wangying precipitation monitor site (PWY) in WSW, and Zhengjia precipitation monitor site (PZJ) in ZSW, as shown in Figure 1c) during rainfall event from June 2013 to November 2014. Surface water was sampled twice a month at the main stream channel and major tributaries from April 2012 to December 2014. Sampling containers were washed by HCL acid and thoroughly rinsed before sampling. Each sample was filtered through 0.45 µm cellulose acetate filter papers and then filled in the pre-washed polyethylene bottles. All samples were stored below 4 °C in refrigerator before analysis.
Water chemistries (concentrations of total nitrogen, ammonia-nitrogen, nitrate-nitrogen, and nitrite-nitrogen) and dual isotopes of H2O in rainfall and surface water were all measured (see below). Nitrogen and oxygen isotopes of NO3 in surface water were determined once every two months from June 2012 to December 2013. A total of 975 samples were collected for water chemistry analysis, 189 samples for nitrogen and oxygen isotopes of nitrate, and 1126 samples for hydrogen and oxygen isotopes of water. All samples were collected by one or more of the authors in this paper.

2.3. Analytical Methods

2.3.1. Chemistry and Isotopes Analysis Methods

Water samples of nitrate-nitrogen were measured using ultraviolet spectro-photometric method, which followed by a standard protocol [23]. The stable isotopes of water (δ18O and δD) were analyzed on a Picarro L2120-i isotope laser spectrometer (Picarro Inc., Santa Clara, CA, USA) after filtered through 0.22 µm filters. The measurement of nitrogen and oxygen isotopic compositions of nitrate were carried out using a bacterial reduction method based on the isotopic analysis of nitrous oxide (N2O) produced by denitrifying bacteria, Pseudomonas aureofaciens [11,12]. The N2O was concentrated and purified on a Tracer System, and then the isotopic composition was determined using the Finnigan MAT 253 isotope ratio mass spectrometry (Thermo Fisher Scientific, Bremen, Germany) at the State Key Laboratory of Hydrology-Water Resources and Hydraulic Engineering, Hohai University. Four international isotopic reference materials (USGS-32, USGS-34, USGS-35, and IAEA-N3) were used to calibrate the measured samples.
All stable isotope ratios are expressed in the usual delta per mil (‰) notation:
δ sample(‰) = [(R sample − R standard)/R standard] × 1000‰
where R sample and R standard are the 15N/14N, 18O/16O, or 2H (D)/1H ratios of the samples and the standards, respectively. Values of δ15N are reported with respect to N2 in air, meanwhile δ18O and δ2H values are relative to Vienna Standard Mean Ocean Water (V-SMOW). The analytical precision were <0.2‰ for δ15N-NO3, <0.5‰ for δ18O-NO3, <0.5‰ for δD-H2O, and <0.5‰ for δ18O-H2O. Analysis for water chemistry and dual isotopes of nitrate were performed in duplicate, and three aliquots of water samples were analyzed for hydrogen and oxygen isotopes.

2.3.2. Multivariate Statistics

  • One-way analysis of variance (ANOVA) was performed using SPSS version 20 (SPSS Inc., Chicago, IL, USA) to evaluate whether there are any significant differences between the means among three or more independent groups.
  • Before proportion nitrate sources using Bayesian isotope mixing model, normality test of nitrate sources input data was needed. In this study, Lilliefors normality test of δ15N and δ18O values in NO3 sources were conducted on MATLAB (MATLAB 2015a, The Mathworks Inc., Natick, MA, USA). Lilliefors method was based on the Kolmogorov–Smirnov test and inspects the null hypothesis that data come from a normally distributed population, when the null hypothesis does not specify which normal distribution.

2.3.3. A Bayesian Isotope Mixing Model

To quantify the proportional contributions of potential NO3 sources contributed to surface water, a Bayesian mixing model (Stable Isotope Analyses in R, SIAR) was applied. SIAR used Markov chain Monte Carlo with Metropolis–Hastings steps to simulate plausible source proportions. Dirichlet distribution was adopted as the prior distribution of source contribution, which forced the sum of source contribution to one. The posterior distributions were probability distributions for each nitrate source [24,25,26]. SIAR model was simplified as follows:
Xi,j = ∑Pk(Sj,k + Cj,k) + εj,k,
Sj,k~N(µj,k2j,k),
Cj,k~N(λj,k2j,k),
εj,k~N(0,σ2),
where Xi,j is the isotope value j of the mixture i, in which i = 1, 2, 3,…, N and j = 1, 2, 3,…, J; Sj,k is the source value k on the isotope j (k = 1, 2, 3,…, K) and is normally distributed with mean µj,k and standard deviation ω2j,k; Pk is the proportion of source k , which needs to be estimated by the SIAR model; Cj,k is the fractionation factor for isotope j on source k and is normally distributed with mean λj,k and standard deviation τ2j,k; and εj,k is the residual error representing the additional unquantified variation between individual mixtures and is normally distributed with mean 0 and standard deviation σ2. In this study, five potential nitrate sources (NO3 in precipitation, NP; manure and sewage, M & S; soil N, NS; NO3 fertilizer, NF; and NO3 nitrified from NH4+ in fertilizer and rainfall, NFA) were integrated by the SIAR for different watersheds (ESW, MSW, WSW, ZSW and WW) during different temporal periods (high flow season and low flow season).

3. Results and Discussion

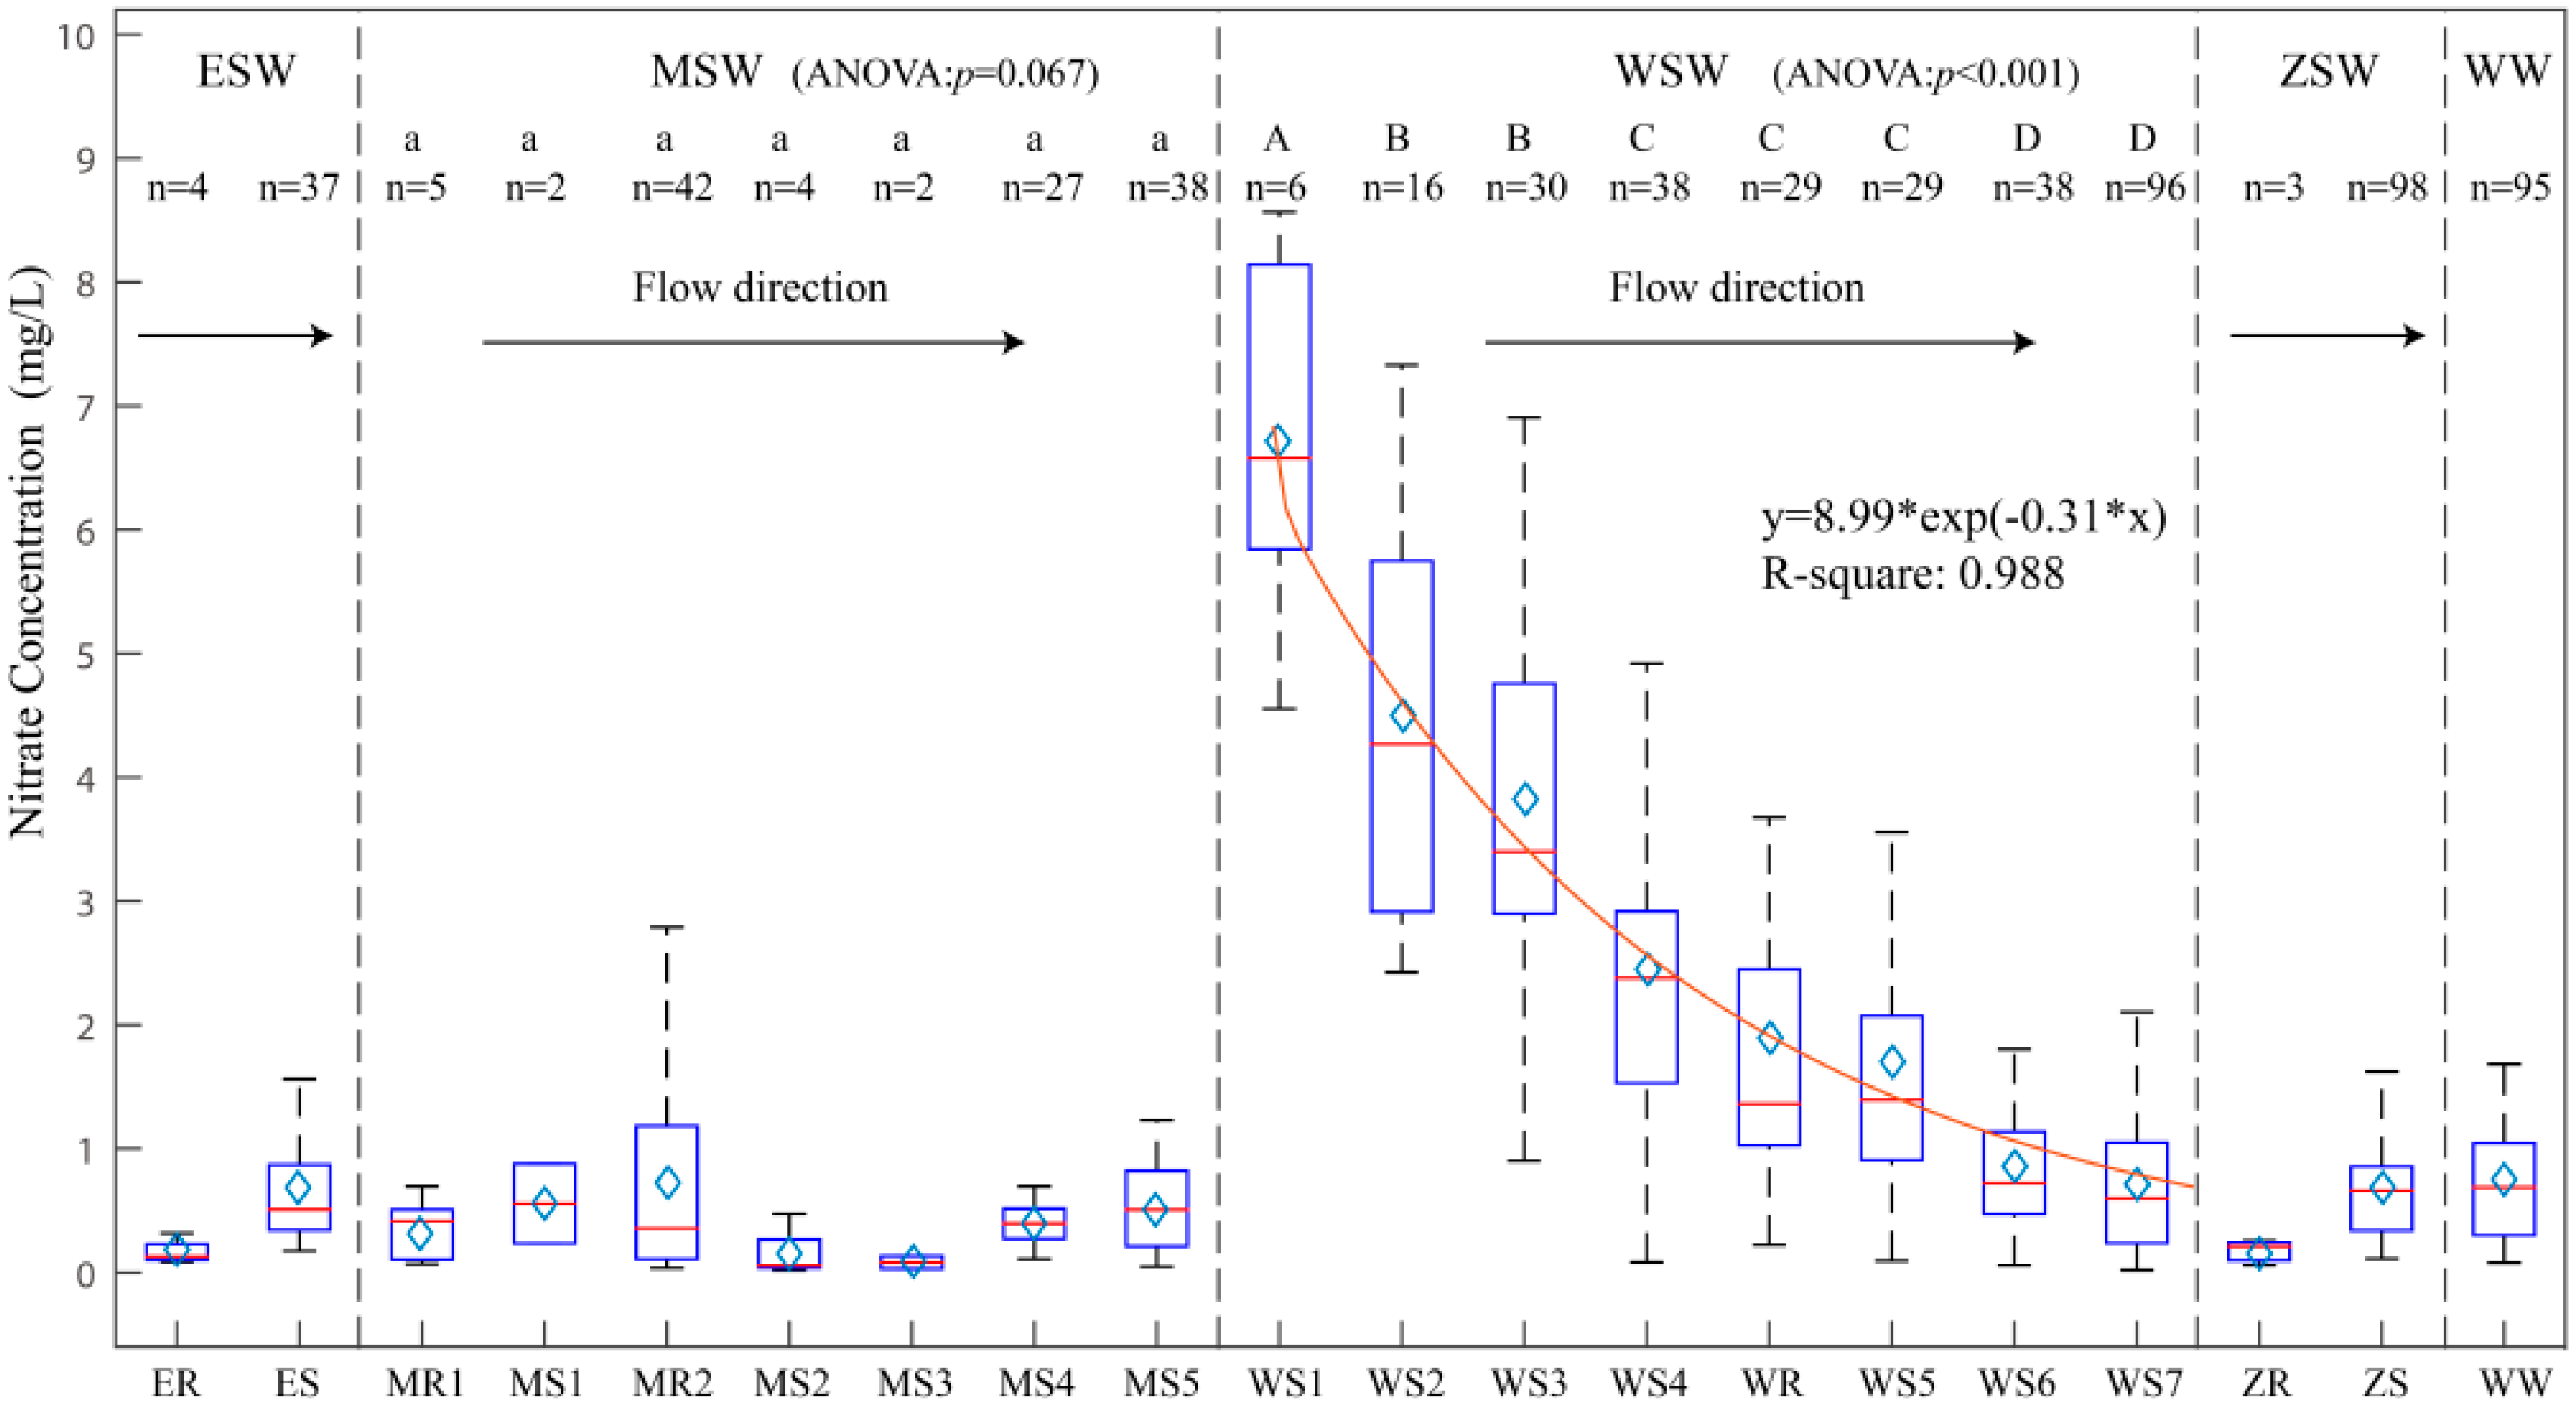
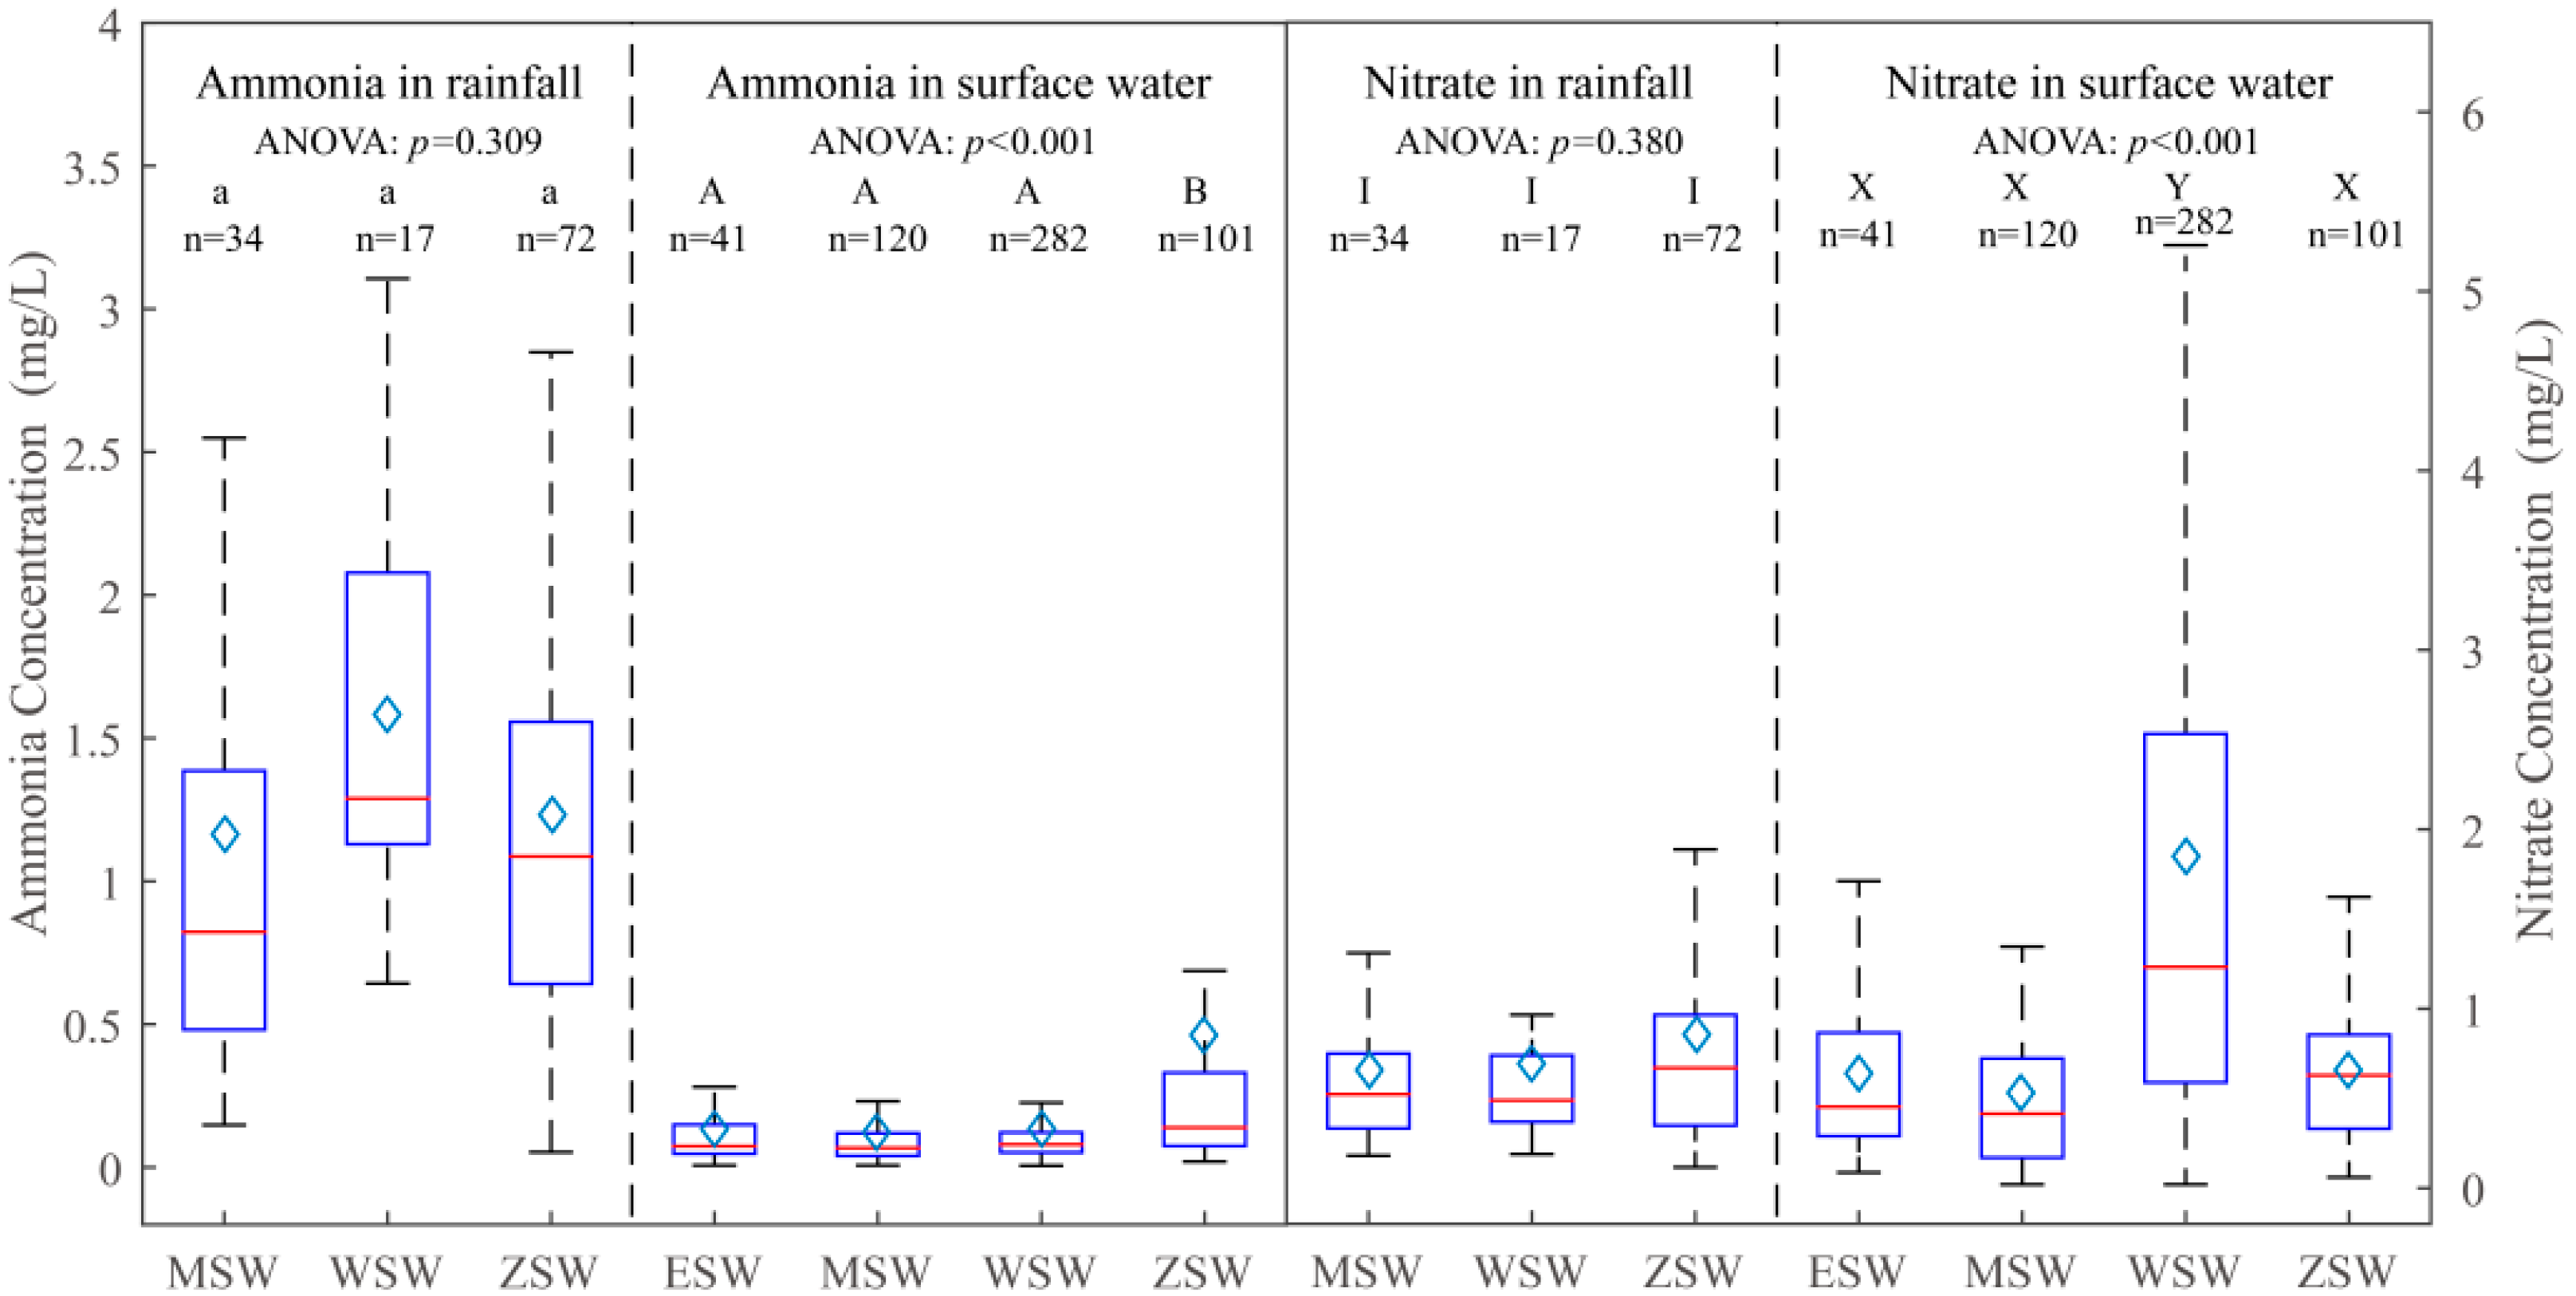
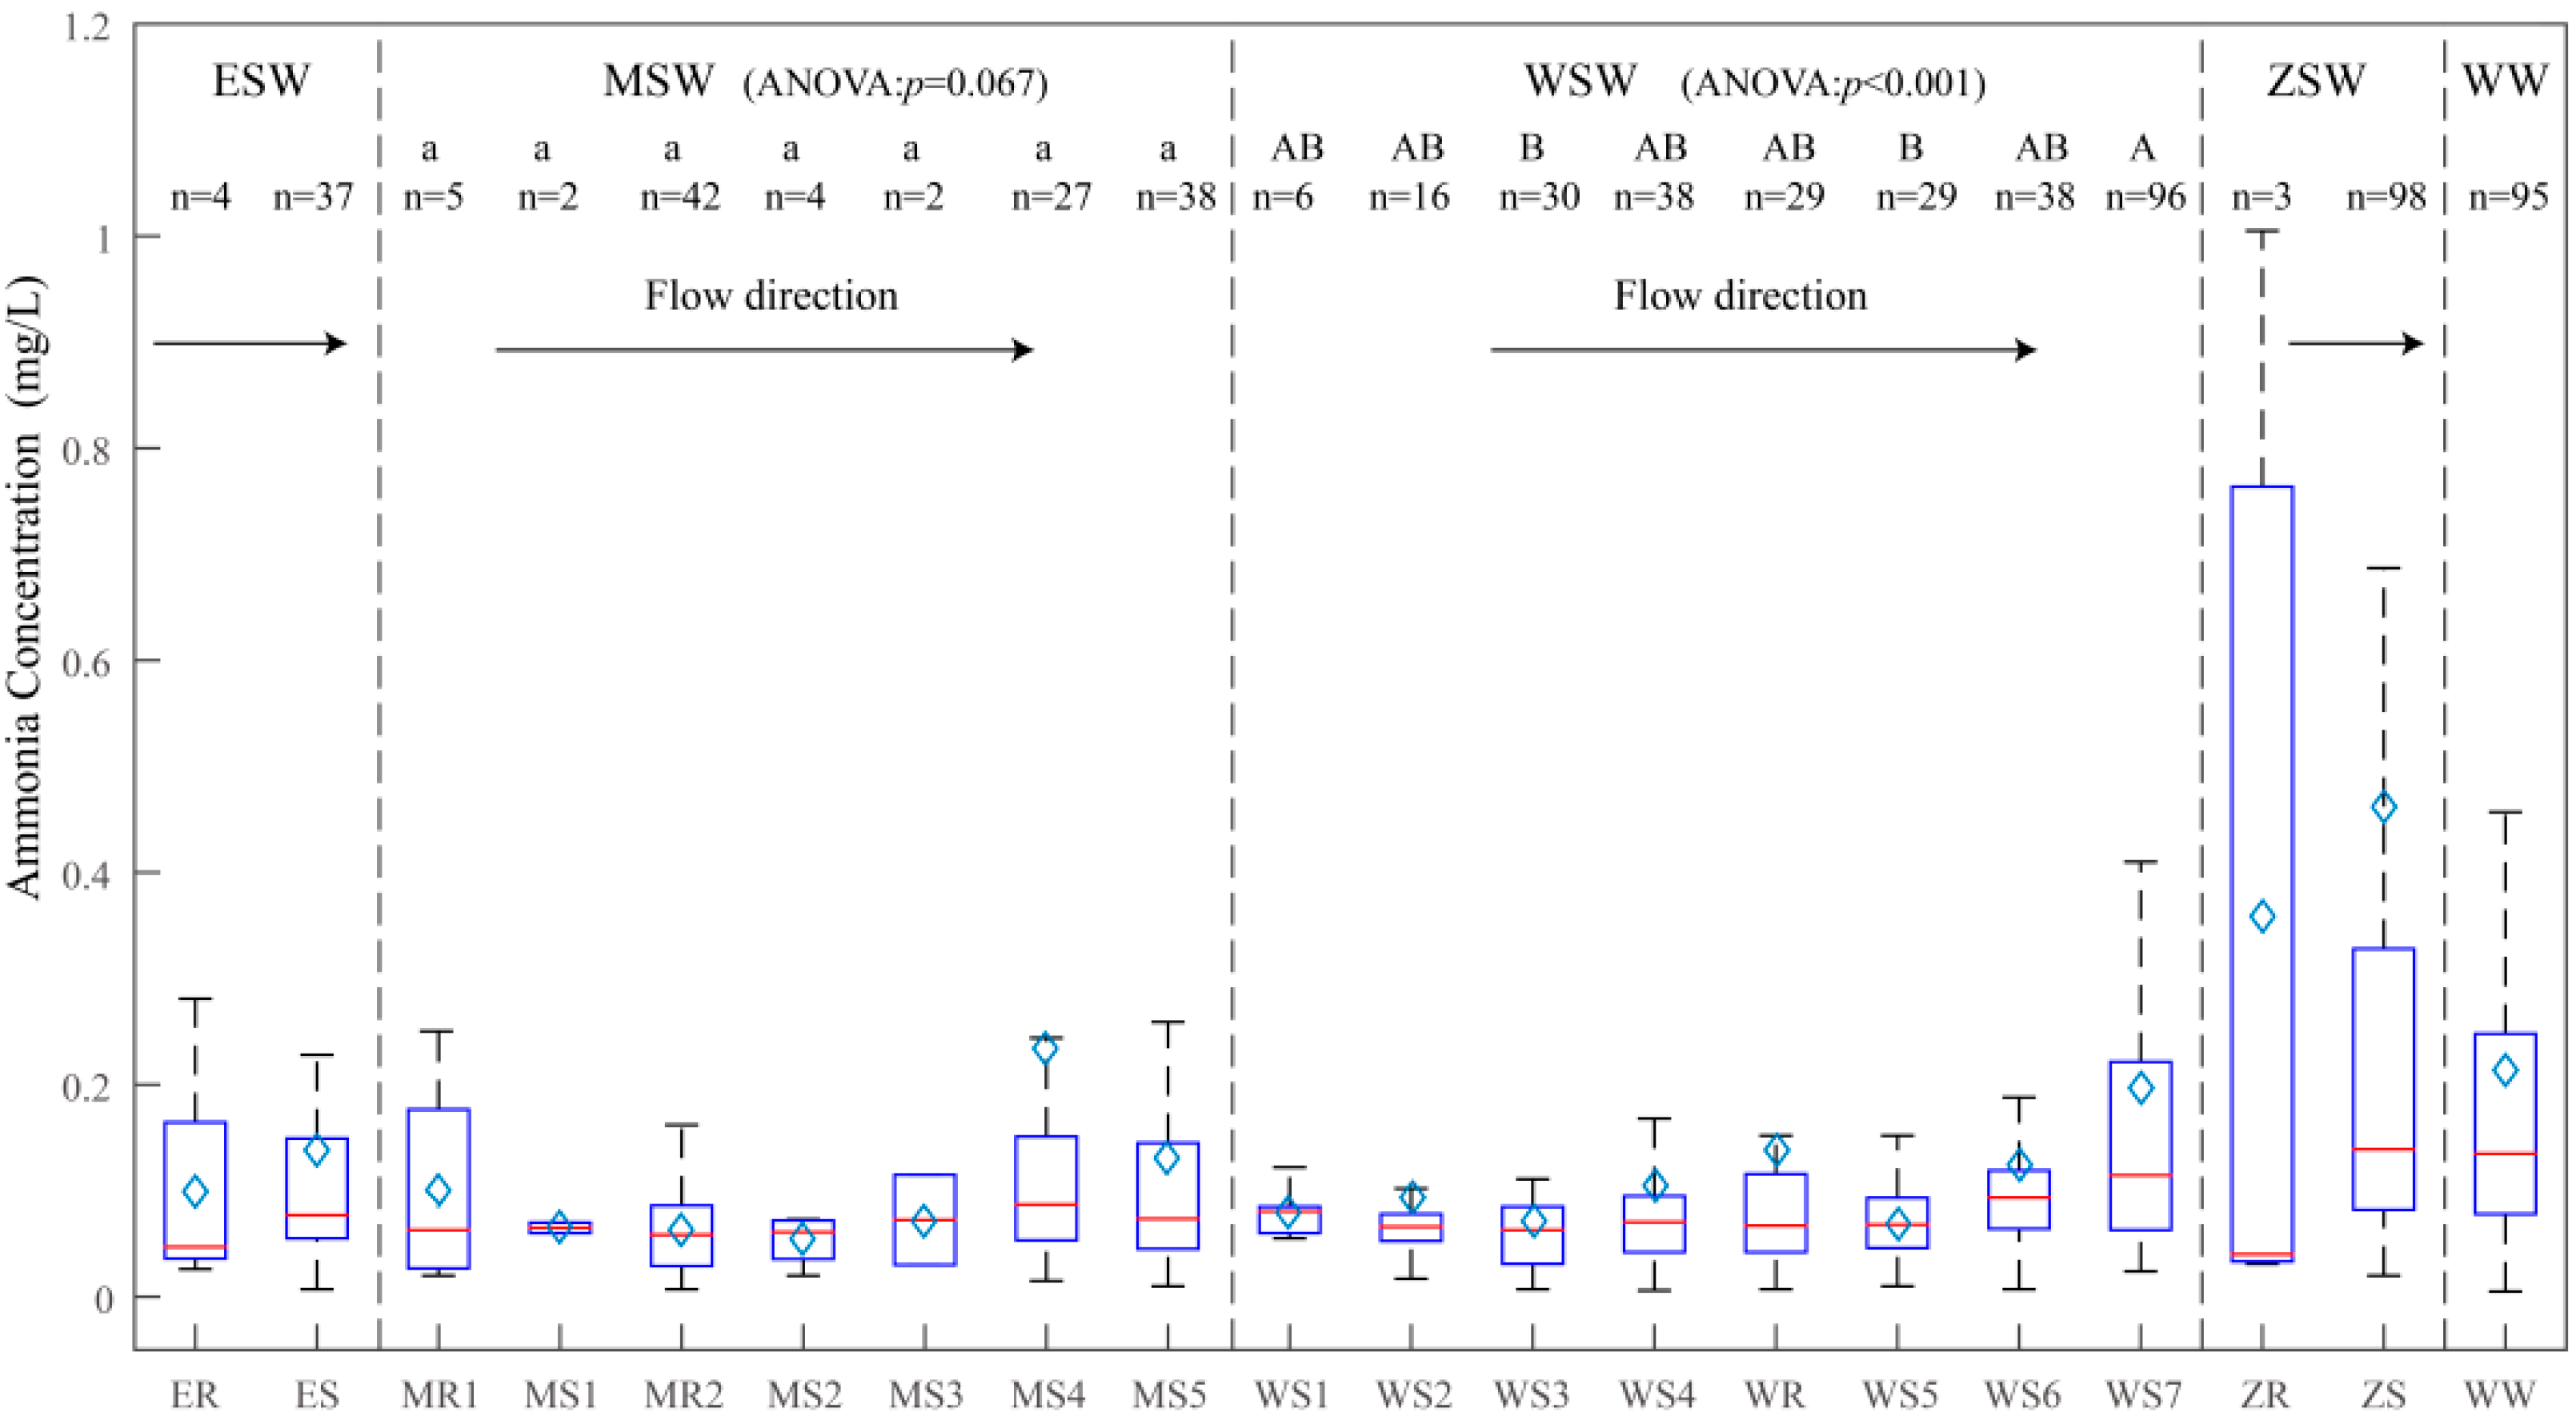
3.1. Spatial-Temporal Characteristics of Nitrogen in the Study Area

The concentration of NH4+-N, NO3-N, and total nitrogen (TN) in precipitation (n = 129) were 0.15–5.11 mg/L (mean value of 1.26 mg/L), 0.12–5.14 mg/L (mean value of 0.78 mg/L), and 0.37–15.15 mg/L (mean value of 2.61 mg/L), respectively. Based on one way ANOVA, there was no significant difference for nitrogen (NH4+-N, NO3-N, and TN) in rainfall among the three sub-watersheds, which means that spatial heterogeneity of nitrogen in atmosphere can be ignored. In addition, as Figure 2 shows, the NH4+-N concentration in precipitation (mean 1.26 mg/L, n = 129) was much higher than that in surface water (mean 0.20 mg/L, n = 639), suggesting that precipitation was regarded as an NH4+-N source to surface water and the influence of NH4+-N in rainfall should take into consideration when proportion nitrogen sources in this region.
The NH4+-N in surface water ranged from 0.01 to 4.86 mg/L, with a mean value of 0.20 mg/L (n = 639) in the whole watershed. As shown in Figure 3, there was a slight increasing trend in NH4+-N from upstream to downstream (mean value from 0.16 mg/L to 0.23 mg/L). This was due to less proportion of croplands and residential living in upstream as compared to the downstream (as shown in Table 1). According to the national quality standards for surface waters in China (GB3838-2002) [27], ammonia-nitrogen concentration should below 1 mg/L for drinking water. All the water samples of NH4+ in ESW (n = 41), 98.3% in MSW (n = 120), and 98.2% in WSW (n = 282) were below 1 mg/L. By contrast, about 14.9% in ZSW (n = 101) exceeded the guideline. The ANOVA results indicated that NH4+-N concentration in ZSW was significantly different with that in other sub-watersheds. Furthermore, surface water NH4+-N in ZSW during wet season (from 0.03 to 4.86, with mean value 0.62) was much higher than in dry season (from 0.02 to 1.01, with mean value 0.16). About 21.2% in high flow period (n = 66) could not be treated as drinking water directly in ZSW, as ammonia-nitrogen concentration surpassed the guideline. Surface water in ZSW, which had the highest proportion of croplands in the study area, was affected easily by cultivated activities such as the application of fertilizers and manure.
The concentration of NO3-N in surface water ranged from 0.02 to 8.57 mg/L, with a mean value of 1.17 mg/L (n = 639). None of these water samples went over the 10 mg/L limit for drinking water. Natural background and threshold nitrate-nitrogen concentrations were estimated by using cumulative probability graph method [28,29]. The inflection points on the probability graph indicated an interpretable breakdown of the distribution of the logged values. The threshold at 3.12 mg/L was expressed to be the upper bound of the present-day background. Concentrations above the upper value would likely include nitrate-nitrogen from some anthropogenic sources, such as N fertilizers, animal waste as well as septic effluent. For the samples with NO3-N concentrations between 0.14 and 3.12 mg/L, the anthropogenic and natural NO3-N sources were an amalgam of soil organic matter from crop residues, combustion products and evaporation of ammonia from compound fertilizers as well as atmospheric deposition. The NO3-N in WSW, however, was significantly different from other sub-watersheds (Figure 4). An exponential decrease in nitrate in WSW was noticeable (y = 8.99 × exp(−0.31x), R2 = 0.988). Although dramatically decline of nitrate occurred along the stream, denitrification was not found by analyzing δ15N-NO3 and δ18O-NO3 (see discussion in Section 3.2). From WS1 to WS5 in WSW, nitrate-nitrogen reduced about 75% to a relative low level (i.e., from 6.71 to 1.69 mg/L) (Figure 4), while the distance between WS1 to WS5 only accounts for 29.58% of the stream in WSW. More specifically, a wetland was located between sites WS4 and WR (Figure 1) where plants assimilate nitrate for growing. Consequently, the mean value of nitrate-nitrogen in WS4 during summer months (June to August) when aquatic plants growing fast was 1.66 mg/L (n = 13), which was much lower than that in winter (January, February and December) (mean 2.43 mg/L, n = 6). It could be concluded that decline of nitrate in this WSW was mostly due to dilution, aquatic plants absorption, 99.98% forests cover at the headwater catchment between the sites WS1 or WS2, and lack of any human activities. However, abnormally high nitrate-nitrogen concentrations (maximum 8.57 mg/L) were observed at the source areas of WSW. Water samples were collected up to the end of the creek, which was recharged by precipitation and seeps. However, nitrate-nitrogen in rainfall near WS2 was never higher than 2.22 mg/L. Therefore, those abnormally high nitrate concentrations were attributed to seeps of springs. High nitrate concentrations in headwater catchments were also detected in Hubbard Brook Experimental Forest, New Hampshire, USA [30]. These results suggested that elevated nitrate could come from groundwater in forest headwater catchments without human activities.
Total nitrogen (TN) was the sum of dissolved inorganic nitrogen (ammonia, nitrate, and nitrite nitrogen) and organically bonded nitrogen. The TN in surface water was found to range from 0.34 to 21.14 mg/L, with a mean of 2.01 mg/L. The content of NO3 occupied the largest proportion of TN in different sub-watersheds (ranging from 45.97% to 68.22% as shown in Table 2). Due to the unstable property of NO2, it was easily oxidized to NO3. Therefore, the proportion of nitrite in TN was the lowest, only accounting for less than 2.48%. Dissolved inorganic nitrogen (DIN) in WSW was the dominant component in surface water TN, accounting for 78.05%. By contrast, the dissolved organic nitrogen (DON) in MSW and ZSW exported more than that in ESW and WSW. It should be noted that organic nitrogen productions from manure and sewage were much higher in MSW and ZSW as a result of intensive agriculture and livestock feeding activities.

3.2. Identification of the Potential Nitrate Sources and Transformation

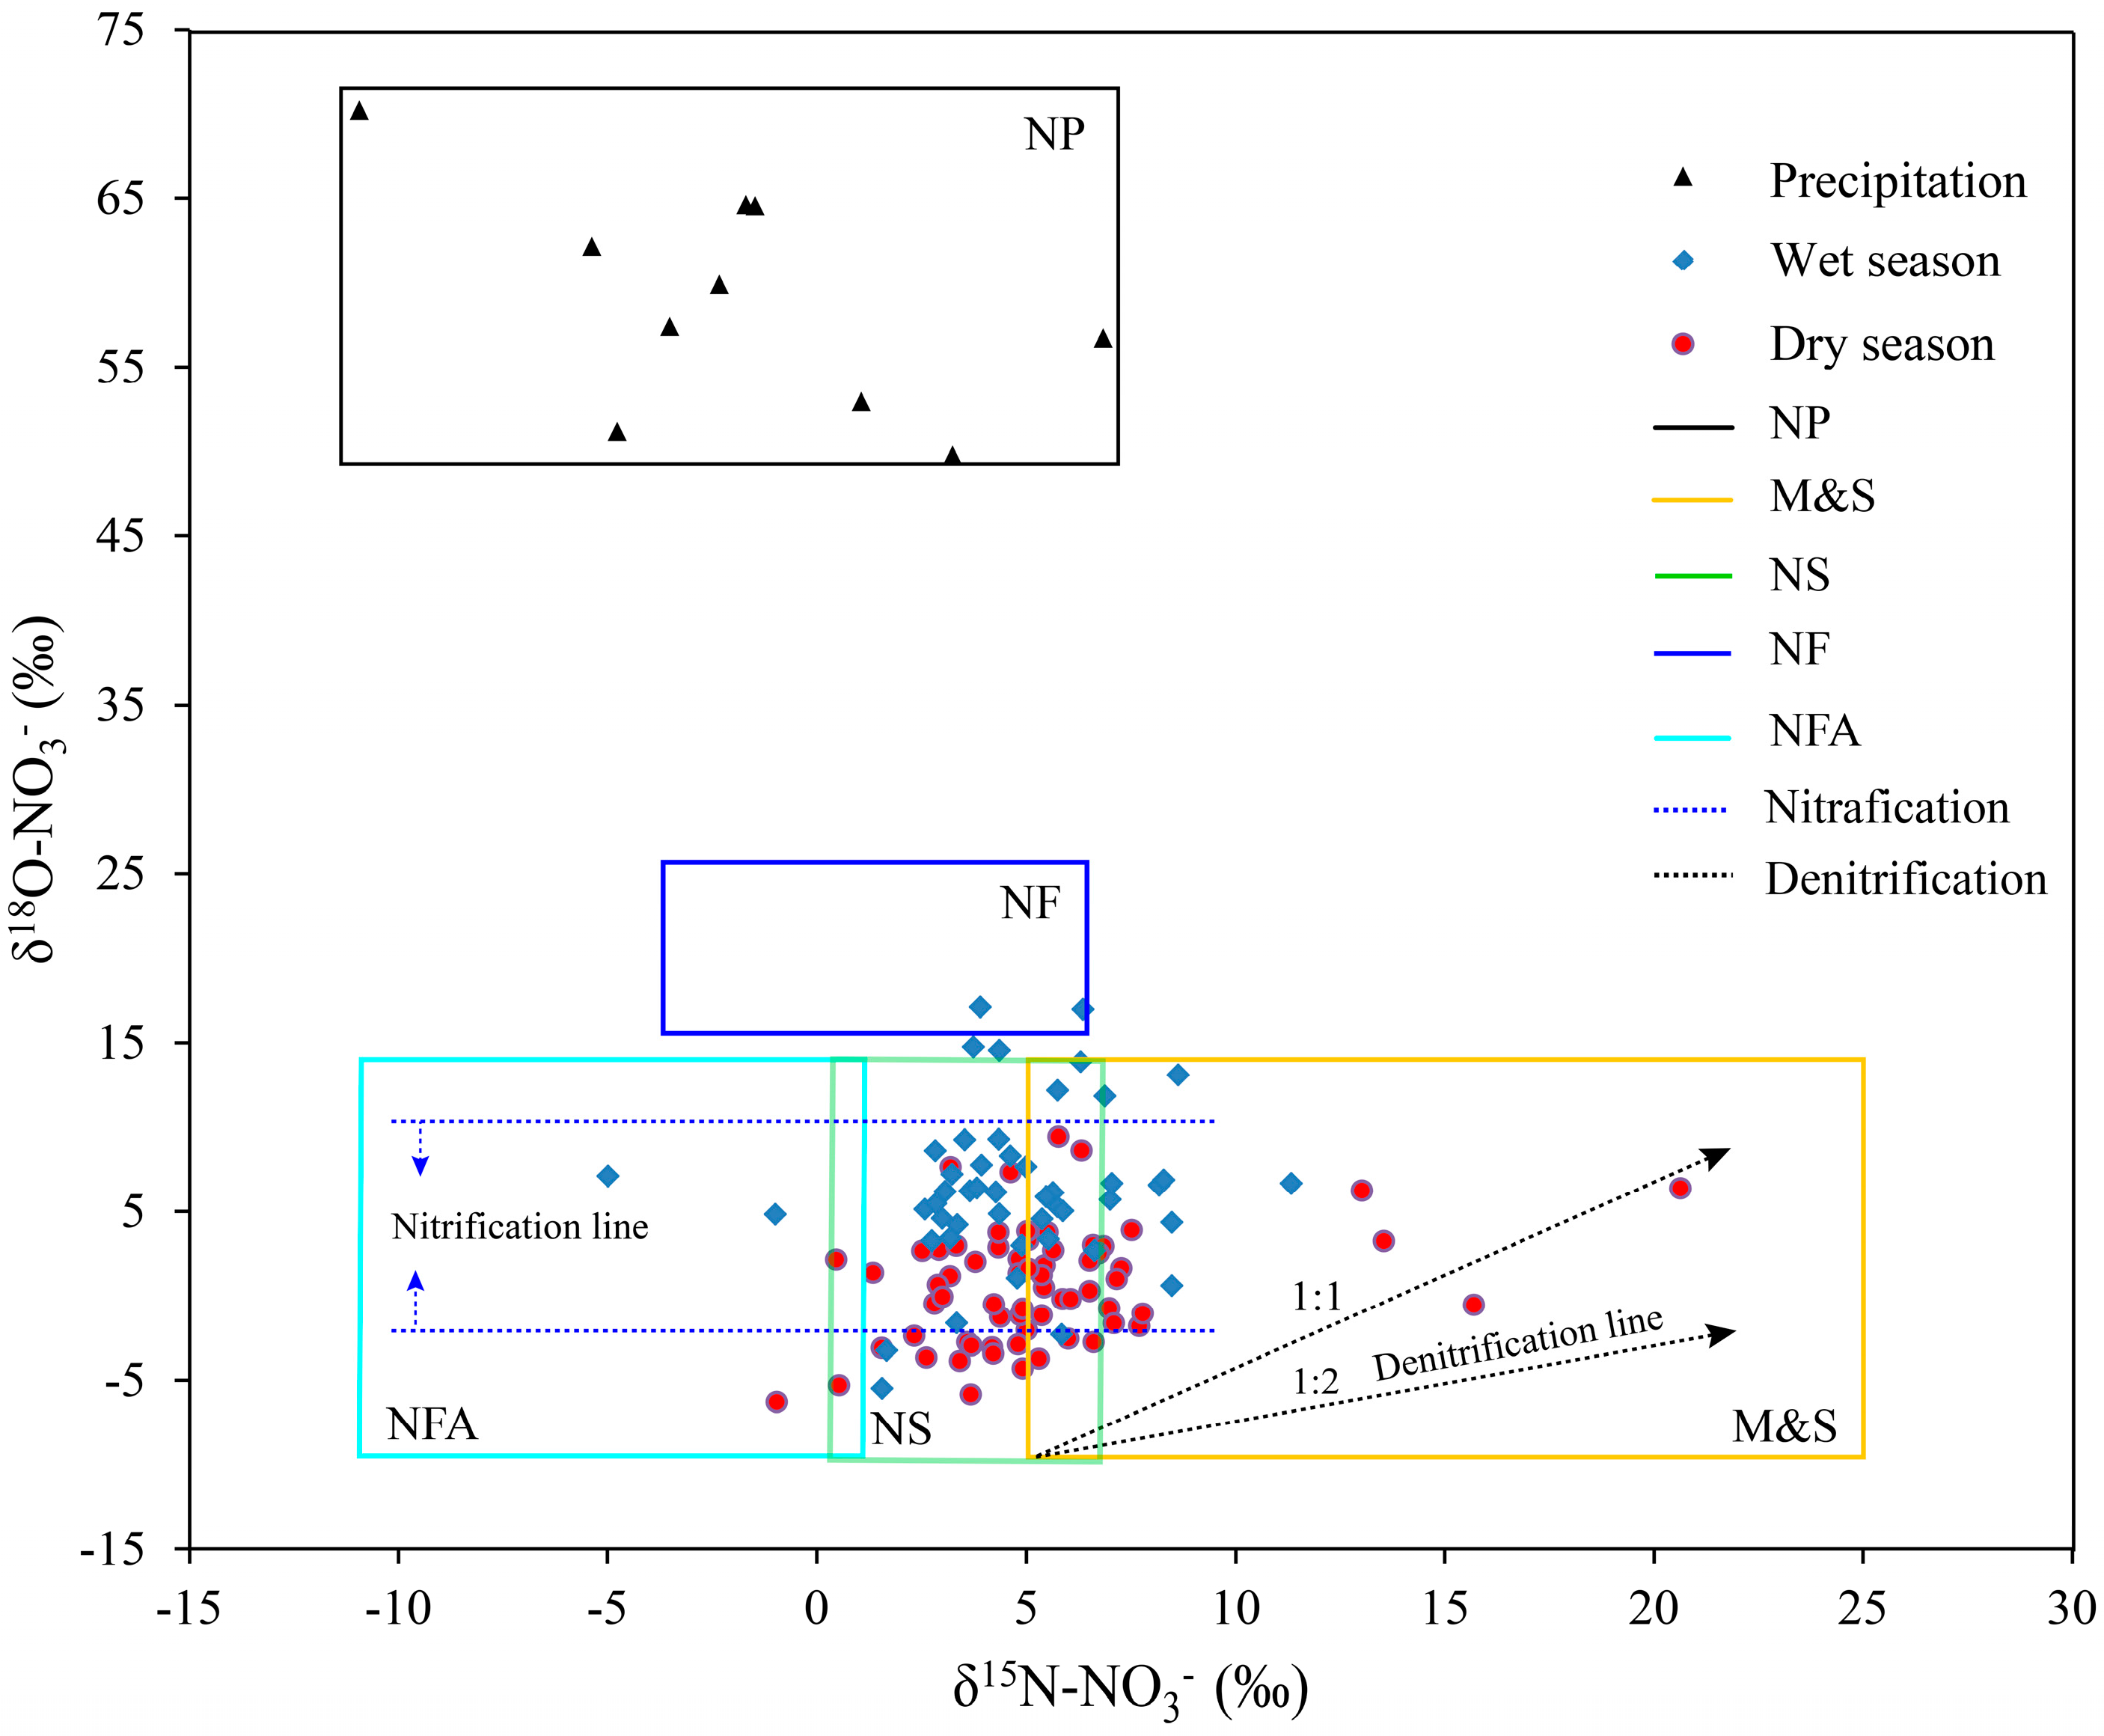
3.2.1. Nitrate Isotope Characteristics and Qualitative Analysis of Potential Sources

A dual isotope bi-plot approach (δ15N-NO3 and δ18O-NO3) is adopted to qualitatively identify predominant NO3 sources for surface water in different periods [4]. The ranges of δ15N-NO3 and δ18O-NO3 in precipitation were from −10.9‰ to 6.8‰ and from 49.8‰ to 70.2‰, respectively. Other potential source isotopic values (M & S, NS, NF and NFA) were based on the relevant literature [8,31,32,33,34,35,36,37,38,39,40], as shown by boxes in Figure 5.
It is clear to see nitrate concentrations being affected by the five sources. Large parts of samples fall into the M & S and NS source windows, demonstrating that manure, sewage, and soil nitrogen might be the dominant sources in this watershed. As shown in Figure 5, the δ18O values in surface water varied more during the sampling period than δ15N values. Nitrate from atmosphere deposition was generally enriched in δ18O, because of isotopic exchange reactions involving ozone (O3) that is anomalously enriched in heavy oxygen isotopes [5]. Moreover, δ15N-NO3 in precipitation during wet season (mean: −6.14‰, n = 4) was much lower than that in dry season (mean: 0.94‰, n = 6). This seasonal isotopic pattern was similar to previous studies [41]. Isotope shift in NOx and lightning inputs were regarded as main reasons [5,9].
The extreme values of δ15N-NO3 (minimum: −5‰, maximum: 20.7‰) in surface water were found at ZSW in May and December, separately. ZSW has the largest proportion of crop land and water body. High level of NH4+ fertilizers was used as base fertilizers for rice around May to June. The lowest δ15N-NO3 value was the result of isotopic fractionation from microbial nitrification process. The Zhuchong reservoir in ZSW was a place raising ducks, and three livestock farms (mostly feeding pigs and sheep) were near the monitoring site. Animal wastes could have been discharged into the stream directly, and manure for crops could have seeped into surface water after irrigation. The highest δ15N value was derived from manure and sewage in ZSW.

3.2.2. Nitrification Processes of Ammonia

Given the heavy application of ammonia-containing fertilizers and high ammonia concentration in precipitation, nitrification process in surface water in this region should be taken into account. During nitrification process (NH4+ oxidized to NO3), it has revealed that there exists considerable isotopic exchange of oxygen in H2O and NO3. The variation range of δ18O offers useful information to identify nitrates derived from microbial nitrification. NO3 generated via the nitrification process contains one O atom from dissolved O2 and the others from H2O [9,42]. Thus, δ18O-NO3 can be interpreted as a mixture of two oxygen atoms from H2O and one from O2. The expected δ18O value of NO3 can be estimated as follows:
δ18O-NO3 = 1/3(δ18O-O2) + 2/3(δ18O-H2O)
where δ18O-H2O and δ18O-O2 were assumed to be O atoms of ambient H2O and O2, respectively. The δ18O value in the atmosphere was +23.5‰ and the δ18O values in water range from −16.7‰ to 4.4‰, which were calculated using δ18O in precipitation and surface water in the study area. Therefore, the range of δ18O derived from nitrification of NH4+ was from −3.3‰ to +10.78‰, which was close to (but a little narrower than) the values found in other studies (−5‰–+15‰) [43,44]. The local theoretical nitrification lines provide a referable range for nitrification (as shown in Figure 5).

3.2.3. Denitrification Process

Denitrification is a process that leads to an increase of δ15N-NO3 and δ18O-NO3 as NO3 concentration decreases. Some studies reported that this process causes δ15N and δ18O to increase in ratios roughly from 2:1 to 1:1 that indicate evidence of denitrification [5]. In our study, the roughly 2:1 to 1:1 enrichment of δ15N and δ18O were not found during wet and dry seasons (as shown in Figure 5). Thus, denitrification processes in surface water could be neglected in this area.
The observed linear ratios between the δ18O and δ15N values of the five sub-watersheds were below 0.5 or above 2.3, which implied that no obvious denitrification has occurred in the sub-watersheds. Moreover, the average depth of stream was less than 2 meters and fish in streams did well, which reflected that the dissolved oxygen in surface water should be above 4 mg/L [45]. The occurrence of the denitrification process requires anaerobic conditions, where dissolved oxygen concentrations could not be higher than 2 mg/L [46]. Thus, the denitrification in surface water can be ignored in the study area. The fact that denitrification seldom occurred in surface water was also found in many other studies [25,34,35,36,37].

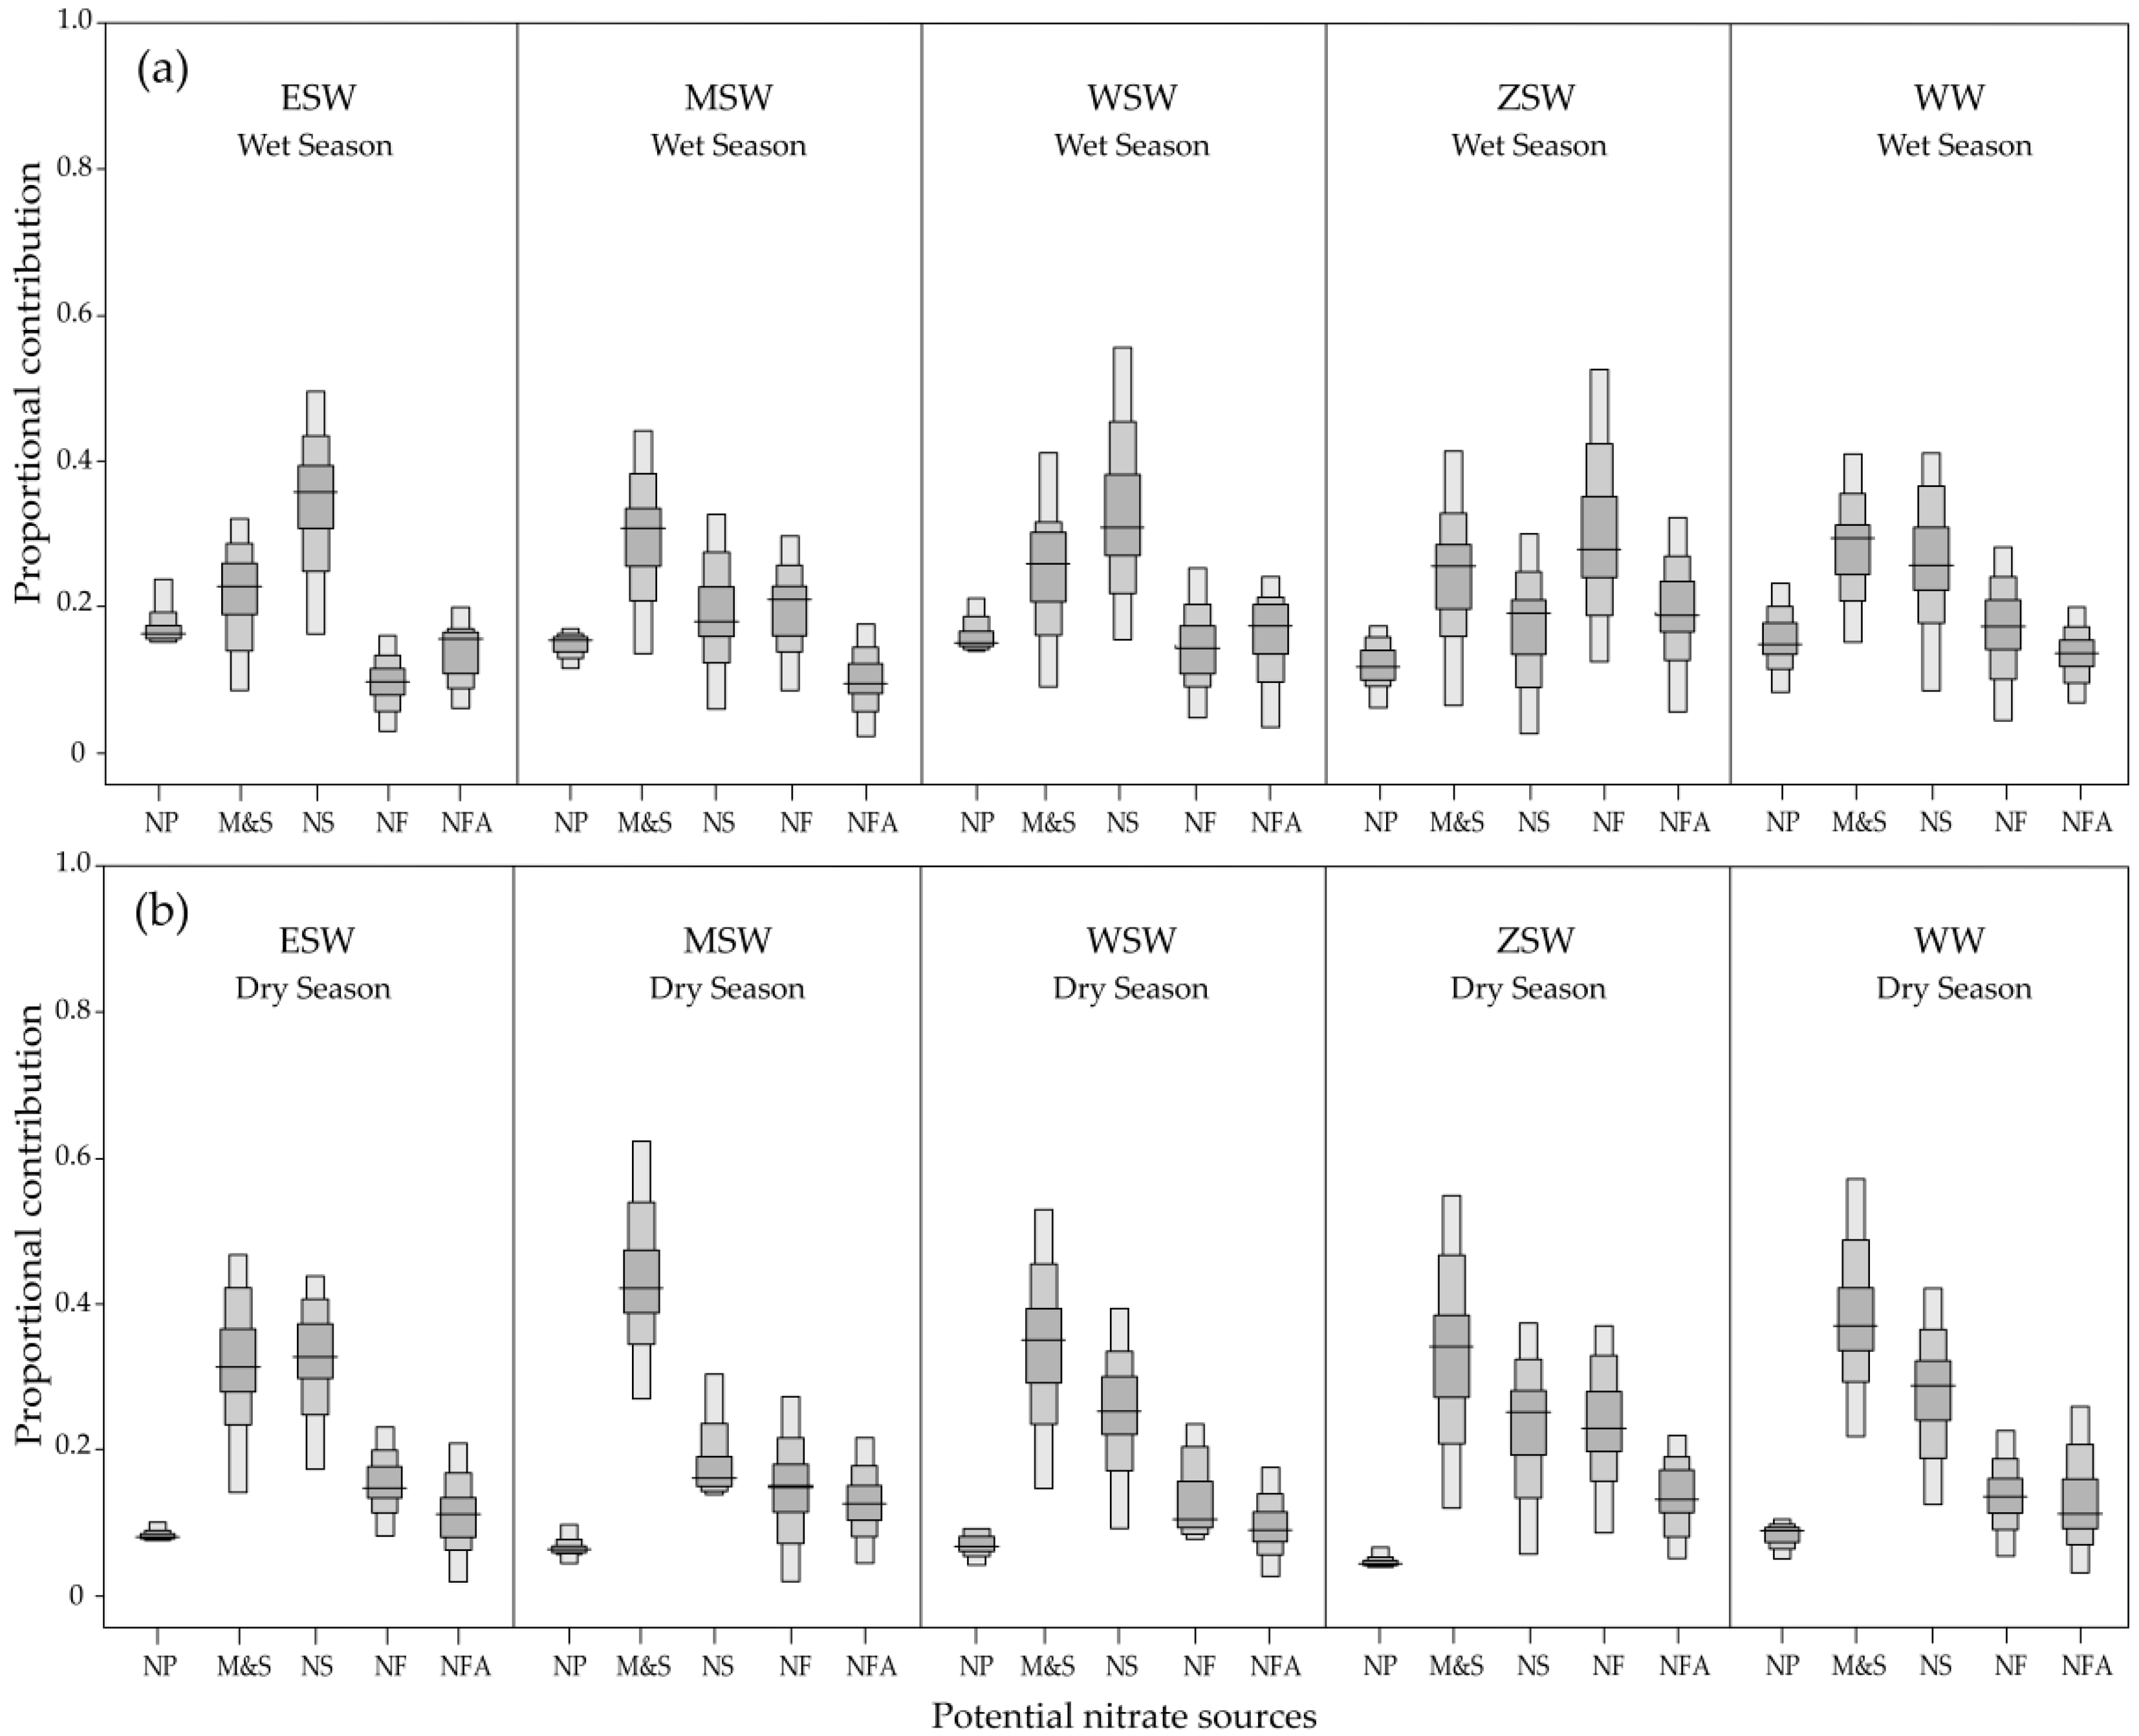
3.3. Evaluation of Proportional Contributions of Different Nitrate Sources

After analyzing the potential nitrate sources, the contribution proportions of each nitrate source to the mixtures of the stream samples can be evaluated for different sub-watersheds. Dual isotopes of nitrate were applied to calculate proportional contributions of the five nitrate sources (NP, M & S, NS, NF, and NFA) in both wet and dry seasons based on the SIAR model.
The source values of δ15N-NO3 and δ18O-NO3 for NP were measured from the precipitation samples in the watershed (as shown in Table 3); The δ18O values that nitrified from NH4+ in fertilizer and rainfall were calculated using isotopic signatures of O2 and H2O in the study area (see Section 3.2.2 for details). Lilliefors test was conducted to verify that the δ15N and δ18O values of NP and NFA sources were normally distributed. Other end member isotopic compositions were obtained from relevant studies [8,31,32,33,34,35,36,37,38,39,40]. It was assumed that the fractionation factors equal zero, as denitrification did not occur in surface water in the study area. As shown in Figure 6, confidence intervals of the model results revealed information of nitrate source probability distribution. The contribution proportions of different sub-watersheds in different sampling periods (wet season and dry season) were estimated using the posterior mean values (see details in Table 4) in the following analysis. The Dirichlet distributions in the model treated input nitrate sources as independent and made the mean proportions of output to sum to unity. Thus, it is meaningful to use the posterior mean values straightforwardly as the estimations of sources proportions than median values or maximum posterior probability values (mode values) [24,25].
The SIAR model results showed that source contributions varied significantly among different rainfall conditions and different land uses. For the whole watershed, M & S was the largest nitrate contributor, accounting for 28% and 36% during wet and dry seasons, respectively. The output amount of M & S was relatively stable as human wastes or manure usage only change within a narrow range, but the discharge of stream was much lower in dry season than in wet season, so the proportion of M & S was much higher in dry season under this condition. Relative studies in Flanders, Belgium and Panxi River, West China, also found similar results [34,38]. Moreover, NS was another major nitrate source, contributing about 24% to 27% from wet season to dry season. By contrast, NP, NF, and NFA contributed more NO3 in wet season than those in dry season because precipitation in the wet season was about twice more than that in dry season, which brought more atmospheric nitrogen deposition and carried more fertilizers from crop fields to streams. It can be concluded that rainfall was regarded as a driving force for nitrogen transportation from lands to rivers.
As for the sub-watersheds, NS contributed much more in ESW (from 36% to 31% in wet season to dry season) than other nitrate sources and in other sub-watersheds. It was attributed to the fact that ESW has relatively higher forests coverage (about 79.82%), where soils held more organics (tree leaves) and moisture that were more suitable for nitrification processes of microbial activities. Nitrification from soil nitrogen acted as dominant source to stream in forest areas were also found in other studies [36,47,48]. In MSW, the contribution of M & S was the highest in both wet and dry seasons (mean probability estimations (MPE) were 31% and 42%, respectively), followed by NS and NF (MPE about 20% and 18% during wet and dry seasons). The largest proportion of M & S was due to the most inhabitants and domestic animals in this area. This result was in agreement with the analysis of organic nitrogen and TN in Section 3.1, and the source allocation pattern was similar to previous findings in other areas [36,37]. NS contributed the most (MPE 29%) in WSW during wet season, whereas M & S occupied the largest proportion (37%) in dry season. Relatively larger forest area (73.2%) and high density of human residence caused this phenomenon. In ZSW, the contribution of NF was the highest (MPE 27%) during wet season. However, the contribution of NF was not higher (MPE 23%) than M & S (MPE 32%) and NS (MPE 24%) in dry season. Furthermore, NP in ZSW was the lowest contributor (only accounting for 4%) in dry season as compared to that in other sub-watersheds. This was attributed to the highest proportion of reservoir, ponds, and crop lands (about 46.59%) that reduced water carrying nutrients into stream. The NS contribution in wet season was lower than that in dry season in ZSW. This result indicated that the larger area of paddy fields (39.39%) with high soil water content during wet season could not be eligible for nitrification processes by microbial activities. In different sub-watersheds with different land covers and anthropologic activities, the nitrate source proportional contributions varied significantly.
As a whole, the nitrate sources estimated by SIAR were reasonable and consistent with the qualitative analysis results present in Section 3.1 and Section 3.2. The SIAR model offers many advantages, as it incorporates multiple nitrate sources, uncertainty in different sources, and isotopic fractionation [3,19]. However, some factors also can lead to some uncertainties in the results. In this study, the end member isotopic signatures of M & S, NF, NFA, and NS were based on other relevant studies (rather than measured directly in this study). In addition, sources from manure and sewage, as well as nitrate derived from NH4+ fertilizer and rainfall, were difficult to distinguish. Moreover, the posterior distributions of the output have a large range, and dynamic varieties of nitrate source contributions at finer time scales should be further studied.

4. Conclusions

Multi-tributaries with different land uses perplexed nitrate sources identification in the Huashan watershed located in the upper stream of drink water source of Chuzhou city, China. In this study, coupled water chemistry and dual isotopes were applied to elucidate nitrate characteristics and sources in this watershed. The results demonstrated that nitrate content in surface water was relatively low in the downstream (<10 mg/L), but spatial heterogeneities were remarkable among different sub-watersheds. Extremely high nitrate was observed at the source of the river in one of the sub-watersheds, which exhibited an exponential decline along the stream due to dilution, absorption by aquatic plants, and high forest cover. Higher ammonia in precipitation and surface water may also lead to increased nitrate concentration via microbial nitrification. Meanwhile, isotope analysis revealed no obvious denitrification occurring in this area.
Proportional contributions of five potential nitrate sources were estimated using a Bayesian isotope mixing method. The results indicated nitrate sources varied significantly among different rainfall conditions, land use types, as well as anthropologic activities. In the whole watershed, M & S and NS were major nitrate sources in both wet and dry seasons (from 28% to 36% for M & S and from 24% to 27% for NS, respectively). As for sub-watersheds, NS was the largest contributor where forest accounted for the most (79.82%), while manure and synthetic fertilizers also had great influence on nitrate output in intensive agricultural areas.
In summary, coupling dual isotopes of nitrate (δ15N-NO3 and δ18O-NO3, simultaneously) with a Bayesian isotope mixing model offers a useful and practical way to qualitatively analyze nitrate sources and transformations as well as quantitatively estimate the contributions of potential nitrate sources in surface water. Furthermore, long-term field sampling from April 2012 to December 2014 helped to capture temporal dynamics of nitrogen in the study area. It was the first time to thoroughly understand the nitrogen characteristics and nitrate source proportions in Jianghuan hilly region, eastern China. With the assessment of nitrate sources and characteristics, effective management strategies can be implemented to reduce N export and improve water quality in drinking water source watersheds in this region. A domestic sewage treatment system (pipelines and disposal ponds) is needed to reduce wastewater flow into the stream directly. In addition, application of manure and compound fertilizers should be adjusted based on soil nutrition, crop demands, and rainfall conditions. Wetlands and aquatic plants can sustain water quality and need to be protected.

Acknowledgments

This work was supported by the Ministry of Water Resources’ Special Funds for Scientific Research on Public Causes (201201026) and Innovation Project for Graduate Students in Jiangsu Province (KYZZ_0144). We thank our Chuzhou water chemistry and isotopes sampling group members, especially Yanting Wang, Songping Liu, Kun Guo, Yang Wang, Wei Zhang, Yang Huang, Shan Deng, Chao Zhao, and others. Valuable comments and suggestions provided by Isaac Hopkins are gratefully appreciated. We would also like to thank the editors and anonymous reviewers for their excellent suggestions for improving the manuscript.

Author Contributions

All authors contributed to the design and development of this manuscript. Meng Wang participated in field sampling, analyzed the data, and wrote the manuscript. Baohong Lu conceived the experiments, discussed the results, and revised the manuscript. Jianqun Wang and Hanwen Zhang participated in field sampling and discussion. Henry Lin and Li Guo contributed to the discussion of the results and analysis, and revised the manuscript.

Conflicts of Interest

The authors declare no conflict of interest.

References

  1. Diaz, R.J. Overview of hypoxia around the world. J. Environ. Qual. 2001, 30, 275–281. [Google Scholar] [CrossRef] [PubMed]
  2. Yang, C.S. Research on esophageal cancer in china: A review. Cancer Res. 1980, 40, 2633–2644. [Google Scholar] [PubMed]
  3. Xue, D.; Botte, J.; De Baets, B.; Accoe, F.; Nestler, A.; Taylor, P.; Van Cleemput, O.; Berglund, M.; Boeckx, P. Present limitations and future prospects of stable isotope methods for nitrate source identification in surface- and groundwater. Water Res. 2009, 43, 1159–1170. [Google Scholar] [CrossRef] [PubMed]
  4. Zeng, H.A.; Wu, J.L. Tracing the Nitrate Sources of the Yili River in the Taihu Lake Watershed: A Dual Isotope Approach. Water 2015, 7, 188–201. [Google Scholar] [CrossRef]
  5. Kendall, C.; Elliott, E.M.; Wankel, S.D. Tracing anthropogenic inputs of nitrogen to ecosystems. In Stable Isotopes in Ecology and Environmental Science, 2nd ed.; Blackwell: Oxford, UK, 2007; Chapter 12; pp. 375–449. [Google Scholar]
  6. Ma, J.; Chen, X.; Huang, B.; Shi, Y.; Chi, G.Y.; Lu, C.Y. Utilizing water characteristics and sediment nitrogen isotopic features to identify non-point nitrogen pollution sources at watershed scale in Liaoning province, china. Environ. Sci. Pollut. Res. 2015, 22, 2699–2707. [Google Scholar] [CrossRef] [PubMed]
  7. Xu, S.G.; Kang, P.P.; Sun, Y. A stable isotope approach and its application for identifying nitrate source and transformation process in water. Environ. Sci. Pollut. Res. 2016, 23, 1133–1148. [Google Scholar] [CrossRef] [PubMed]
  8. Liu, T.; Wang, F.; Michalski, G.; Xia, X.; Liu, S. Using 15N, 17O, and 18O to determine nitrate sources in the Yellow River, China. Environ. Sci. Technol. 2013, 47, 13412–13421. [Google Scholar] [CrossRef] [PubMed]
  9. Heaton, T. Isotopic studies of nitrogen pollution in the hydrosphere and atmosphere: A review. Chem. Geol. 1986, 59, 87–102. [Google Scholar] [CrossRef]
  10. Widory, D.; Petelet-Giraud, E.; Négrel, P.; Ladouche, B. Tracking the sources of nitrate in groundwater using coupled nitrogen and boron isotopes: A synthesis. Environ. Sci. Technol. 2005, 39, 539–548. [Google Scholar] [CrossRef] [PubMed]
  11. Sigman, D.M.; Casciotti, K.L.; Andreani, M.; Barford, C.; Galanter, M.; Bohlke, J.K. A bacterial method for the nitrogen isotopic analysis of nitrate in seawater and freshwater. Anal. Chem. 2001, 73, 4145–4153. [Google Scholar] [CrossRef] [PubMed]
  12. Casciotti, K.L.; Sigman, D.M.; Hastings, M.G.; Bohlke, J.K.; Hilkert, A. Measurement of the oxygen isotopic composition of nitrate in seawater and freshwater using the denitrifier method. Anal. Chem. 2002, 74, 4905–4912. [Google Scholar] [CrossRef] [PubMed]
  13. Xue, D.; De Baets, B.; Botte, J.; Vermeulen, J.; Van Cleemput, O.; Boeckx, P. Comparison of the silver nitrate and bacterial denitrification methods for the determination of nitrogen and oxygen isotope ratios of nitrate in surface water. Rapid Commun. Mass Spectrom. 2010, 24, 833–840. [Google Scholar] [CrossRef] [PubMed]
  14. Elliott, E.; Kendall, C.; Wankel, S.D.; Burns, D.; Boyer, E.; Harlin, K.; Bain, D.; Butler, T. Nitrogen isotopes as indicators of NOx source contributions to atmospheric nitrate deposition across the midwestern and northeastern united states. Environ. Sci. Technol. 2007, 41, 7661–7667. [Google Scholar] [CrossRef] [PubMed]
  15. Aravena, R.; Evans, M.; Cherry, J.A. Stable isotopes of oxygen and nitrogen in source identification of nitrate from septic systems. Ground Water 1993, 31, 180–186. [Google Scholar] [CrossRef]
  16. Wassenaar, L.I. Evaluation of the origin and fate of nitrate in the Abbotsford aquifer using the isotopes of 15N and 18O in NO3. Appl. Geochem. 1995, 10, 391–405. [Google Scholar] [CrossRef]
  17. Fukada, T.; Hiscock, K.M.; Dennis, P.F.; Grischek, T. A dual isotope approach to identify denitrification in groundwater at a river-bank infiltration site. Water Res. 2003, 37, 3070–3078. [Google Scholar] [CrossRef]
  18. Moore, J.W.; Semmens, B.X. Incorporating uncertainty and prior information into stable isotope mixing models. Ecol. Lett. 2008, 11, 470–480. [Google Scholar] [CrossRef] [PubMed]
  19. Whitman, T.; Lehmann, J. A dual-isotope approach to allow conclusive partitioning between three sources. Nat. Commun. 2015, 6. [Google Scholar] [CrossRef] [PubMed]
  20. Parnell, A.C.; Phillips, D.L.; Bearhop, S.; Semmens, B.X.; Ward, E.J.; Moore, J.W.; Jackson, A.L.; Grey, J.; Kelly, D.J.; Inger, R. Bayesian stable isotope mixing models. Environmetrics 2013, 24, 387–399. [Google Scholar] [CrossRef]
  21. Jin, J.; Yuan, C.; Jiang, S.; Xu, H. Assessment of drought resistance ability for pond and retaining dam irrigated area of Jianghuai hilly area based on water supply and demand balance analysis. J. Hydraul. Eng. 2013, 44, 534–541. (In Chinese) [Google Scholar]
  22. Widory, D.; Kloppmann, W.; Chery, L.; Bonnin, J.; Rochdi, H.; Guinamant, J.-L. Nitrate in groundwater: An isotopic multi-tracer approach. J. Contam. Hydrol. 2004, 72, 165–188. [Google Scholar] [CrossRef] [PubMed]
  23. Chinese Environmental Protection Agency. Water Quality-Determination of Nitrate-Nitrogen-Ultraviolet Spectrophotometry (HJ/T 346–2007); China Environmental Science Press: Beijing, China, 2007. (In Chinese) [Google Scholar]
  24. Massoudieh, A.; Kayhanian, M. Bayesian chemical mass balance method for surface water contaminant source apportionment. J. Environ. Eng. 2012, 139, 250–260. [Google Scholar] [CrossRef]
  25. Yang, L.; Han, J.; Xue, J.; Zeng, L.; Shi, J.; Wu, L.; Jiang, Y. Nitrate source apportionment in a subtropical watershed using Bayesian model. Sci. Total Environ. 2013, 463, 340–347. [Google Scholar] [CrossRef] [PubMed]
  26. Parnell, A.C.; Inger, R.; Bearhop, S.; Jackson, A.L. Source partitioning using stable isotopes: Coping with too much variation. PLoS ONE 2010, 5. [Google Scholar] [CrossRef] [PubMed] [Green Version]
  27. Chinese Environmental Protection Agency. National Surface Water Environmental Quality Standards of China (GB3838-2002); China Standards Press: Beijing, China, 2002. (In Chinese) [Google Scholar]
  28. Panno, S.; Kelly, W.; Martinsek, A.; Hackley, K.C. Estimating background and threshold nitrate concentrations using probability graphs. Ground Water 2006, 44, 697–709. [Google Scholar] [CrossRef] [PubMed]
  29. Peterson, E.W.; Benning, C. Factors influencing nitrate within a low-gradient agricultural stream. Environ. Earth Sci. 2013, 68, 1233–1245. [Google Scholar] [CrossRef]
  30. Likens, G.E.; Buso, D.C. Variation in stream water chemistry throughout the hubbard brook valley. Biogeochemistry 2006, 78, 1–30. [Google Scholar] [CrossRef]
  31. Choi, W.-J.; Han, G.-H.; Lee, S.-M.; Lee, G.-T.; Yoon, K.-S.; Choi, S.-M.; Ro, H.-M. Impact of land-use types on nitrate concentration and δ15N in unconfined groundwater in rural areas of Korea. Agric. Ecosyst. Environ. 2007, 120, 259–268. [Google Scholar] [CrossRef]
  32. Bateman, A.S.; Kelly, S.D. Fertilizer nitrogen isotope signatures. Isot. Environ. Health Stud. 2007, 43, 237–247. [Google Scholar] [CrossRef] [PubMed]
  33. Yang, Y.Y.; Toor, G.S. δ15N and δ18O reveal the sources of nitrate-nitrogen in urban residential storm water runoff. Environ. Sci. Technol. 2016, 50, 2881–2889. [Google Scholar] [CrossRef] [PubMed]
  34. Zhang, Q.Q.; Wang, X.K.; Sun, F.X.; Sun, J.C.; Liu, J.T.; Ouyang, Z.Y. Assessment of temporal and spatial differences of source apportionment of nitrate in an urban river in China, usingδ15N and δ18O values and an isotope mixing model. Environ. Sci. Pollut. Res. 2015, 22, 20226–20233. [Google Scholar] [CrossRef] [PubMed]
  35. Xing, M.; Liu, W.G. Using dual isotopes to identify sources and transformations of nitrogen in water catchments with different land uses, Loess Plateau of China. Environ. Sci. Pollut. Res. 2016, 23, 388–401. [Google Scholar] [CrossRef] [PubMed]
  36. Lu, L.; Cheng, H.G.; Pu, X.; Liu, X.L.; Cheng, Q.D. Nitrate behaviors and source apportionment in an aquatic system from a watershed with intensive agricultural activities. Environ. Sci. Process. Impacts 2015, 17, 131–144. [Google Scholar] [CrossRef] [PubMed]
  37. Ding, J.; Xi, B.; Gao, R.; He, L.; Liu, H.; Dai, X.; Yu, Y. Identifying diffused nitrate sources in a stream in an agricultural field using a dual isotopic approach. Sci. Total Environ. 2014, 484, 10–18. [Google Scholar] [CrossRef] [PubMed]
  38. Xue, D.; De Baets, B.; Van Cleemput, O.; Hennessy, C.; Berglund, M.; Boeckx, P. Use of a Bayesian isotope mixing model to estimate proportional contributions of multiple nitrate sources in surface water. Environ. Pollut. 2012, 161, 43–49. [Google Scholar] [CrossRef] [PubMed]
  39. Kim, K.H.; Yun, S.T.; Mayer, B.; Lee, J.H.; Kim, T.S.; Kim, H.K. Quantification of nitrate sources in groundwater using hydrochemical and dual isotopic data combined with a Bayesian mixing model. Agric. Ecosyst. Environ. 2015, 199, 369–381. [Google Scholar] [CrossRef]
  40. Zhang, Y.P.; Zhou, A.G.; Zhou, J.W.; Liu, C.F.; Cai, H.S.; Liu, Y.D.; Xu, W. Evaluating the sources and fate of nitrate in the alluvial aquifers in the shijiazhuang rural and suburban area, China: Hydrochemical and multi-isotopic approaches. Water 2015, 7, 1515–1537. [Google Scholar] [CrossRef]
  41. Hastings, M.G.; Steig, E.; Sigman, D. Seasonal variations in N and O isotopes of nitrate in snow at summit, Greenland: Implications for the study of nitrate in snow and ice cores. J. Geophys. Res. Atmos. 2004, 109. [Google Scholar] [CrossRef]
  42. Hollocher, T.C. Source of the oxygen atoms of nitrate in the oxidation of nitrite by nitrobacter agilis and evidence against a P-O-N anhydride mechanism in oxidative phosphorylation. Arch. Biochem. Biophys. 1984, 233, 721–727. [Google Scholar] [CrossRef]
  43. Williard, K.W.; DeWalle, D.R.; Edwards, P.J.; Sharpe, W.E. 18O isotopic separation of stream nitrate sources in mid-appalachian forested watersheds. J. Hydrol. 2001, 252, 174–188. [Google Scholar] [CrossRef]
  44. Mayer, B.; Bollwerk, S.M.; Mansfeldt, T.; Hütter, B.; Veizer, J. The oxygen isotope composition of nitrate generated by nitrification in acid forest floors. Geochim. Cosmochim. Acta 2001, 65, 2743–2756. [Google Scholar] [CrossRef]
  45. Chesapeake Bay Program. Dissolved Oxygen. Available online: http://www.chesapeakebay.net/discover/bayecosystem/dissolvedoxygen (accessed on 5 April 2016).
  46. Rivett, M.O.; Buss, S.R.; Morgan, P.; Smith, J.W.; Bemment, C.D. Nitrate attenuation in groundwater: A review of biogeochemical controlling processes. Water Res. 2008, 42, 4215–4232. [Google Scholar] [CrossRef] [PubMed]
  47. Barnes, R.T.; Raymond, P.A. Land-use controls on sources and processing of nitrate in small watersheds: Insights from dual isotopic analysis. Ecol. Appl. 2010, 20, 1961–1978. [Google Scholar] [CrossRef] [PubMed]
  48. Burns, D.A.; Boyer, E.W.; Elliott, E.M.; Kendall, C. Sources and transformations of nitrate from streams draining varying land uses: Evidence from dual isotope analysis. J. Environ. Qual. 2009, 38, 1149–1159. [Google Scholar] [CrossRef] [PubMed]
Figure 1. Location of the Huashan watershed in eastern China (a) and (b), along with its sub-watersheds, water sampling sites (dots), and land use types (c). The whole watershed is divided into four sub-watersheds (red curves) based on the tributaries: Eastern sub-watershed (ESW), Middle sub-watershed (MSW), Western sub-watershed (WSW), and Zhuyuangou sub-watershed (ZSW).
Water 08 00355 g001
Figure 2. NH4+-N and NO3-N concentrations in precipitation and surface water in different sub-watersheds and the results of one way ANOVA. Boxplots illustrate the 25th, 50th, and 75th percentiles; the whiskers indicate the 5th and 95th percentile; diamonds in boxplots denote mean values. Letters above the upper whiskers are ANOVA results, and n is sample size.
Water 08 00355 g002
Figure 3. NH4+-N concentration of surface water in different sampling sites and results of one-way ANOVA.
Water 08 00355 g003
Figure 4. NO3-N concentration of surface water in different sampling sites and results of one-way ANOVA.
Water 08 00355 g004
Figure 5. Range of δ15N and δ18O values for potential nitrate sources and in the Huashan watershed. NP means NO3 in precipitation; M & S for manure and sewage; NS for soil nitrogen; NF for NO3 fertilizer; and NFA for NO3 nitrified from NH4+ in fertilizer and rainfall.
Water 08 00355 g005
Figure 6. Proportional contributions of five potential nitrate sources in wet season (a) and dry season (b) estimated by SIAR (Stable Isotope Analysis in R). Boxplot illustrate the 90%, 75%, 50%, and 1% confidence intervals from light to dark.
Water 08 00355 g006
Table 1. Drainage areas and land uses of the Huashan watershed (WW) and its sub-watersheds. ESW means Eastern sub-watershed, MSW for Middle sub-watershed, WSW for Western sub-watershed, and ZSW for Zhuyuangou sub-watershed.
WatershedsLand Use Types
ForestCrop LandResidentialBare LandWater BodySum
ESWArea (km2)7.041.060.010.210.58.82
Proportion (%)79.8212.020.112.385.67100
MSWArea (km2)32.9712.340.933.041.1950.47
Proportion (%)65.3324.451.846.022.36100
WSWArea (km2)13.143.820.130.570.2917.95
Proportion (%)73.221.280.723.181.62100
ZSWArea (km2)1.31.040.010.10.192.64
Proportion (%)49.2439.390.383.797.2100
WWArea (km2)54.7518.161.063.892.2880.13
Proportion (%)68.3322.661.324.852.84100
Table 2. Ratios between NH4+/-N, NO3-N, NO2-N, DIN, DON and TN in different sub-watersheds.
WatershedsNH4+/TN (%)NO3/TN (%)NO2/TN (%)DIN/TN (%)DON/TN (%)
ESW12.1452.972.0967.232.8
MSW10.5845.971.8258.3741.63
WSW8.4768.221.3678.0521.95
ZSW16.4142.392.4861.2838.72
Notes: NH4+-N means ammonia nitrogen; NO3-N for nitrate nitrogen; NO2-N for nitrite nitrogen; DIN for dissolved inorganic nitrogen; DON for dissolved organic nitrogen; and TN for total nitrogen; ESW means Eastern sub-watershed; MSW for Middle sub-watershed; WSW for Western sub-watershed; and ZSW for Zhuyuangou sub-watershed.
Table 3. Mean and standard deviation of nitrate concentration and isotopic signatures.
WatershedsSitesLong. (°)Lat. (°)TN (mg/L)NO3 (mg N /L)NH4+ (mg/L)δ15N-NO3 (‰)δ18O-NO3 (‰)δD-H2O (‰)δ18O-H2O (‰)
ESWER118.2332.281.48 ± 0.150.17 ± 0.100.10 ± 0.126.5 ± 0.9−0.4 ± 3.7−40.0 ± 7.1−5.5 ± 1.4
ES118.2232.281.17 ± 0.650.68 ± 0.530.14 ± 0.166.2 ± 1.43.6 ± 4.3−37.3 ± 12.3−5.2 ± 2.3
MSWMR1118.2532.261.42 ± 0.360.35 ± 0.260.19 ± 0.224.5 ± 1.81.2 ± 3.9−41.1 ± 8.0−5.4 ± 1.5
MS1118.2232.250.85 ± 0.200.56 ± 0.450.06 ± 0.014.9 ± 1.35.0 ± 5.7−41.1 ± 12.8−5.2 ± 2.0
MR2118.1932.231.38 ± 0.780.72 ± 0.750.06 ± 0.044.7 ± 1.9−1.2 ± 2.6−41.2 ± 8.4−5.0 ± 2.0
MS2118.2032.250.93 ± 0.830.15 ± 0.210.05 ± 0.023.2 ± 5.62.2 ± 5.5−34.8 ± 15.7−3.9 ± 2.4
MS3118.2032.260.79 ± 0.020.08 ± 0.070.07 ± 0.063.9 ± 2.21.8 ± 4.7−38.4 ± 12.0−4.47 ± 2.1
MS4118.2232.271.19 ± 0.830.40 ± 0.190.24 ± 0.476.1 ± 4.13.2 ± 8.7−35.8 ± 12.3−4.5 ± 2.1
MS5118.2132.271.02 ± 0.520.53 ± 0.330.12 ± 0.134.6 ± 1.25.1 ± 6.9−37.2 ± 10.4−4.9 ± 1.7
PLF118.2532.262.07 ± 1.680.60 ± 0.560.81 ± 0.67 −67.5 ± 25.7−10.0 ± 3.4
PCL118.1932.252.54 ± 1.560.70 ± 0.461.37 ± 1.12 −61.4 ± 23.5−9.0 ± 2.9
WSWWS1118.1432.267.43 ± 1.606.71 ± 1.480.08 ± 0.02
WS2118.1532.265.26 ± 1.754.49 ± 1.620.09 ± 0.12
WS3118.1532.274.44 ± 1.843.81 ± 1.610.07 ± 0.07
WS4118.1532.272.86 ± 1.422.45 ± 1.390.10 ± 0.182.9 ± 1.84.7 ± 3.6−48.2 ± 14.5−6.9 ± 1.8
WR118.1632.272.53 ± 1.551.90 ± 1.350.14 ± 0.25
WS5118.1732.272.12 ± 1.101.69 ± 1.090.07 ± 0.03
WS6118.1832.281.35 ± 0.680.85 ± 0.580.13 ± 0.126.4 ± 3.02.9 ± 2.6−41.3 ± 7.2−5.5 ± 1.9
WS7118.2032.281.34 ± 0.710.70 ± 0.540.20 ± 0.235.5 ± 1.42.1 ± 4.3−45.2 ± 11.9−6.2 ± 2.5
PWY118.1632.272.73 ± 1.270.69 ± 0.571.58 ± 0.77 −60.1 ± 18.5−8.8 ± 2.3
ZSWZR118.1932.302.18 ± 1.420.18 ± 0.100.36 ± 0.566.1 ± 3.5−2.8 ± 2.0−35.0 ± 11.9−2.9 ± 1.9
ZS118.2032.292.13 ± 2.670.67 ± 0.380.46 ± 0.815.0 ± 5.90.9 ± 4.3−43.4 ± 11.6−5.6 ± 2.6
PZJ118.2132.292.69 ± 2.410.85 ± 0.801.24 ± 0.94−1.9 ± 4.959.0 ± 6.58−46.2 ± 31.1−6.82 ± 3.8
WWWW118.2132.291.48 ± 0.920.72 ± 0.450.21 ± 0.215.8 ± 3.62.2 ± 3.8−46.2 ± 31.1−6.82 ± 3.8
Notes: ESW means Eastern sub-watershed; MSW for Middle sub-watershed; WSW for Western sub-watershed; ZSW for Zhuyuangou sub-watershed; and WW for the whole watershed; TN means total nitrogen; NH4+-N for ammonia nitrogen; NO3-N for nitrate nitrogen; PLF means Longfeng precipitation monitor site; PCL for Chunlei precipitation monitor site; PWY for Wangying precipitation monitor site; and PZJ for Zhengjia precipitation monitor site. Others mean for stream water sample monitor sites.
Table 4. Mean probability estimates of source contributions apportioned by SIAR (Stable Isotope Analysis in R). ESW means Eastern sub-watershed; MSW for Middle sub-watershed; WSW for Western sub-watershed; and ZSW for Zhuyuangou sub-watershed; Wet means nitrate proportional contributions during wet season; Dry means nitrate proportional contributions during dry season.
SourcesESWMSWWSWZSWWW
WetDryWetDryWetDryWetDryWetDry
NP0.180.120.150.080.170.090.110.040.150.09
M & S0.210.290.310.420.260.370.250.320.280.36
NS0.360.310.200.190.290.250.170.240.240.27
NF0.110.160.210.170.140.160.270.230.190.16
NFA0.140.110.130.140.140.120.200.170.140.11

