Article

Development of a Component-Based Modeling Framework for Agricultural Water-Resource Management

1
Department of Rural Systems Engineering, Seoul National University, Seoul 08826, Korea
2
Research Institute for Agriculture and Life Sciences, Seoul National University, Seoul 08826, Korea
3
Institute of Green Bio Science and Technology, Seoul National University, Seoul 08826, Korea
4
Department of Biosystems Engineering, Auburn University, Auburn, AL 36849, USA
5
Department of Agricultural and Biological Engineering & Tropical Research and Education Center, University of Florida, Homestead, FL 33186, USA
6
Department of Agricultural Engineering, Institute of Agriculture and Life Science, Gyeongsang National University, Jinju 52828, Korea
*
Author to whom correspondence should be addressed.
Water 2016, 8(8), 351; https://doi.org/10.3390/w8080351
Submission received: 27 April 2016 / Revised: 10 August 2016 / Accepted: 12 August 2016 / Published: 17 August 2016
(This article belongs to the Special Issue Resilient Water Management in Agriculture)

Abstract

:
Because hydrologic responses of an agricultural watershed are influenced by many natural and man-made factors including pond/reservoir, management practices, and/or irrigation/drainage, strategies of hydrological modeling for the watershed must be case-dependent and thus carefully designed to effectively reflect their roles as critical hydrologic components in simulation processes. In this study, we propose a component-based modeling framework that accommodates a flexible modeling approach to consider a variety of hydrologic processes and management practices, especially irrigation-reservoir operation and paddy-farming practices, in watershed-scale modeling. The objectives of this study are twofold: to develop a COmponent-based Modeling Framework for Agricultural water-Resources Management (COMFARM) using an object-oriented programming technique, and to evaluate its applicability as a modeling tool to predict the responses of an agricultural watershed characterized with diverse land uses in a case study. COMFARM facilitates quick and easy development of watershed-specific hydrologic models by providing multiple interchangeable simulation routines for each hydrologic component considered. COMFARM is developed with the JAVA programming language, using Eclipse software. The framework developed in this study is applied to simulating hydrologic processes of the Seon-Am irrigation-district watershed consisting primarily of reservoir-irrigated rice paddies in South Korea. The application study clearly demonstrates the applicability of the framework as a convenient method to build models for hydrologic simulation of an agricultural watershed. The newly developed modeling framework, COMFARM is expected to serve as a useful tool in watershed management planning by allowing quick development of case-oriented analysis tools and evaluation of management scenarios customized to a specific watershed.

Graphical Abstract

1. Introduction

In the last century, water use has increased at greater than twice the rate of the population growth. By 2025, 1.8 billion people are expected to live in countries or regions with absolute water scarcity, and two-thirds of the world’s population could be under conditions of water stress [1]. Agriculture is the predominant consumer of water in most countries, accounting for more than 70 percent of global water use and up to 95 percent in many developing countries. Improved agricultural water management is required to realize global environmental and social goals with respect to poverty, hunger, and sustainable environment and to mitigate many water-related issues [2].
A clear understanding of the hydrologic components controlling water balance is essential to analyze possible measures for saving water in a watershed with agricultural reservoirs for improved water-resource planning and management. However, many of the components are not easily measurable—either in terms of the required time interval or the complexity of the processes in a river-basin system where agriculture is a dominant land use [3]. Compared to field monitoring, use of simulation models is a relatively inexpensive and quick method to investigate the rainfall-runoff process in developing water resources management plans. Further, highly nonlinear, time varying, and spatially heterogeneous hydrologic processes can be effectively represented in modeling by employing appropriate models [4,5,6]. Numerous studies have exploited the usage of modeling approaches in watershed management planning, and a range of models and software has been developed for their specific purposes and uses.
For decades, modular-style software development has been a trend in software engineering and commercial software development. This is frequently based on object-oriented concepts [7,8] where individual model parts, or “modules,” are designed to encapsulate a single concept, promoting flexibility in use and supporting module reuse [8,9,10,11]. Within different modeling spectra of discrete time and entities, many problems and modeling tools are amendable to approaches based on object theory and are readily addressed using appropriate software engineering designs and development methods [8]. These new approaches have led to the development of new modeling frameworks that permit the selective use of libraries of modules and have model architectures customized to address a variety of unique environmental problems [8,12,13,14,15].
HarmonIT [16] is a typical example of a research project implemented based on component-based modeling frameworks, which are generally open systems that leave choices to end users concerning model selection. The component-based frameworks provide a method by which existing/legacy models can be dynamically linked and organized. Conversely, integrated modeling systems are collections of models combined to represent a specific system or a mix of different physical domains. Although an integrated modeling system can become popular because of the growing requirement for a holistic approach in addressing complicated environmental issues, its static structure can limit its utility to the purpose of the integration. The component-based modeling framework can provide a useful alternative to accommodate the varying requirements of a model, in particular, in developing management plans for an agricultural watershed. Despite the expected utility benefits, the component-based modeling framework has not been studied extensively.
A component-based modeling framework is developed based on a modular modeling concept emphasizing system-building rather than programming. A component is a single simulation unit that is allocated to a defined job and can be joined with other components to form plug-and-play models [17,18,19]. An object-oriented modeling approach supports the component-based modeling framework through the concept of objects and associated techniques such as object-oriented analysis, design, and development. In the object-oriented approach, an object to be simulated is identified as part of a class and class hierarchy, with its associated attributes and operations defined within the system [17].
In the hydrology and watershed modeling fields, there are only a small number of component-based modeling frameworks that have been developed or under development to overcome the limitations of data transfer, and source-code compatibility, such as Modular Modeling System (MMS) [20], Dynamic Integration Architecture System (DIAS) [21], Interactive Component Modeling System (ICMS) [15,22], Spatial Modeling Environment (SME) [23], The Invisible Modeling Environment (TIME) [24], Framework for Risk Analysis in Multimedia Environmental Systems (FRAMES) [25], Objective Modeling System (OMS) [26], and the European Open Modeling Interface and Environment (OpenMI) [27]. Component-based modeling frameworks focus mainly on issues of water quantity rather than quality. Further, the frameworks previously developed lack the ability to readily plug-in and out sub-models, and they do not use legacy models which lead to inefficiency in modeling comprehensive watershed processes.
The component-based approach is expected to extend our ability to analyze complicated agricultural watershed process and systems by providing a holistic modeling tool. However, owing to the absence of the appropriate tools, it has not been commonly employed in addressing water issues of agricultural watersheds, especially characterized by the irrigation-reservoir operation and paddy-field processes (i.e., irrigation and drainage). Thus, there is a requirement to develop a component-based modeling framework that offers modelers and users an alternative approach to implementing plug-and-play components for integrated and holistic watershed-scale agricultural water-resource planning and management.
The main objectives of this study are to develop a COmponent-based Modeling Framework for Agricultural water-Resource Management (COMFARM) and to evaluate its applicability with a case study.

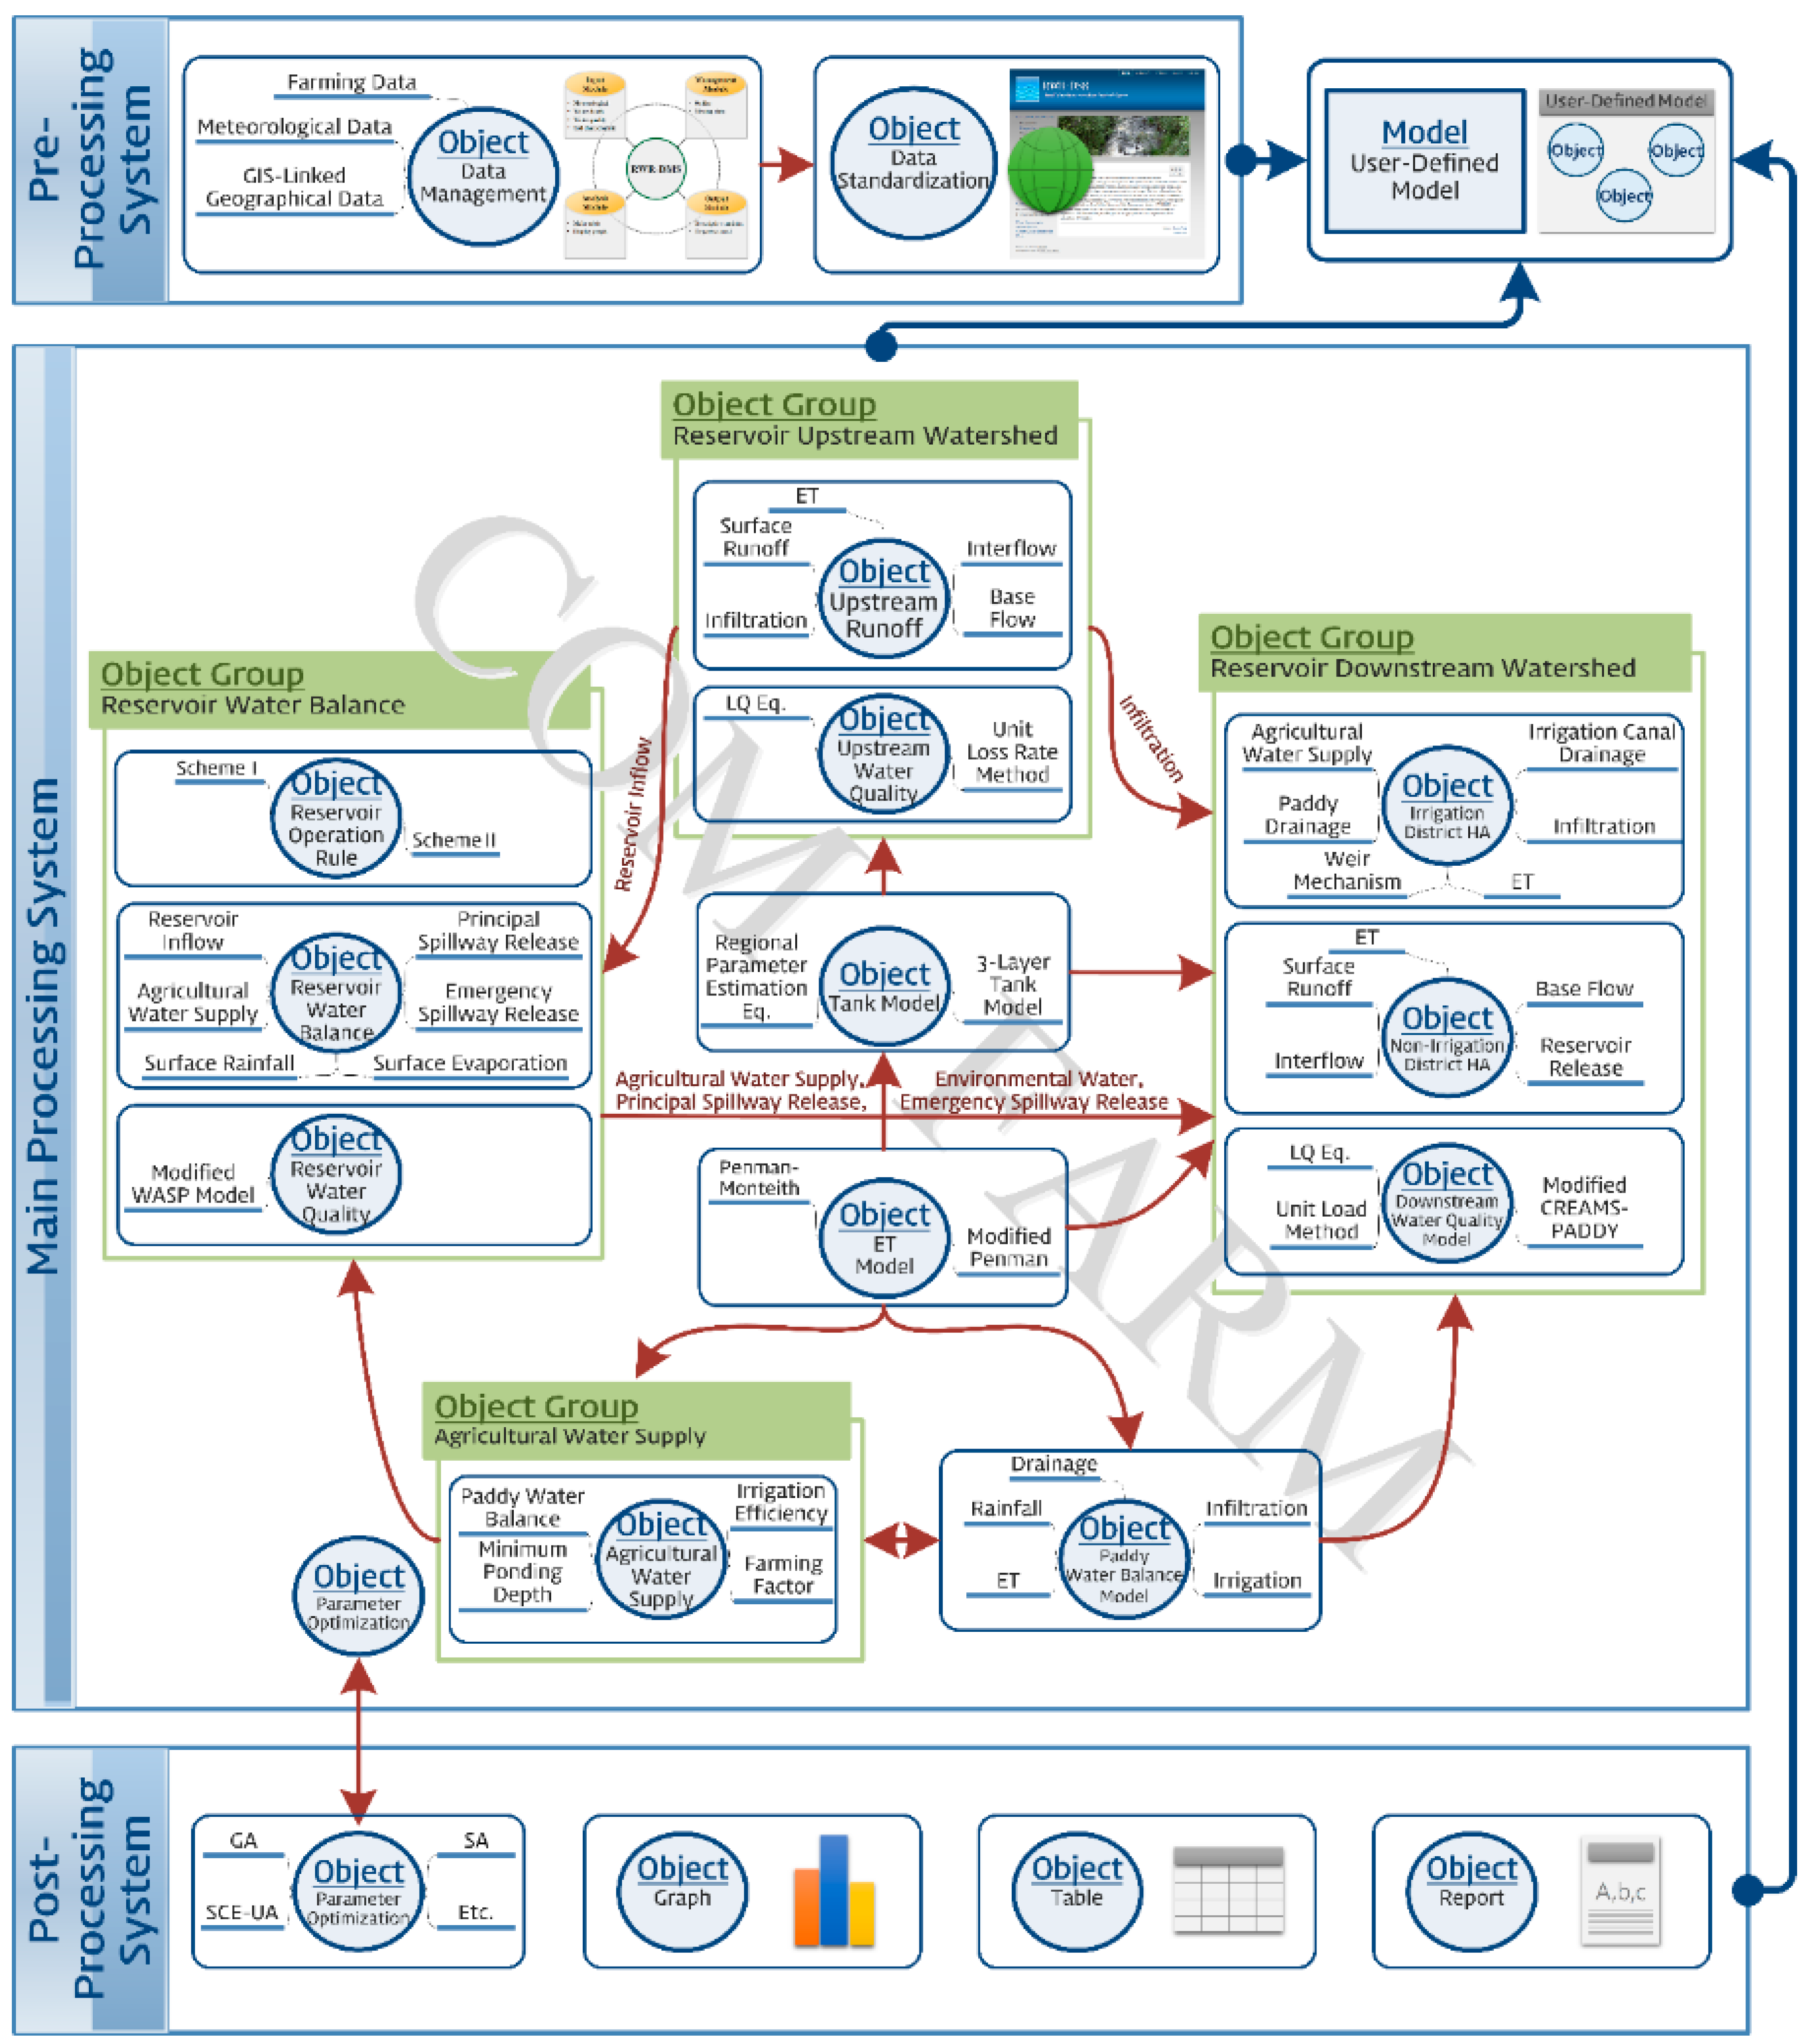
2. Development of COMFARM
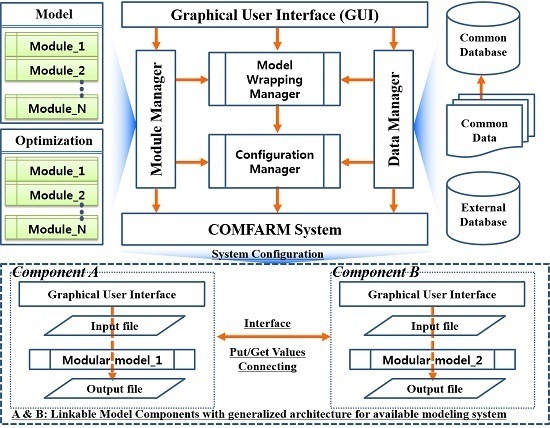
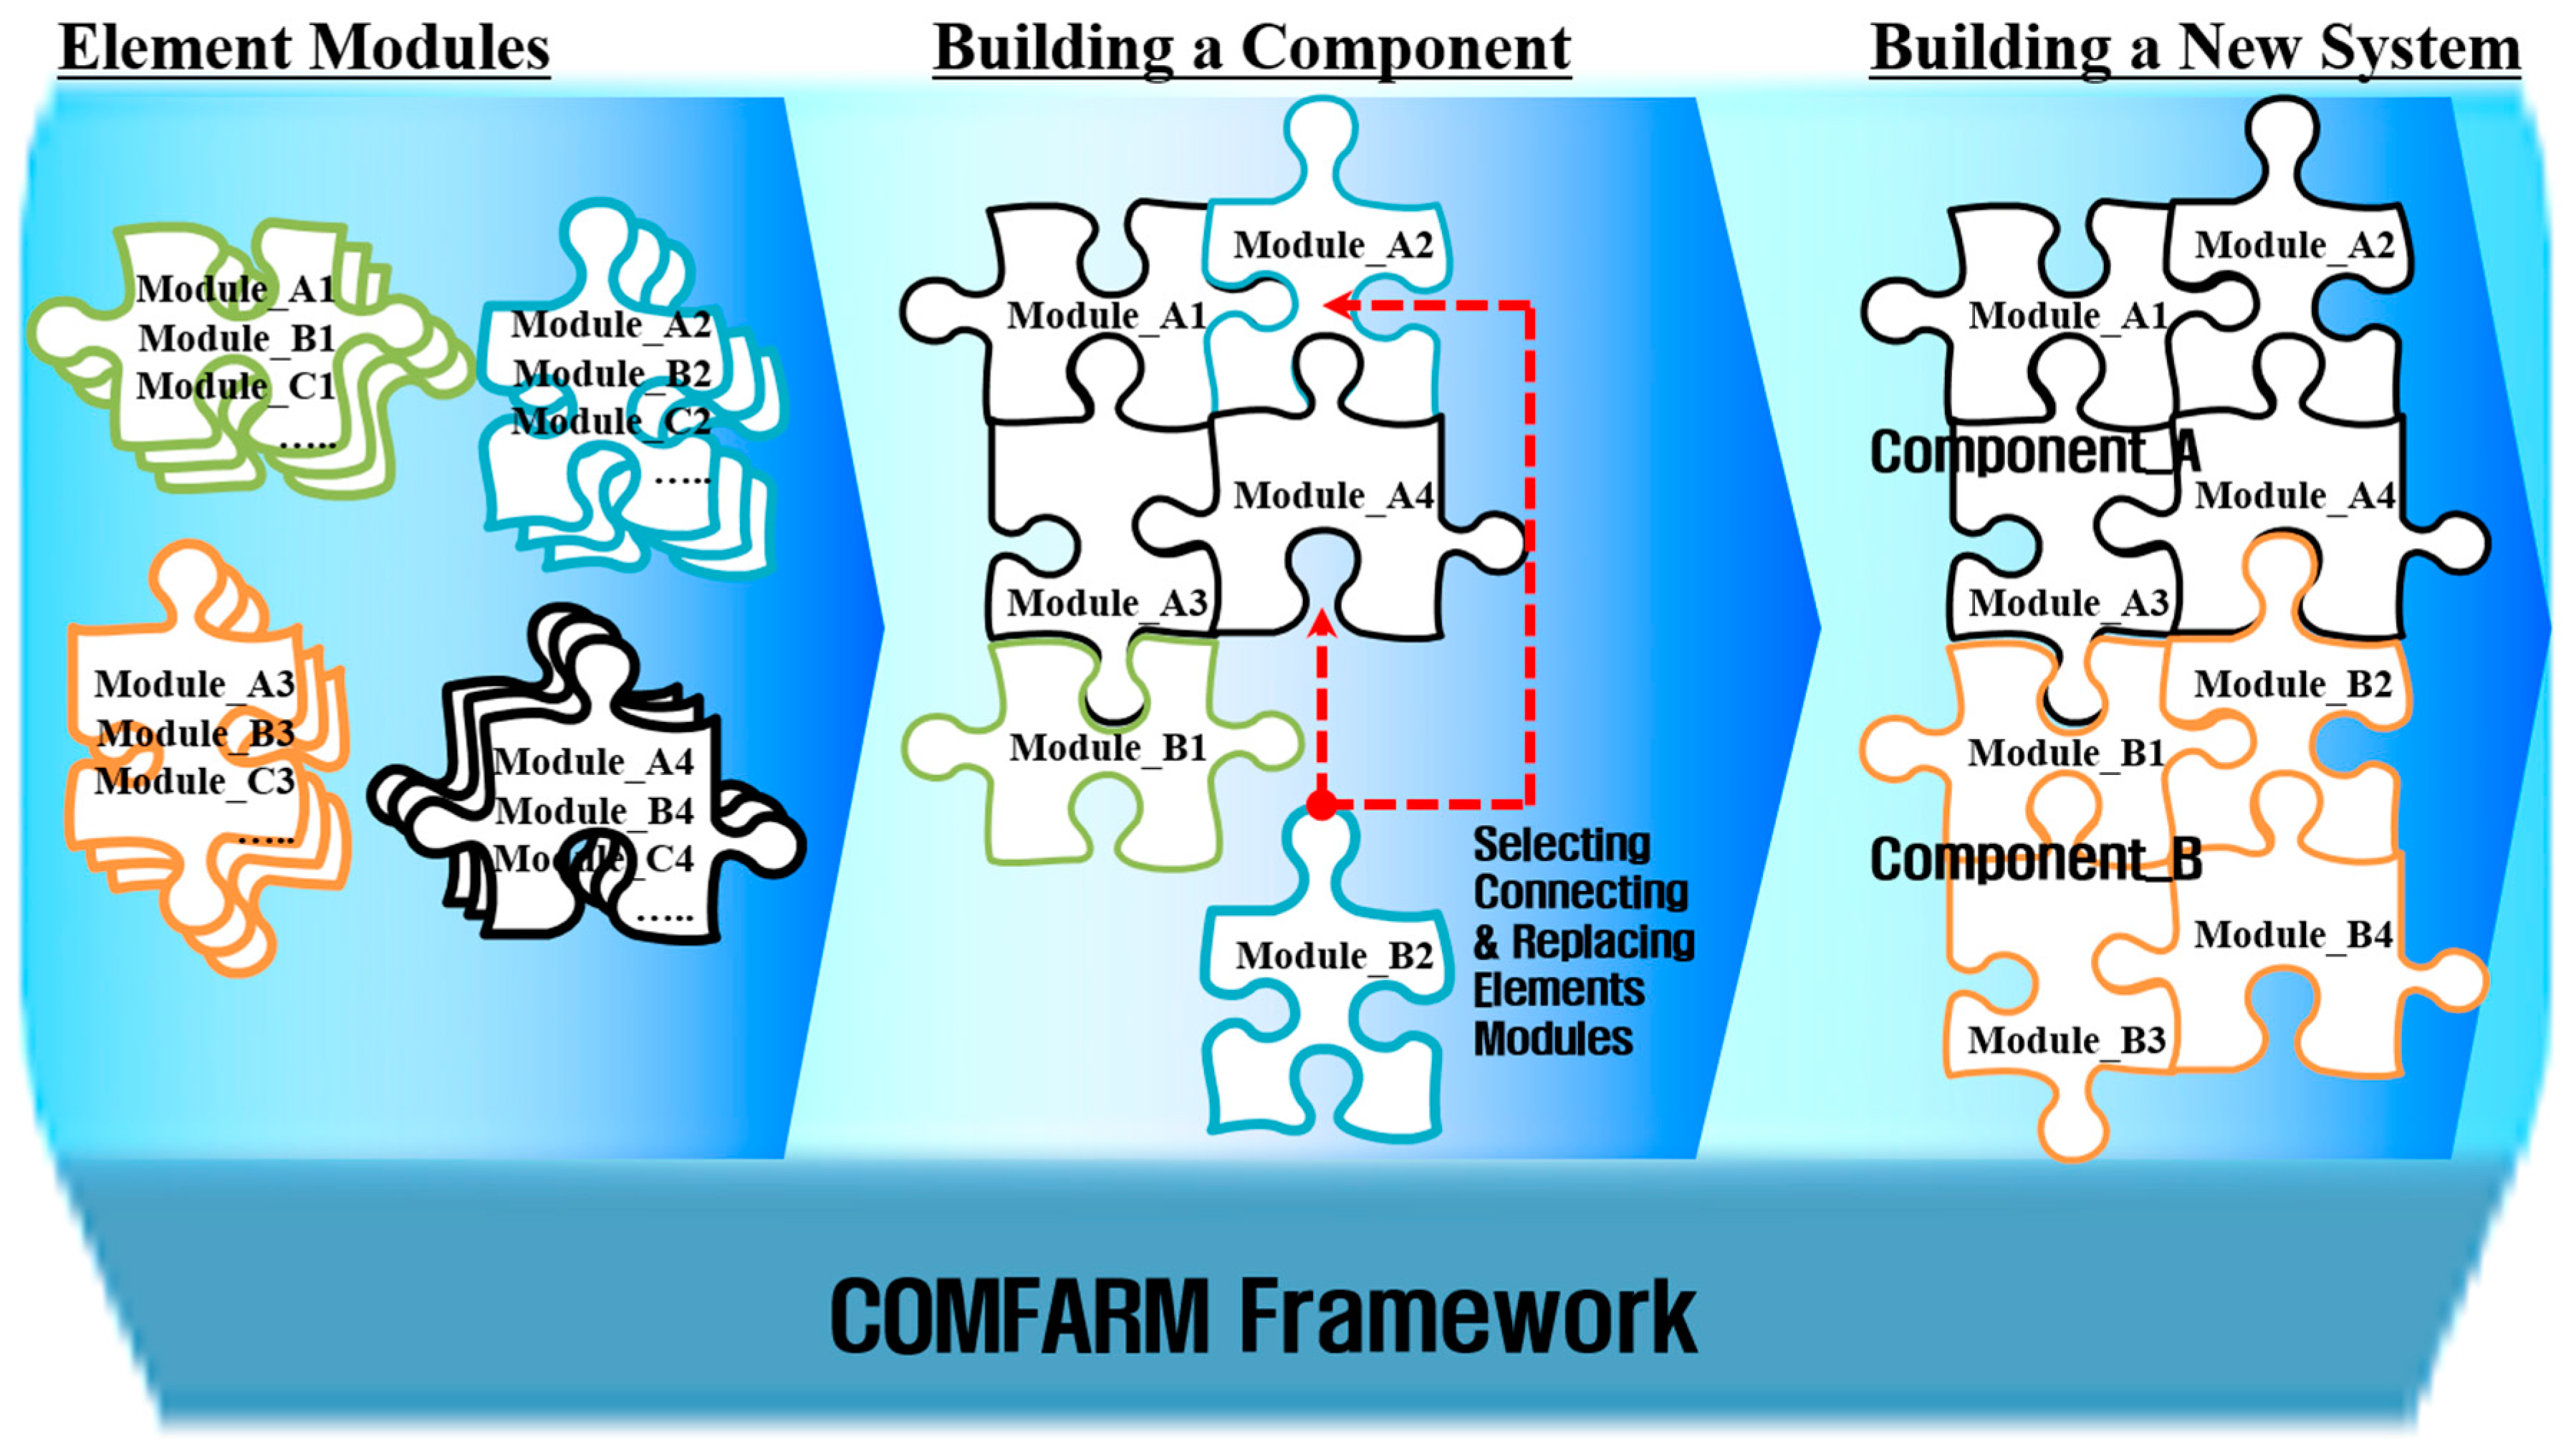
COMFARM allows modelers and users to construct and apply physical-domain models at the agricultural watershed-scale. In this study, it was developed for agricultural water-resource planning and management. Eclipse, an integrated development environment (IDE), was used to develop COMFARM framework written in the JAVA programming language using plugins.
Thus, COMFARM, based on Eclipse’s JAVA Development Tools (JDT), offers modelers and users greater flexibility and expandability in designing models to streamline diverse modeling tasks, regardless of the operating system (OS). To facilitate the development and integration of models, COMFARM framework also supports developing the required domain components and models in different programming languages including COBOL, Fortran, Perl, Python, VBA, and C++.

2.1. Basic Concept

COMFARM is a highly interoperable and lightweight modeling framework based on all the required domain components. In this manner, it resembles Lego, the creative construction system consisting of plastic interlocking building blocks and other standardized components that fit together with studs. Hence, the framework is selective and easily reconfigured or extended using plug-and-play software components that allow modelers and users to assemble, disassemble, add, remove, or replace components built by independent modules, much like Lego blocks.
The basic concept for COMFARM is illustrated in Figure 1. The framework enables model developers or users to employ the existing element modules easily in developing their own element modules and to readily create various modeling systems with linkable components by connecting a number of elements modules. In terms of promoting flexible use and supporting module reuse, modelers and users can add, remove, or replace independent modules and they can assemble or disassemble components built by independent modules in COMFARM. A modeling system, as illustrated in the right-end column in Figure 1, consists of several linkable components with various modules, such as modular models, that can be linked together in COMFARM.

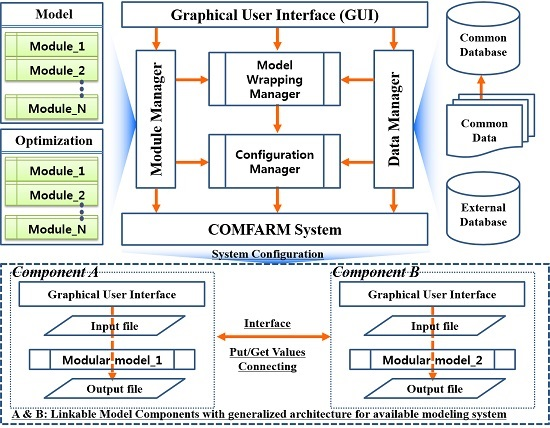
2.2. Framework Architecture

COMFARM was designed as a set of dynamic elements communicating with each other using an object-oriented architecture to realize the growing requirement for flexibility, scalability, reusability, and modularity.
To reflect this design concept, COMFARM provides a flexible environment developed to accommodate data exchange and synchronization with low-level communication, using internally standardized interfaces, data structures, communication protocols, and file formats.
As illustrated in Figure 2, COMFARM consists of six primary architectural modules: COMFARM system, Configuration Manager, Module Manager, Data Manager, Model-wrapping Manager, and Graphical User Interface (GUI).
COMFARM system defines the interfaces and the system environment between the architectural modules for implementing overall domain-modeling systems.
The Module Manager, which consists of both the model’s sub-module and the optimization sub-module, defines and manages the features of the existing models and models that are being developed to simulate the watershed runoff, the reservoir’s water balance, and the amount of irrigation and drainage. The independently-definable base functions related to runoff, water balance, and crop water requirement estimation in the existing models including the SWAT and TANK models were built as individual modules. COMFARM’s Module Manager links and organizes modular models in a consistent manner and computes and exchanges of data without the requirement for an external control mechanism. The optimization sub-module configures selected modular models with optimal model parameters through model calibration.
The Module Wrapping Manager manages choosing and combining a series of modules into a single composite module function. In cases where multiple sub-watersheds must be considered independently, the model wrapper can facilitate model configuration by allowing for the building of a single sub-watershed functional module and using it multiple times with small modification. This prevents the requirement to build the functional entity with the same series of modules repeatedly.
The Data Manager provides a systematic and consistent interface between the user and a database or databases and allows for the definition, creation, querying, updating, and administration of databases. All of the data calculated and generated by other modules are stored and managed in this module. The Data Manager has been developed with JAVA (Oracle Java Standard Edition, Ver. 7), based on a rational database-management system (RDBMS) with Structured Query Language (SQL, Microsoft SQL Server, 2012). This system module communicates through the exchange of ASCII files to a central database and provides utility libraries for standardizing the data. A standardized interface between the databases and modular models can be accomplished using the Data Manager module.
The Configuration Manager defines what will be exchanged when various modules and components have been linked to a particular domain. This system module allows developers and users to create, configure, and validate a new modeling system—with a multi-tier structure—using existing modules and components. Users can also visualize the links and specify their properties using the GUI module, making the link configuration easier to interpret.
According to the HarmonIT project [16], modular models that extend to several countries must be able to accommodate different data inputs and outputs with spatial and temporal variations in data, differences in data standards, and potential differences in the source code. The Model-wrapping Manager in COMFARM supports connections between existing element modules, modular models, a range of components, and different types of modules and data to mitigate the complexity to agricultural-water analysis and regional features, as mentioned above. This system module allows data to be exchanged between independent modular models running concurrently with a standardized input/output library.
The GUI system module allows a user to use COMFARM by customizing its applications using plug-and-play software components in a user-friendly manner. This module allows the user to register existing modules easily, link various modules/components, and compose their own modeling systems by dragging and dropping icons in the workspace window. Users can visualize the linking processes and specify the various properties in an intuitive manner using icons. The user supplies information through the GUI, and this information is converted to input data for the modular models. The GUI supports tabular & graphical inputs, outputs, and module-linking facilities, while suggesting default values for the applicable parameters in dialog boxes for the user’s convenience.
The architecture for a model or modeling system is generally thought to consist of a description of the components and the connectors (interactions) between them [16]. As indicated in Figure 2, the linkable model components in COMFARM consist of a user interface and a modular model that constructs the interacting sets of domain models and executes those models in sequence with a metadata standard, which is defined in this study. The modeling sequence in COMFARM is defined through a hierarchy of object classes that provide a calculation order for each module or component. Information provided via the user interface is converted to input data for the modular model. The user executes the model by selecting an option in the user interface. The modular model reads the input, performs the calculations, and displays the results (i.e., the output). This module provides model developers and users with the ability to organize and implement the modeling system linked by particular domain models in a customized fashion using these linkable model components. Based on these six primary system modules, COMFARM provides developers and users with the tools to build a customized modeling system by combining linkable components organized with various element modules for all of the required domains.

3. Agricultural-Water Modeling System

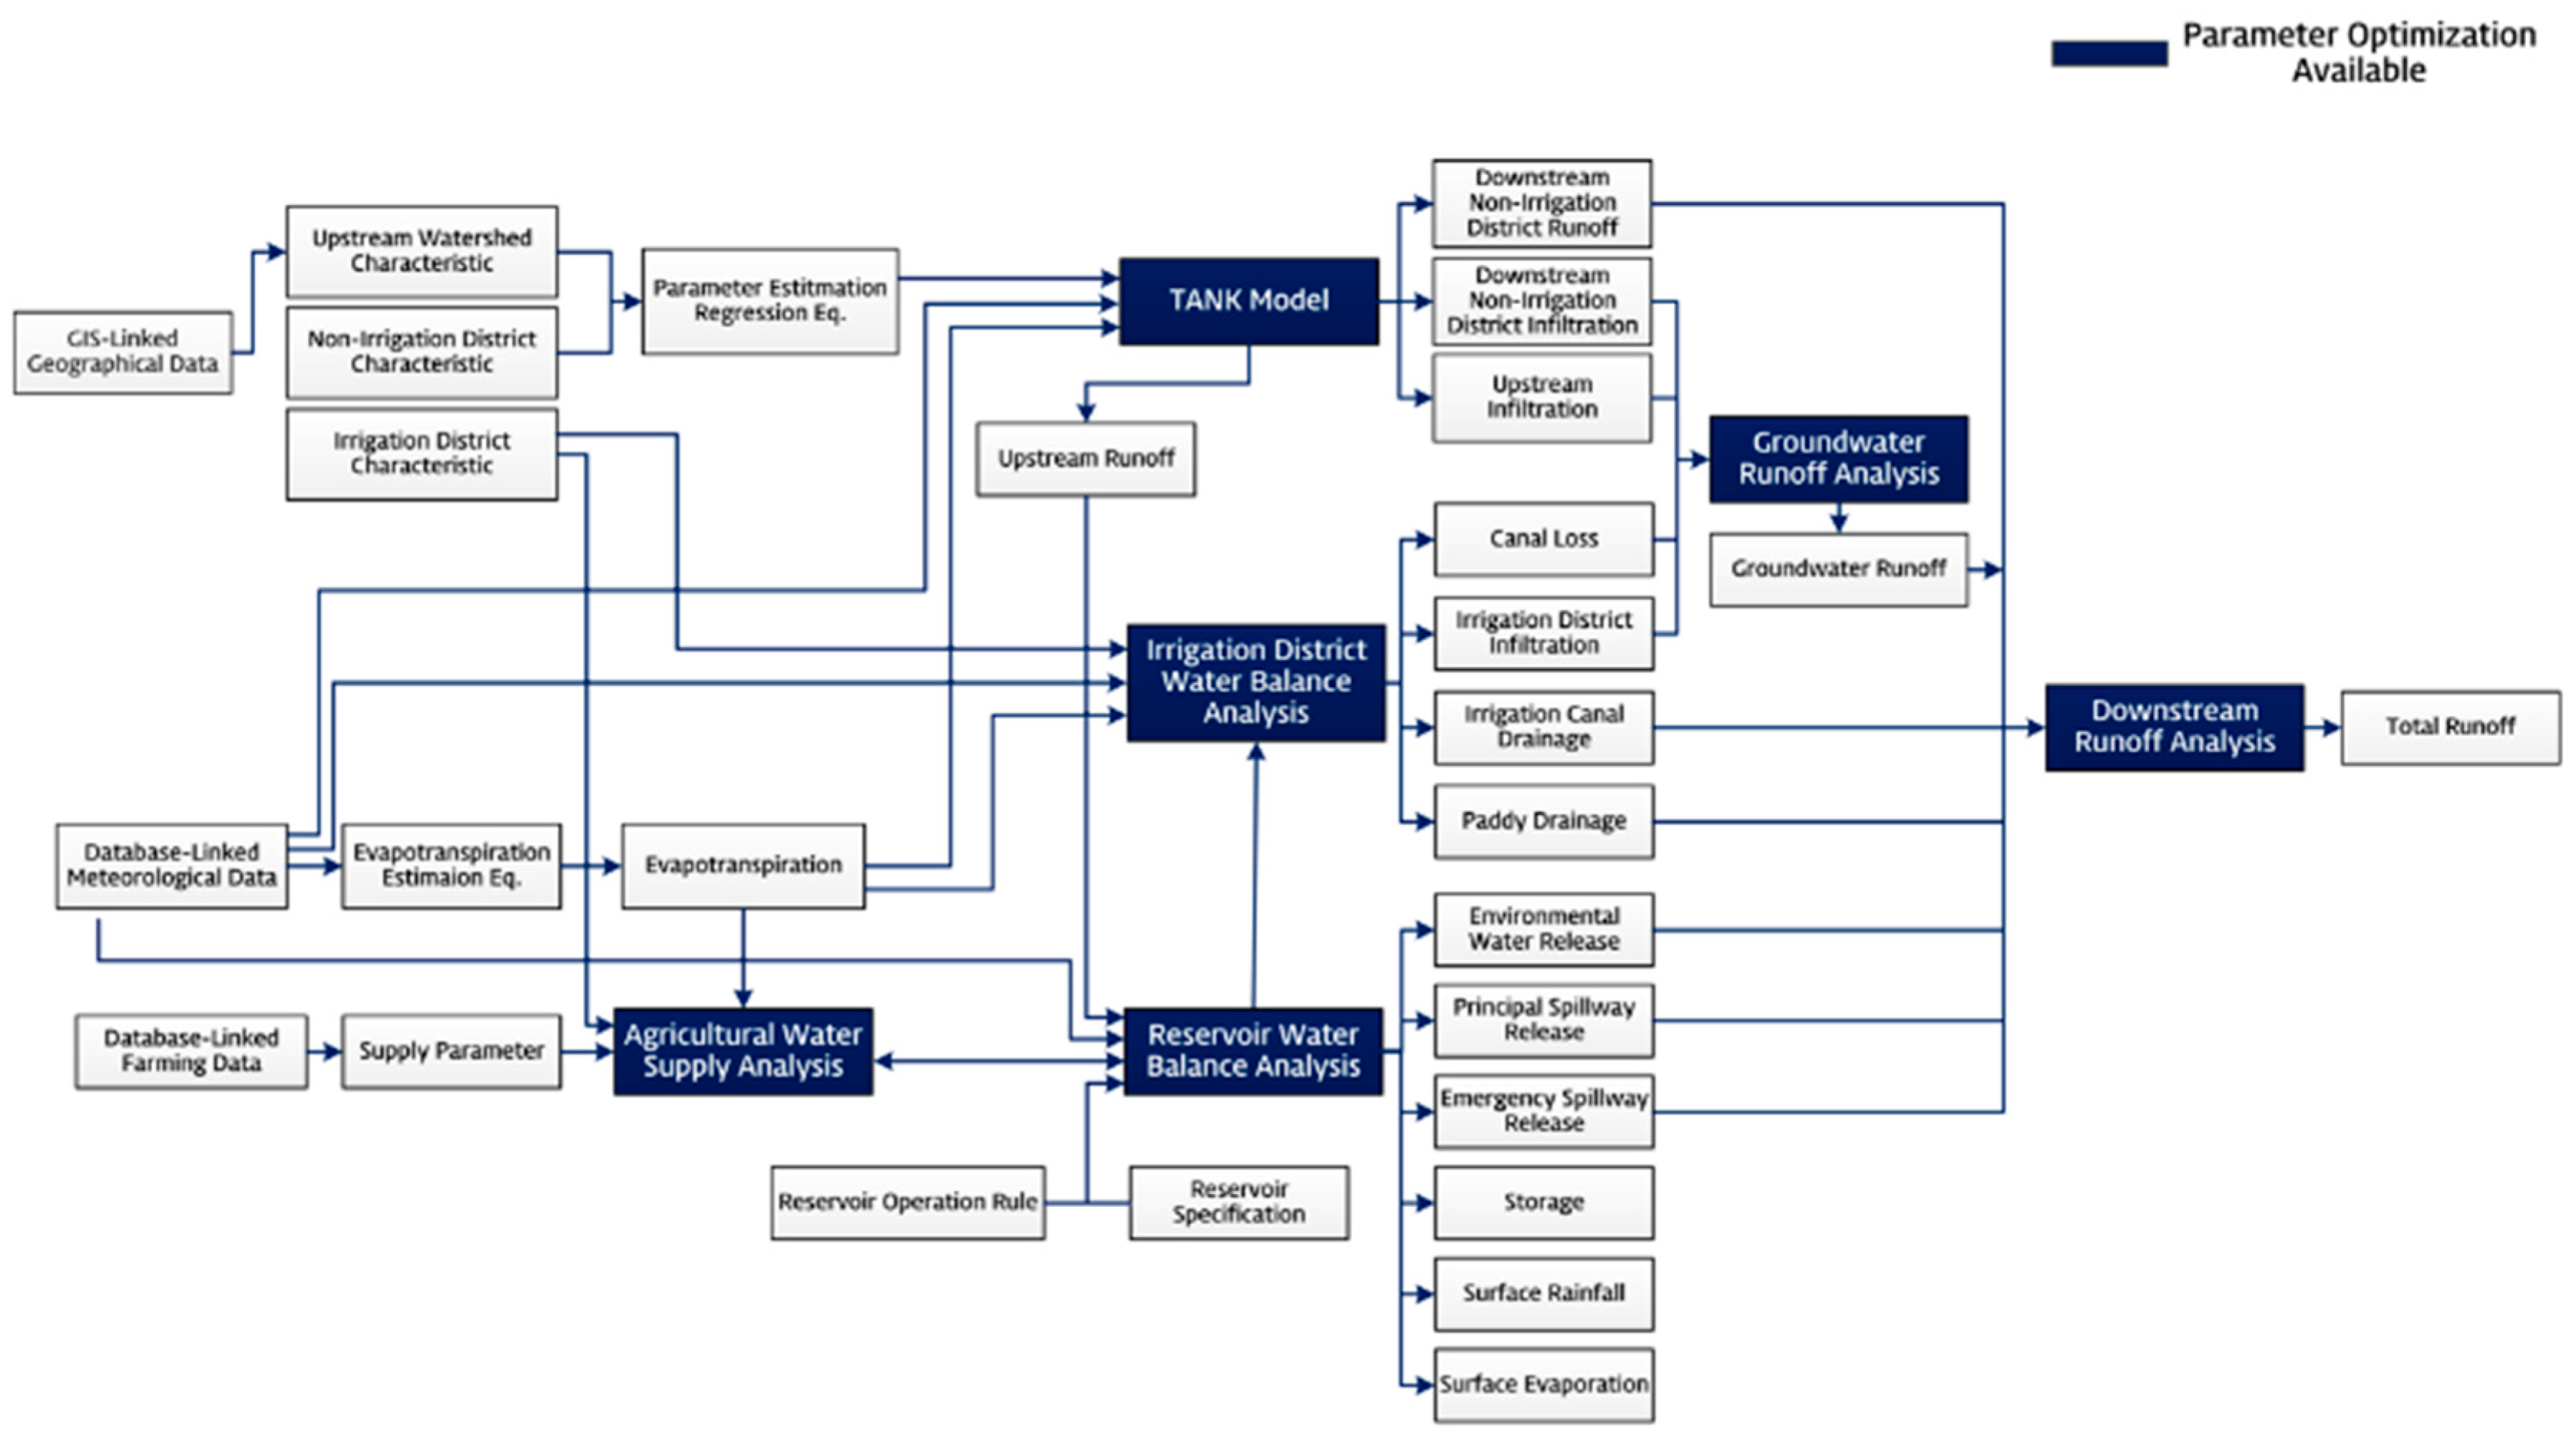
3.1. Basic Element Modules

Because COMFARM is structured such that it can develop and integrate while remaining completely separate from application programs, models, and components, it is possible to increase the reusability of modules and components and significantly improve the expandability in terms of the development of a modeling system in a specific domain. COMFARM was developed with a system interface designed to permit the integration and/or communication between models and modules that originate from completely different development languages and input variables.
COMFARM enables users to create a modeling system with various modular models for a particular case in a customized manner. Thus, COMFARM structure—with individual and independent modules—was designed to facilitate connections between modules, promoting usage flexibility, and supporting the reuse of modules.
For users to easily design a modeling system with linkable components, basic modules were developed in this study for a comprehensive assessment of rural water management and operations. These basic modules are broadly categorized into simulation modules, input-data generation modules, and output-data modules, as indicated in Table 1. Including core models, such as the TANK model, reservoir water-balance model, and the rice-paddy water-balance model, 21 modules, were developed in this study. All of the modular-element models have a common structure and the data-linking method is standardized in a modular form that can be shared and implemented across a wide range of modeling frameworks.

3.2. Modules for Hydrological Analysis

3.2.1. Rainfall-Runoff Simulation Model (TANK Model)

The TANK model, which is an upstream watershed component built with multiple relevant modules, was created in this study to simulate the upstream runoff from watershed. As indicated in Table 1, there are a series of related modules for the reservoir upstream watershed runoff simulation. The modules in the TANK component include the modules for watershed land use, parameter determination with land-use-based optimization process, continuous daily runoff, and display. The TANK model has been widely used in rainfall-runoff modeling, owing to its computational and conceptual simplicity and its forecasting accuracy [28,29,30,31,32]. The TANK model component includes optimized modular models and generalized equations for calibrating the model.
The TANK model is compatible with variations in the number of tanks, side outlets, bottom outlets, the height of the side-outlets, and the initial storage volume. For a model with four tanks, the outputs through the side outlets of the first tank (located at the top), second, third, and fourth tank (located at the bottom) are considered surface runoff, intermediate runoff, sub-base runoff, and base flow, respectively [28,29]. The governing equations for the TANK model are as follows [28]:
I i ( t ) = B i h i ( t )
Q i ( t ) = S i 1 ( h i ( t ) H i 1 ) + S i 2 ( h i ( t ) H i 2 )
h i ( t + 1 ) = h i ( t ) + P ( t + 1 ) E ( t + 1 ) Q i ( t ) I i ( t )  for  i = 1
h i ( t + 1 ) = h i ( t ) + I i 1 ( t ) Q i ( t ) I i ( t )  for  i 1
where Ii is the infiltration in the ith tank (mm), Bi is the bottom-outlet coefficient for the ith tank, hi is the storage of the ith tank (mm), Sij is the side-outlet coefficient for the jth side outlet in the ith tank, is the height of side outlet for the jth side outlet in the ith tank (mm), P is the precipitation (mm), and E is the evapotranspiration (mm). The tank model we applied was composed of three tanks. The first tank had two side outlets; the other tanks had a single side outlet. Additional detailed structures with the TANK model can be found in [28].

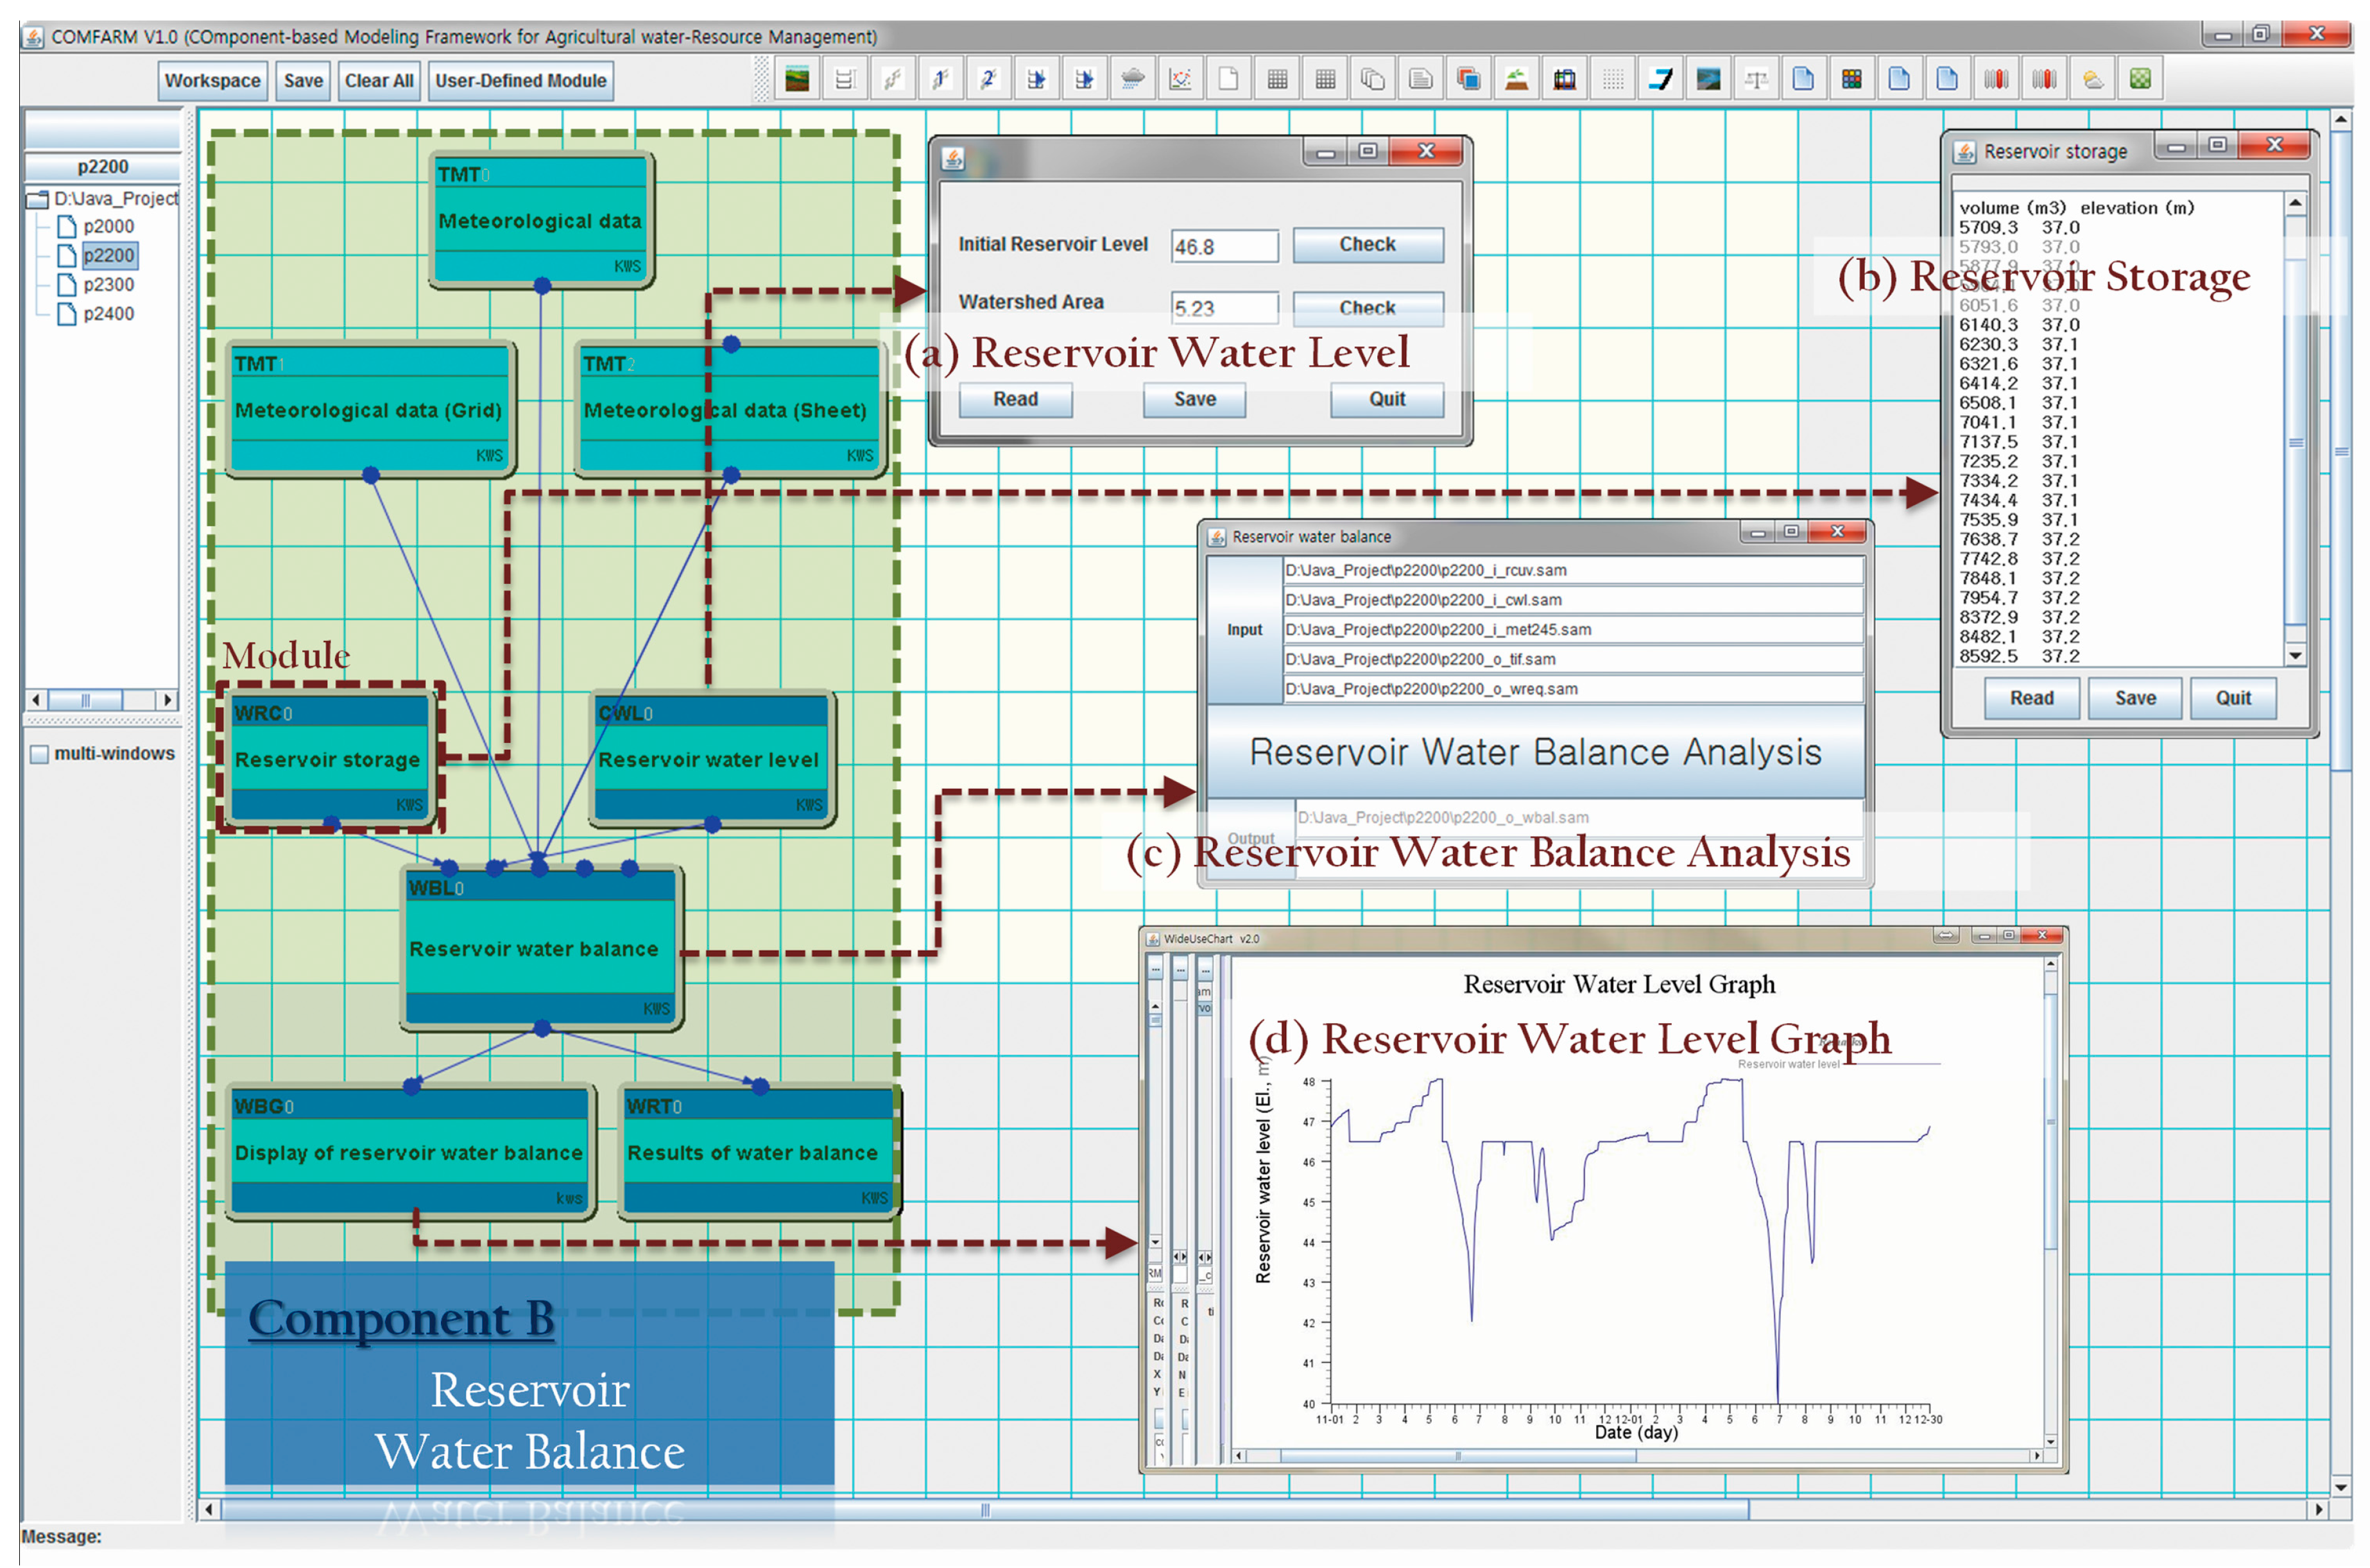
3.2.2. Reservoir Water Balance

The reservoir water balance is governed by the reservoir storage-continuity equation [32,33]:
S t = S t 1 + Q t + R t A W S t E t P S t E S t
where S is the reservoir storage (m3), Q is the reservoir inflow (m3), R is the rainfall across the reservoir area (m3), AWS is the agricultural water supply (m3), E is the reservoir surface evaporation (m3), PS and ES are the reservoir release from the principal spillway (m3) and emergency spillway (m3), respectively, and the subscript t denotes the day. PS and ES are governed by a dead level, a flood-limited level, and a normal pool level, respectively. If the reservoir water level exceeds the flood-limited level and the normal pool level, the excess amount is released to the downstream watershed [34]. Daily precipitation and pan evaporation from weather stations were used for the water-balance calculations. The Thiessen polygon method and pan coefficient were used to calculate P and E, respectively.

3.2.3. Water Balance in Paddy Fields

The impact of rice-paddy fields is a major concern and is being studied as a unique component of agricultural water management. In [35], the authors developed and applied rice-paddy components to the SWAT model to simulate the water balance in irrigated paddy fields.
The hydrologic cycle within a paddy field may be explained in terms of the water balance [36,37]. The ponding-water depth (in mm), represented by ST, is determined based on the relationship between the rainfall, evapotranspiration, irrigation, runoff, and infiltration, as given in the following water-balance equations:
S T t = S T t 1 + I R t + R A I N t ( D R t + E T t + I N F t )
D R t = S T t C H t  for  S T t > C H t
D R t = 0  for  S T t C H t
where IR, RAIN, DR, INF, and CH represent irrigation (mm), daily precipitation (mm), drainage runoff (mm), evapotranspiration (mm), infiltration (mm), and the drainage-outlet height (mm), respectively. The daily evapotranspiration from paddy fields is determined with the Penman–Monteith method [38,39]. Additional details related to water balance in paddy fields can be found in [35].

3.2.4. Agricultural Water Supply

The agricultural water supply was calculated based on the irrigation quantity and efficiency during the growing season. The irrigation water supply was calculated using the following equations [40,41]. However, the equations can be modified or replaced with other appropriate equations when required to consider a specific condition of application:
A W S t = A c r o p E s I R t 1000  for  A W S t A W S m a x
A W S t = A W S m a x  for  A W S t > A W S m a x
where Acrop is the cultivation area (m2), Es is the irrigation efficiency (%), and AWSmax is the maximum agricultural water supply (m3). Irrigation efficiency commonly consists of three components to represent water loss: the conveyance, field canal, and field application [41,42]. According to [43], efficiencies ranged from 60% to 65% for surface irrigation in Korea. IR can be calculated using the water balance from crop fields in addition to the following equations:
I R t = S T m i n S T t  for  S T t < S T m i n
I R t = 0  for  S T t S T m i n
where STmin is the minimum water depth that a field operator will attempt to retain for crop growth (mm). If the daily water depth drops below the minimum depth, the difference is supplied by irrigation.

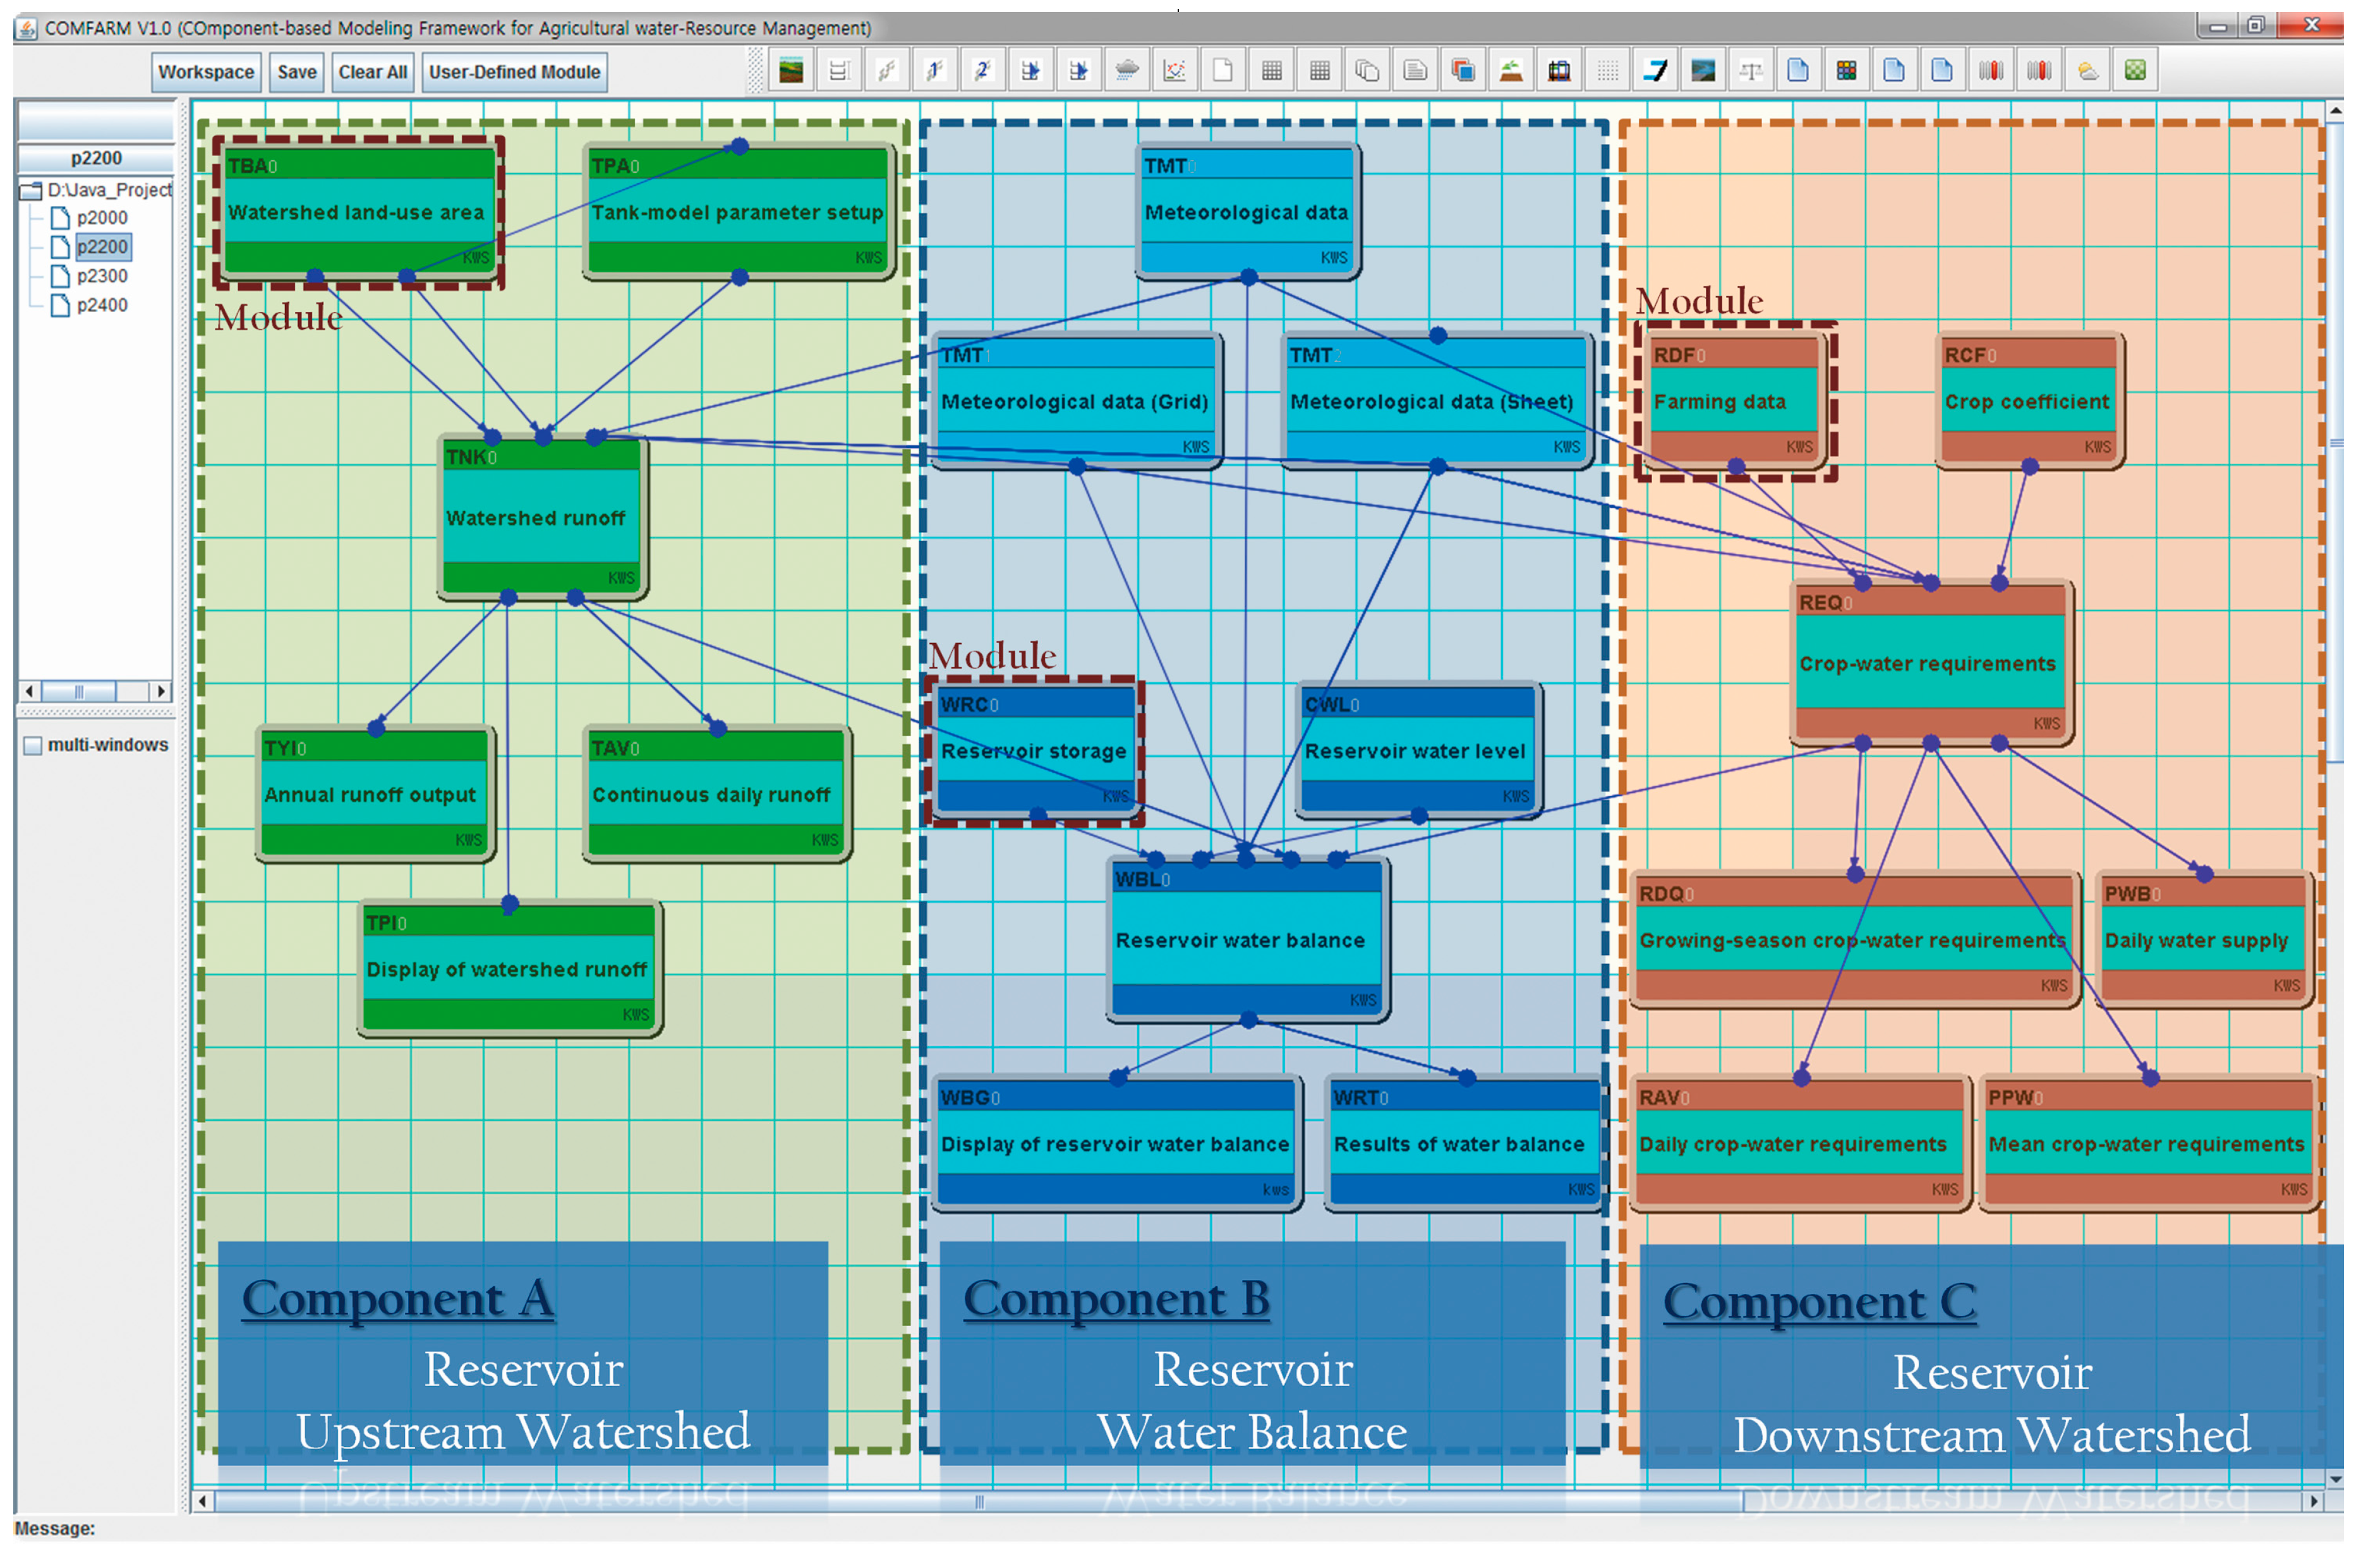
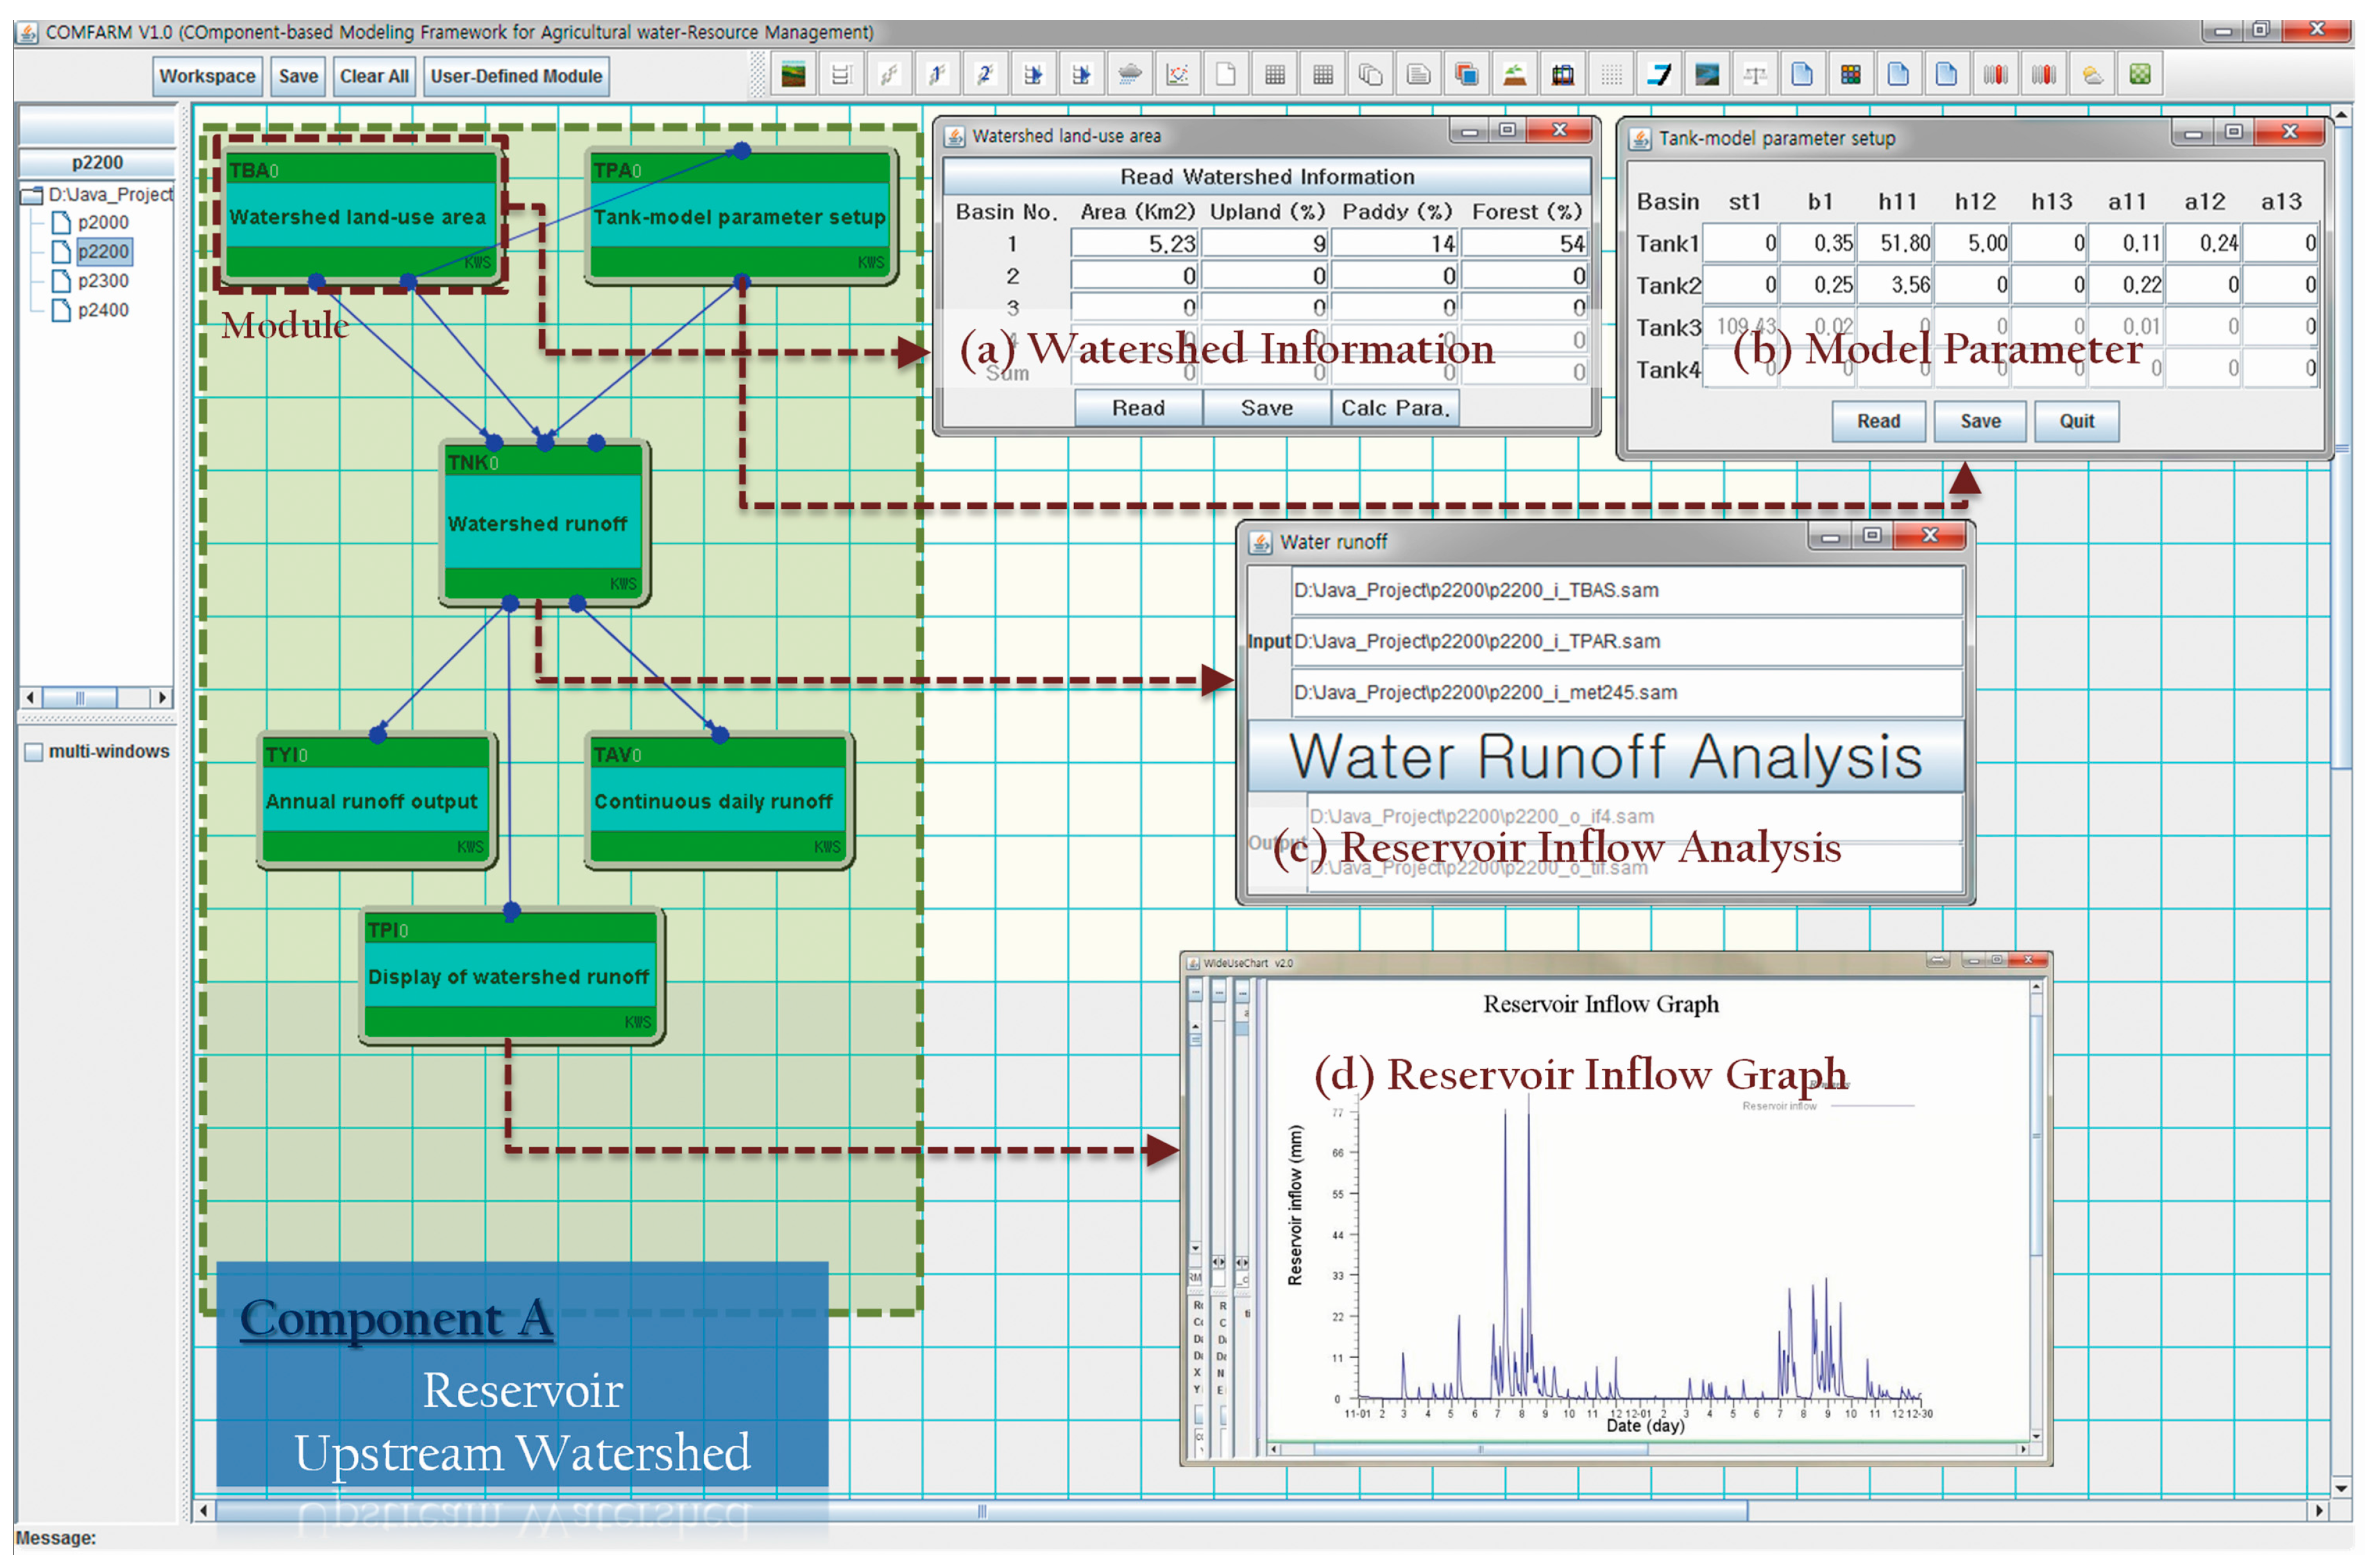
3.3. Case Study of COMFARM Application

3.3.1. Case-Study Basins and Database

A case study to test the applicability of the developed model was conducted for a South Korean agricultural watershed with a reservoir. The Seon-Am reservoir irrigation district was selected as the case study area. The Seon-Am reservoir is located in the Kim-Je city of Jeonbuk province, South Korea. The main purpose of the study reservoir is to supply irrigation water to farmlands. A flood control function is added during the flood season, according to the Korean Agricultural Structure-management Rules. The spillway release water from the reservoir and the return flow from the irrigated districts is discharged into the downstream watershed. Input data containing the watershed area, land use, irrigation area, reservoir dead water level, flood control water level, and normal pool level, were obtained from the Rural Agricultural Water-resource Information System (https://rawris.ekr.or.kr). As summarized in Table 2, the upstream watershed area is 5.23 km2, of which 14.0%, 8.8%, and 54.4% are used in the forms of paddy, upland, and forest, respectively. The total storage capacity of the Seon-Am reservoir is 85.4 × 10⁴ m3 and total irrigation area is 2.22 km2. Climate information collected from the Korea Meteorological Administration (KMA) was used for the case study.

3.3.2. Design of the Modeling System

A modeling system, customized to the study reservoir area, was structured as a set of inter-linkable components and the information flow among them was standardized such that the overall modeling system could be reconfigured.
As illustrated in Figure 3, major modeling components included watershed runoff, the reservoir water balance, and the water balance of paddy blocks. All of the modular-element models—the TANK model, the Penman-Monteith equation, the water-balance equation, and various other equations—were standardized to establish interconnections for building each linkable component. The parameter-optimization module was also incorporated into a linkable module.
Figure 4 presents the conceptual realization of the case study simulation with a detailed connection of the respective linkable modules in the three major parts of COMFARM system, i.e., pre-processing, main processing, and post-processing systems. The pre-processing system provides data management and data-standardization components. The data-management component collects information from various sources, such as farming, meteorological, and geographical data. The data-standardization components provide standardized data for the main processing system to execute the major mechanisms. The main processing system contains several components for water-cycle analysis. The major components include a simulation tool for reservoir upstream-watershed runoff, reservoir water balance, and downstream-watershed reservoir. These components each include several modules that operate together with the dataflow. The post-processing system displays the results from the previous components using tables, graphs, and reports. The user can verify the graphical results and generate reports in several word processing formats.

3.3.3. Building the Modeling System for the Case Study

The modeling system for the case study was implemented in the developed modeling system by linking modules and components. As mentioned previously, the developed system consists of three components, reservoir upstream watershed runoff, reservoir balance, and downstream irrigation district. Figure 5 presents the workspace of the three components interconnected for the case study application. Users can drag modules from the menu bar and drop these into the workspace to compose a modeling system for an area of interest.
Figure 6, Figure 7 and Figure 8 illustrate the detailed configuration for each of the components. Each component has modules for pre- and post-processing of data in addition to the main analytical engine in the middle. Dialog boxes (a), (b), and (c) on the right side of the figures indicate pre- and post-processing modules; box (d) is the analytical module. Figure 6 depicts the component for the estimation of reservoir inflow from the upstream watershed. Watershed information (a) as input includes watershed area, percentile land use, and model parameters, which were pre-processed from raw data from the relevant database. Output from the analytical module, i.e., tank model (c), was post-processed into graphs of interest (d).
Figure 7 displays the reservoir water-balance portion that requires the relationship between reservoir water level and storage as input (a). Output from the reservoir balance module (c) is posted as the reservoir storage and water level in the graph (d). Initial reservoir water level and relationship between water level and storage data were obtained from the Rural Water Resource Information System of the Korea Rural Community Corporation.
Figure 8 demonstrates the component for the determination of crop water supply by estimating crop water requirement divided by irrigation efficiency. The pre-processing part (a) of this component includes crop coefficients and the farming information of the downstream irrigation district. The Penman-Monteith model was used as the crop water requirement estimation module (c). The resulting water supply was presented in the graph (d).

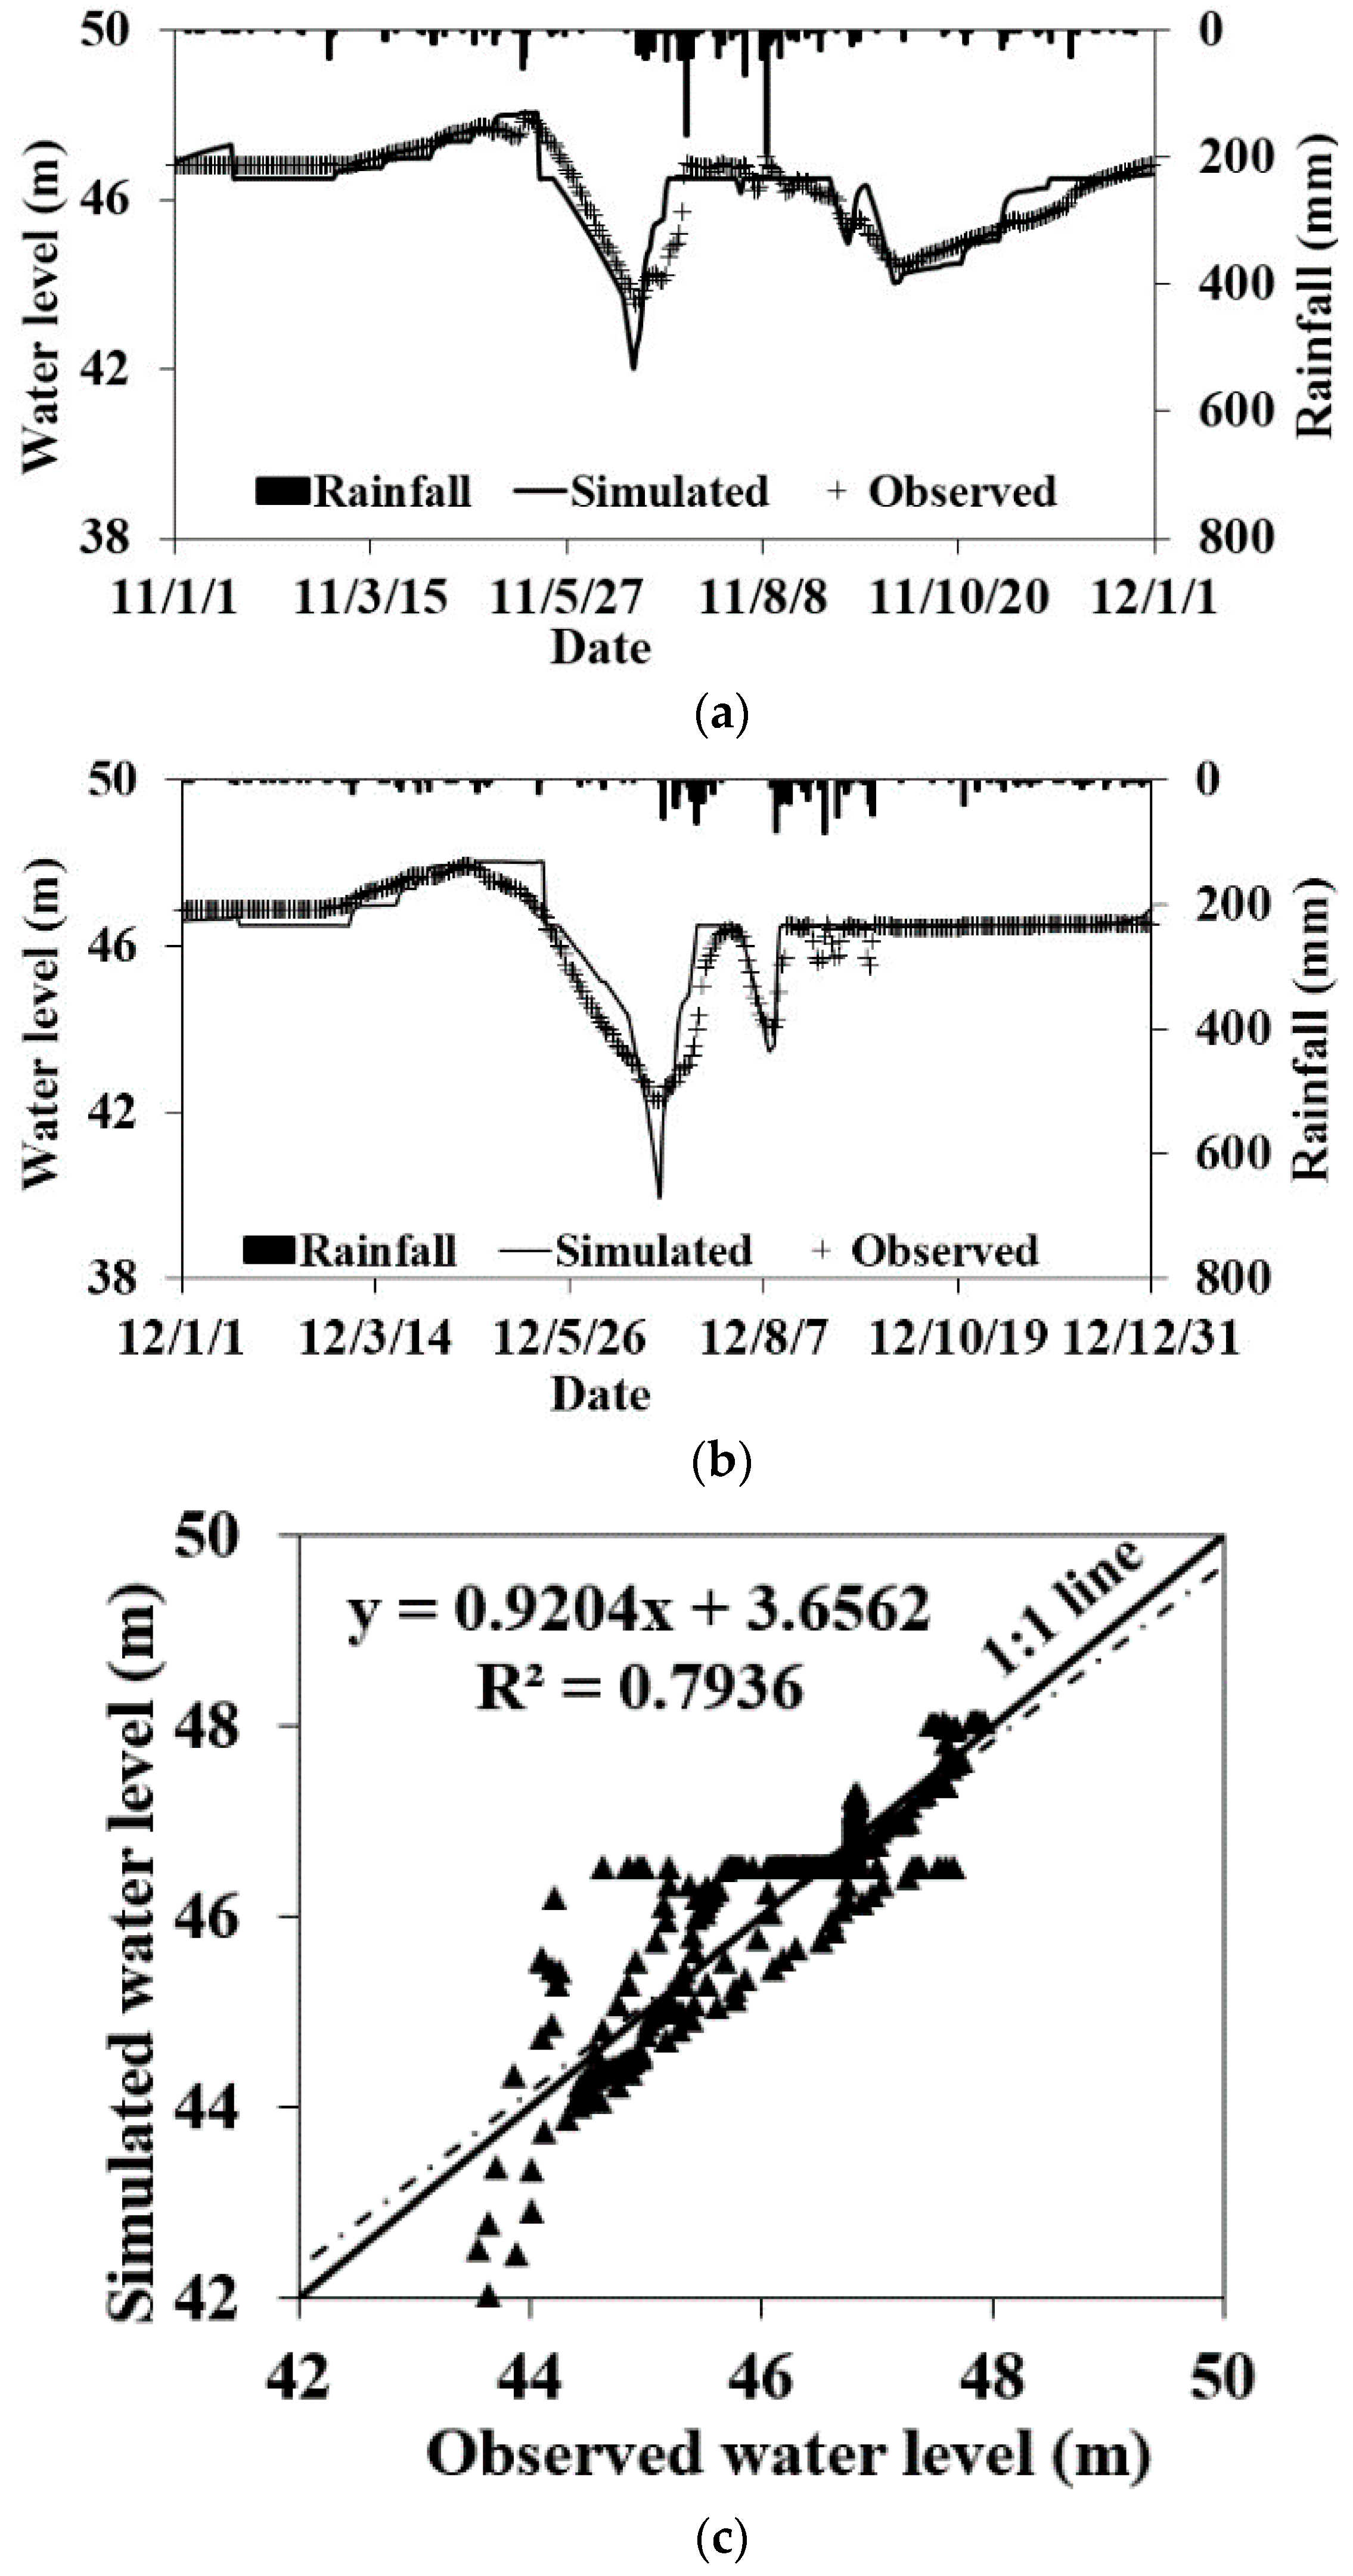
3.3.4. Performance Evaluation of the Modeling System

The established model for the case study area was calibrated and validated with the data from 2011 and 2012, respectively. The observed reservoir water level was targeted for the model evaluation. Model parameters were calibrated using a genetic-algorithm-based parameter optimization component embedded in COMFARM system. Model calibration and validation results are presented in Figure 9a,b. Overall, the model performed well in simulating reservoir water level throughout the years. Figure 9c is a scatter plot of observations and simulations for the water levels for the study reservoir. The slope and y-intercept of the regression line in Figure 9c was 0.92 and 3.6, respectively. According to Willmott [44], a slope of 1:1 and y-intercept of zero indicate that the model perfectly reproduces the magnitudes of the measured data. The reason for the point clustering in close parallel to, yet slightly beneath, the 1:1 line in Figure 9c is that the simulated water levels were lower than those observed during mid-May to mid-June in 2011 primarily owing the overestimation of the irrigation water supply (Figure 9a). Further, the sparse points at the bottom left of Figure 9c were attributed to the differences between simulations and observations during mid-June 2011, when the irrigation water supply was somewhat overestimated (Figure 9a). The horizontal group of points at a simulated water level of 46.5 m in Figure 9c indicates that the simulated results increased to a flood-limited level in early July 2011, whereas the observed results did not rise up to that level (Figure 9a).
The evaluation statistics of root means square error (RMSE), determination coefficient (R2), and Nash-Sutcliffe efficiency (NSE) were 0.24 m, 0.79, and 0.79 for the calibration period, and 0.30 m, 0.83, and 0.81 for the validation period. According to [45], the model performance is considered “acceptable” and “very good” by the respective R2 and NSE-based assessments.
As mentioned above, the overall the model developed in COMFARM performed reasonably well by simulating the observed outflows to a satisfactory level, although some sections of the simulated results were somewhat different from the observations. Using the calibrated model, various reservoir operation scenarios can be evaluated based on water-balance analyses regarding potential water shortage issues and thus local water planning [32].

4. Discussion

In this study, a component-based modeling framework for agricultural water-resource management (COMFARM) was developed using object-oriented programming to modulate a number of factors for agricultural application. A majority of previous models were developed in an entire structured form and thus model flexibility was substantially limited, when applied to a complicated agricultural watershed with various model components. The COMFARM system was developed to allow for a somewhat flexible application by combining system modules for a specific modeling requirement. Although 21 individual modules were developed in this study, the primary focus was to develop a framework that would facilitate the creation and addition of advanced sub-modules in the future.

4.1. Comparison with Previous Object Based Modeling Frameworks

A number of frameworks for environmental modeling have developed to support rapid model development and integration. Some examples are the Invisible Modeling Environment (TIME), Objective Modeling System (OMS), and the European Open Modeling Interface and Environment (OpenMI) [24,25,26,27]. These models are equipped with either custom modeling language or third party development tools and languages, which enable users to develop its own model component [46].
However, the term of framework was used with dual purposes in COMFARM. One was to facilitate custom model development, while the other was to model typical watershed runoff structures in Korea.
As for the first purpose, COMFARM can provide user-defined modules for systematic planning and effective management of agricultural water resources. In this way, the developed framework makes model development simpler by providing modular components and facilitating their integration for the needed modeling functions [47,48]. COMFARM also supports the implementation of component-based modeling techniques that analyze complicated agricultural watershed processes and systems. Because of these features, COMFARM can improve the reusability of components and the scalability of applications.
To serve the second purpose, COMFARM was designed to address water issues of agricultural watersheds, irrigation-reservoir operation, and paddy-field processes. Previously developed frameworks may not be readily applicable for agricultural water modeling because agricultural watersheds in Korea commonly involve paddy farming practices and thus a modeling platform specified for such conditions is required to be developed [49,50]. COMFARM provides easy-to-use modules for the rainfall-runoff simulation, reservoir water balance, paddy field water balance, and agricultural water supply.

4.2. Future Module Additions for Agricultural Watershed Modeling

As an exemplary case, we applied the developed framework to the three component base of agricultural watershed, reservoir, and downstream. The Tank model was selected as a target model, which was decomposed and modulated into the smallest functional units to simulate respective watershed hydrological components from agricultural watersheds; the reservoir water balance and downstream irrigation water requirement were modulated for reservoir operation for downstream water supply. The Tank model adopts a lumped approach based on the hypothesis that runoff flow and infiltration are functions of soil water content and can be constructed to simulate sub-watersheds of differing structures and land use types [51,52]. Users can construct customized simulation model systems for the target area by combining and linking unit modules in a series. The module wrapping manager can provide further flexibility for users by allowing for the construction of multi-module components. In this manner, semi-distributed watershed simulation can be realized by developing each sub-watershed into an independent simulation unit and then integrating the results over an entire watershed.
However, there remains significant future work to be undertaken. The currently developed system was applied as an example for daily base simulation to an agricultural watershed. To take into account flood management issues, an event-based hydrological module can be developed and plugged into the framework along with a compatible data standard and finer time step. It is also critical to improve the current water quality simulation module developed on the basis of the pollutant loads and flow rate relationship, which has known limitations in low pollutant flow seasons [53]. A process-based water quality simulation module in field and watershed scales should be incorporated into the system. There are also other components for future addition including climate change, ecosystem, and socio-economic analyses.
We have developed the COMFARM framework model and would like to invite other researchers to develop additional functional modules in the future. With the potential addition of more functions, COMFARM could serve as a useful tool for integrating existing and new models in the field of agricultural water resources and facilitating customized modeling for comprehensive agricultural water-resource planning and management.

Acknowledgments

This research was supported by funding from the Advanced Production Technology Development Program (code #112041-3), Ministry of Agriculture, Food and Rural Affairs of the Republic of Korea.

Author Contributions

Moon-Seong Kang designed the model framework and prepared the manuscript. Jung-Hun Song and Jihoon Park developed the model components, performed model simulation with the collected data, and analyzed and organized the model results into figures and tables. Inhong Song prepared the section for model performance evaluation and revised the manuscript along with Puneet Srivastava, Younggu Her, and Sang Min Kim.

Conflicts of Interest

The authors declare no conflicts of interest.

References

  1. UN Water. Coping with Water Scarcity—Challenge of the Twenty-First Century; FAO: Rome, Italy, 2007. [Google Scholar]
  2. Molden, D. Water for Food, Water for Life—A Comprehensive Assessment of Water Management in Agriculture; Springer: London, UK, 2007. [Google Scholar]
  3. Droogers, P.; Bastiaanssen, W.G.M.; Beyazgül, M.; Kayam, Y.; Kite, G.W.; Murray-Rust, H. Distributed agro-hydrological modeling of an irrigation system in western Turkey. Agric. Water Manag. 2000, 43, 183–202. [Google Scholar] [CrossRef]
  4. Beven, K.; Freer, J. A dynamic topmodel. Hydol. Process. 2001, 15, 1993–2011. [Google Scholar] [CrossRef]
  5. Douglas-Mankin, K.R.; Srinivasan, R.; Arnold, J.G. Soil and Water Assessment Tool (SWAT) model: Current developments and applications. Trans. ASABE 2010, 53, 1423–1431. [Google Scholar] [CrossRef]
  6. Her, Y.; Heatwole, C. Two-dimensional continuous simulation of spatiotemporally varied hydrological processes using the time-area method. Hydol. Process. 2016, 30, 751–770. [Google Scholar] [CrossRef]
  7. Rumbaugh, J.; Blaha, M.; Premerlani, W.; Eddy, F.; Lorensen, W. Object-Oriented Modeling and Design; Prentice-Hall: Upper Saddle River, NJ, USA, 1991. [Google Scholar]
  8. Argent, R.M.; Voinov, A.; Maxwell, T.; Cuddy, S.M.; Rahman, J.M.; Seaton, S.; Vertessy, R.A.; Braddock, R.D. Comparing modelling frameworks—A workshop approach. Environ. Model. Softw. 2006, 21, 895–910. [Google Scholar] [CrossRef]
  9. Clements, P.C. From subroutines to subsystems: Component-based software development. Am. Program. 1995, 8, 1–8. [Google Scholar]
  10. Zeigler, B.P. Object-Oriented Simulation with Hierarchical Modular Models; Academic Press: San Diego, CA, USA, 1990. [Google Scholar]
  11. Maxwell, T. A parsi-model approach to modular simulation. Environ. Model. Softw. 1999, 14, 511–517. [Google Scholar] [CrossRef]
  12. Muhanna, W.A. SYMMS: A model management system that supports model reuse, sharing, and integration. Eur. J. Oper. Res. 1994, 72, 214–243. [Google Scholar] [CrossRef]
  13. Guariso, G.; Hitz, M.; Werthner, H. An integrated simulation and optimization modelling environment for decision support. Decis. Support Syst. 1996, 16, 103–117. [Google Scholar] [CrossRef]
  14. Bennett, D. A framework for the integration of geographical information systems and modelbase management. Int. J. Geogr. Inf. Sci. 1997, 11, 337–357. [Google Scholar] [CrossRef]
  15. Reed, M.; Cuddy, S.M.; Rizzoli, A.E. A framework for modelling multiple resource management issues—An open modelling approach. Environ. Model. Softw. 1999, 14, 503–509. [Google Scholar] [CrossRef]
  16. HarmonIT. State of the Art Review: Work Package 1—IT Frameworks (HarmonIT); HR Wallingford Report SR 598; HR Wallingford Ltd.: Wallingford, UK, 2002. [Google Scholar]
  17. Argent, R.M. An overview of model integration for environmental applications—Components, frameworks and semantics. Environ. Model. Softw. 2004, 19, 219–234. [Google Scholar] [CrossRef]
  18. Allan, B.A.; Armstrong, R.; Bertrand, F.; Chiu, K.; Dahlgren, T.L.; Damevski, K.; Elwasif, K.D.; Epperly, T.G.W.; Govindaraju, M.; Katz, D.S.; et al. A component architecture for high-performance scientific computing. Int. J. High Perform. Comput. 2006, 20, 163–202. [Google Scholar] [CrossRef]
  19. Castronova, A.M.; Goodall, J.L. A generic approach for developing process-level hydrologic modeling components. Environ. Model. Softw. 2010, 25, 819–825. [Google Scholar] [CrossRef]
  20. Leavesley, G.H.; Markstrom, S.L.; Brewer, M.S.; Viger, R.J. The modular modeling system (MMS)—The physical process modeling component of a database-centered decision support system for water and power management. Water Air Soil Pollut. 1996, 90, 303–311. [Google Scholar] [CrossRef]
  21. Sydelko, P.J.; Majerus, K.A.; Dolph, J.E.; Taxon, T.N. A dynamic object-oriented architecture approach to ecosystem modeling and simulation. In Proceedings of the American Society of Photogrammetry and Remote Sensing Annual Conference, Portland, OR, USA, 17–21 May 1999.
  22. Rizzoli, A.E.; Davis, J.R.; Abel, D.J. Model and data integration and re-use in environmental decision support systems. Decis. Support Syst. 1998, 24, 127–144. [Google Scholar] [CrossRef]
  23. Costanza, R.; Voinov, A. Spatially Explicit Landscape Simulation Modeling; Springer: New York, NY, USA, 2003. [Google Scholar]
  24. Rahman, J.M.; Seaton, S.P.; Perraud, J.-M.; Hotham, H.; Verrelli, D.I.; Coleman, J.R. It’s TIME for a new environmental modelling framework. In Proceedings of the MODSIM 2003 International Congress on Modelling and Simulation, Townsville, Australia, 14–17 July 2003.
  25. Whelan, G.; Castleton, K.J.; Buck, J.W.; Hoopes, B.L.; Pelton, M.A.; Strenge, D.L.; Gelston, G.M.; Kickert, R.N. Concepts of a Framework for Risk Analysis in Multimedia Environmental Systems; Pacific Northwest National Laboratory: Richland, WA, USA, 1997. [Google Scholar]
  26. David, O.; Markstrom, S.L.; Rojas, K.W.; Ahuja, L.R.; Schneider, I.W. The object modeling system. In Agricultural System Models in Field Research and Technology Transfer; Ahuja, L.R., Ma, L., Howell, T.A., Eds.; CRC Press: Boca Raton, FL, USA, 2002; pp. 317–331. [Google Scholar]
  27. Gijsbers, P.J.A.; Moore, R.V.; Tindall, C.I. HarmonIT: Towards OMI, an Open Modelling Interface and Environment to harmonise European developments in water related simulation software. In Hydroinformatics 2002; Cluckie, I.D., Han, D., Davis, J.P., Heslop, S., Eds.; IWA Publishing: London, UK, 2002; Volume 2, pp. 1268–1275. [Google Scholar]
  28. Paik, K.; Kim, J.H.; Kim, H.S.; Lee, D.R. A conceptual rainfall-runoff model considering seasonal variation. Hydrol. Process. 2005, 19, 3837–3850. [Google Scholar] [CrossRef]
  29. Jang, T.; Kim, H.; Kim, S.; Seong, C.; Park, S. Assessing irrigation water capacity of land use change in a data-scarce watershed of Korea. J. Irrig. Drain. Eng. 2011, 138, 445–454. [Google Scholar] [CrossRef]
  30. Fumikazu, N.; Toshisuke, M.; Yoshio, H.; Hiroshi, T.; Kimihito, N. Evaluation of water resources by snow storage using water balance and tank model method in the Tedori River basin of Japan. Paddy Water Environ. 2013, 11, 113–121. [Google Scholar] [CrossRef]
  31. Hong, N.; Hama, T.; Suenaga, Y.; Aqili, S.W.; Huang, X.; Wei, Q.; Kawagoshi, Y. Application of a modified conceptual rainfall–runoff model to simulation of groundwater level in an undefined watershed. Sci. Total Environ. 2016, 541, 383–390. [Google Scholar] [CrossRef] [PubMed]
  32. Song, J.H.; Kang, M.S.; Song, I.; Jun, S.M. Water balance in irrigation reservoirs considering flood control and irrigation efficiency variation. J. Irrig. Drain Eng. 2016, 142, 04016003. [Google Scholar] [CrossRef]
  33. Li, X.; Guo, S.; Liu, P.; Chen, G. Dynamic control of flood limited water level for reservoir operation by considering inflow uncertainty. J. Hydrol. 2010, 391, 124–132. [Google Scholar] [CrossRef]
  34. Wu, Y.P.; Chen, J. An operation-based scheme for a multiyear and multipurpose reservoir to enhance macroscale hydrologic models. J. Hydrometeorol. 2012, 13, 270–283. [Google Scholar] [CrossRef]
  35. Kang, M.S.; Park, S.W.; Lee, J.J.; Yoo, K.H. Applying SWAT for TMDL programs to a small watershed containing rice paddy fields. Agric. Water Manag. 2006, 79, 72–92. [Google Scholar] [CrossRef]
  36. Kang, M.S. Development of Total Maximum Daily Loads Simulation System Using Artificial Neural Networks for Satellite Data Analysis and Nonpoint Source Pollution Models. Ph.D. Thesis, Seoul National University, Seoul, Korea, 2002. [Google Scholar]
  37. Kang, M.S.; Park, S.W. Development and application of total maximum daily loads simulation system using nonpoint source pollution model. J. Korea Water Resour. Assoc. 2003, 36, 117–128. [Google Scholar] [CrossRef]
  38. Monteith, J.L.; Szeicz, G.; Waggoner, P.E. The measurement and control of stomatal resistance in the field. J. Appl. Ecol. 1965, 2, 345–355. [Google Scholar] [CrossRef]
  39. Allen, R.G.; Jensen, M.E.; Wright, J.L.; Burman, R.D. Operational estimates of reference evapotranspiration. Agron. J. 1989, 81, 650–662. [Google Scholar] [CrossRef]
  40. Georgiou, P.E.; Papamichail, D.M. Optimization model of an irrigation reservoir for water allocation and crop planning under various weather conditions. Irrig. Sci. 2008, 26, 487–504. [Google Scholar] [CrossRef]
  41. Doorenbos, J.; Pruitt, W.O. FAO Irrigation and Drainage Paper No. 24: Crop Water Requirements; Food and Agriculture Organization of the United Nation: Rome, Italy, 1977. [Google Scholar]
  42. Wu, Y.; Chen, J. Estimating irrigation water demand using an improved method and optimizing reservoir operation for water supply and hydropower generation: A case study of the Xinfengjiang reservoir in southern China. Agric. Water Manag. 2013, 116, 110–121. [Google Scholar] [CrossRef]
  43. Chung, H.W.; Kim, S.J.; Kim, J.S.; Noh, J.K.; Park, K.U.; Son, J.K.; Yoon, K.S.; Lee, K.H.; Lee, N.H.; Chung, S.O.; et al. Irrigation and Drainage Engineering; Dongmyeong Publisher: Seoul, Korea, 2006. [Google Scholar]
  44. Willmott, C.J. On the validation of models. Phys. Georg. 1981, 2, 184–194. [Google Scholar]
  45. Moriasi, D.N.; Arnold, J.G.; Van Liew, M.W.; Bingner, R.L.; Harmel, R.D.; Veith, T.L. Model evaluation guidelines for systematic quantification of accuracy in watershed simulations. Trans. ASABE 2007, 50, 885–900. [Google Scholar] [CrossRef]
  46. Rahman, J.M.; Cuddy, S.M.; Watwon, F.G.R. Tarsier and ICMS: Two approaches to framework development. Math. Comput. Simul. 2004, 64, 339–350. [Google Scholar] [CrossRef]
  47. David, O.; Ascough, J.C., II; Lloyd, W.; Green, T.R.; Rojas, K.W.; Leavesley, G.H.; Ahuja, L.R. A software engineering perspective on environmental modeling framework design: The objective Modeling System. Environ. Model. Softw. 2012, 39, 201–213. [Google Scholar] [CrossRef]
  48. Rahman, J.M.; Seaton, S.P.; Cuddy, S.M. Making frameworks more useable: Using model introspection and metadata to develop model processing tools. Environ. Model. Softw. 2004, 19, 275–284. [Google Scholar] [CrossRef]
  49. Jeon, J.H.; Yoon, C.G.; Jung, K.W.; Jang, J.H. HSPF-Paddy simulation of water inflow and quality for the Saemangeum watershed in Korea. Water Sci. Technol. 2007, 56, 123–130. [Google Scholar] [CrossRef] [PubMed]
  50. Kim, S.M.; Im, S.J.; Park, S.W.; Lee, J.J.; Benham, B.L.; Jang, T.I. Assessment of wastewater reuse effects on nutrient loads from paddy field using field-scale water quality model. Environ. Model. Assess. 2008, 13, 305–313. [Google Scholar] [CrossRef]
  51. Sugawara, M. On the analysis of runoff structure about several Japanese rivers. Jpn. J. Geophys. 1961, 2, 1–76. [Google Scholar]
  52. Ahmad, S.W. Tank model application for runoff and infiltration analysis on sub-watersheds in Lalindu, Southeast Sulawesi province. Civ. Environ. Res. 2016, 8, 88–97. [Google Scholar]
  53. Heryansyah, A.; Goto, A.; Yanuar, M.J.P. Runoff modeling as a basis of a water quality hydrological model for Cidanau watershed, Banten Province, Indonesia. In Proceeding of the 3rd Seminar: Toward Harmonization between Developments and Environmental Conservation in Biological Production, Serang, Indonesia, 4–6 December 2003.
Figure 1. Basic concept for COMFARM (various modeling systems for any particular discipline can be constructed by connecting linkable components with element modules in COMFARM).
Water 08 00351 g001
Figure 2. Schematic representation of COMFARM’s architecture. Modular models can be linked in COMFARM at various levels of complexity; a linkable model component encompasses all parts of an available modeling system with a generalized architecture. COMFARM allows modelers and users to construct and apply various modeling systems from any discipline by connecting components with modules, as indicated by the dotted rectangle.
Water 08 00351 g002
Figure 3. Flow diagram: COMFARM-based modeling system with major linkable components developed in this study for agricultural water-cycle analysis at the watershed scale.
Water 08 00351 g003
Figure 4. Agricultural watershed-modeling system with various linkable objects, including dataflow, execution phases, and output data. Connectivity arrows indicate the dataflow between the source and target; object represents a functional sub-unit that has been realized into an individual module in COMFARM.
Water 08 00351 g004
Figure 5. Modeling system linked by components with object-oriented modules for water-cycle analysis at the watershed scale.
Water 08 00351 g005
Figure 6. Upstream-watershed reservoir. Dialog boxes: (a) reads watershed information such as the watershed area and ratio of paddy, forest, and field; (b) determines the parameters of the hydrological model for the analysis of the reservoir inflow; (c) analyzes reservoir inflow from upstream watershed; and (d) plots the resulting reservoir inflow data in a graph.
Water 08 00351 g006
Figure 7. Reservoir water balance. Dialog boxes: (a) sets the initial reservoir levels; (b) determines the reservoir storage; (c) analyzes reservoir water balance; and (d) displays the average annual reservoir water balance.
Water 08 00351 g007
Figure 8. Downstream-watershed reservoir. Dialog boxes: (a) sets crop coefficients; (b) determines the parameters for the analysis of evapotranspiration; (c) analyzes crop-water requirements; and (d) displays the average crop-water requirements.
Water 08 00351 g008
Figure 9. Comparison of the observed to the simulated reservoir water levels for (a) the calibration; (b) validation periods; and (c) 1:1 line plot between the simulated and observed water levels. The dashed line represents a least square regression line.
Water 08 00351 g009
Table 1. Name and function description for basic modules developed in this study.
ComponentsModule NameDetailed Function Description
Reservoir’s upstream watershed runoffWatershed land-use areaInput of the ratios of upland, paddy, and forest for an entire watershed area
TANK-model parameter setupDetermination of TANK-model parameters from the land-use ratios, including upland, paddy, and forest
Meteorological dataInput of meteorological data, including rainfall, evaporation, temperature, relative humidity, solar radiation, and wind speed
Meteorological data (Grid)Input of grid-based meteorological data for the rainfall, evaporation, temperature, relative humidity, solar radiation, and wind speed
Meteorological data (Spreadsheet)Input of spreadsheet meteorological data for the rainfall, evaporation, temperature, relative humidity, solar radiation, and wind speed
Watershed runoffSimulation of the watershed runoff into a reservoir using the TANK model
Annual runoff outputDaily runoff simulation with the TANK model on a yearly basis
Continuous daily runoffContinuous daily-runoff simulation with the TANK model for studying entire periods
Display of watershed runoffGraphical representation of the watershed runoff
Reservoir water balanceReservoir water balanceReservoir balance between water inflow (watershed runoff and precipitation) and outflow (evaporation, irrigation, and discharge)
Reservoir storageReservoir storage estimation using water level and reservoir-storage volume relation
Reservoir water levelCurrent setting for the reservoir water level
Display of reservoir water balanceGraphical print of the reservoir water balance
Results of water balanceTabulated print of the reservoir water balance
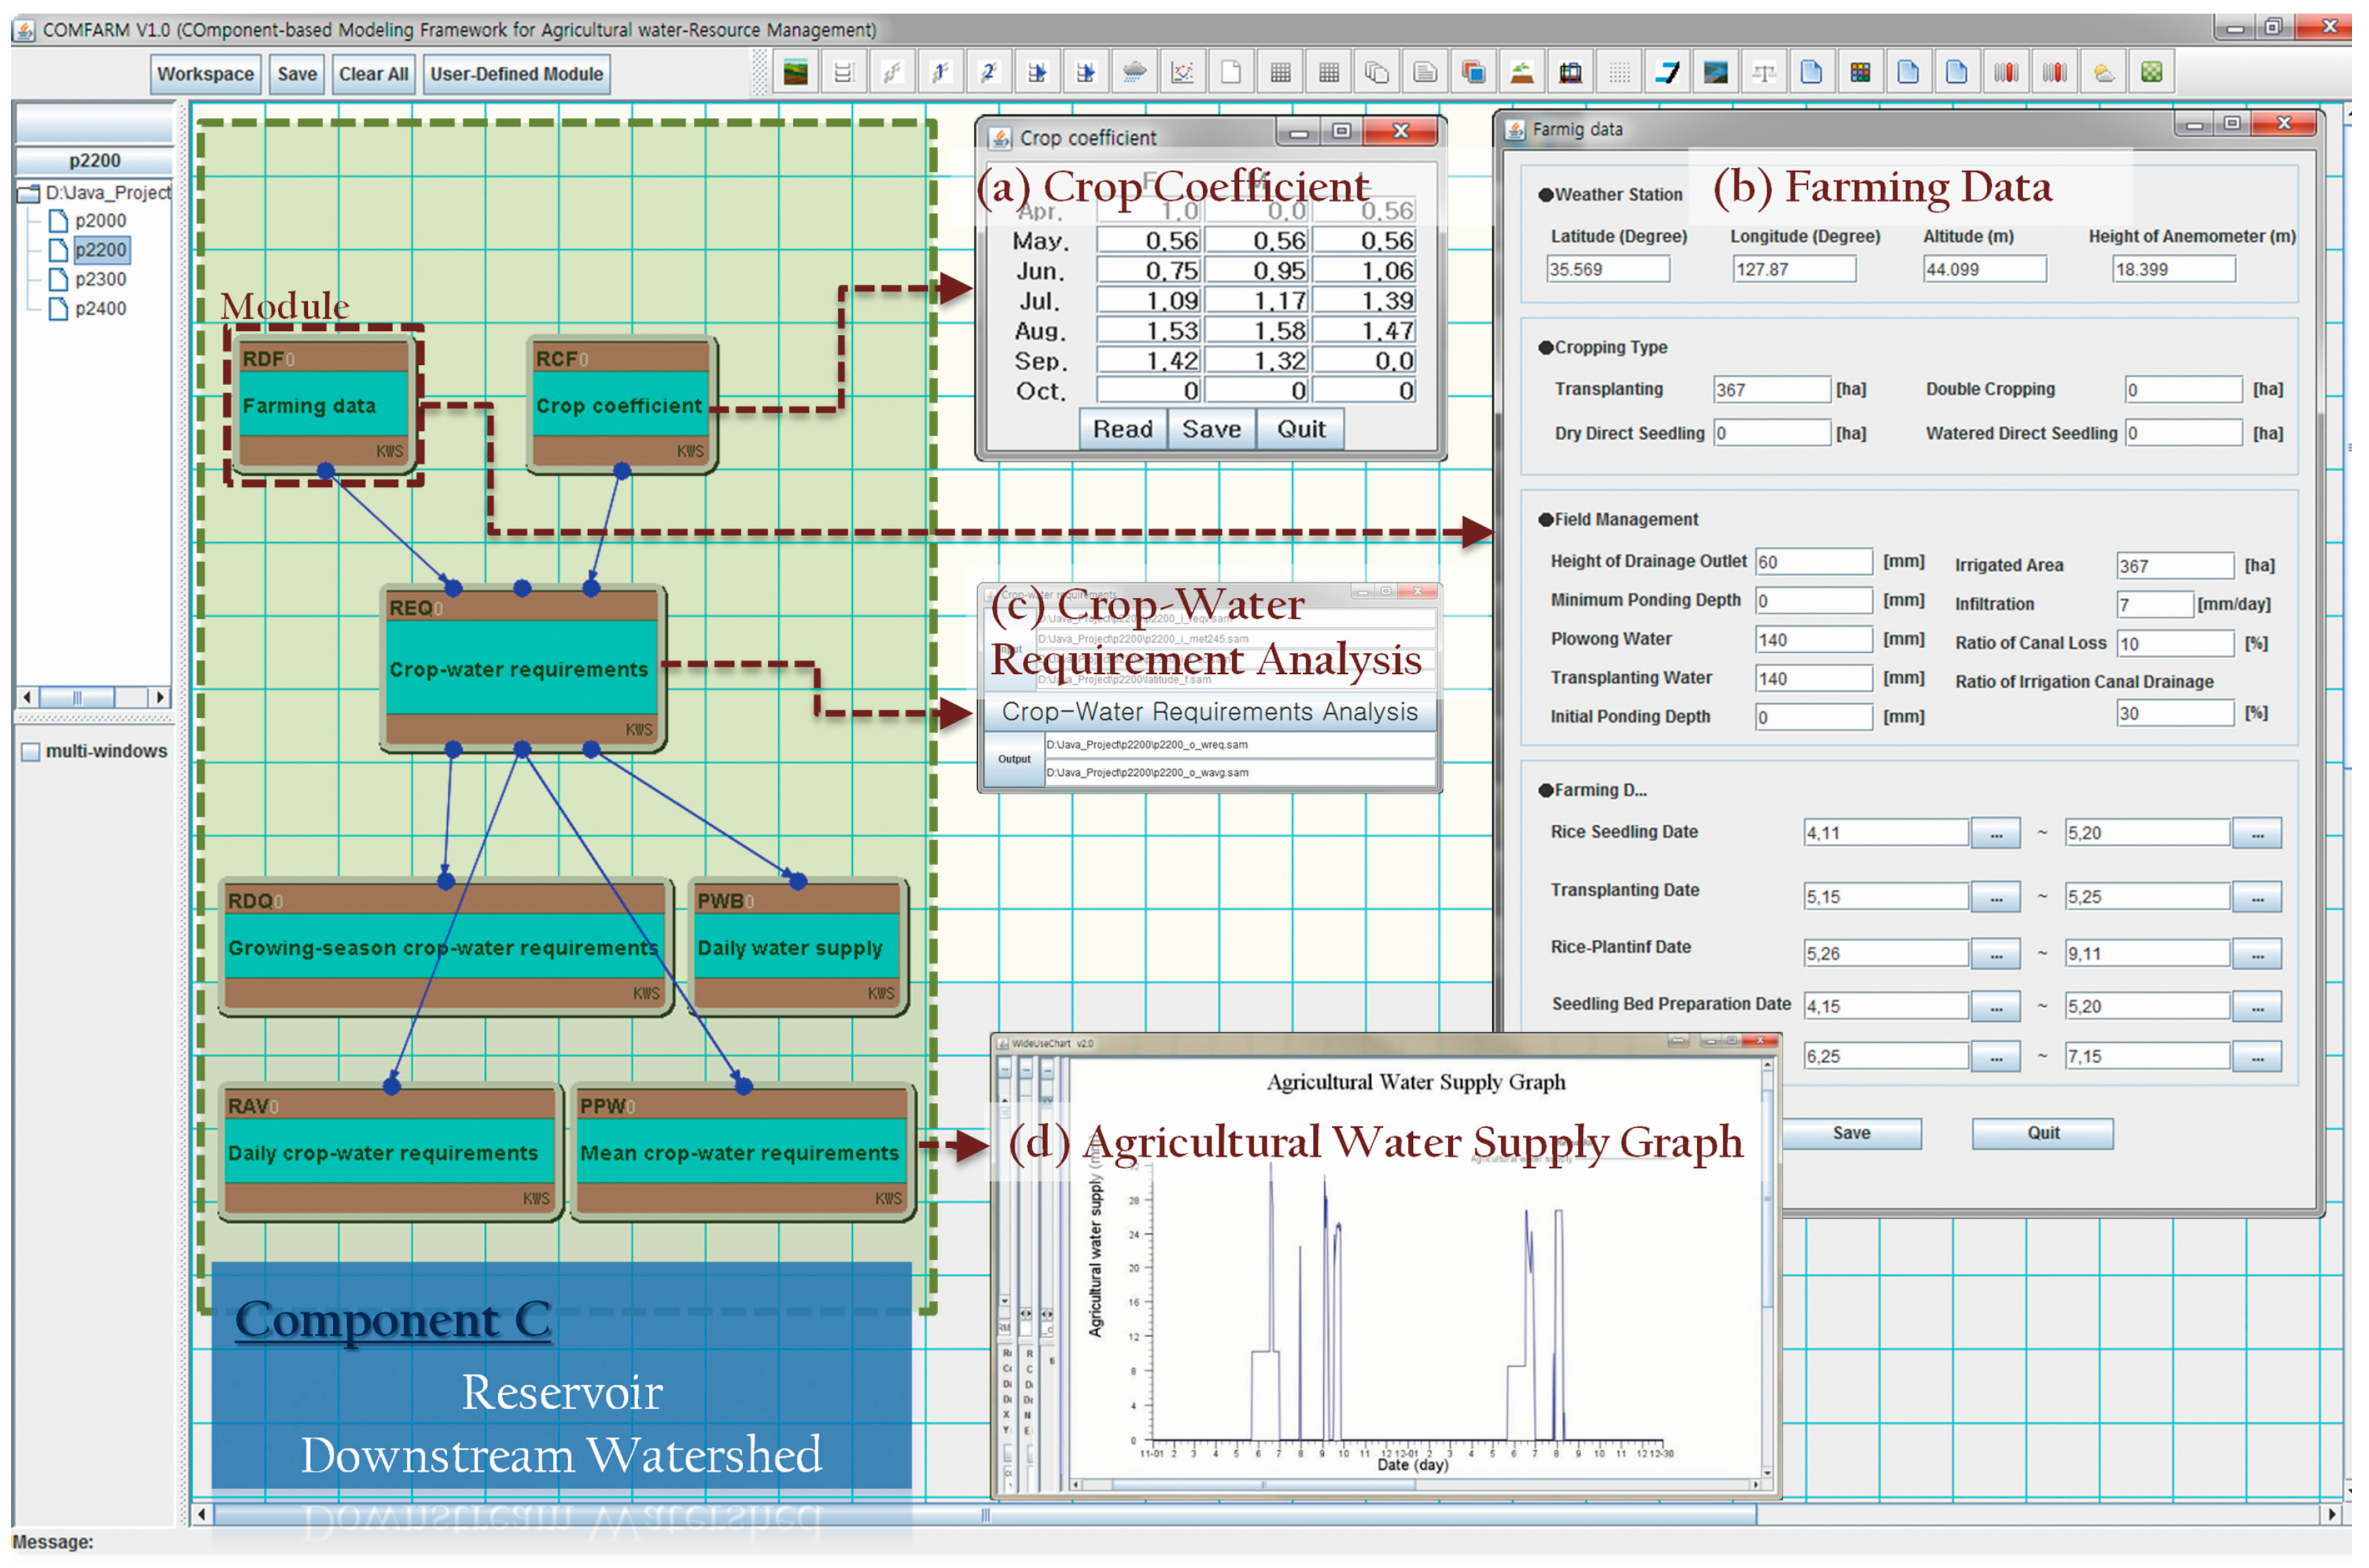
Agricultural water supplyFarming DataInput of farming data including cropping types, height of drainage outlet, minimum ponding depth, infiltration, irrigated area, irrigation efficiency, and farming date
Crop-water requirementsEstimation of the crop-water requirements using an evapotranspiration equation
Crop coefficientInput of a crop coefficient for the evapotranspiration estimation
Daily crop-water requirementsDaily crop-water requirements calculated from an evapotranspiration equation
Growing-season crop-water requirementsGrowing-season crop-water requirements calculated from an evapotranspiration equation
Mean crop-water requirementsGraphical representation of the mean crop-water supply determined from the estimated evapotranspiration
Daily water supplyGraphical representation of the daily water supply for crops based on the evapotranspiration estimation
Downstream reservoirIrrigation district analysisHydrological analysis of the reservoir’s irrigation districts
Non-irrigation district analysisHydrological analysis of the reservoir’s non-irrigation districts
Downstream water qualityWater-quality simulation for the reservoir-irrigated paddy fields
Table 2. Basic data for the Seon-Am Reservoir, the upstream watershed, and the irrigation district used in this study.
Upstream Watershed of the ReservoirReservoirIrrigation District
Area (km2)Paddy (%)Upland (%)Forest (%)Total Storage (104 m3)Normal Pool Level (m)Flood-Limited Level (m)Dead Level (m)Area (km2)
5.2314.08.854.485.448.046.537.02.22

