Article

Treatment of Simulated Coalbed Methane Produced Water Using Direct Contact Membrane Distillation

1
Department of Environment and Energy, Sejong University, Seoul 143-747, Korea
2
Gas Resources Technology Center R & D Div. Korea Gas Corporation 1248, Ansan 426-790, Korea
*
Author to whom correspondence should be addressed.
Water 2016, 8(5), 194; https://doi.org/10.3390/w8050194
Submission received: 7 March 2016 / Revised: 25 April 2016 / Accepted: 4 May 2016 / Published: 10 May 2016

Abstract

:
Expolitation of coalbed methane (CBM) involves production of a massive amount saline water that needs to be properly managed for environmental protection. In this study, direct contact membrane distillation (DCMD) was utilized for treatment of CBM-produced water to remove saline components in the water. Simulated CBM waters containing varying concentrations of NaCl (1, 20, and 500 mM) and NaHCO3 (1 and 25 mM) were used as feed solutions under two transmembrane temperatures (Δ40 and 60 °C). In short-term distillation (~360 min), DCMD systems showed good performance with nearly 100% removal of salts for all solutes concentrations at both temperatures. The permeate flux increased with the feed temperature, but at a given temperature, it remained fairly stable throughout the whole operation. A gradual decline in permeate flux was observed at Δ60 °C at high NaHCO3 concentration (25 mM). In long-term distillation (5400 min), the presence of 25 mM NaHCO3 further decreased the flux to 25%–35% of the initial value toward the end of the operation, likely due to membrane fouling by deposition of Ca-carbonate minerals on the pore openings. Furthermore, pore wetting by the scalants occurred at the end of the experiment, and it increased the distillate conducitivity to 110 µS·cm−1. The precipitates formed on the surface were dominantly CaCO3 crystals, identified as aragonite.

1. Introduction

Coal bed methane (CBM) is a non-conventional gas that supplies approximately 7.5% of the natural gas demand in the United States (US) [1]. CBM is reservoired in a coal seam as pressurized sorbed gas phase, and produced through a borehole to the surface. Expoitation of CBM begun as early as 1926 [2], but its greatest increase in development occurred in the late 20th century with political support to encourage exploration into alternative energy sources. CBM production takes place in several countries including the US, Australia, Canada, China, and India, and makes a considerable contribution to the energy portpolio of those countries [3].
In production of CBM, a significant volume of water is produced along with the gas, especially in the early stage of production [4]. The produced water quality varies widely, depending on site characteristics such as geologic formations, bed depth, aquifer recharge, and etc., but in general, the waters are highly saline and dominated by sodium, bicarbonate, and chloride. According to Meng et al. [5], CBM-produced waters are alkaline Na-HCO3-Cl and Na-HCO3 type waters in the US, Canada, Australia, and China. These waters, when applied to land for irrigation, impair the soil quality by significantly increasing the soil pH and saturating the soil matrix with sodium [6,7], and many researchers have found plant growth suppression and plant water stress when using the water for cultivation [8]. For these reasons, produced water management has been a major concern of the CBM industry.
CBM-produced water has been managed in different ways. Some of the common management practices include underground injection, impoundment, surface discharge, and treatment for use in agricultural, industrial and other purposes [2]. Re-injection and discharge of the produced water become feasible options only when the water is produced in small quantities or the water contains the relatively low level of salinity and TDS (total dissolved solids). For the management of highly saline CBM-produced water, treatment is necessary to meet water regulatory standards in each country. In Australia, CBM-produced water has been mainly treated by reverse osmosis (RO) desalination before discharging to the environment, but there was a limitation in complete water recovery and operation costs [9]. Recently, membrane distillation process has been investigated for the treatment of coal seam gas produced water [10,11]. Pangarkar et al. [12] noted that membrane distillation has some great advantages as compared to RO process, including performance and operation cost. Moreover, it requires a small energy input, which allows the use energy onsite energy sources such as solar heat and geothermal energy [13,14,15].
The membrane distillation process involves the separation of pure water phase across the porous membrane driven by the the vapor pressure gradient induced by the temperature gradient [16]. There are several types of distillation processes depending on the mode of operation including air gap membrane distillation [17], vacuum membrane distillation [18], and direct contact membrane distillation (DCMD) [19], In DCMD, water vapor is transported by the partial pressure difference across the membrane from feed side to the permeate side and condenses in the permeate side [19]. DCMD is attracting much attention due to the simple operation and cost-effective equipment [20].
The DCMD process has shown great promise in the remediation of saline water, including seawater, and the primary focus has been on removing the salinity (Na and Cl) from the water [21,22,23]. Furthermore, the pilot study of applying DCMD for the saline water has been performed, showing the stability of membrane based system in treating highly saline water [24]. However, the water chemistry of CB-produced water is fairly different from that of seawater. As aforementioned, one of the major components is HCO3, and in some cases, a high level of calcium (~5530 ppm) and magnesium (~511 ppm) ions have been also detected [25]. A few researchers have tried to treat the contaminated water with high concentrations of bicarbonate and supersaturated calcium salts using DCMD, but the experiments were limited to short-term (<10 h) [26,27]. Thus, in order to apply DCMD to CBM-produced waters, it is necessary to investigate the performance of DCMD under the conditions pertinent to CBM water chemistry for long-term.
In this study, artificial CBM water containing varying levels of NaCl (1–500 mM) and NaHCO3 (1–25 mM) with fixed amounts of Ca2+ and Mg2+ (5 mM each) were used as the feed solutions in the lab-scale DCMD system. The removal efficiency of solutes by the DCMD was evaluated by measuring distillate conductivities after short-term (360 min) and long-term (5400 min) experiments. Permeate flux variations in response to water chemistry and transmembrane temperature were also monitored throughout the operation. Membrane surface analyses were performed to characterize membrane fouling that occured during extended operation of the system.

2. Materials and Methods

2.1. Chemical Reagents and Membrane Module

Sodium chloride (NaCl), calcium chloride dehydrate (CaCl2·2H2O), magnesium chloride (MgCl2), and sodium bicarbonate (NaHCO3) salts were obtained from Sigma-Aldrich (USA), and were used for preparation of simulated CBM water as a feed solution. The feed solutions were prepared by dissolving known amount of NaCl (1, 20, and 500 mM) and NaHCO3 (1 and 25 mM) salts, and a fixed amount of CaCl2 (5 mM) and MgCl2 (5 mM) in distilled de-ionized water (DDW, 3.86 ± 2.78 μS·cm−1) under magnetic stirring. The components of the simulated CBM water are shown in Table 1. A laboratory scale DCMD module was manufactured using acrylic frame and stainless steel gasket with the dimension of 7 (L) × 2.5 (W) × 0.3 (H) cm. The hydrophobic PVDF (polyvinylidene fluoride) micro-porous membrane was cut to have the effective distillation area of 1.75 × 10⁻³ m2 and installed in the middle of module. The specifications are given in Table 2.

2.2. Set-up of DCMD

The configuration of the lab-scale DCMD system is shown in Figure 1. The feed reservoir retained the simulated CBM water as feed solution in water bath (Scilab SB-11, Seoul, South Korea) to maintain the feed side temperature, and the permeate reservoir contained de-ionized water as the initial condensing liquid. Temperature of the permeate stream was controlled by heat exchanger and cooling circulator (Scilab SCR-P12, Seoul, South Korea). Gear pumps (Cole-Parmer console drive, IL, USA) were used for the circulation of feed and permeate stream. To avoid the establishment of hydrostatic pressure difference through the membrane by the change of solution level in both tanks during the distillation processing, both feed and permeate reservoirs were located at the place lower than the membrane module. The feed and permeate streams were circulated counter-currently on each side of the membrane interface inside the module. The gap between each side of the membrane and acrylic frame was 3.0 mm and the diameter of inlet and outlet ports was 63.5 mm. An electronic balance (Ohaus arg4202, Hamburg, Germany) recorded the change of permeate mass and the water vapor flux was calculated from Equation (1):
J = d m ρ A m d t
where, J is the permeate flux (L·m−2·h−1, LMH), m is the mass of permeate (kg), Am is the effective area of membrane (m2), t is the distillation time (h), and ρ is the density of permeate solution. The flux ratio (J/J0) was obtained by dividing the J with the initial flux (J0). The averaged J/J0 (avg. J/J0) was calculated by averaging the values of J/J0 during the membrane disitllation. The electrical conductivities and temperature of feed and permeate solutions were measured inside each compartment by WTW Multi 3420 multiparameter (Cole-parmer, IL, USA) and a digital termocouples with an accuracy of ±0.1 °C, respectively.

2.3. Experimental Procedures and Characterization

The experiments of short-term distillation and long-term distillation were conducted separately. The short-term distillation experiments were performed for 360 min to investigate the effect of transmembrane temperature (ΔT, temperature difference between the feed and permeate side was 40 and 60 °C) and salt concentrations (1/20/500 mM NaCl and 1/25 mM NaHCO3: six concentrations of salts) on the permeate flux and distillate conductivities. Membrane was replaced with new ones in each experiment. The simulated CBM water of 2 L was filled in the feed reservoir and the permeate reservoir retained 1 L de-ionized water. The temperature of the feed solution varied from 60 and 80 °C, and the permeate temperature was held at constant 20 °C. The flow rate of permeate stram was set at 0.8 L·min−1, which corresponds to the cross-flow velocity of 0.18 m·s−1, and the measured pH of feed solution was ~8.3.
For long-term distillation experiments, the distillation time was extended to 5400 min in order to investigate a possible scale formation on the membrane surface during the distillation. Two types of feed solution were chosen among the feed solutions used in short-term distillation as follows: (1) 1 mM NaCl/1 mM NaHCO3 at ΔT = 40 °C; (2) 500 mM NaCl/25 mM NaHCO3 at ΔT = 40 °C. The operation conditions were set the same as short-term experiments except for the distillation time. The surface of the membrane before and after long-term distillation was characterized using a field-emission scanning electron microscopy/energy dispersion spectrometry (FE-SEM/EDS, Hitachi S-4200, Tokyo, Japan). The scalants deposited on the membrane surface were collected and analyzed with a X-ray diffraction spectrophotometer (XRD) to investigate the phase identification and determination of crystallinity. The details of operation conditions of DCMD systems are presented in Table 3.

3. Results and Discussions

3.1. Performance of DCMD Systems

In short-term experiments, the concentrations of NaCl and NaHCO3 in feed solutions were varied from 1 to 500 mM and 1 to 25 mM, respectively, to investigate their effects on the overall performance of DCMD. The results indicated that, for a given ΔT, the profiles of permeate fluxes change over time were quite similar to each other at varying salt concentrations, suggesting the variation of salt concentrations in the feed water did not influence the mass transfer of water vapor through the membrane. At Δ40 °C, the permeate flux was consistently maintained near its initial value over entire distillation time for all the conditions empolyed, however at Δ60 °C, the flux showed a gradual decrease, which might be an indication of membrane fouling. A detailed description of the flux decline at Δ60 °C is given in Section 3.2.
Contrary to the salt effect, the transmembrane temperature led to a significant impact on the permeate flux, giving the flux ranges of 18.8–20.5 L·m−2·h−1 at Δ40 °C and 37.2–41.9 L·m−2·h−1 at Δ60 °C (Figure 2a,b). According to Antoine equation, the increase of ΔT results in more difference in vapor pressure across the membrane, creating the driving force for a higher transportation of water vapors [28]. This positive correlation between the flux and ΔT has been demonstrated in previous DCMD studies [29,30,31].
For the treatment of feed solution containing 1 mM NaCl/1 mM NaHCO3 at Δ40 °C, the measured conductivity of the feed solution increased from 4000 to 7800 µS·cm−1 at the end of distillation while it was maintained below 16 µS·cm−1 in the permeate reservoir, giving the rejection rate of salt with over 99.5% (Figure 2c). DCMD treatment at the most severe condition (500 mM NaCl/25 mM NaHCO3 at ΔT of 60 °C) also exhibited an almost complete rejection of salts (>99.8%) throughout entire distillation period (Figure 2d). These results are consistent with previous studies that demonstrated good performances of DCMD in the treatment of various types of water containing high level of salts [24,32,33,34,35,36].

3.2. Permeate Flux Variation at Δ40 °C and Δ60 °C

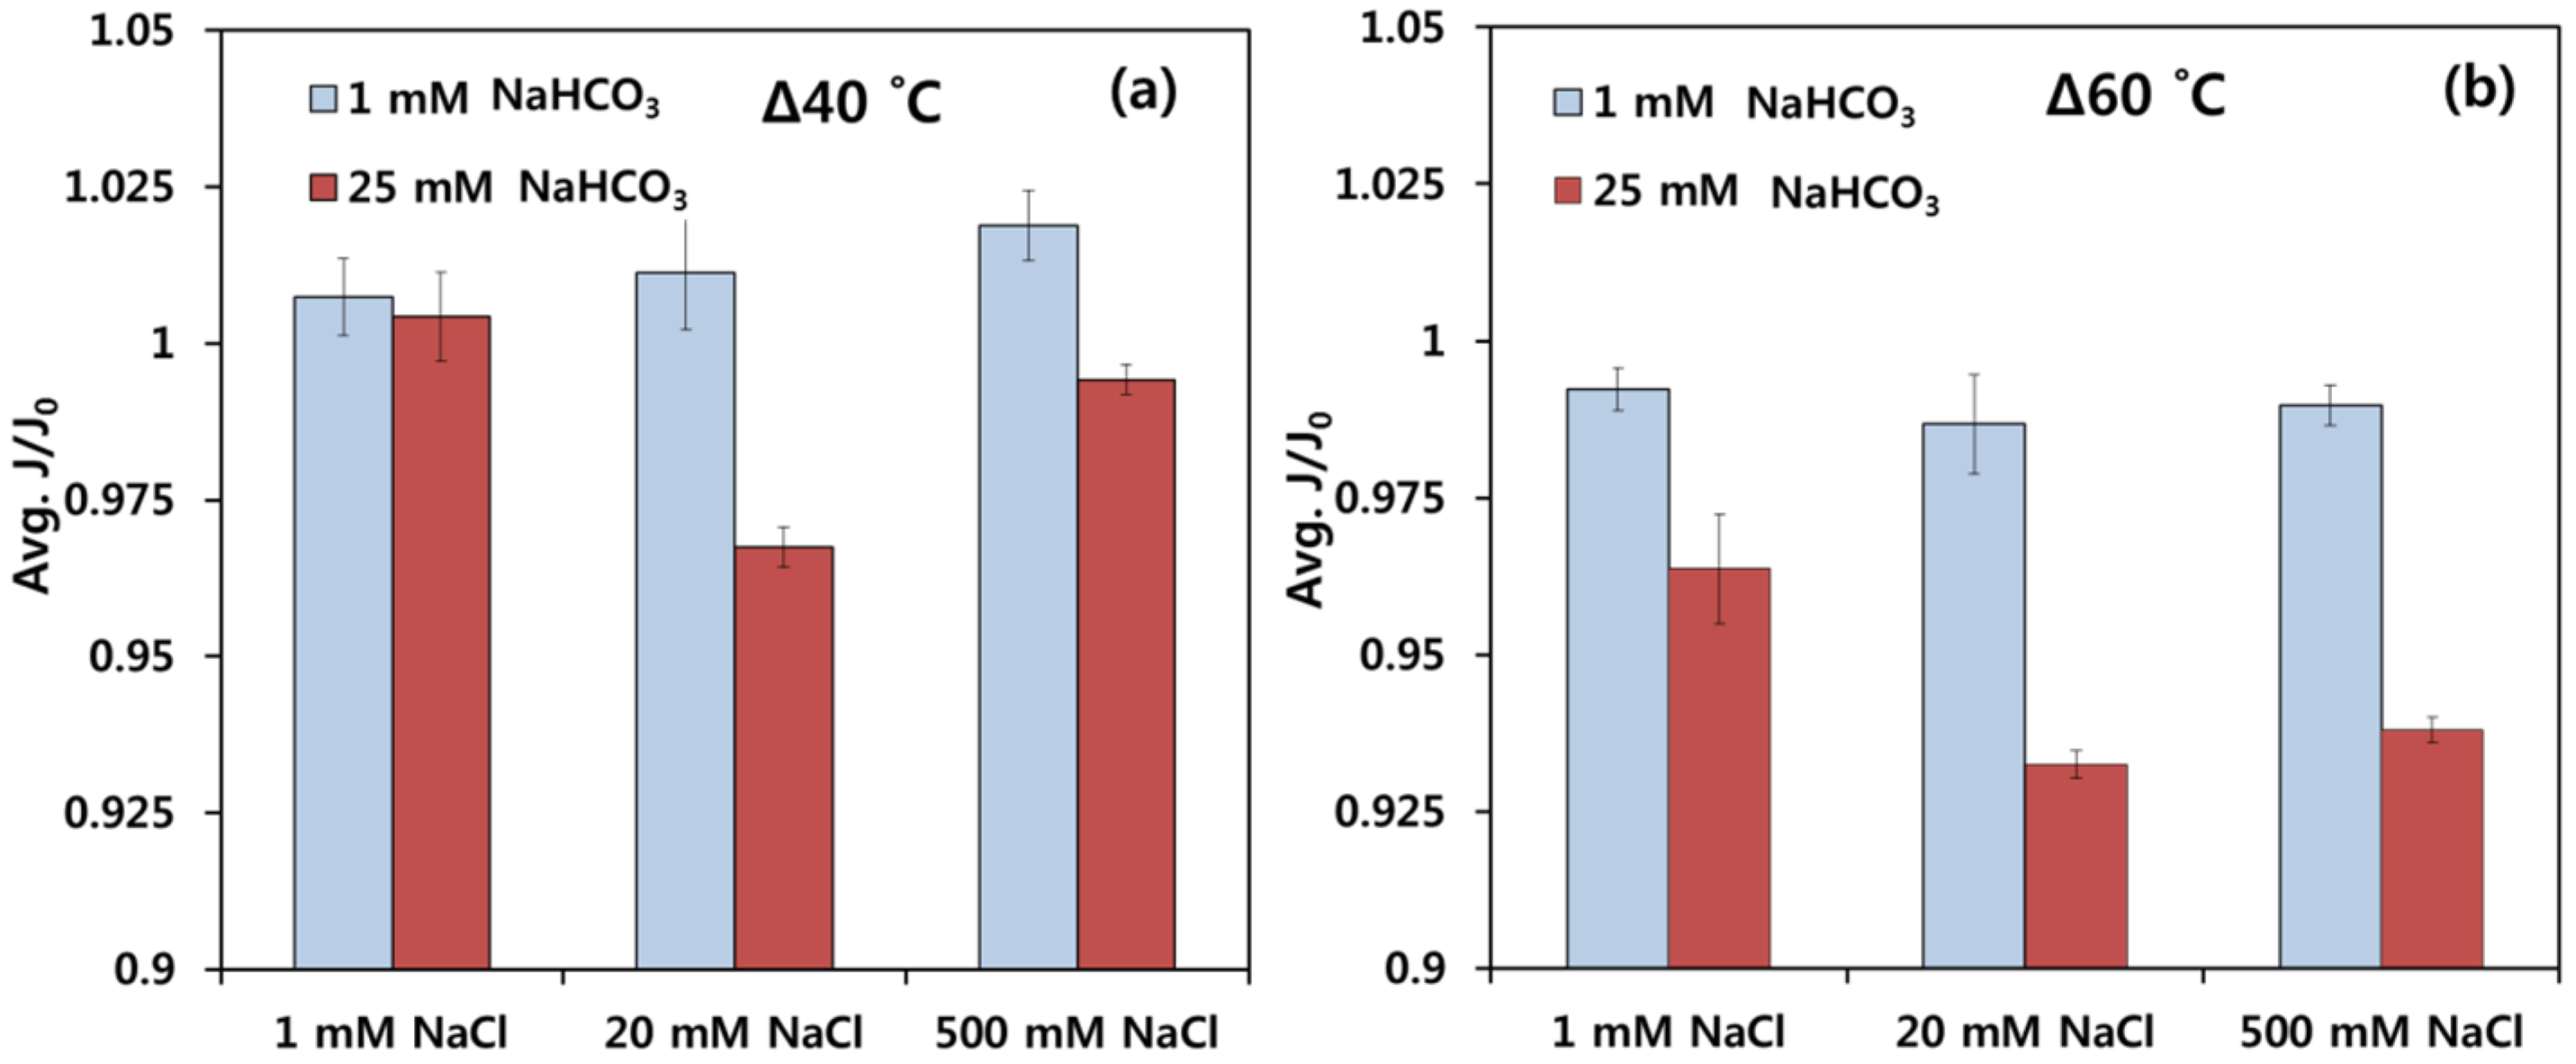
Figure 3a shows the average permeate flux variation ratio (avg. J/J0) with respect to the accumulated volume of water per effective area (Vp) during treatment of feed solutions containing varying levels of NaCl and NaHCO3 concentrations at Δ40 °C. The overall profiles of flux variation appear to remain fairly stable converging to value of 1 despite some degrees of fluctuation (data not shown). This is especially true for solutions containing 1 mM NaHCO3, as the average J/J0 values registered approximately 1.0 regardless of NaCl levels in the feed solutions. The high level of NaCl (500 mM) had no definite influence on the flux, owing to that the feed solution was not hyper-saline. It has been reported increasing ionic strength (NaCl) to 680–820 mM had no influence on permeate flux in membrane distialltion [30,37,38], and the reduction of permeate flux occurred only when treating hyper-saline feed (~5 M) [29].
On the other hand, the feed solution with 25 mM NaHCO3 resulted in less flux (average J/J0 range = 0.965–1.007) than those with 1 mM NaHCO3 (Figure 3a). This is possibly attributed to the alkaline scaling by carbonate minerals that might occur in the waters containing high levels of HCO3 ions. The crystallization of (Ca,Mg)-carbonate minerals could occur on the membrane surface [39,40,41], and the reaction can be expressed by Equation (2):
(Ca,Mg)2+ + 2HCO3 → (Ca,Mg)CO3 + CO2 ↑ + H2O
The scalants formed on the membrane surface could cover the membrane pores and prevent the water vapor from transporting through membrane pores. Mass transfer resistance through the membrane would be also increased by the scale formation [11], reducing the effective area for water evaporation and thereby the water flux [42]. Furthermore, the CO2 generation in the feed solution could cause a permeate flux decline by migrating through membrane pores, hampering the transport of water vapor [43].
However, flux decline was not very obvious in short-term distillations at Δ40 °C. Such an effect of HCO3 was more apparent at Δ60 °C. The permeate flux for the solutions containing 25 mM NaHCO3 gradually reduced from the beginning, yielding average J/J0 values of 0.962, 0.926 and 0.938 at 1, 20, and 500 mM NaCl, respectively (Figure 3b). This suggests the amount of NaHCO3 was sufficient to react with Ca2+ or Mg2+ to induce the carbonate minerals. Thus, HCO3 concentration appears to be a key parameter affecting the permeate flux. Furthermore, the expedited membrane scaling at Δ60 °C is consistent with a change in solubilty of (Ca,Mg)CO3 minerals with temperature. Muryanto et al. [44] and Case et al. [45] suggested that higher temperature in solution led to more and faster precipitation of Ca or Mg-containing solids due to the decrease in the solubility. Meanwhile, the smaller avg. J/J0 value at 20 mM NaCl (0.926) than at 500 mM NaCl (0.938) may be due to the more favorable condition for precipitation of (Ca,Mg)CO3 minerals at 20 mM NaCl such that excessive NaCl concentration can increase the solubility of (Ca,Mg)CO3 minerals to some extent [46]. Thus, in our study, it is likely that the high feed temperature promoted the formation of carbonate minerals, and the relatively large amount of precipitates covered the membrane surface within the short period of time.

3.3. Long-Term Distillation

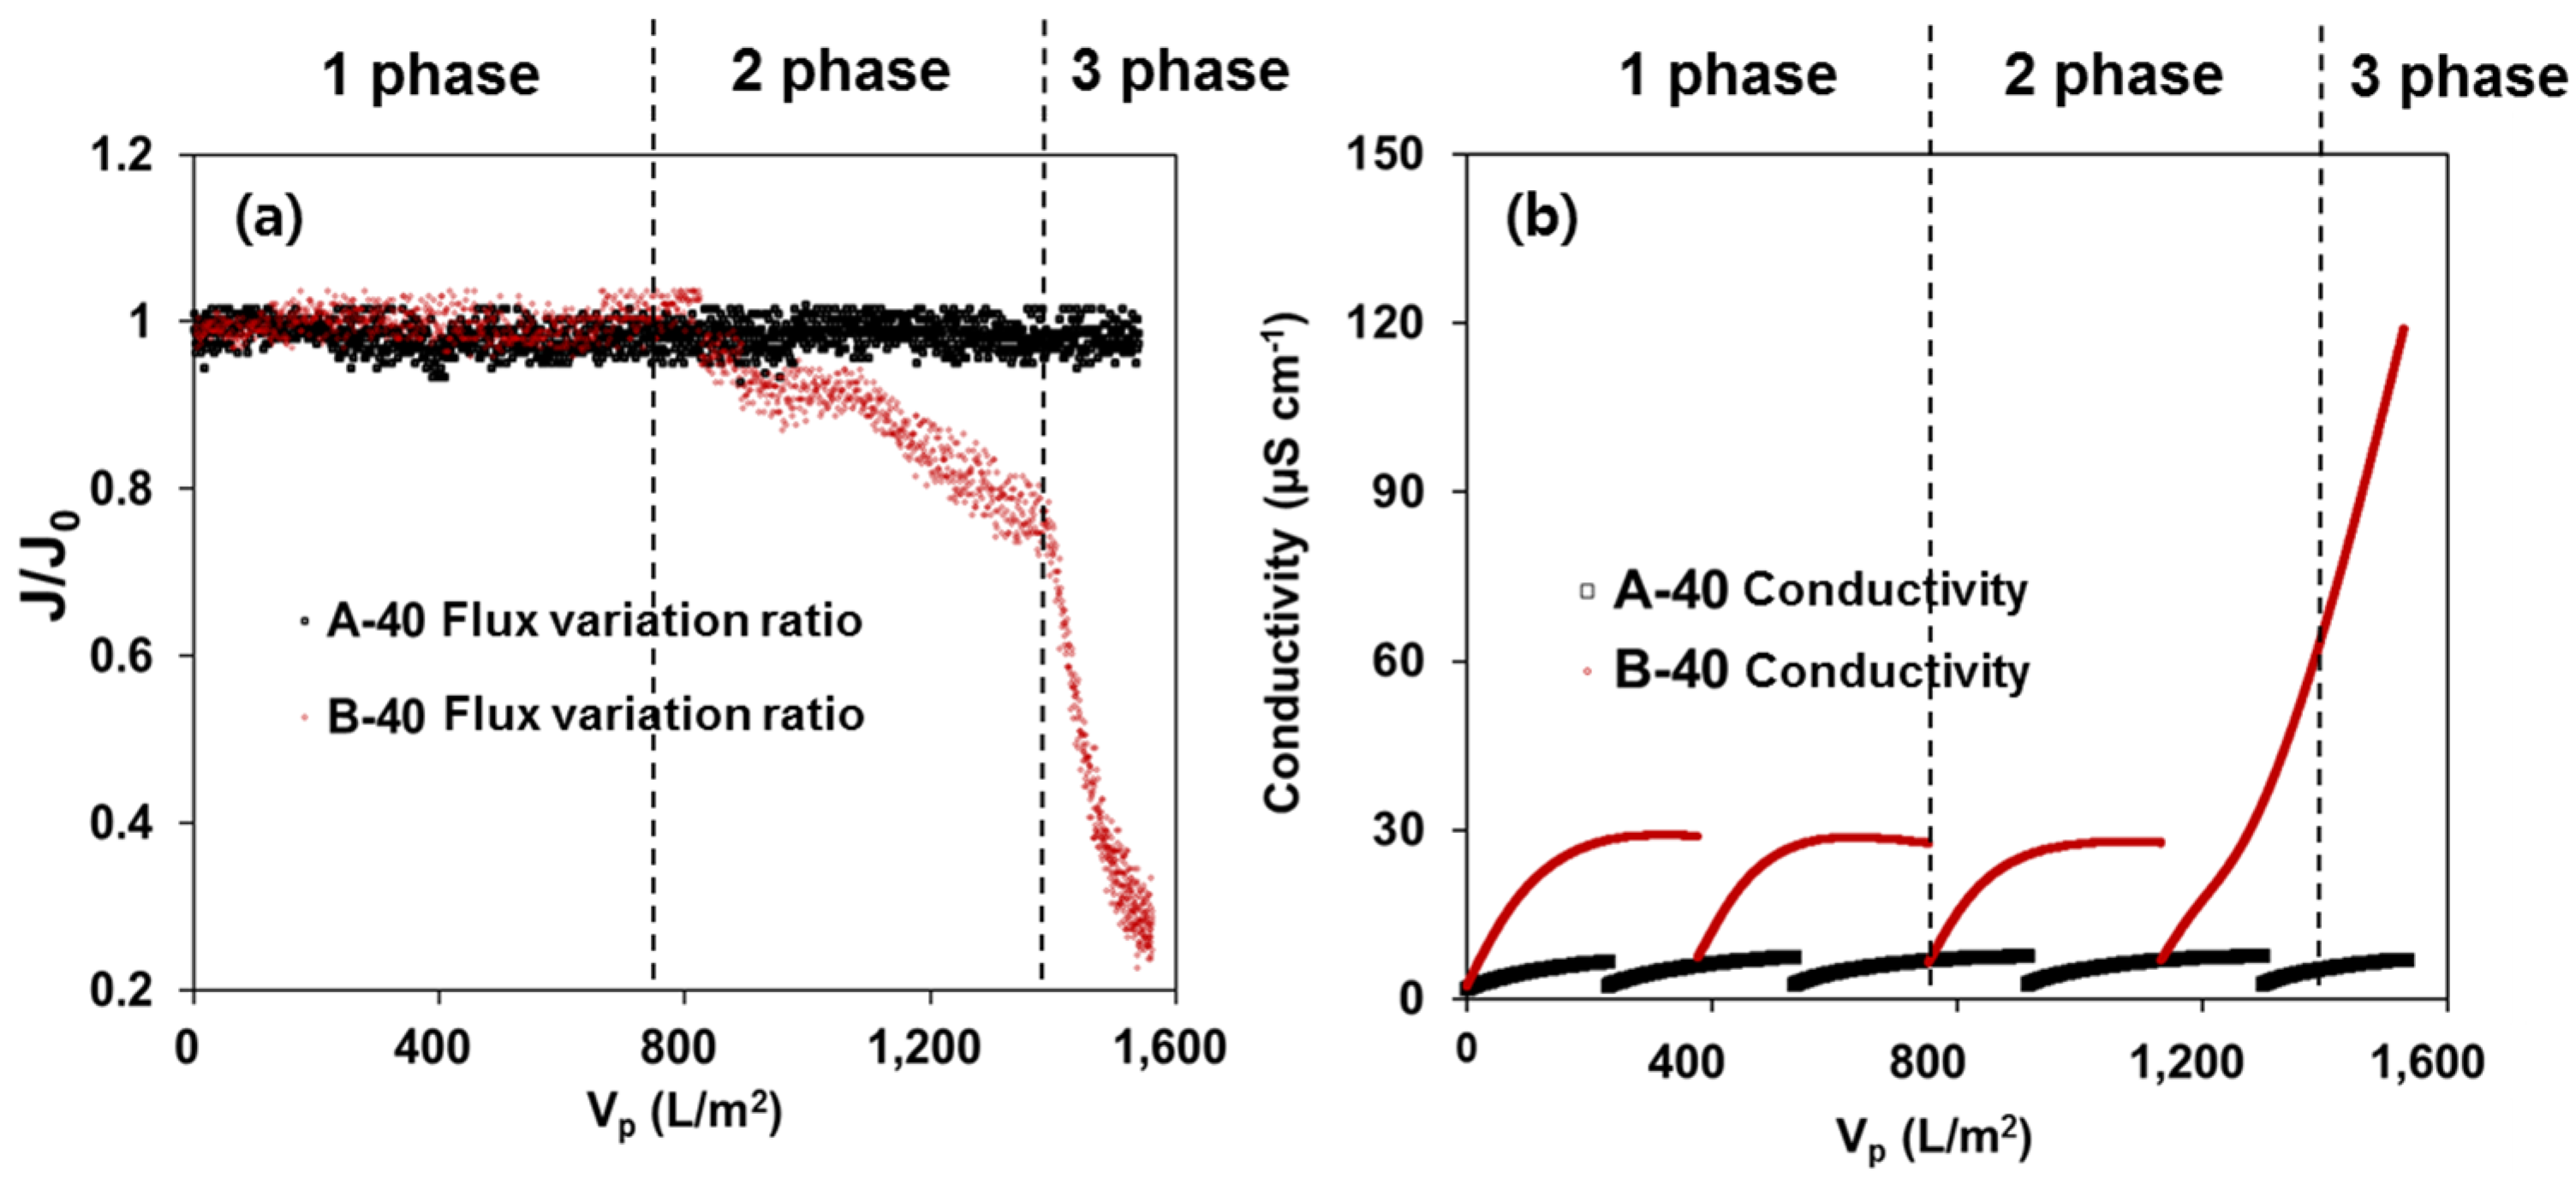
Of the two investigated transmembrane temperatures, the Δ40 °C condition showed the stable performance of DCMD without an impactful decline in permeate flux in short-term experiments. Thus, it was chosen to investigate the long-term (5400 min) performance of the DCMD for the treatment of simulated CBM water. In addition, two conditions of (A) 1 mM NaCl/1 mM NaHCO3 and (B) 500 mM NaCl/25 mM NaHCO3 were selected for the long-term distillation to comparatively examine possible scale formation and wetting on the membrane surface during the distillation. Figure 4 shows the variation of permeate flux ratio and distillate conductivities at Δ40 °C during 5400 min distillation. In DCMD operation at A-condition, J/J0 values were maintained at nearly 1 when increasing VP to 1500 L·m−2 (Figure 4a), indicating the low solute concentrations caused little scale formation and thus no membrane fouling. The rainbow shape of measured conductivities in Figure 4b was due to the repetitive experiment methodology. The distillate accumulated in the reservoir was wasted and the permeate reservoir was prepared to be vacant when newly adding the feed solution into the feed reservoir after the distillation of pre-feed solution. The distillate conductivities were always less than 6 µS·cm−1 with over 99% salt rejection (Figure 4b). The small increase in the conductivity at B condition (30 µS·cm−1) may be attributed to that evolution of CO2 and its absorption in the distillate stream affect the conductivity of the distillate stream via dissolution of CO2.
On the other hand, there were obvious changes in permeate flux at the B-condition, which can be divided into three phases. The flux was kept constant J/J0 of nearly 1 in the first phase until Vp increased to 760 L·m−2. In the second phase, the flux started to decrease gradually at Vp from 760 to 1400 L·m−2, in which the precipitates (scalants) began to cover the membrane surface and then clog the pores. This subsequently led to an increase in mass and heat transfer resistance across the membrane [47]. The third phase showed a significant flux decline (J/J0 = 0.25–0.35) at Vp of 1400–1560 L·m−2, which could be interpreted as a result of the growth of scalants layers on the membrane surface that further aggravated the mass and heat transfer. In this phase, the conductivity of permeat side increased to 110 µS·cm−1 at the end of the distillation (Figure 4b). This increase might be an indication of membrane wetting phenomenon due to the scale formation on membrane surface. The inorganic scaling has been reported to suppress the permeate flux as well as to cause the membrane wetting in some cases [11,48]. Some crystals grow inside the membrane pores during the distillation, and then the liquid-vapor interface is shifted to deeper space in the membrane cross-section. It eventually results in stagnant fluid movement in the pores, and membrane wetting occurs increasingly as growth of salt crystals is expedited.

3.4. Characterizations

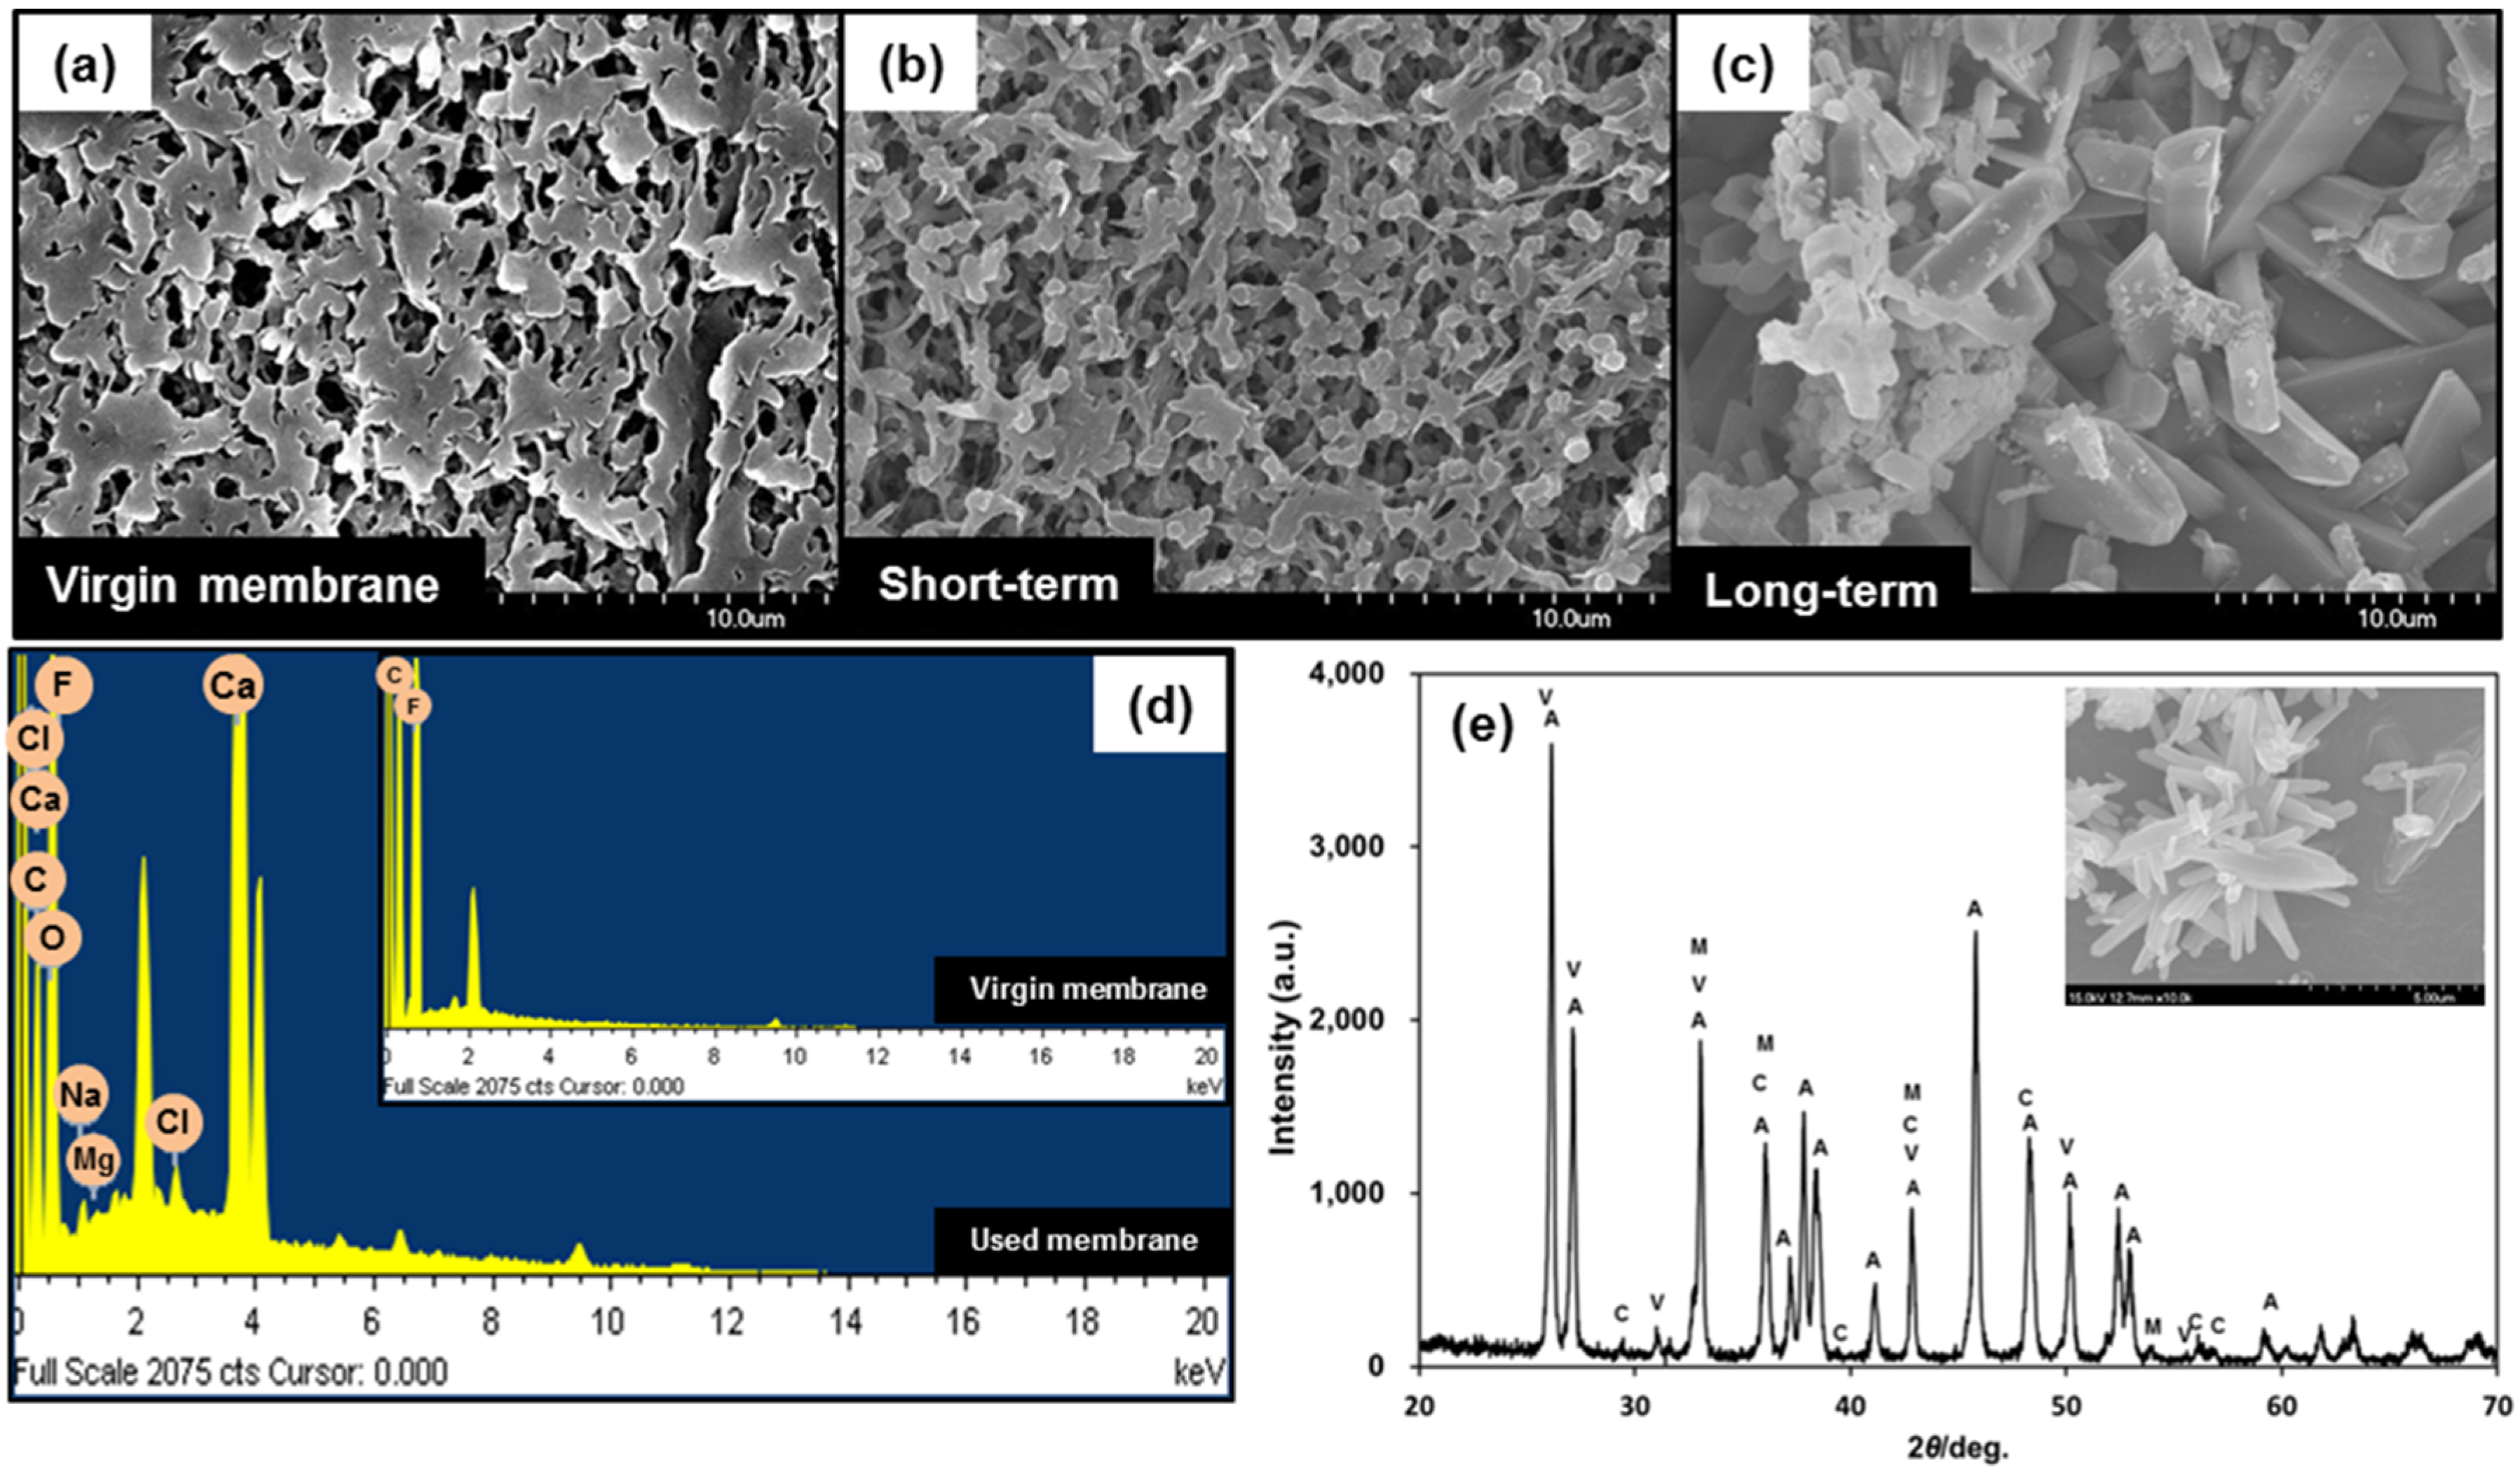
Figure 5 presents the results of the characterization of membrane surface using FE-SEM/EDS and XRD. FE-SEM analysis of virgin membrane revealed that the surface was relatively clean prior to the use (Figure 5a). As compared to the virgin membrane surface, the membrane used for short-term experiment (360 min) at Δ40 °C under the most severe condition had undefined minerals on the surface, but their sizes were very small (Figure 5b). Therefore, the DCMD system at this condition still showed a good performance without membrane fouling. However, the surface was completely covered with relatively large sized crystals after the distillation for 5400 min. (Figure 5c), and it could explain the membrane fouling occurred during long-term distillation. The EDS spectrum also indicated the fouled membrane surface included O (45.73%), Ca (41.80%), C (11.34%), Na (0.39%), Cl (0.37%), Mg (0.12%) and F (0.30%), while only C (55.18%) and F (44.82%) were observed on the virgin membrane surface (Figure 5d). This implies that the scalants on the membrane surface are mainly composed of Ca and CO3. The scalents were collected from the membrane surface for XRD analysis to identify the mineral phases.
XRD patterns of the obtained solid revealed that it consists of mixture of mainly Ca crystalline minerals including aragonite, calcite, varerite, and magnesite (Figure 5e). However, the long plate shapes observed in FE-SEM analysis and the clear peaks of 2θ = 26°, 28°, 32°, 36°, 37°, 38°, 39°, 41°, 43°, 46°, 48°, 50°, 51°, 52°, 52.5°, and 59° indicate the predominant mineral is aragonite. In general, the first step in the precipitation of CaCO3 is nucleation of ions followed by formation of varerite. Varerite re-crystallizes into aragonite and then calcite in aqueous environments. It has been reported that the transformation of aragonite to calcite is retarded in seawater due to inhibition by dissolved magnesium ions, while vaterite to aragonite transformation occurs very quickly [49]. In addition, Pokrovsky [50] showed the presence of Mg2+ inhibited the conversion of aragonite to calcite, and suggested that the inhibiting effect of Mg2+ ions is possibly caused by its rapid dehydration relative to Ca2+(aq) or poisoning of crystal by adsorption onto reactive sites of CaCO3(s). Thus, it is likely that aragonite is the main precipitate during inorganic CaCO3 crystallization in this study.

4. Conclusions

The performance of direct contact membrane distillation in treating produced CBM water was evaluated for short-term (360 min) and long-term distillation (5400 min). During the short-term distillation, over 99.5% rejection of salts from the feed solution was achieved in all operation conditions. Feed temperature was a key parameter governing permeate flux, showing that the higher transmembrane temperature of 60 °C (Δ60 °C) had more higher permeate flux than that of Δ40 °C. However, it was observed that membrane fouling occurred at Δ60 °C more seriously than the distillation at Δ40 °C with the feed solutions containing 25 mM NaHCO3. Therefore, Δ40 °C was chosen as the optimal transmembrane temperature for the long-term experiments to minimize the membrane fouling. For the long-term distillation, the permeate flux at mild conditions (1 mM NaCl/1 mM NaHCO3) was maintained farily constant without serious membrane fouling for 5400 min distillation, but high salt concentrations in the feed soluton (500 mM NaCl/25 mM NaHCO3) induced scale formation on the membrane surface, preventing the water vapor transportation through pores. As the long-term distillation proceeded, the scale formation developed to cover the entire membrane surface, resulting in the permeate flux decline. XRD analysis revealed that the main scalant was aragonite. Further investigation towards finding the appropriate scale control would be necessary for successful implement of the DCMD system for treatment of CBM-produced water.

Acknowledgments

This work was supported by the the Energy Efficiency & Resources of the Korea Institute of Energy Technology Evaluation and Planning (KETEP) granted financial resource from the Ministry of Trade, Industry & Energy, Republic of Korea (No. 20152510101880).

Author Contributions

For research articles with several authors, a short paragraph specifying their individual contributions must be provided. The following statements should be used “J.C. and H.S. conceived and designed the experiments; D.-W.C. and K.Y. performed the experiments; D.-W.C. and J.C. analyzed the data; S.K., J.H. and K.Y. contributed reagents/materials/analysis tools; D.-W.C., H.S., and J.C. wrote the paper.” Authorship must be limited to those who have contributed substantially to the work reported.

Conflicts of Interest

The authors declare no conflicts of interest.

Abbreviations

The following abbreviations are used in this manuscript:
CBMCoalbed methane
TDSTotal dissolved solids
DCMDDirect contact membrane distillation
ROReverse osmosis
XRDX-ray diffraction
FE-SEMField-emission scanning electron microscope
EDSEnergy dispersive spectrometer

References

  1. Nuccio, V.F. Coal-Bed Methane: Potential and Concerns; U.S. Geological Survey: Washington, DC, USA, 2000; Available online: http://pubs.usgs.gov/fs/fs123-00/fs123-00/pdf (accessed on 2 Feburary 2012).
  2. ALL Consulting. Handbook on Coalbed Methane Produced Water: Management and Beneficial Use Alternatives; U.S. Department of Energy: Tulsa, OK, USA, 2003. [Google Scholar]
  3. Hamawand, I.; Yusaf, T.; Hamawand, S.G. Coal seam gas and associated water: A review paper. Renew. Sustain. Energ. Rev. 2013, 22, 550–560. [Google Scholar] [CrossRef]
  4. Plumlee, M.H.; Debroux, J.-F.; Taffler, D.; Graydon, J.W.; Mayer, X.; Dahm, K.G.; Hancock, N.T.; Guerra, K.L.; Xu, P.; Drewes, J.E.; et al. Coalbed methane produced water screening tool for treatment technology and beneficial use. J. Unconv. Oil Gas Resour. 2014, 5, 22–34. [Google Scholar] [CrossRef]
  5. Meng, Y.J.; Tang, D.; Xu, H.; Li, Y.; Gao, L. Coalbed methane produced water in China: Status and environmental issues. Environ. Sci. Pollut. Res. 2014, 21, 6964–6974. [Google Scholar] [CrossRef] [PubMed]
  6. Majee, U.; Chattopadhyay, G.N.; Chaudhury, S. Monitoring of soil environment under influence of coal bed water. Water Air Soil Pollut. 2015, 226, 258. [Google Scholar] [CrossRef]
  7. Burkhardt, A.; Gawde, A.; Cantrell, C.L.; Baxter, H.L.; Joyce, B.L.; Stewart, C.N.; Zheljazkov, V.D. Effects of Produced Water on Soil Characteristics, Plant Biomass, and Secondary Metabolites. J. Environ. Qual. 2015, 44, 1938–1947. [Google Scholar] [CrossRef] [PubMed]
  8. NRC. Management and Effects of Coalbed Methane Produced Water in the Western United States; National Research Council of the National Academies, The National Academies: Washington, DC, USA, 2010. [Google Scholar]
  9. Xu, P.; Drewes, J.E. Viability of nanofiltration and ultra-low pressure reverse osmosis membranes for multi-beneficial use of methane produced water. Sep. Purif. Technol. 2006, 52, 67–76. [Google Scholar] [CrossRef]
  10. Duong, H.C.; Gray, S.; Duke, M.; Cath, T.Y.; Nghiem, L.D. Scaling control during membrane distillation of coal seam gas reverse osmosis brine. J. Membr. Sci. 2015, 493, 673–682. [Google Scholar] [CrossRef]
  11. Duong, H.C.; Chivas, A.R.; Nelemans, B.; Duke, M.; Gray, S.; Cath, T.Y.; Nghiem, L.D. Treatment of RO brine from CSG produced water by spiral-wound air gap membrane distillation—A pilot study. Desalination 2015, 366, 121–129. [Google Scholar] [CrossRef]
  12. Pangarkar, B.L.; Sane, M.G.; Guddad, M. Reverse Osmosis and Membrane Distillation for Desalination of Groundwater: A Review. ISRN Mater. Sci. 2011, 2011, 523124. [Google Scholar] [CrossRef]
  13. Ghaffour, N.; Lattemann, S. Renewable energy-driven innovative energy-efficient desalination technologies. Appl. Energy 2014, 136, 1155–1165. [Google Scholar] [CrossRef]
  14. Suarez, F.; Ruskowitz, J.A. Renewable water: Direct contact membrane distillation coupled with solar ponds. Appl. Energy 2015, 158, 532–539. [Google Scholar] [CrossRef]
  15. Sarbatly, R.; Chiam, C.K. Evaluation of geothermal energy in desalination by vacuum membrane distillation. Appl. Energy 2013, 112, 737–746. [Google Scholar] [CrossRef]
  16. Camacho, L.M.; Dumee, L.; Zhang, J.H.; Li, J.D.; Duke, M.; Gomez, J.; Gray, S. Advances in Membrane Distillation for Water Desalination and Purification Applications. Water 2013, 5, 94–196. [Google Scholar] [CrossRef]
  17. Garcia-Payo, M.C.; Izquierdo-Gil, M.A.; Fernandez-Pineda, C. Air gap membrane distillation of aqueous alcohol solutions. J. Membr. Sci. 2000, 169, 61–80. [Google Scholar] [CrossRef]
  18. Alkhudhiri, A.; Darwish, N.; Hilal, N. Membrane distillation: A comprehensive review. Desalination 2012, 287, 2–18. [Google Scholar] [CrossRef]
  19. Fard, A.K.; Rhadfi, T.; Khraisheh, M.; Atieh, M.A.; Khraisheh, M.; Hilal, N. Reducing flux decline and fouling of direct contact membrane distillation by utilizing thermal brine from MSF desalination plant. Desalination 2016, 379, 172–181. [Google Scholar] [CrossRef]
  20. Nghiem, L.D.; Cath, T. A scaling mitigation approach during direct contact membrane distillation. Sep. Purif. Technol. 2011, 80, 315–322. [Google Scholar] [CrossRef]
  21. Francis, L.; Ghaffour, N.; Al-Saadi, A.S.; Amy, G. Performance of different hollow fiber membranes for seawater desalination using membrane distillation. Desalin. Water Treat. 2015, 55, 2786–2791. [Google Scholar] [CrossRef]
  22. Shirazi, M.M.A.; Kargari, A.; Bastani, D.; Fatehi, L. Production of drinking water from seawater using membrane distillation (MD) alternative: Direct contact MD and sweeping gas MD approaches. Desalin. Water Treat. 2014, 52, 2372–2381. [Google Scholar] [CrossRef]
  23. Al-Obaidani, S.; Curcio, E.; Macedonio, F.; Profio, G.D.; Al-Hinai, H.; Drioli, E. Potential of membrane distillation in seawater desalination: Thermal efficiency, sensitivity study and cost estimation. J. Membr. Sci. 2008, 323, 85–98. [Google Scholar] [CrossRef]
  24. Song, L.M.; Ma, Z.; Liao, X.; Kosaraju, P.B.; Irish, J.R.; Sirkar, K.K. Pilot plant studies of novel membranes and devices for direct contact membrane distillation-based desalination. J. Membr. Sci. 2008, 323, 257–270. [Google Scholar] [CrossRef]
  25. Dahm, K.G.; Guerra, K.L.; Xu, P.; Drewes, J.E. Composite Geochemical Database for Coalbed Methane Produced Water Quality in the Rocky Mountain Region. Environ. Sci. Technol. 2011, 45, 7655–7663. [Google Scholar] [CrossRef] [PubMed]
  26. He, F.; Sirkar, K.K.; Gilron, J. Studies on scaling of membranes in desalination by direct contact membrane distillation: CaCO3 and mixed CaCO3/CaSO4 systems. Chem. Eng. Sci. 2009, 64, 1844–1859. [Google Scholar] [CrossRef]
  27. Singh, D.; Prakash, P.; Sirkar, K.K. Deoiled Produced Water Treatment Using Direct-Contact Membrane Distillation. Ind. Eng. Chem. Res. 2013, 52, 13439–13448. [Google Scholar] [CrossRef]
  28. Schofield, R.W.; Fane, A.G.; Fell, C.J.D. Heat and Mass-Transfer in Membrane Distillation. J. Membr. Sci. 1987, 33, 299–313. [Google Scholar] [CrossRef]
  29. Bouchrit, R.; Boubakri, A.; Hafiane, A.; Bouguecha, S.A. Direct contact membrane distillation: Capability to treat hyper-saline solution. Desalination 2015, 376, 117–129. [Google Scholar] [CrossRef]
  30. Alklaibi, A.M.; Lior, N. Heat and mass transfer resistance analysis of membrane distillation. J. Membr. Sci. 2006, 282, 362–369. [Google Scholar] [CrossRef]
  31. Kim, H.C.; Shi, J.; Won, S.; Lee, J.-Y.; Maeng, S.K.; Song, K.G. Membrane distillation combined with an anaerobic moving bed biofilm reactor for treating municipal wastewater. Water Res. 2015, 71, 97–106. [Google Scholar] [CrossRef] [PubMed]
  32. Francis, L.; Ghaffour, N.; Alsaadi, A.S.; Nunes, S.P.; Amy, G.L. Performance evaluation of the DCMD desalination process under bench scale and large scale module operating conditions. J. Membr. Sci. 2014, 455, 103–112. [Google Scholar] [CrossRef]
  33. Yun, Y.B.; Ma, R.; Zhang, W.; Fane, A.G.; Li, J. Direct contact membrane distillation mechanism for high concentration NaCl solutions. Desalination 2006, 188, 251–262. [Google Scholar] [CrossRef]
  34. Liu, H.Y.; Wang, J.L. Treatment of radioactive wastewater using direct contact membrane distillation. J. Hazard. Mater. 2013, 261, 307–315. [Google Scholar] [CrossRef] [PubMed]
  35. Song, L.; Li, B.; Sirkar, K.K.; Gilron, J.L. Direct contact membrane distillation-based desalination: Novel membranes, devices, larger-scale studies, and a model. Ind. Eng. Chem. Res. 2007, 46, 2307–2323. [Google Scholar] [CrossRef]
  36. Lee, H.; He, F.; Song, L.; Gilron, J.; Sirkar, K.K. Desalination with a cascade of cross-flow hollow fiber membrane distillation devices integrated with a heat exchanger. AIChE J. 2011, 57, 1780–1795. [Google Scholar] [CrossRef]
  37. Boubakri, A.; Bouchrit, R.; Hafiane, A.; Bouguecha, S.A. Fluoride removal from aqueous solution by direct contact membrane distillation: Theoretical and experimental studies. Environ. Sci. Pollut. Res. 2014, 21, 10493–10501. [Google Scholar] [CrossRef] [PubMed]
  38. Alkhudhiri, A.; Darwish, N.; Hilal, N. Treatment of high salinity solutions: Application of air gap membrane distillation. Desalination 2012, 287, 55–60. [Google Scholar] [CrossRef]
  39. Davies, P.J.; Bubela, B. Transformation of Nesquehonite into Hydromagnesite. Chem. Geol. 1973, 12, 289–300. [Google Scholar] [CrossRef]
  40. Gryta, M. Alkaline scaling in the membrane distillation process. Desalination 2008, 228, 128–134. [Google Scholar] [CrossRef]
  41. Gryta, M. Desalination of thermally softened water by membrane distillation process. Desalination 2010, 257, 30–35. [Google Scholar] [CrossRef]
  42. Wang, L.; Li, B.; Gao, X.; Wang, Q.; Lu, J.; Wang, Y.; Wang, S. Study of membrane fouling in cross-flow vacuum membrane distillation. Sep. Purif. Technol. 2014, 122, 133–143. [Google Scholar] [CrossRef]
  43. Warsinger, D.M.; Swaminathan, J.; Guillen-Burrieza, E.; Arafat, H.A.; Lienhard, J.H. Scaling and fouling in membrane distillation for desalination applications: A review. Desalination 2015, 356, 294–313. [Google Scholar] [CrossRef]
  44. Muryanto, S. Calcium Carbonate Scale Formation in Pipes: Effect of Flow Rates, Temperature, and Malic Acid as Additives on the Mass and Morphology of the Scale. Procedia Chem. 2014, 9, 69–76. [Google Scholar] [CrossRef]
  45. Case, D.H.; Wang, F.; Giammar, D.E. Precipitation of magnesium carbonates as a function of temperature, solution composition, and presence of a silicate mineral substrate. Environ. Eng. Sci. 2011, 28, 881–889. [Google Scholar] [CrossRef]
  46. Coto, B.; Martos, C.; Peña, J.L.; Rodríguez, R.; Pastor, G. Effects in the solubility of CaCO3: Experimental study and model description. Fluid Phase Equilibria 2012, 324, 1–7. [Google Scholar] [CrossRef]
  47. Karakulski, K.; Gryta, M. Water demineralisation by NF/MD integrated processes. Desalination 2005, 177, 109–119. [Google Scholar] [CrossRef]
  48. Gryta, M. Influence of polypropylene membrane surface porosity on the performance of membrane distillation process. J. Membr. Sci. 2007, 287, 67–78. [Google Scholar] [CrossRef]
  49. Pokrovsky, O.S.; Savenko, V.S. Influence of Dissolved Organic-Matter on the Kinetics of Homogeneous Precipitation of Aragonite in Seawater. Okeanologiya 1994, 34, 833–841. [Google Scholar]
  50. Pokrovsky, O.S. Precipitation of calcium and magnesium carbonates from homogeneous supersaturated solutions. J. Cryst. Growth 1998, 186, 233–239. [Google Scholar] [CrossRef]
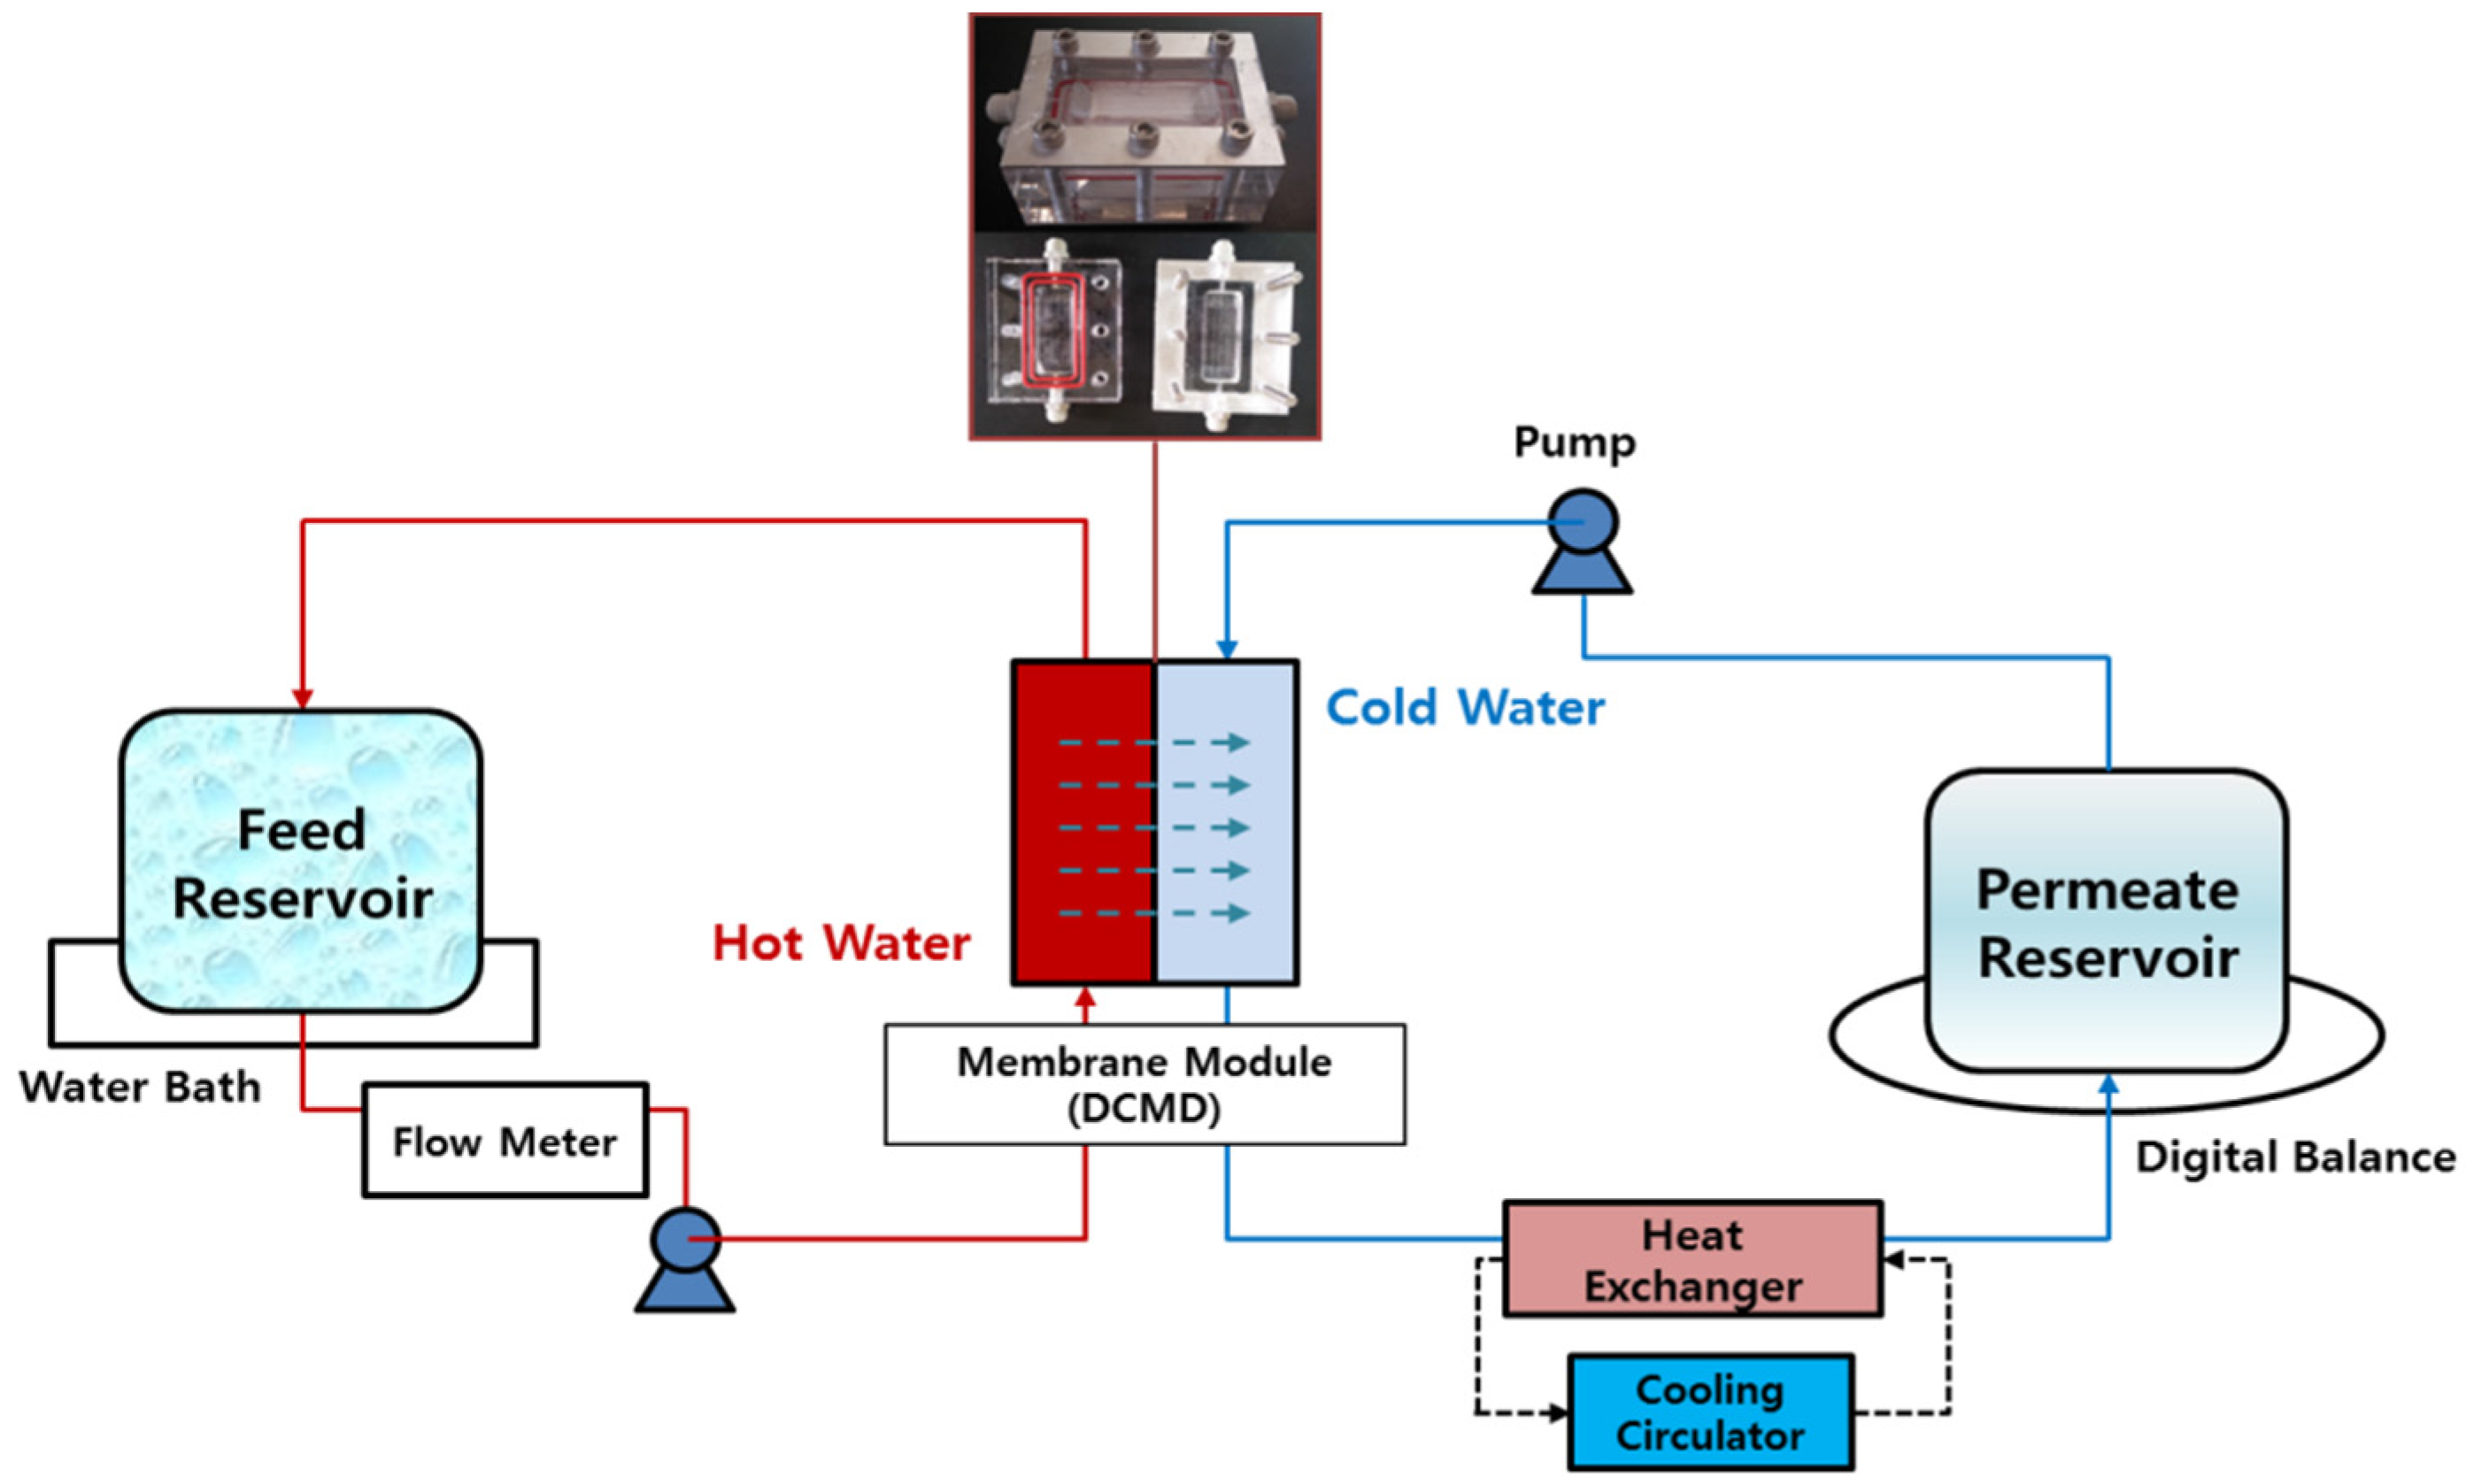
Figure 1. Schematic diagram of the laboratory scale DCMD system.
Water 08 00194 g001
Figure 2. Permeate flux (J) with time at (a) Δ40 °C and (b) Δ60 °C; and measured conductivities in feed and permeate reservoirs at each condition of (c) 1 mM NaCl and 1 mM NaHCO3 at Δ40 °C, and (d) 500 mM NaCl and 25 mM NaHCO3 at Δ60 °C.
Water 08 00194 g002
Figure 3. Comparison of average permeate flux variation ratio (average J/J0) at different salt concentrations (1, 20, and 500 mM NaCl and 1, 25 mM NaHCO3) in feed solution. (a: Δ40 °C and b: Δ60 °C).
Water 08 00194 g003
Figure 4. (a) Variation of permeate flux ratio (J/J0) and (b) measured conductivities of permeate side for the DCMD systems treating feed solutions containing A and B at Δ40 °C, respectively. A (black point): 1 mM NaCl and 1 mM NaHCO3, B (red point): 500 mM NaCl and 25 mM NaHCO3.
Water 08 00194 g004
Figure 5. FE-SEM analysis (at a magnification of ×5000) of (a) virgin membrane; (b) membrane used for short-term (360 min) Δ40 °C-500 mM NaCl-25 mM NaHCO3; (c) membrane used for long-term (5400 min) at Δ40 °C-500 mM NaCl-25 mM NaHCO3; (d) EDS analysis of virgin membrane and used membrane for long-term; and (e) XRD patterns of the obtained solid from membrane surface for long-term (A: aragonite, C: calcite, V: varerite, M: magnesite).
Water 08 00194 g005
Table 1. Components of the simulated CBM water samples used as a feed solution.
SaltsConcentration (mM)
NaCl1, 20, 500
CaCl2·2H2O5
MgCl25
NaHCO31, 25
Table 2. Specifications of hydrophobic membrane used in this study.
ParameterSpecification
SupplierMillipore (GVHP)
Pore size (μm)0.22
Thickness (μm)125
Porosity (%)75
Effective area (m2)1.75 × 10⁻³
Contact angle (°)118
Table 3. Operation conditions of DCMD systems.
Short-Term DistillationLong-Term Distillation
Distillation time360 min5400 min
Transmembrane temperature (ΔT)40 °C and 60 °C40 °C
Cross-flow velocity (CFV)0.18 m·s−10.18 m·s−1
pH of feed solution8.38.3
MeasurementFlux, Conductivity
Characterization-FE-SEM/EDS, XRD