Abstract
Many potato processors require on-farm washing of potatoes, creating large quantities of wastewater that requires treatment, starting in the fall until the end of the potato storage period in mid-summer. We studied the treatment of wastewater from a potato farm in Ontario, Canada, using a system of pretreatment (sedimentation, aeration) followed by a surface-flow wetland with a dense growth of cattails (Typha sp.). The raw wastewater had high average concentrations of 5-day biochemical oxygen demand (BOD5; 1113 mg·L−1), total suspended solids (TSS; 4338 mg·L−1), total nitrogen (TN; 311 mg·L−1) and total phosphorus (TP; 42.5 mg·L−1). Due to high influent loads, the pretreatment was enlarged during annual sediment cleaning at the end of Year 1 (Y1), which increased the hydraulic retention time and delayed the seasonal onset of wetland loading from winter in Y1 to spring in Year 2 (Y2). Total concentration reduction for the treatment system (pretreatment + wetland) in Y2 was 96% BOD5, 99% TSS, 86% TN and 90% TP; and in Y1 was 79% BOD5, 97% TSS, 62% TN and 54% TP. Overall, the best treatment in both the pretreatment and the wetland was seen in spring months. The enlarged pretreatment system enabled seasonal loading of the wetland during the spring and summer, which facilitated improved treatment performance.
1. Introduction
Processors increasingly require that potatoes be washed at on-farm potato storage facilities prior to shipment. This has left farmers with wastewater that needs treatment to meet environmental guidelines. Yet, little is known about this wastewater or how to appropriately treat it on farms. This research evaluated a constructed wetland with a land-based pretreatment as a means of treating potato wastewater. This system fits farmer preference for low cost and low labor requirements, while utilizing the land available on farms.
Potato wash water is generated by transporting potatoes in water-filled channels (fluming) from storage bins to a sorting area and cleaning and rinsing potatoes on a roller-table before sorting. On-farm potato wash water differs from industrial potato processing wastewater because on-farm washing uses whole-potatoes, whereas industrial potato processing involves peeling, cutting, precooking and packaging [1,2]. Kadlec et al. (1997) and Burgoon et al. (1999) studied industrial potato wastewater at a large potato processing plant, which was treated by primary solids removal in an industrial clarifier and then by large integrated wetland systems [3,4]. Although they did not report raw wastewater strength, concentrations after the clarifier were: TSS 300 to 600 mg·L−1, chemical oxygen demand 1000 to 3000 mg·L−1, total Kjeldalh nitrogen (TKN) 90 to 170 mg·L−1 and ammonium-N (NH4-N) 70 to 115 mg·L−1 [3,4]. Processing water from three root vegetable farms in Finland that washed and peeled their vegetables contained 820 to 3700 mg 7-day biochemical oxygen demand L−1, 150 to 2600 mg TS L−1, 28 to 320 mg·L−1 total nitrogen (TN) and 4.0 to 34 mg·L−1 total phosphorus (TP). Although there has been no published research on farm-based potato wash water and its treatment, high concentrations of nutrients and organic matter are expected, as potatoes contain 2% protein, 17% carbohydrates and 0.6 mg·g−1 of phosphorus [5].
Land-based treatment systems are well suited to agricultural applications given their low cost and farm land availability [3]. These systems include sedimentation basins, aerated basins and treatment wetlands. Constructed treatment wetlands have been commonly used in other types of farming (e.g., wastewater from on-farm slaughterhouses, dairy milk houses, piggeries) [6,7,8,9,10]. Constructed wetlands utilize natural processes taking place in wetlands for biological treatment of wastewater [9]. The combination of shallow water and abundant macrophytes creates an environment advantageous for microbial growth. This removes carbon and nutrients from the wastewater by uptake into plant material or conversion to gaseous by-products [9,11].
Kadlec et al. (1997) reported on the performance of two pilot-scale treatment wetland systems (20 m2 and 2685 m2), and Burgoon et al. (1999) reported on a full-size treatment system (16 ha), all of which treated potato processing factory wastewater after primary sedimentation. The initial sedimentation step was achieved in an industrial clarifier treating ca. 5000 m3·day−1. This was followed by a ‘sedimentation’ wetland (that required periodic sediment removal), then a mineralization wetland, followed by a nitrification step in a vertical flow subsurface wetland (intermittent sand filter) and, lastly, a denitrification wetland [3,4]. In the full-scale system, effluent from the final wetland was stored and then irrigated on forage crops. Overall concentration reductions between the wastewater entering the first treatment cell (effluent from the clarifier) and the final wetland cell ranged from 33% for NH4-N to 95% for COD [3,4].
Potato farms are much smaller than industrial potato processing plants and, thus, cannot utilize large-scale clarifiers. Furthermore, unlike many other facilities, potato shipping and wash water production is not year-round, rather occurring from October to July and, therefore, in large part during the colder months of the year. As a result, there are several cold climate considerations including plant senescence and the release of nutrients in wetland cells, snow and ice cover, reduced biological activity and preferential flow due to freezing [10]. Although constructed wetlands have been shown to be effective in cold climates [12,13], treatment is wastewater-specific and, therefore, needs to be examined specifically with potato wash water.
This research examined the performance of a constructed wetland and pretreatment system over two years. The goal was to inform the design of an affordable, cold climate, surface flow system that can aid farmers by consistently treating wash water.
2. Materials and Methods
2.1. Farm Description
The research took place at Sunrise Potato Storage LTD in Alliston, Ontario, Canada [14]. After harvest, potatoes were shipped out of the storage of over 10 months (October to July). Wash water was created from the transport (fluming), washing and sorting of potatoes prior to being loaded onto trucks. Wash water quantity and quality varied from month-to-month, based on processor demand for potatoes, shipment size, occurrence of rot and presence of soil. Preparing potatoes for shipment lasted 3 to 8 h·day−1 with the flume water continuously re-circulated throughout the day. At the end of each day, all wash water was pumped out of the storage facility and loaded into the outdoor treatment system. During the second year of the study (Y2), actions were taken to reduce contaminants entering the wash water and the volume of water used [15].
2.2. Treatment System Description
The treatment system was constructed adjacent to the storage facility on a low permeability, clay soil in the summer of 2008 (Figure 1). System size was determined using the first-order, plug flow, design equation to treat estimated loads of total suspended solids (TSS) and 5-day biochemical oxygen demand (BOD5) [11,12]; however, at that time, the quantity of wash water produced and the level of BOD5 and TSS had not been characterized (and no literature values were available).
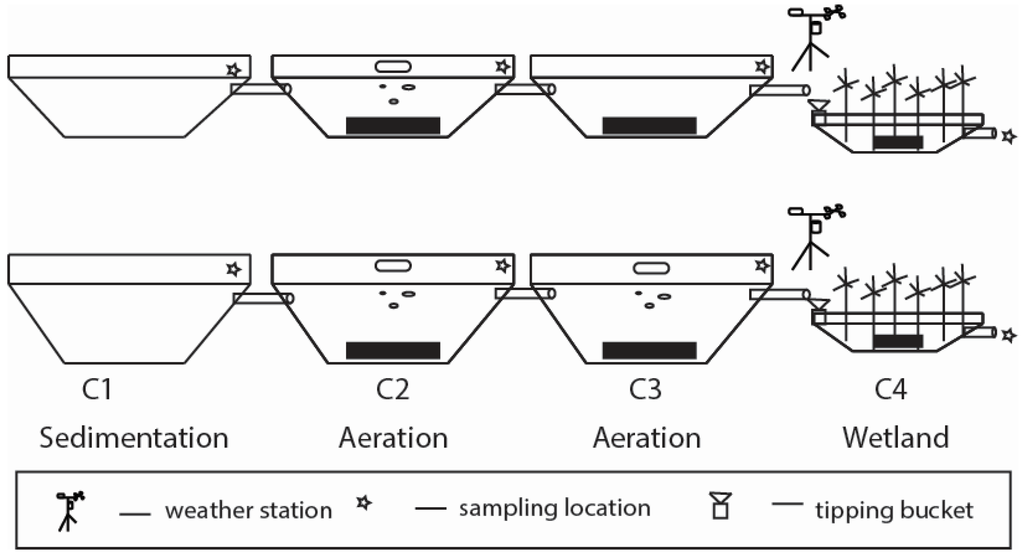
Figure 1.
Diagram of the wash water treatment system in the Year 1 (top) and Year 2 (bottom) configuration: pretreatment cells for sedimentation (C1), aeration/nitrification (C2) and denitrification (C3 in Year 1) or aeration/nitrification (C3 in Year 2); and treatment wetland (C4). System inflow was on the left and outflow on the right, with gravity flow between cells. The black bars represent sediment accumulation in cells C2, C3 and the shallow ‘marsh’ section of C4.
Water flowed through the system passively, moving from cell-to-cell through submerged PVC pipes, located on opposite corners to distribute flow (Figure 1). The system consisted of four integrated cells (C1 to C4), similar to previous integrated systems [3,4]. Cell 1 was meant for sedimentation and mineralization of raw wastewater. Cells 2/3 were nitrification cells, and Cells 3/4 were for denitrification. Cell size was measured manually using a measuring tape. In the summer of both years, a small boat was moved around each cell in a 2-m grid pattern, and depth readings were taken by dropping a measuring rod to the bottom.
2.3. Pretreatment Description
The first three cells of the system were designed for sedimentation and aeration. Basins were used in order to increase the hydraulic retention time (HRT) of the system within a modest surface area available at the site. In Y1 (2012 to 2013) the primary sedimentation basin (C1, 341 m2, 22 m × 15.5 m, 174 m3) was followed by an aerobic cell (C2, 287 m2, 15.5 m × 18.5 m, 245 m3) with 2 horsepower surface aerators (Kasco Marine, Inc., Prescott, WI, USA), which was followed by an anaerobic denitrification cell (C3, 409 m2, 21 m × 19.5 m, 263 m3). After observing that the system was nitrification-limited, an aerator was added to C3 in Y2 (September 2013), making it a second aerobic cell (Figure 2). The aerators were operated continuously, except during winter months, when the surface froze over.
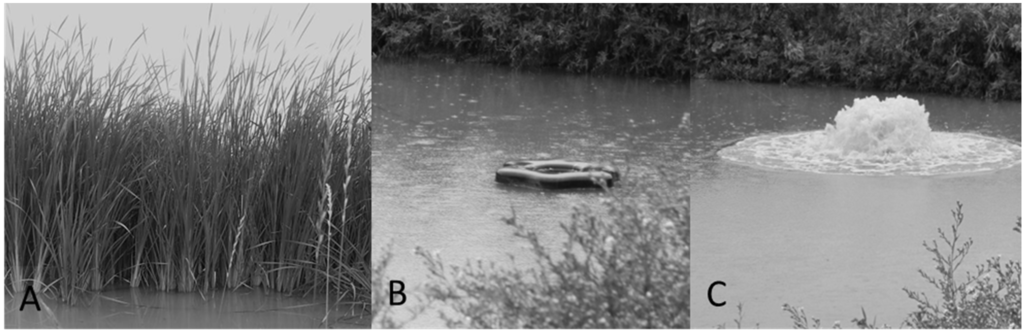
Figure 2.
Images showing: (A) cattail growth in the wetland; (B) the aerator floating in Cell 2 (C2) prior to being turned on; and (C) the active aerator in C2.
In late summer each year (2009 to 2012), water in the first cell was pumped out (irrigated on a large grassed area surrounding the potato storage) so that accumulated solids could be removed with an excavator (ca. 100 m3). During the summer 2013 (prior to Y2), all three pre-treatment basins were emptied, and accumulated solids in all cells were excavated. This increased the volume of the pre-treatment basins (C1, 411 m3; C2, 316 m3; and C3, 651 m3) and increased the HRT from 1.4 to 6.0 months (Table 1).

Table 1.
Comparison of influent characteristics and treatment system properties in Year 1 (Y1) and Year 2 (Y2) and between cold (“winter” = October through February) and warm periods (“summer” = March through July). HRT, hydraulic retention time.
2.4. Treatment Wetland Description
A surface-flow wetland was the fourth cell in the system (C4). It had a total area of 172 m2 (10 m × 17 m) and volume of 56 m3, with an HRT of 0.3 months (Table 1). It had deep zones (~20% of the surface area) at the inflow and outflow edges with a large shallow zone (0.3 m depth) in the middle, designed based on previous research [3,16]. Cattails (Typha sp.) had been planted in the shallow zone in 2008, and dense growth existed throughout this study (Figure 2A). During the 2013 growing season, the cattail biomass was sampled at three different locations within the wetland. Within each area (0.25 m2), all cattails were cut at the base; dead plant matter was removed; and the sample was weighed before and after being dried at 70 °C for 1 week. A composite sample was ground for analysis of total carbon (using LECO CR12, combustion and CO2 measured by solid state infrared detector), total N (Kjeldahl digestion: using concentrated H2SO4, CT-37 Kjeldahl Tablets; analysis using QuikChem® Method 13-107-06-2-D using the Lachat QuikChem 8500 FIA series2, Loveland, CO, USA) and total P (Kjeldahl digestion: using concentrated H2SO4, CT-37 Kjeldahl Tablets; analysis using QuikChem® Method 13-115-01-1-B using the Lachat QuikChem 8500 FIA series2). Total carbon, N and P for the wetland were found by multiplying by the vegetated area.
2.5. Treatment System Monitoring
The system was monitored from October 2012 (Y1) to June 2014 (Y2). Influent flow was measured with in-line flow meters (Rain Bird, Azusa, CA, USA) on all water lines used for washing in the storage facility. Flow into the treatment wetland was measured with a calibrated tipping bucket between C3 and C4 in a heated, insulated enclosure. Hourly flows were recorded by a CR3000 data logger (Campbell Scientific, Edmonton, AB, Canada).
When potatoes were shipped, water samples were typically collected biweekly at five locations: from the flume (influent) and then at each outflow pipe throughout the treatment system (C1 to C4). Samples were refrigerated at 4 °C and immediately sent for analysis at the Ontario Rural Wastewater Center.
Analysis of BOD5 was done by incubating the samples for 5 days using PolyseedTM capsule inoculant (InterLab®, Spring, TX, USA) (Standard Methods 5210 B [17]). TSS was analyzed by filtering samples through 1.5-µm Whatman glass microfiber filters (GE Healthcare, Little Chalfont, UK). Filters were dried and weighed before and after drying to find the difference in weights (Standard Method 2540D, [17]). Ammonia was measured using the colorimetric phenate method (4500-NH3 F). Nitrate was measured using the 4500-NO3 electrode method (Orion 300 BNWP and Orion 900200). TKN was determined using H2SO4 digestion as outlined in Standard Method 4500-NorgB Macro-Kjeldahl [17]. The TP procedure was adapted from Standard Method 4500-P Phosphorus (Persulfate Digestion Method) [17].
Dissolved oxygen (DO) and oxidation-reduction potential (ORP) were measured using a hand-held YSI 556 multiparameter instrument with a 5565 pH/ORP sensor calibrated prior to sampling based on manufacturer instructions (YSI Inc., Yellow Spring, OH, USA). The sensor was submersed to a depth of 10 cm at three locations within 1 m of the shore in each cell and allowed to stabilize before the reading was recorded.
2.6. Calculations
Treatment performance was calculated in terms of concentration reductions (% CR) as:
where Cin and Cout were the concentration of a given contaminant in the inflow or outflow sample.
The performance of the entire treatment system was based on inflow concentrations measured at the flume and outflow from C4. Wetland performance was based on the concentration entering and leaving the wetland.
3. Results and Discussion
3.1. Environmental Conditions
The daily average air temperature ranged from 24.3 °C to −23.2 °C in Y1 and 27.4 °C to −17.8 °C in Y2. In total, the temperature in nine of 20 (45%) shipping months was below freezing. During winter, wash water froze in layers as new wash water was added on the surface of C1. This negatively affected sedimentation during these months.
During warmer months, vegetative growth was observed. In Y1, C3 was covered in duckweed (Lemna minor L.), and in both years, C4 had substantial cattail growth (Typha sp.). The cattail biomass was 5.0 kg·m−2 (dry weight), which is higher than observed in other studies (<2.5 kg·m−2 [18,19]; ≤3.0 kg·m−2 [20]) and contained 2.3 kg·C·m−2, 0.91 kg N m−2 and 0.014 kg P m−2.
The DO in all locations was low in the winter, with a substantial increase in the spring for aerated cells and the wetland (Figure 3). The highest wetland DO was in C2 (8.9 mg·L−1) in the spring of Y2. Declines in DO during summer coincided with increasing air temperatures, which would increase biological activity and oxygen demand [21]. When the aerators were active in spring and summer, the DO in C2 and C3 was higher than C1, demonstrating that aeration increased DO. After the water discharged from C3 into the wetland, DO fell sharply, consistent with the denitrification role of C4 and indicating that passive aeration (aerenchyma, wind, flow through tipping bucket) was insufficient to meet the remaining oxygen demand. The ORP levels were always <−140 mV in C1 and showed an increasing trend through C2 and C3. Despite aeration, ORP remained below ca. 50 mV on individual samples and below 0 mV on a seasonal average, never reaching an ideal range for nitrification. This indicates that greater aeration and/or reliable aeration systems that could be operated during the winter without freezing would be beneficial (Figure 3). A vertical flow wetland or intermittent sand filter could be considered in this regard, as it has been successfully used previously [3,4]; however, reliability in winter would be important. Overall, the DO, ORP and temperature conditions suggest that nitrification and biological treatment were limited during winter, but more favorable in spring and summer.
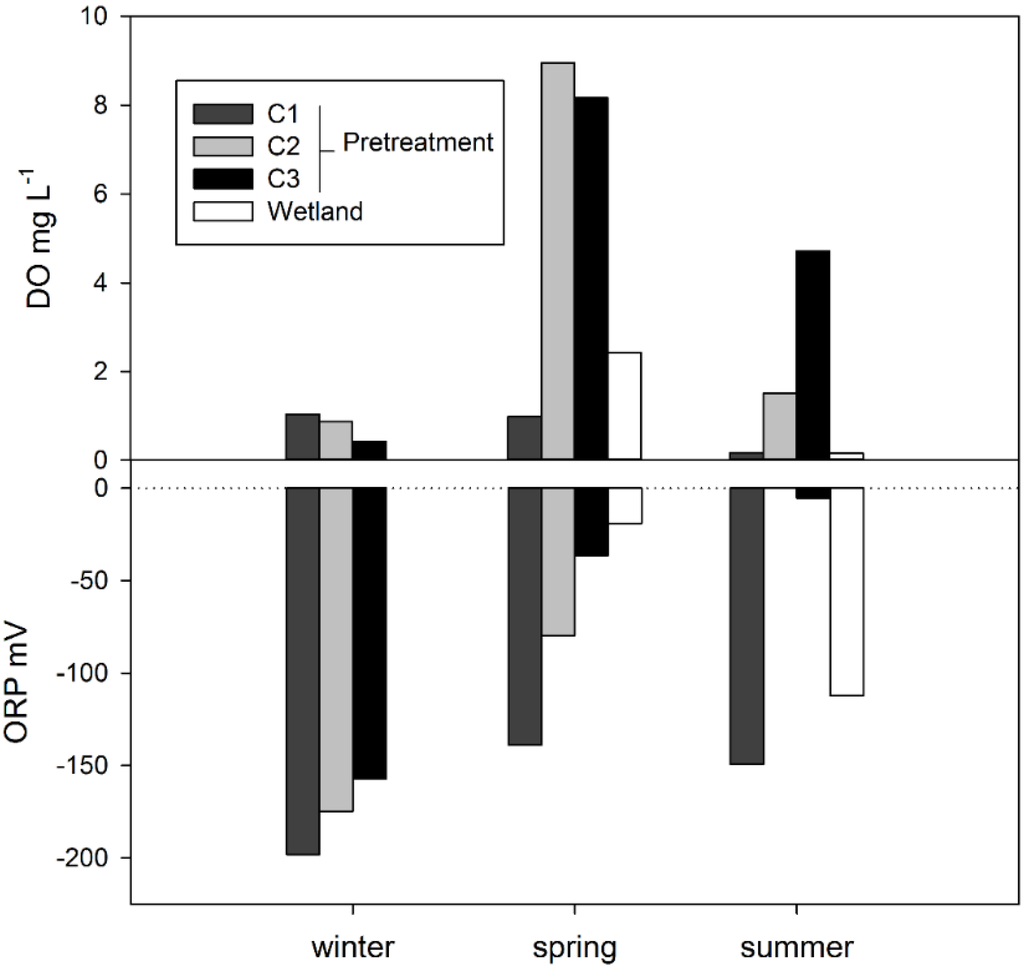
Figure 3.
Average dissolved oxygen (DO) and oxidation-reduction potential (ORP) for winter (December and January), spring (April and May) and summer (July) from each treatment cell. The wetland was not sampled in the winter.
3.2. Pretreatment
Wash water inflow to C1 was similar across seasons (Table 1), amounting to 4044 m3 in Y1 and only 2345 m3 in Y2. Contaminant levels in the raw wash water were higher than expected in both years. Average Y1 inflow concentrations were 6080 mg TSS L−1, (from 350 mg TSS L−1 to 27,600 mg TSS L−1), 1240 mg BOD5 L−1 (130 mg BOD5 L−1 to 3900 mg BOD5 L−1), 273 mg TN L−1 (44 mg TN L−1 to 1410 mg TN L−1), 67.9 mg NH3-N L−1 (22 mg NH3-N L−1 to 200 mg NH3-N L−1) and 38.4 mg TP L−1 (0.02 mg TP L−1 to 91 mg TP L−1) (Table 2). Average Y2 inflow concentrations were lower than Y1 (except TP) due to changes in farm practices [15]: 3440 mg TSS L−1 (from 310 mg TSS L−1 to 8500 mg TSS L−1), 780 mg BOD5 L−1 (87 mg BOD5 L−1 to 2050 mg BOD5 L−1), 321 mg TN L−1 (16 mg TN L−1 to 850 mg TN L−1), 97.5 mg NH3-N L−1 (3 mg NH3-N L−1 to 600 mg NH3-N L−1) and 46.5 mg TP L−1 (2 mg TP L−1 to 110 mg TP L−1). No other studies were found treating farm potato wash water; however, treating industrial potato processing wastewater with wetlands has been studied previously. Burgoon et al. (1999) and Kadlec et al. (1997) had influent potato processing wastewater (after solids removal in a clarifier) of 329 to 324 mg·L−1 and 280 to 420 mg·L−1 TSS, 2218 to 2838 mg·L−1 and 1100 to 3100 mg·L−1 COD, 154 to 176 mg·L−1 and 95 to 145 mg·L−1 TKN [3,4]. Influent concentrations in our study were higher (because the on-farm wastewater had not yet undergone sedimentation), but concentrations entering C2 were more similar: 450 and 300 mg·L−1 TSS, 900 and 700 mg·L−1 BOD5 and 140 and 130 mg·L−1 TKN in Y1 and Y2, respectively.
Table 2.
Performance of the treatment system and its components by season and year. Average inflow concentrations (mg·L−1) for the whole system (WS; entering in C1) and the wetland (C4). Concentration reductions (% CR) are calculated for the whole system (C1in vs. C4out), pretreatment (C1in vs. C3out), and the wetland (C4in vs. C4out). The number of samples used for each average is indicated as N (note that there was no outflow on many sampling dates in the winter; hence, it was sampled fewer times than inflow to the system and C4, the wetland). Measured parameters are listed in abbreviated form: 5-day biochemical oxygen demand (BOD5), total suspended solids (TSS), total nitrogen (TN), ammonia-N (NH3-N), and total phosphorus (TP). Periods when no samples were available are indicated by n.a.
Removal efficiencies from pretreatment in Y1 were higher in the spring/summer months (March to July) than in winter for all contaminants, except TN (Table 2). Presumably, the cold conditions in winter (surface ice, lack of aeration) negatively affected biological treatment and sedimentation. Ice formation had been shown to decrease the water level and to interfere with water flow through treatment systems by decreasing the retention time [11,22,23,24], which would in turn reduce treatment. Munoz et al. (2006) found a 7.6-fold decrease in retention time of a treatment wetland in sub-zero temperatures [24].
Although TN removals decreased in the spring/summer compared to winter, the NH3 concentration removal increased from 45% in the winter to 75% in the spring/summer, suggesting that different processes were occurring for removing N in each season. This is consistent with the results from Burgoon et al., 1999, who found higher TN removal in the winter (66%) compared to summer (42%) from their whole system. In our study, inflow TN concentrations decreased substantially in spring/summer of Y2 compared to winter of Y2 and all of Y1, due to changes in how potato washing was conducted [15] (Table 2).
There was a decreasing trend for TSS, BOD5 and NH3 through the first three cells (Figure 4). Total N also followed a general decreasing trend through the first three cells (Figure 4), with the exception of the spring/summer of Y2, when influent concentrations dropped. The proportion of NH3-N to TN increased from C1 to C2 in the winter of both years, indicating that organic-N was settling out and being mineralized to NH3-N in C1. Similarly, Burgoon et al. (1999) stated that organic-N mineralized rapidly from potato processing wastewater [4]. Through C2 and C3, changes in TN were directly linked to changes in NH3-N concentration, indicating that volatilization and nitrification-denitrification were primary N-removal pathways.
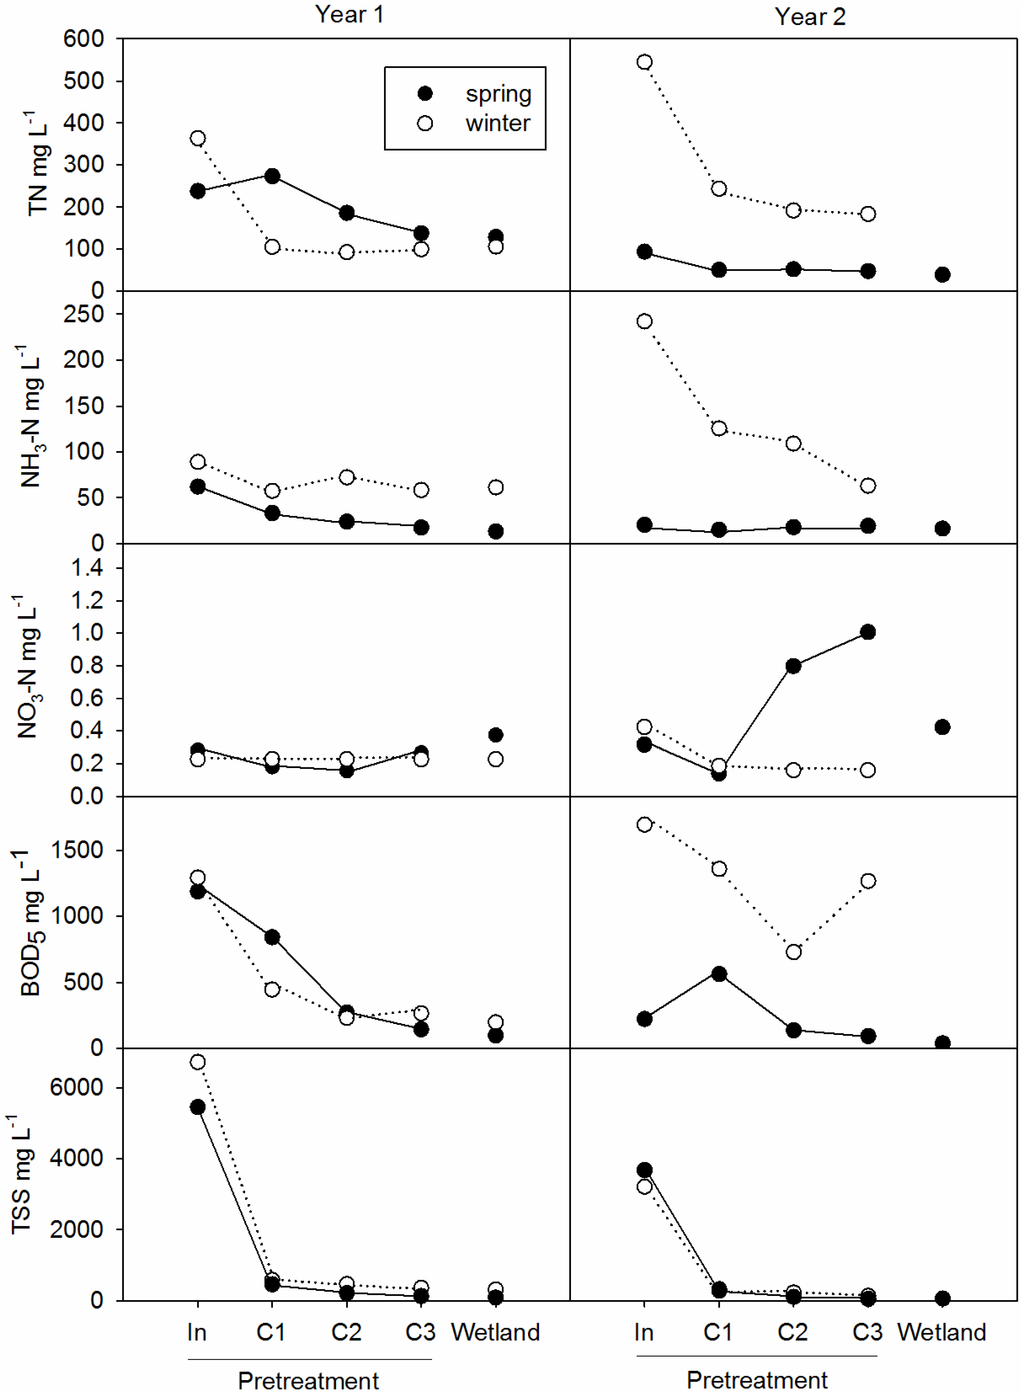
Figure 4.
Mean concentrations of total nitrogen (TN), ammonia (NH3-N) and nitrate (NO3-N) (top), 5-day biochemical oxygen demand (BOD5) (middle) and total suspended solids (TSS) (bottom) throughout the treatment system in winter (December to March) and spring (March to July) of Year 1, 2012 to 2013 (left), and Year 2, 2013 to 2014 (right).
Nitrate remained low (<1 mg·L−1) for most of the study, even in the aerated nitrification cells. Nitrification improved in Y2 compared to Y1, due to the dual aerated nitrification cells, and briefly peaked between 1.13 and 2.26 mg·L−1 NO3-N in C3 during spring 2014 (Figure 4). Kadlec et al., 1997, found similar results, with winter nitrate remaining ca. 1 mg·L−1, except in the nitrification cell, where the concentration was 27 mg·L−1 in winter and 43 mg·L−1 in summer [3]. In their study, ammonia concentrations actually increased in the first two wetland cells and decreased in the nitrification cell, where more than half of the ammonia was nitrified [3]. Burgoon et al., 1999, had markedly lower NO3 concentrations in the winter compared to summer, yet both seasons showed the same pattern of marked ammonia decrease in their oxidation cell [4]. In our study, the pattern of decreasing TN and NH4-N with only a small increase in NO3-N concentration suggests that after nitrification, all NO3-N was immediately denitrified to N2 gas. Therefore, ammonification and nitrification were limiting reactions for further N removal in pretreatment. This could be due to a lack of DO supply for biological degradation of organic matter and nitrification, especially in the winter (Figure 2) [12]. A nitrifying intermittent sand filter or subsurface flow wetland, like W3 in Kadlec et al., 1997, could be beneficial for increasing nitrification. To this end, we conducted a lab study of intermittent vertical flow sand filtration with our potato wastewater and found 53% TN removal and rapid nitrification, in addition to treating other parameters [25].
Reduction of TP improved from 27% in Y1 to 82% in Y2. The improved performance is consistent with the farm activities to remove sediment and deepen C1 to C3 prior to Y2. Kadlec et al., 1997, found 27% TP removal, similar to ours, in the first test run of their system, but 0% removal in the second test run. This suggests that over time, their system lost adsorptions sites, while the cleaning of sediment in our system exposed fresh clay at the bottom of the cells, providing new adsorption sites for P removal [11].
3.3. Constructed Wetland
The inflow volumes into the constructed wetland (2388 m3 in Y1 and 1783 m3 in Y2) were lower than into the pretreatment, due to the volume required to fill the first three basins, as well as infiltration and evaporative losses (Table 1). In Y1, water reached the constructed wetland in December, which was consistent with the pretreatment HRT (~2 months; Table 1); whereas, in Y2, water did not reach the wetland until the spring thaw in April due to the longer pretreatment HRT. The wetland influent usually had higher concentrations in winter compared to spring/summer (Table 2) and was higher in Y1 than Y2.
Overall, the constructed wetland had only moderate removals from all seasons and years (Table 2). The outflow concentrations did not meet suggested provincial discharge guidelines, with the exception of BOD5 in June and July of Y2. Performance was highest in the spring/summer, when the wetland provided modest concentration reductions. On an annual basis, the constructed wetland performance was higher in Y2 than Y1. There was no winter flow in Y2 due to increased retention time of the pretreatment. During the spring/summer, Y2 had higher concentration reductions than Y1. In Y1, in the winter, the constructed wetland had poor removal (Table 2) [26]. This is most likely due to the effect of winter on cattails and the effect of ice on water flow. During winter, cattail biomass breakdown releases nutrients and particulate matter [11]. Burgoon et al. (1999) found that breakdown of cattail biomass in the winter increased their TSS in their last wetland cell. Additionally, thick ice was observed in the wetland, likely causing preferential flow. Kadlec et al., 1997, and Burgoon et al., 1999, also found lower treatment in the spring/summer, although their removal rates were much better and their season differences smaller than ours were. It is important to note that their systems operated in warmer climate (Washington State, USA) with shorter and warmer winters.
Wood et al. (2015) studied the difference between seasonally- and continuously-loaded wetlands, which is similar to our Y2 and Y1 distinction, and found higher treatment efficiency during the growing season in the seasonally-loaded wetland, similar to our study [26]. However, on an annual basis, they found that both continuously- and seasonally-loaded wetlands performed similarly, while in our study, seasonal loading (Y2) led to improved annual performance compared to continuous loading (Y1). This difference between studies could be related to the lack of fall loading (August to October) in our study.
Nitrogen removal was poor over all seasons, although somewhat improved in the spring/summer for both Y1 and Y2. The TN concentration removal was only 1% in the winter of Y1, 7% and 13% for summer removal in Y1 and Y2, respectively (Table 2). The NO3-N concentrations remained low throughout all seasons and years, which suggests efficient denitrification. The concentration of NH3-N decreased slightly in the spring/summer. Healy and Flynn (2011) suggest that poor NH3-N removal is common in wetlands due to re-mineralization of organic matter and lack of dissolved oxygen [27]. There was moderate BOD5 removal overall and similarly improved treatment efficiencies in the spring than the winter. The BOD5 concentration removal was 25% in the winter of Y1, 32% and 65% for summer removal in Y1 and Y2, respectively (Table 2). The TSS removal was similar to BOD5. In Y1, TSS removal doubled from winter to spring/summer (12% to 30%, respectively) and increased more in the spring/summer of Y2 (36%). Other constructed wetland studies have also shown reduced treatment efficiencies in the winter [21,28,29].
Compared to other studies, the wetland loading rates were higher on an areal basis, and removals were lower. Organic loading rates were, on average, 10.2 g BOD5 m−2·day−1 in the winter of Y1, 6.8 g BOD5 m−2·day−1 in the spring/summer of Y1, 23 g BOD5 m−2·day−1 in the winter of Y2 and 5.7 g BOD5 m−2·day−1 in the spring/summer of Y2. Healy et al., 2007, recommended an organic load of <6 g BOD5 m−2·day−1 for surface flow wetlands [30], but at rates of 10 g·m−2·day−1, Healy and Flynn (2011) found removals of 95% from primary municipal wastewater and consistently good removals for loading rates of up to 40 g·m−2·day−1 [27]. De Zeeuw et al. (1990) found that a COD loading rate of 54 g·m−2·day−1 had a removal of 48%, while at 12 g·m−2·day−1, there was 92% removal from 2000 mg·L−1 industrial potato wastewater [31,32]. Therefore, increasing the size of the wetland could also increase the BOD5 removal of our wastewater.
Areal TSS loading rates in the wetland were, on average, 14 g TSS m−2·day−1 in the winter of Y1, 6.2 g TSS m−2·day−1 in the spring/summer of Y1, 2.5 g TSS m−2·day−1 in the winter of Y2 and 2.6 g TSS m−2·day−1 in the spring/summer of Y2. For comparison, Kadlec et al. (1997) [3] report a hydraulic loading rate of about 8 cm·day−1 with 607 mg TSS L−1 entering their four-cell treatment system (2685 m2) and 48 mg TSS L−1 entering their denitrifier wetland (W4, 665 m2). These equate to a whole-system loading rate of 49 g TSS m−2·day−1 and a loading rate to the denitrifier wetland of 3.8 g TSS m−2·day−1. Healy et al., 2007, recommended <5 g TSS m−2·day−1, which was achieved in Y2 of our study. The Healy and Flynn (2011) review of several wetlands found that most had removals >78% up to 9 g·m−2·day−1, which was a higher removal efficiency than our study (Table 2). Although plant litter in wetlands is known to remove TSS, the small size of the particles made TSS removal difficult from our wastewater [4].
The TN loading rate had a maximum in the spring of Y1 (6.5 g·m−2·day−1) and a minimum in spring of Y2 (2.7 g·m−2·day−1). The TP loading rate had a maximum in the winter of Y1 (1.0 g·m−2·day−1) and consistently lower rates throughout Y2 (0.2 g·m−2·day−1). Nutrient removals in wetlands have been found to be variable [27]. Poach et al. (2004) had loading rates of 0.2 to 5.1 g TN m−2·day−1 with average removal of 40% and P loading of 0.3 to 0.75 g TP m−2·day−1 with an average removal of 22% [33]. At similar loading rates, they had higher treatment efficiencies than our study (4% TN in Y1 and 14% TN in Y2 and 12.5% TP in Y1 and 5% TP in Y2).
Cattails grew as soon as frost ended in the spring, until senescence in late summer [11]. Over the entire wetland area, cattails contained 390 kg of C, 15.8 kg N and 2.43 kg P, which is at the upper end of reported uptake for one growing season from cattail growth (20 to 100 g N m−2 and 8 g P m−2) [11]. For comparison, the amount of TN and TP entering the wetland was 34.5 kg (Y1) and 29.4 kg (Y2) and 6.30 kg (Y1) and 2.29 kg (Y2), respectively. However, during fall senescence, most of the nutrients return to the water [11]. Plant harvest may help remove some of the nutrient load; however, it has been found to remove only a small part of the total nutrient load and, in some cases, harms the plant colonies [11,34,35]. Yang et al. (2016) suggested that late fall harvesting can be detrimental to wastewater treatment, but found that summer shoot harvesting increased plant productivity and nitrogen uptake [35].
3.4. The Entire Treatment System
The entire system had an HRT of 1.7 months in Y1 and 6.3 months in Y2. Outflow from the system started in December in Y1 and May in Y2. Consistent with the improved performance of the wetland, concentration removal efficiencies of the entire system were better in Y2 (96% BOD5, 99% TSS, 86% TN and 90% TP) than Y1 (79% BOD5, 97% TSS, 62% TN and 54% TP). The variability of the inflow volume and quality also caused variable outflow from the system. In Y2, the outflow had smaller deviations from all contaminants, which is consistent with the enlarged system and lower influent volume compared to Y1. With a greater HRT and more aeration, the effluent was a more consistent quality.
The majority of the treatment occurred in the first three cells (Table 2, Figure 4). Although the constructed wetland contributed modestly to the overall treatment, it is important to note that it only accounted for 15% of the surface area and 7% (Y1) to 4% (Y2) of the overall system volume. If the wetland HRT were comparable to pretreatment, it would have contributed markedly higher reductions than pretreatment. Nevertheless, pretreatment is a necessary element for effective use of constructed wetlands in this farm setting, as evidenced by the high TSS concentration in the raw wash water. The wetland would not have been able to process so much sediment, and the system needed even more aeration than it had (Figure 3), which a surface flow wetland alone could not accommodate. Additionally, had cells C2/3 been constructed as wetlands, they would have required a much larger surface area for the same volume.
System upkeep was minimal for the farm. Once a year, after potato shipping was completed and prior to new potato harvest, Cells 1 to 3 were drained onto grassland, and the sediment in C1 (ca. 100 m3) was removed with farm equipment. This upkeep required one day of work by two employees at a convenient time that did not compete with other critical farm tasks. Other operating cost included the aerators, which ran continuously when the water was not frozen (ca. 4500 h·year−1).
Removals for the entire system were good, and effluent concentrations were comparable to previous research where effluent was land-applied [3,4]. Our wetland performed similarly to the W4 cells of Kadlec et al., 1997, and Burgoon et al., 1999. In all cases, the wetlands had low DO concentrations, favoring denitrification. For discharge to surface water, however, additional removals would be necessary for the wash water to meet requirements. Expanding the wetland area could be one way to improve the overall removal level. Enhancing nitrification and removing suspended colloidal solids are other key aspects for treating this potato wastewater. Improved winter treatment would be particularly valuable.
4. Conclusions
Performance of the constructed wetland improved by increasing the HRT of the pretreatment and thereby eliminating winter loading. In Y1, the wetland had winter concentration reductions of 25% BOD5, 12% TSS, 1% TN and 12% TP and spring reductions of 32% BOD5, 30% TSS, 7% TN and 13% TP. In Y2, the constructed wetland had no winter outflow, and spring reductions were 65% BOD5, 36% TSS, 13% TN and 5% TP. This new design allowed for more ammonification from organic-N, as well as nitrification, which decreased TN and BOD5 simultaneously. The entire wetland system was more efficient overall in Y2 with concentration reductions in Y1 of 79% BOD5, 97% TSS, 62% TN and 54% TP, compared to Y2 reductions of 96% BOD5, 99% TSS, 86% TN and 90% TP. Discharge concentrations were comparable to those of Kadlec et al., 1997, and Burgoon et al., 1999, who focused on treating industrial potato wastewater for land application. Therefore, within the scope of land-application, our wastewater was successfully treated. Additional treatment would be required to meet surface-water discharge guidelines, however. Additional research is necessary to find effective ways of further reducing contaminants and improving winter performance (e.g., increasing wetland size, winter aeration).
Acknowledgments
This research was funded by the Ontario Ministry of Agriculture, Food and Rural Affairs (OMAFRA), with support from Agriculture and Agri-Food Canada (AAFC) and the University of Guelph, Ontario Agricultural Collage (OAC). Special thanks to the management and employees at Sunrise Potato Storage LTD and three anonymous reviewers whose suggestions greatly improved the manuscript.
Author Contributions
Vera Bosak (VB), Andrew VanderZaag (AV) and Robert Gordon (RG) conceived of and designed the study. VB, RG and AV acquired data from the treatment system. VB, Anna Crolla (AC) and Christopher Kinsley (CK) acquired laboratory data. AV, RG, AC and CK contributed reagents/materials/analysis tools. VB monitored the wetland and analyzed the data. VB and AV interpreted the data and drafted the paper. RG, AC and CK provided critical revision of the manuscript. VB, AV, RG, AC and CK gave final approval of the version to be submitted.
Conflicts of Interest
The authors declare no conflicts of interest.
References
- Hung, Y.-T.; Lo, H.; Awad, A.; Salman, H. Potato wastewater treatment. In Waste Treatment in the Food Processing Industry; Wang, L., Hung, Y.-T., Lo, H., Yapijakis, C., Eds.; Taylor and Francis: Boca Raton, FL, USA, 2006; pp. 193–254. [Google Scholar]
- Lehto, M.; Sipilä, I.; Sorvala, S.; Hellstedt, M.; Kymäläinen, H.R.; Sjöberg, A.M. Evaluation of on-farm biological treatment processes for wastewaters from vegetable peeling. Environ. Technol. 2009, 30, 3–10. [Google Scholar] [CrossRef] [PubMed]
- Kadlec, R.H.; Burgoon, P.S.; Henderson, M.E. Integrated natural systems for treating potato processing wastewater. Water Sci. Technol. 1997, 35, 263–270. [Google Scholar] [CrossRef]
- Burgoon, P.S.; Kadlec, R.H.; Henderson, M. Treatment of potato processing wastewater with engineered natural systems. Water Sci. Technol. 1999, 40, 211–215. [Google Scholar] [CrossRef]
- US Department of Agriculture (USDA). National Nutrient Database for Standard Reference, 2015. US Department of Agriculture, Agricultural Research Service (ARS), USDA Nutrient Data Laboratory. Available online: https://ndb.nal.usda.gov/ (accessed on 9 March 2015).
- Schaafsma, J.A.; Baldwin, A.H.; Streb, C.A. An evaluation of a constructed wetland to treat wastewater from a dairy farm in Maryland, USA. Ecol. Eng. 1999, 14, 199–206. [Google Scholar] [CrossRef]
- Headley, T.; Huett, D.; Davison, L. The removal of nutrients from plant nursery irrigation runoff in subsurface horizontal-flow wetlands. Water Sci. Technol. 2001, 44, 77–84. [Google Scholar] [PubMed]
- Gottschall, N.; Boutin, C.; Crolla, A.; Kinsley, C.; Champagne, P. The role of plants in the removal of nutrients at a constructed wetland treating agricultural (dairy) wastewater, Ontario, Canada. Ecol. Eng. 2007, 29, 154–163. [Google Scholar] [CrossRef]
- Boutilier, L.; Jamieson, R.; Gordon, R.; Lake, C. Transport of lithium tracer and E. coli in agricultural wastewater treatment wetlands. Water Qual. Res. J. Can. 2008, 43, 137–144. [Google Scholar]
- Carreau, R.; VanAcker, S.; VanderZaag, A.; Madani, A.; Drizo, A.; Jamieson, R.; Gordon, R. Evaluation of a surface flow constructed wetland treating abattoir wastewater. Appl. Eng. Agric. 2012, 28, 757–766. [Google Scholar] [CrossRef]
- Kadlec, R.H.; Wallace, S. Treatment Wetlands, 2nd ed.; CRC press: Boca Raton, FL, USA, 2008. [Google Scholar]
- Jamieson, R.; Gordon, R.; Wheeler, N.; Smith, E.; Stratton, G.; Madani, A. Determination of first order rate constants for wetlands treating livestock wastewater in cold climates. J. Environ. Eng. Sci. 2007, 6, 65–72. [Google Scholar] [CrossRef]
- Smith, E.; Gordon, R.; Madani, A.; Stratton, G. Year-round treatment of dairy wastewater by constructed wetlands in Atlantic Canada. Wetlands 2006, 26, 349–357. [Google Scholar] [CrossRef]
- Bosak Zurowsky, V. Evaluation of On-Farm Potato Processing Water Usage and Treatment. Master’s Thesis, School of Environmental Sciences, University of Guelph, Guelph, ON, Canada, 2015. [Google Scholar]
- Bosak, V.; VanderZaag, A.; Crolla, A.; Kinsley, C.; Gordon, R. Integrated Water Resources Management: A case study of on-farm water use for potato processing. Water Prac. Technol. 2016, 11, 66–74. [Google Scholar] [CrossRef]
- Stone, K.; Poach, M.; Hunt, P.; Reddy, G. Marsh-pond-marsh constructed wetland design analysis for swine lagoon wastewater treatment. Ecol. Eng. 2004, 23, 127–133. [Google Scholar] [CrossRef]
- Eaton, A.D.; Franson, M. Standard Methods for the Examination of Water & Wastewater; American Public Health Association: Washington, DC, USA, 2005. [Google Scholar]
- Reddy, G.B.; Hunt, P.G.; Phillips, R.; Stone, K.; Grubbs, A. Treatment of swine wastewater in marsh-pond-marsh constructed wetlands. Water Sci. Technol. 2001, 44, 545–550. [Google Scholar] [PubMed]
- Maddison, M.; Soosaar, K.; Mauring, T.; Mander, Ü. The biomass and nutrient and heavy metal content of cattails and reeds in wastewater treatment wetlands for the production of construction material in Estonia. Desalination 2009, 246, 120–128. [Google Scholar] [CrossRef]
- VanderZaag, A.C.; Gordon, R.J.; Burton, D.L.; Jamieson, R.C.; Stratton, G.W. Greenhouse gas emissions from surface flow and subsurface flow constructed wetlands treating dairy wastewater. J. Environ. Qual. 2010, 39, 460–471. [Google Scholar] [CrossRef] [PubMed]
- Kadlec, R.H.; Reddy, K.R. Temperature effects in treatment wetlands. Water Environ. Res. 2001, 73, 543–557. [Google Scholar] [CrossRef] [PubMed]
- Sanford, W.E.; Steenhuis, T.S.; Parlange, J.Y.; Surface, J.M.; Peverly, J.H. Hydraulic conductivity of gravel and sand as substrates in rock-reed filters. Ecol. Eng. 1995, 4, 321–336. [Google Scholar] [CrossRef]
- Drizo, A.; Frost, C.A.; Grace, J.; Smith, K.A. Phosphate and ammonium distribution in a pilot-scale constructed wetland with horizontal subsurface flow using shale as a substrate. Water Res. 2000, 34, 2483–2490. [Google Scholar] [CrossRef]
- Munoz, P.; Drizo, A.; Hession, W.C. Flow patterns of dairy wastewater constructed wetlands in a cold climate. Water Res. 2006, 40, 3209–3218. [Google Scholar] [CrossRef] [PubMed]
- Bosak, V.; VanderZaag, A.; Crolla, A.; Kinsley, C.; Gordon, R. Treatment of potato farm wastewater with sand filtration. Environ. Technol. 2015, 37, 1–8. [Google Scholar] [CrossRef] [PubMed]
- Wood, J.D.; Gordon, R.J.; Madani, A.; Stratton, G.W.; Bromley, H.M. Performance of Seasonally and Continuously Loaded Constructed Wetlands Treating Dairy Farm Wastewater. J. Environ. Qual. 2015, 44, 1965–1973. [Google Scholar] [CrossRef] [PubMed]
- Healy, M.G.; O’Flynn, C.J. The performance of constructed wetlands treating primary, secondary and dairy soiled water in Ireland (a review). J. Environ. Manag. 2011, 92, 2348–2354. [Google Scholar] [CrossRef] [PubMed]
- Solano, M.L.; Soriano, P.; Ciria, M.P. Constructed wetlands as a sustainable solution for wastewater treatment in small villages. Biosyst. Eng. 2004, 87, 109–118. [Google Scholar] [CrossRef]
- Song, Z.; Zheng, Z.; Li, J.; Sun, X.; Han, X.; Wang, W.; Xu, M. Seasonal and annual performance of a full-scale constructed wetland system for sewage treatment in China. Ecol. Eng. 2006, 26, 272–282. [Google Scholar] [CrossRef]
- Healy, M.G.; Rodgers, M.; Mulqueen, J. Treatment of dairy wastewater using constructed wetlands and intermittent sand filters. Bioresour. Technol. 2007, 98, 2268–2281. [Google Scholar] [CrossRef] [PubMed]
- de Zeeuw, W.; Heijnen, G.; de Vries, J. Reed bed treatment as a wastewater (post) treatment alternative in the potato starch industry. In Constructed Wetlands in Water Pollution Control; Cooper, P.F., Findlater, B.C., Eds.; Pergamon Press: Oxford, UK, 1990; pp. 551–553. [Google Scholar]
- Vymazal, J. Constructed wetlands for treatment of industrial wastewaters: A review. Ecol. Eng. 2014, 73, 724–751. [Google Scholar] [CrossRef]
- Poach, M.E.; Hunt, P.G.; Reddy, G.B.; Stone, K.C.; Johnson, M.H.; Grubbs, A. Swine wastewater treatment by marsh–pond–marsh constructed wetlands under varying nitrogen loads. Ecol. Eng. 2004, 23, 165–175. [Google Scholar] [CrossRef]
- Jinadasa, K.B.S.N.; Tanaka, N.; Sasikala, S.; Werellagama, D.R.I.B.; Mowjood, M.I.M.; Ng, W.J. Impact of harvesting on constructed wetlands performance—A comparison between Scirpus grossus and Typha angustifolia. J. Environ. Sci. Health. Part A 2008, 43, 664–671. [Google Scholar] [CrossRef] [PubMed]
- Yang, Z.; Wang, Q.; Zhang, J.; Xie, H.; Feng, S. Effect of Plant Harvesting on the Performance of Constructed Wetlands during Summer. Water 2016, 8, 24. [Google Scholar] [CrossRef]
© 2016 by the authors; licensee MDPI, Basel, Switzerland. This article is an open access article distributed under the terms and conditions of the Creative Commons Attribution (CC-BY) license (http://creativecommons.org/licenses/by/4.0/).