Abstract
Water quality complaints related to particulate matter and discolored water can be troublesome for water utilities in terms of follow-up investigations and implementation of appropriate actions because particulate matter can enter from a variety of sources; moreover, physicochemical processes can affect the water quality during the purification and transportation processes. The origin of particulates can be attributed to sources such as background organic/inorganic materials from water sources, water treatment plants, water distribution pipelines that have deteriorated, and rehabilitation activities in the water distribution systems. In this study, a practical method is proposed for tracing particulate sources. The method entails collecting information related to hydraulic, water quality, and structural conditions, employing a network flow-path model, and establishing a database of physicochemical properties for tubercles and slimes. The proposed method was implemented within two city water distribution systems that were located in Korea. These applications were conducted to demonstrate the practical applicability of the method for providing solutions to customer complaints. The results of the field studies indicated that the proposed method would be feasible for investigating the sources of particulates and for preparing appropriate action plans for complaints related to particulate matter.
1. Introduction
From a customer’s point of view, water quality is one of the most important aspects in the provision of drinking water services. Customer perceptions and/or complaints regarding water quality can be categorized into the following main types: taste and odor problems, discolored water, and particulates in the water. Recently, much attention has been devoted to particulates because they greatly affect customers’ confidence in tap water quality and are associated with the phenomenon of water discoloration caused by the mobilization of accumulated particles [1,2,3].
For several decades, water utilities have focused on minimizing the occurrence of discolored water, especially that which is caused by the corrosion of metallic pipes. However, recent studies have shown that other sources of particulate matter, aside from corrosion, can play a role in water discoloration [4,5,6,7]. Additionally, it has been reported that the accumulation of particulate matter is related to biological activity, and 1% to 12% of the organic matter may consist of bacterial biomass, thus making deposits an important factor to consider when evaluating the hygienic safety of drinking water [4]. The accumulation of biofilms in distribution and storage tank systems is affected by system materials, the presence of organics and disinfectants, and operating conditions (e.g., pH, temperature). Additionally, bacterial regrowth in the form of biofilms can lead to the accumulation and dislodgement of particulate matter through the corrosion of metallic pipes and the formation of slime deposits [4,8,9,10,11]. The hydraulic behavior of the particles is also important for determining the fate of the particulate matter in the water distribution network because the transport of particles will occur not only through the liquid phase as suspended solids, but can also take place as bed load transport [5,6].
Particulate matter has different sizes, densities, and chemical properties depending on its various sources, which are often characterized as external sources or internal processes. One of the primary sources of particulate matter is the distribution network itself, and particulates can be released by the pipes, fittings, and linings when corrosion takes place in the piping [5,12]. Particulate matter can also enter water distribution systems as background organic and inorganic materials from water sources [13,14]. Another possible reason for particulate matter in drinking water is the incomplete removal of suspended solids during water treatment, or the presence of treatment chemicals and materials such as carbon, sand, and alum in the water [7,15]. Service interruption and rehabilitation activities often result in particulate matter entering the distribution networks, as soils surrounding the pipe network can enter through cracked or broken parts during intermittent pressure drops; moreover, water can become contaminated with dirt in pipes that lack fitted protective caps. Typically, service work necessitates a complete flushing program to remove particulates prior to resuming supplies to customers [4,6]. In practical applications, the prediction of sources of particulate matter is complicated because the particulates are exposed to various interactive processes involving physical, chemical, and microbiological conditions throughout the distribution network. However, understanding the source of particulate matter is critical for water utilities so that they can take appropriate actions to address water quality issues. Hence, these complex processes need to be better understood. In particular, problems related to bacterial regrowth, biofilm formation, and the corresponding formation of particulate matter can be difficult to quantify despite the fact that these issues are known to be related to human health concerns and taste-and-odour events in drinking water [1,4]. Therefore, these issues warrant more research attention.
The purpose of this study is to provide a practical method for tracing particulate sources within water distribution systems by employing currently available physicochemical experiments. The proposed approach consists of specifying the most vulnerable area for contaminated water quality, collecting all the information associated with customer complaints, using hydraulic simulations and network models to identify potential sources, creating a database of physicochemical properties for tuberculation and slime, investigating the physicochemical properties of particles collected from the customer complaint areas, and characterizing potential particulate matter sources. More attention is devoted here to distinguishing corrosion-induced particles from non-corrosion-related ones because these issues require different remedial activities, i.e., the removal of corrosion-induced tubercles necessitates rehabilitation of the pipeline, whereas loosely deposited slimes can be eliminated through pipeline flushing treatments. The physicochemical properties of particulate matter were analyzed with volatile suspended solid (VSS) data, scanning electron microscope-energy dispersive spectroscopy (SEM-EDS), inductively coupled plasma-mass spectrometry (ICP-MS), and X-ray diffraction (XRD), which has been applied to detect the elemental composition of corrosion deposits in previous studies [16,17,18]. The proposed method was applied to two city water distribution systems (WDSs), namely the Sacheon (SC) City WDS and the Paju (PJ) City WDS, which are both located in Korea, to demonstrate the practical applicability of the method for providing water utilities with solutions to customer complaints.
2. Materials and Methods
2.1. Source Characterization Method
Water utilities often detect water quality problems stemming from particulate matter contamination because of customer complaints. Single or multiple complaints can be received in one area of the system, which generally indicates that the water quality has deteriorated within that area. The water utilities can then confirm the existence of particulate matter by collecting water samples and measuring the turbidity and the concentration of suspended solids. In most practical applications, however, simple measurements and experimental tests do not provide enough information to resolve the issue because there are diverse sources for particulate matter. A contamination event usually occurs because of changes in the hydraulic behavior of accumulated particles, and there are typically temporal and spatial variations in the concentrations. Thus, to effectively investigate the sources of particulate matter, the following procedure, based on practical experience, is suggested (Figure 1).
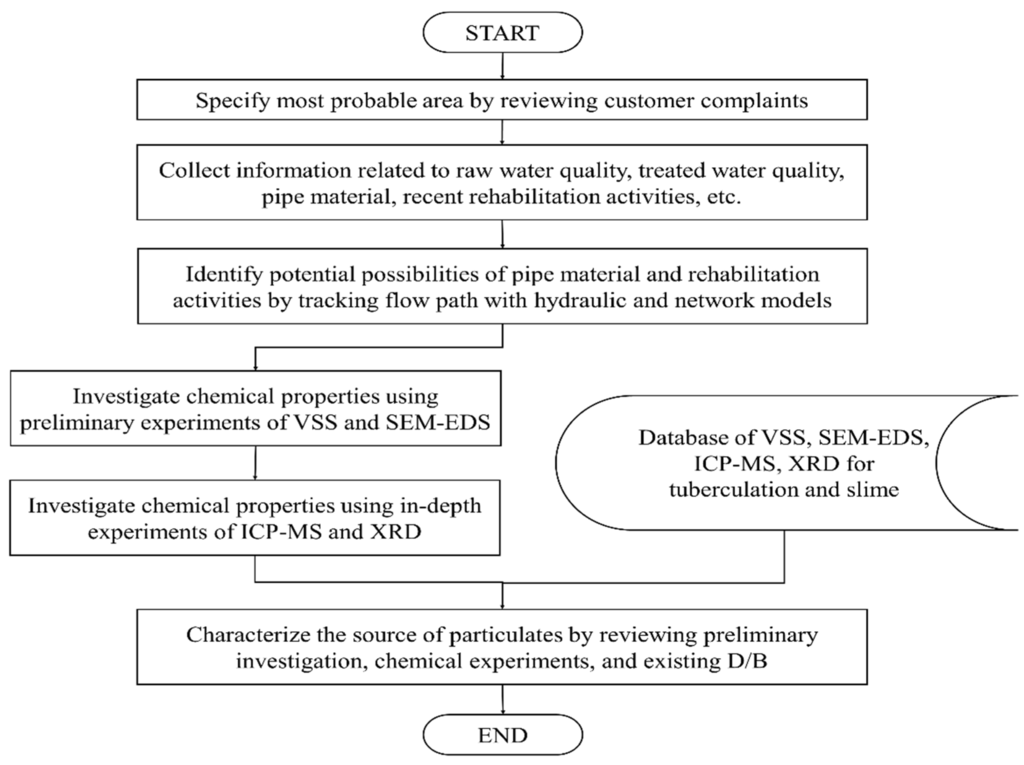
Figure 1.
Procedure for characterizing the sources of particulates.
The first step of the procedure is to collect customer complaints and specify the most probable source area by using a geographic information system (GIS), which contains data related to customers and the WDS. Then, the GIS is used to collect information related to pipe materials and recent maintenance and rehabilitation activities including new installations, pipe replacements, and simple repairs. Current and historical operational data such as untreated and treated water quality can be collected from annual operational reports and/or the supervisory control and data acquisition (SCADA) system. After untreated water is treated at the water treatment plant, the potable water is delivered to the customer via distribution mains and service connections. Therefore, it is important to track the flow path from the water treatment plant to the probable area of contamination. Recently, many hydraulic models such as the EPANET2 have been widely employed to simulate the operating conditions of water supply systems [19]. A record of the pipelines the water has passed through can be obtained by combining the hydraulic simulation results with a network model. A network model, in which a network consisting of a set of nodes is linked by directed arcs, tracks the pipeline flow by using the following procedure:
Step 1: select the contaminated area as a sink node (the element (A2,N2) of the Ap × Nk matrix in Figure 2a);
Step 2: search the source nodes (see Figure 2a);
Step 3: search the connected arcs (see Figure 2b);
Step 4: determine the source nodes depending on their flow direction (see Figure 2c);
Step 5: repeat Steps (3) and (4) until no source is found.

Figure 2.
Network model representation for tracking the sources.
Subsequently, preliminary experiments with VSS and SEM-EDS data and in-depth experiments with ICP-MS and XRD data are conducted to investigate the chemical properties of the particulate matter. Finally, the source of the particulate matter is determined by combining the results of the preliminary investigations, the chemical analyses, and the existing database.
2.2. Sample Preparation for Physicochemical Experiments
For the proposed procedure, it is important to compare control samples from tubercles and slimes with particulate samples from drinking water. Therefore, two types of samples need to be prepared, namely samples from both pipe specimens and water samples. To distinguish corrosion-induced particles found in tubercles from the particulate matter from other sources such as slimes, 27 samples (21 tubercles and six slimes) were collected in this study from the inside of the pipes and these were analyzed according to the above-mentioned procedures. The tubercle and slime samples were collected from 10 different city locations, as shown in Figure 3, when planned water stoppages were occurring. Tubercles were carefully removed from the exposed pipe surface, whereas slimes were scraped off.
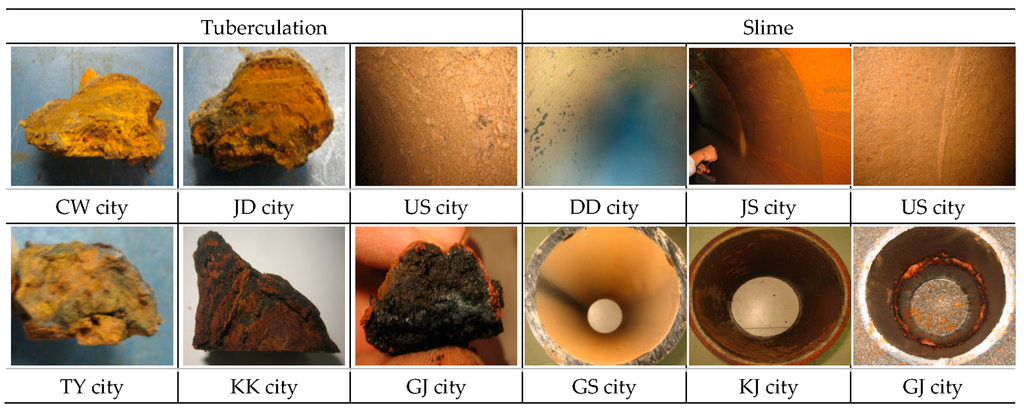
Figure 3.
Selective samples of tubercles and slimes.
Three water samples were collected from the SC City and PJ City WDSs to characterize the physicochemical compositions of suspended matter. Glass microfiber filters were used to collect the particulate matter from all three samples. Specifically, the samples were filtered through pre-weighed glass microfiber filters, and then, the filters were dried in a 105 °C oven for 2 h and were analyzed gravimetrically to determine the weight of the particles (total suspended solids, TSS); afterwards, the filters were dried at 550 °C for 20 min and reweighed to obtain the VSS data.
2.3. Chemical Analyses of Samples
All the particulate samples were sent to the Centre for Research Facilities (CRF) of Chungnam National University, an authorized analysis institution, for analytical processing. The samples for microscopic analysis were made by sectioning, mounting, grinding, polishing, and etching. The elemental composition of tubercles and slimes was determined by use of an SEM JSM-7000F (JEOL Corporation, Tokyo, Japan) and EDS INCA x-act (Oxford Instruments, Oxfordshire, UK). The EDS provided quantitative data for the elemental compositions at a sampling depth of 1–2 μm; thus, these data were useful for identifying potential chemical elements to be further investigated in the next ICP-MS and XRD analysis phase. The samples for ICP-MS were digested for 30 min in 65% HNO3 (Merck Suprapur) that was made up to 100 mL with metal-free water. The elements Fe, Cu, Mn, Zn, Ca, Al, Mg, Si, As, K, and Na were detected by means of an ICP-MS XSERIES (Thermo Scientific, Waltham, MA, USA). A few grams of each sample was also extracted for XRD analysis, and these samples were ground into a fine powder and placed into a sample holder. The crystalline phase composition was analyzed by an XRD D8 DISCOVER (Bruker AXS, Billerica, MA, USA) outfitted with a 3 kW X-ray tube with a Cu target.
3. Results and Discussion
3.1. Establishment of a Database for Tuberculation and Slime
The physicochemical results for the tubercles and slimes are summarized in the boxplots shown in Figure 4. In these plots, the bottom and top of the box represent the first and third quartiles, respectively, the band inside the box represents the median, and the ends of the whiskers show the minimum and maximum values. As a preliminary experiment, the weight percentages of VSS were compared with those of TSS (see Figure 4a). The results show that the average VSS weight percentage was 12.0% for tubercles and 24.2% for slime. The larger percentage of VSS in slime can be attributed to the existence of organic materials in potable water [2]. Next, SEM-EDS was used to identify the elements and quantitative information on the composition of the particulate matter was obtained by rastering a focused electron beam across the surface and detecting the secondary or backscattered electron signal. As shown by the weight percentages in Figure 4b,c, the contents of carbon (C) and oxygen (O) were not appreciably different in tubercles and slime, and thus, these elements cannot be used to distinguish particulates derived from tubercles and slime. Overall, the tubercles contained, in descending order, a high percentage of iron (Fe), silicon (Si), and aluminium (Al), whereas slime contained aluminium (Al), iron (Fe), and manganese (Mn) in the same order. This illustrates how corrosion-induced particulates can be identified by the existence of high amounts of iron, and the other particulates can be identified from their dominant elements. For example, a high percentage of Al can be indicative of inadequate water treatment processes after a coagulant has been injected; Mn is mainly due to its presence in raw water.
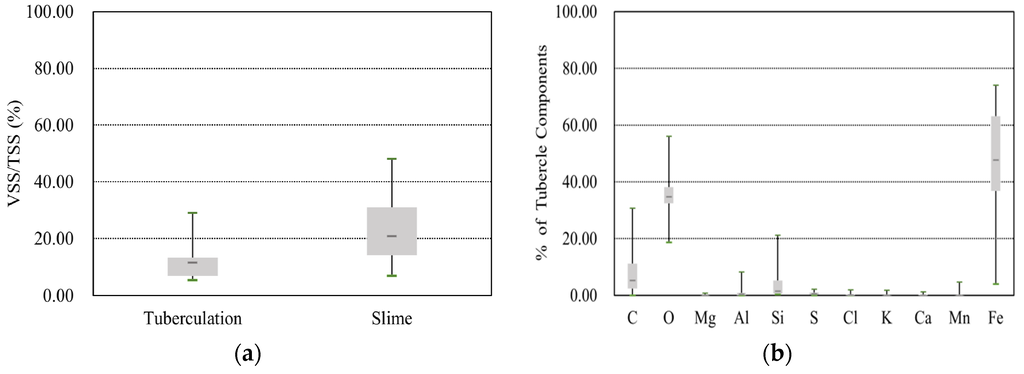
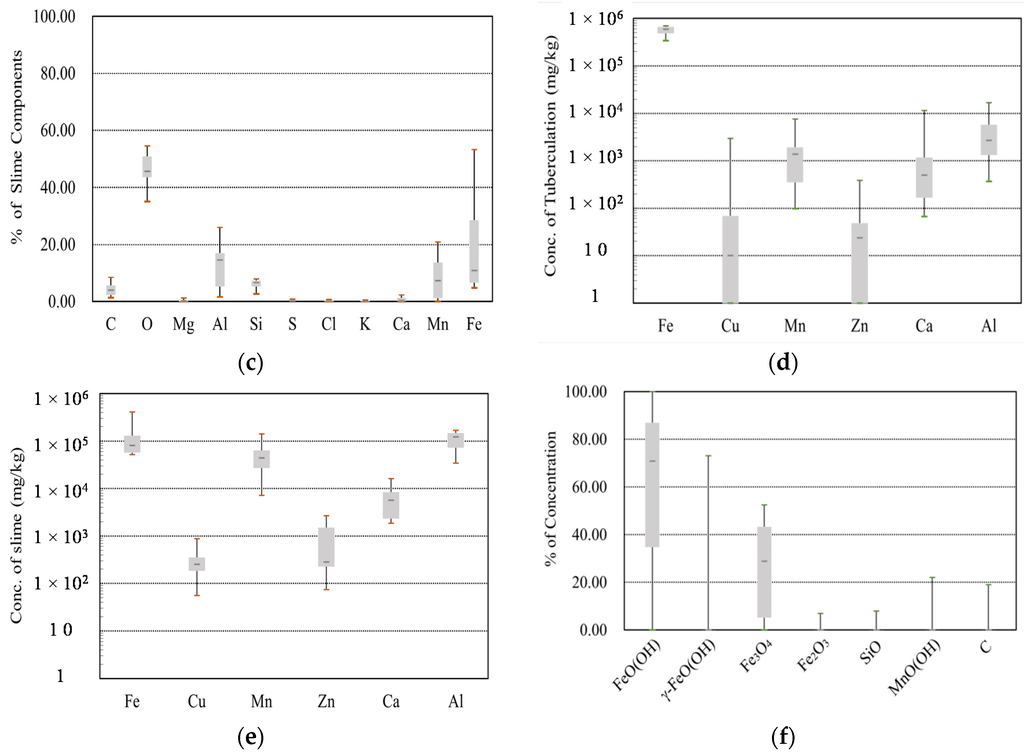
Figure 4.
Experimental results for tubercles and slimes. (a) VSS (tubercles and slimes); (b) SEM-EDS (tubercles); (c) SEM-EDS (slimes); (d) ICP-MS (tubercles); (e) ICP-MS (slimes); (f) XRD (tubercles).
To obtain in-depth experimental data, ICP-MS can be used to detect the concentration of metals and several non-metals; with this technique, the samples are ionized with inductively coupled plasma, and then, the resultant ions are separated and quantified. In this study, six mineral elements, namely Fe, Cu, Mn, Zn, Ca, and Al, were detected, and the data are shown in Figure 4d,e. The results for the tubercle samples showed concentrations of 6.0 × 10⁵ mg/kg for Fe, 2.7 × 10³ mg/kg for Al, and 1.4 × 10³ mg/kg for Mn, which were similar to the results of Gerke et al. [16]. In contrast, the results for the slime samples showed concentrations of 1.2 × 10⁵ mg/kg for Al, 8.0 × 10⁴ mg/kg for Fe, and 4.4 × 10⁴ mg/kg for Mn. The latter result may explain why a large VSS content was consistently found. The XRD experimental data provided detailed information on the crystallographic structure and physical properties of the materials, and these data were obtained by irradiating the samples with a beam of monochromatic X-rays over a variable incident angle. In the tubercle samples, geothite (FeO(OH)), lepidocrocite (γ-FeO(OH)), magnetite (Fe3O4), and maghemite (Fe2O3) were found; these compounds were related to corrosion-induced crystals (see Figure 4f). The other minerals, namely silicon oxide (SiO2), manganite (MnO(OH)), and carbon (C), were estimated to be fine particles associated with manganese oxide from sources including raw water, the sand filtration process, and activated carbon adsorption basins.
3.2. A Field Study of the SC City Water Distribution System
The SC City WDS was chosen as a study area to investigate the source of particulate matter by use of the proposed method. The SC city WDS supplies drinking water to SC City, which is located in the southern part of Korea.
3.2.1. Description of the SC City Drinking Water System
A schematic map of the SC City water supply system, including the main facilities, is shown in Figure 5. The SC potable water system supplies 261,000 m3 of drinking water per day through the SC water treatment plant (WTP). The SC WTP purifies untreated water taken from the Nam River through a conventional WTP process. The distribution mains and service connections consist of both metallic pipes (e.g., ductile cast iron, cast iron) (system amount, 9.1%) and non-metallic pipes (e.g., polyethylene, polyvinyl chloride) (system amount, 90.9%). The field investigation revealed that there is little possibility for customer complaints due to the presence of corrosion by-products and that the raw water contains manganese. Hydraulic simulations for the SC City WDS were not performed because of the low possibility of tubercle-induced particulates being present in the distribution network.
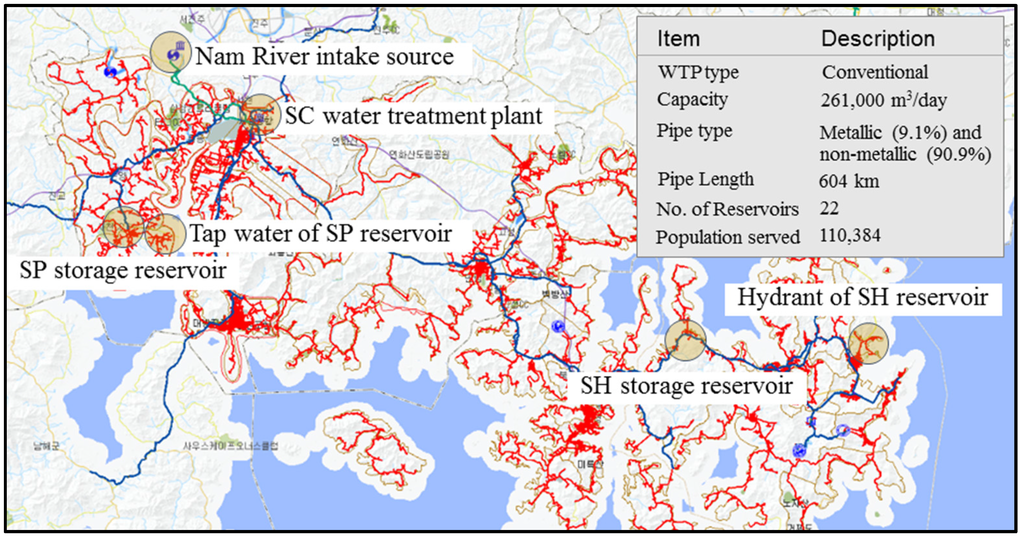
Figure 5.
Schematic representation of the SC City water supply system.
3.2.2. Results and Discussion for SC City Particulates
Two samples were collected from a tap for the Seopo (SP) storage reservoir and a hydrant attached to the Shinhyun (SH) storage reservoir. The weight percentages of VSS were 86.7% at the tap and 20.2% at the hydrant, which illustrates that the particulates were essentially related to the slime. The SEM-EDS analysis was not performed for these samples. The ICP-MS and XRD results for the tap and hydrant are summarized in Figure 6. Through combining data from the physicochemical experiments, it can be concluded that organic compounds were a potential source for the particulates at the tap and that manganese from untreated water and iron from metallic pipes was not the source of the particulates. In the hydrant sample, the concentration of iron as determined by ICP-MS was relatively high, and the maghemite (Fe2O3) as determined by XRD supports the possibility of corrosion-induced particulates. This finding was also supported by the low VSS percentage at the hydrant compared to that of the tap. We therefore conclude that corrosion of the pipe material is influencing the formation of particulates here, and an SEM-EDS analysis will be needed to conduct a more precise investigation of the source.
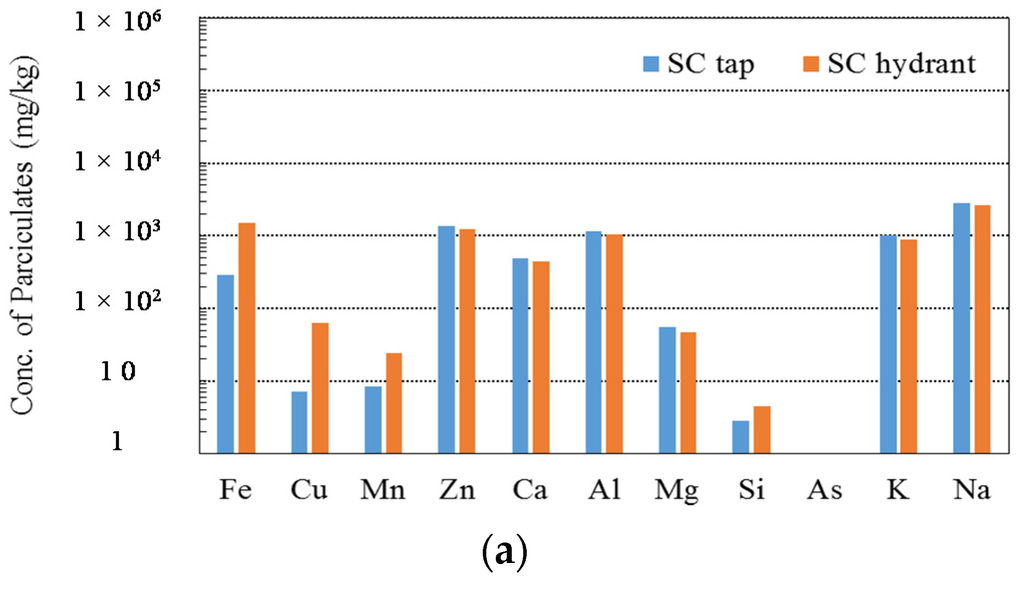
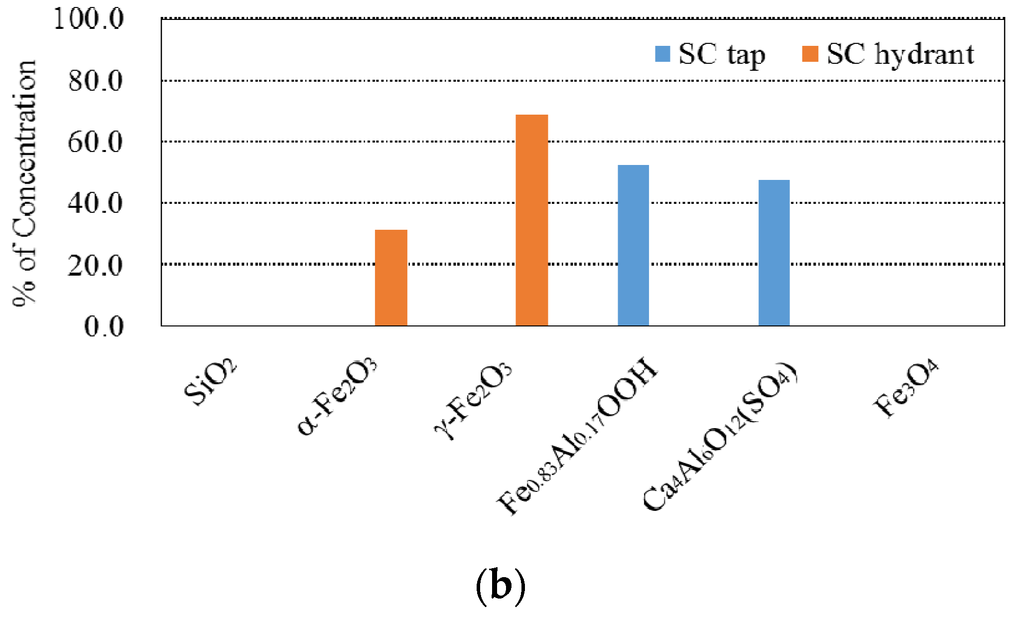
Figure 6.
Results of experiments on the SC particulates. (a) Chemical concentration of the SC City particulates analyzed by ICP-MS; (b) Chemical composition of the SC City particulates analyzed by the XRD.
3.3. A Field Study of the PJ City Water Distribution System
Another field study was performed on the PJ City WDS which supplies drinking water to PJ City, which is located in the northern part of Korea.
3.3.1. Description of the PJ City Drinking Water System
The PJ City WDS supplies 96,000 m3 of drinking water per day through the Munsan (MS) WTP. The MS WTP purifies untreated water that is taken from the Imjin River through conventional water treatment processes, and then, the water undergoes advanced treatment processes with ozone and granular activated carbon. A total of 75.9% of the distribution mains and service connections consist of metallic pipes (e.g., ductile cast iron and stainless steel) and 24.1% consist of non-metallic pipes (e.g., polyvinyl chloride and polyethylene). Customer complaints regarding water quality have been concentrated in a distinct area of PJ City, and approximately 40 reports are made here annually. The field investigation revealed that the majority of the pipe material is ductile cast iron and that particulate matter was causing the water color to change, as shown in Figure 7a.
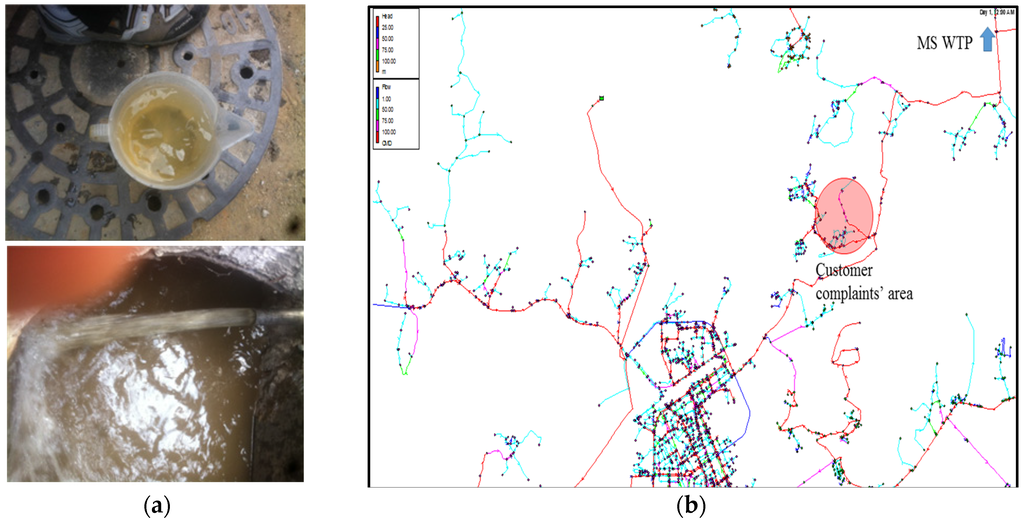
Figure 7.
Discolored water and hydraulic simulation results for the PJ water distribution system. (a) Discolored water; (b) Hydraulic simulation results.
3.3.2. Source-Tracking with Hydraulic and Network Models
By implementing the hydraulic simulation and network source-tracking model, it was determined that the majority of the water flow passes through old metallic pipes, which indicates that tubercles from corroded pipes could be a potential source of the particulate matter. The hydraulic simulation results with flow paths from the MS WTP to the analysis area are shown in Figure 7b.
3.3.3. Results and Discussion for PJ City Particulates
A set of samples were collected from taps within the analysis area. The weight percentages of VSS were more than 40%, and these values were larger than the values for the maximum VSS amounts found during the tuberculation analyses summarized in Figure 4. These VSS percentage data do not support the notion that particulates were the result of corrosion by-products from the metallic pipes. Notably, these results differ from those for the source-tracking predictions; this was because the combination of the hydraulic and network model data did not provide an internal overview of the conditions of the pipelines.
The results of the SEM-EDS, ICP-MS, and XRD analyses are plotted in Figure 8. From combining the results of the chemical components for the PJ City particulate matter, it was determined that aluminium (Al), calcium (Ca), and silicate (Si) were the major components of the particulate matter, whose potential sources could be untreated water and/or the water treatment plant. Carbon (C) and oxygen (O) comprised a large proportion of the chemical components in the SEM-EDS data, as shown in Figure 8a. However, these elements are not appropriate as indicators for discerning the source of the particulate matter as these compounds are commonly found in natural conditions. Iron (Fe) was determined to be a key component of the particulate matter according to the SEM-EDS and ICP-MS results, but the concentration was insignificant compared to the results of tubercles in Figure 5. Therefore, even though the particles contained a large proportion of iron, the other components, namely Al, Ca, and Si, were more indicative of the particulate matter source and the occurrence of discolored water. This explanation is supported by the results of the XRD analysis shown in Figure 8c whereby the compounds Al and Si formed 31.4% of the muscovite-2M1 (KAl2(Si,Al)4O10(OH)2).
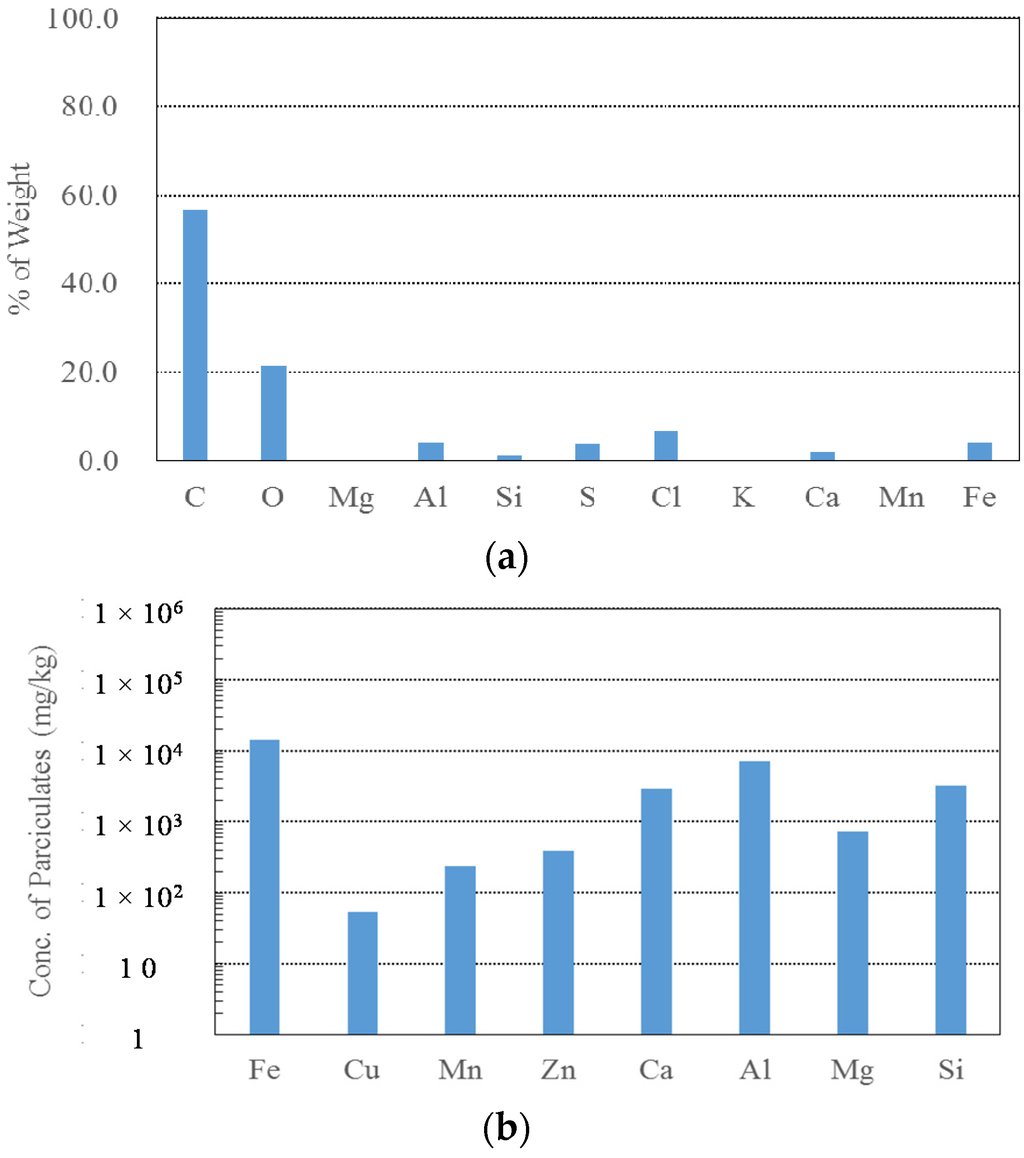
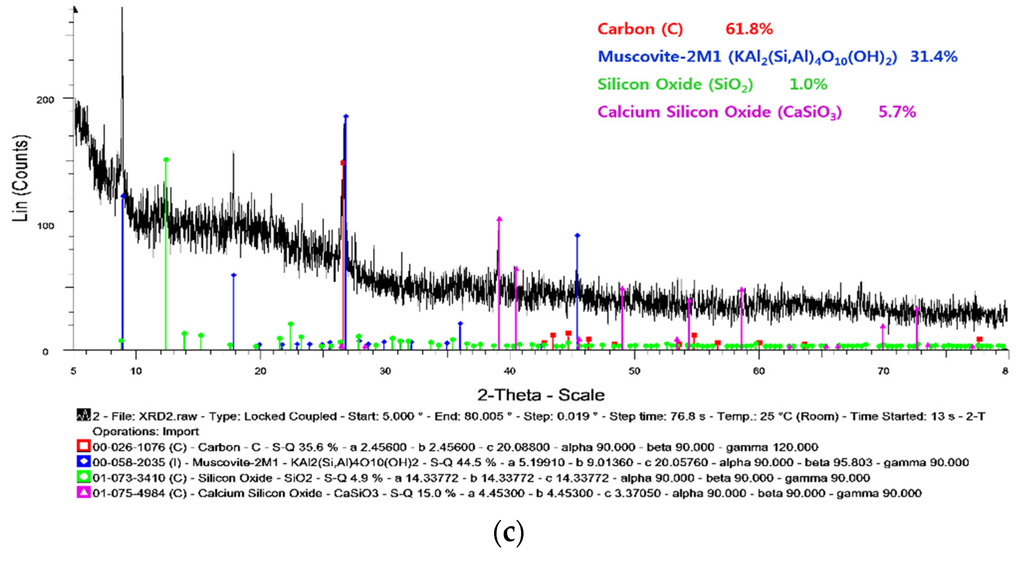
Figure 8.
The results of experiments on PJ City particulates. (a) Chemical composition of PJ City particulates analyzed by SEM-EDS; (b) Chemical concentration of PJ City particulates analyzed by ICP-MS; (c) Chemical concentration of PJ City particulates analyzed by XRD.
4. Concluding Remarks
In this study, a practical approach was proposed to investigate the source of particulate matter responsible for water discoloration in drinking water supplies and the corresponding customer complaints. The proposed approach systematically integrates available technologies that gather information related to customer complaints; it involves tracing inverse flow paths using hydraulic simulations and network models, creating a physicochemical properties database of tubercles and slimes, and analyzing the components of particulate matter with VSS, SEM-EDS, ICP-MS, and XRD data. In addition, the proposed method was tested to demonstrate its practical applicability in two city WDSs, where customer complaints had been initiated due to unknown sources of particulates. Based on the results of these investigations, the following conclusions can be drawn:
- 1)
- In establishing a database for tubercles and slime, it was determined that tubercles contain an extremely high percentage of iron, whereas slime is composed of, in descending order, aluminium, iron, and manganese.
- 2)
- The source-tracking method, which involves combining hydraulic simulations and network models, can provide good insights for corrosion-induced particles passing through old metallic pipes. However, this method should be supported by the results of physicochemical analyses such as data from VSS, SEM-EDS, ICP-MS, and XRD investigations.
- 3)
- The field study applied to the SC and PJ WDSs showed consistent results regarding the major chemical components of the particulate matter, even though the particulate matter was analyzed with different experimental devices including SEM-EDS, ICP-MS, and XRD. However, use of a full suite of analytical methods would be helpful to clearly characterize the sources of the particulate matter.
- 4)
- We recommend that more databases for tubercles, slimes, and particulates be created for improving predictions of the sources of particulate matter. Furthermore, microbiological processes should be further investigated to fully characterize the settling, dislodging and re-suspension processes for slimes in the form of slime in WDSs.
Acknowledgments
This work was financially supported by the Korean Ministry of the Environment through its Eco-Innovation Program (Project No. GT-11-G-02-001-6). The authors thank Peter J. Coombes at Urban Water Cycle Solutions, who was the guest editor of the special issue on “Urban Water Challenges”, for his valuable comments on microbial activities.
Author Contributions
Sample collection and physicochemical experiments of particulates were carried out by Seon-Ha Chae and Do-Hwan Kim. The source characterization method considering all aspects of hydraulic, water quality, and structural conditions was proposed by Doo Yong Choi. Cheol-Ho Bae provided all the physicochemical data of tubercles and slimes collected from 10 different cities. The manuscript was written by Seon-Ha Chae and Doo Yong Choi through organising analysing field data.
Conflicts of Interest
The authors declare no conflict of interest.
References
- Evins, C.; Liebeschuetz, J.; Wilkiams, S.M. Aesthetic Water Quality Problems in Distribution Systems: A Source Document for the Water Mains Rehabilitation Manual; Water Research Centre: Swindon, UK, 1990. [Google Scholar]
- Vreeburg, J. Discoloration in Drinking Water Systems: A Particular Approach. Ph.D. Thesis, TU Delft, Delft, The Netherlands, 25 June 2007. [Google Scholar]
- Kim, D.H.; Lee, D.J.; Hwang, J.S.; Choi, D.Y. Characteristic analysis and effect of particulate material in drinking water distribution networks. J. Korean Soc. Environ. Eng. 2013, 35, 312–320. [Google Scholar] [CrossRef]
- Gauthier, V.; Gérard, B.; Portal, J.-M.; Block, J.C.; Gatel, D. Organic matter as loose deposits in a drinking water distribution system. Water Res. 1999, 33, 1014–1026. [Google Scholar] [CrossRef]
- Boxall, J.B.; Skipworth, P.J.; Saul, A.J. Aggressive flushing for discolouration event mitigation in water distribution networks. Water Sci. Technol. Water Supply 2003, 3, 179–186. [Google Scholar]
- Prince, R.A.; Goulter, I.; Ryan, G. What causes customer complaints about discoloured drinking water? Correlating customer complaints with online monitoring of flow rate and turbidity. Water 2003, 30, 62–67. [Google Scholar]
- Vreeburg, J.; Schaap, P.G.; van Dijk, J.C. Particles in the drinking water system: From source to discolouration. Water Sci. Technol. Water Supply 2004, 4, 431–438. [Google Scholar]
- Ollos, P.J.; Huck, P.M.; Slawson, R.M. Factors affecting bioflim accumulation in model distribution systems. J. Am. Water Works Assoc. 2003, 95, 87–97. [Google Scholar]
- Camper, A.K.; Brastrup, K.; Sandvig, A.; Clement, J.; Spencer, C.; Capuzzi, A.J. Effect of distribution system materials on bacterial regrowth. J. Am. Water Works Assoc. 2003, 95, 107–121. [Google Scholar]
- Spinks, A.T.; Dunstan, R.H.; Harrison, T.; Coombes, P.; Kuczera, G. Thermal inactivation of water-borne pathogenic indicator bacteria at sub-boiling temperatures. Water Res. 2006, 40, 1326–1332. [Google Scholar] [CrossRef] [PubMed]
- Evans, C.A.; Coombes, P.J.; Dunstan, R.H.; Harrison, T. Extensive bacterial diversity indicates the potential operation of a dynamic micro-ecology within domestic rainwater storage systems. Sci. Total Environ. 2009, 407, 5206–5215. [Google Scholar] [CrossRef] [PubMed]
- Stephenson, G. Removing Loose Deposits from Water Mains: Operational Guidelines; Water Research Centre: Swindon, UK, 1989. [Google Scholar]
- Kirmeyer, G.J.; Friedman, M.; Clement, J.; Sandvig, A.; Noran, P.F.; Martel, K.D.; Smith, D.; LeChevallier, M.; Volk, C.; Antoun, E.; et al. Guideline Manual for Maintaining Distribution System Water Quality; American Water Works Research Foundation and American Water Works Association: Denver, CO, USA, 2000. [Google Scholar]
- Ellison, D. Investigation of Pipe Cleaning Methods; Rep. No. 90938; American Water Works Association Research Foundation: Denver, CO, USA, 2003. [Google Scholar]
- Gauthier, V.; Barbeau, B.; Milette, R.; Block, J.-C.; Prevost, M. Suspended particles in the drinking water of two distribution systems. Water Sci. Technol. Water Supply 2001, 1, 237–245. [Google Scholar]
- Gerke, T.; Maynard, B.; Schock, M.R.; Lytle, D.L. Physiochemical characterization of five iron tubercles from a single drinking water distribution system: Possible new insights on their formation and growth. Corros. Sci. 2008, 50, 2030–2039. [Google Scholar] [CrossRef]
- Zhang, Z.; Stout, J.E.; Yu, V.L.; Vidic, R. Effect of pipe corrosion scales on chlorine dioxide consumption in drinking water systems. Water Res. 2008, 42, 129–136. [Google Scholar] [CrossRef] [PubMed]
- Zietz, B.P.; Richter, K.; Lass, J.; Suchenwirth, R.; Huppmann, R. Release of metals from different sections of domestic drinking water installations. Water Qual. Expo. Health 2015, 7, 193–204. [Google Scholar] [CrossRef]
- Rossman, L.A. Epanet2 Users Manual; Rep. No. EPA-600/R-00/57; U.S. Environmental Protection Agency: Cincinnati, OH, USA, 2000. [Google Scholar]
© 2016 by the authors; licensee MDPI, Basel, Switzerland. This article is an open access article distributed under the terms and conditions of the Creative Commons by Attribution (CC-BY) license (http://creativecommons.org/licenses/by/4.0/).