Review

Vapor Flow Resistance of Dry Soil Layer to Soil Water Evaporation in Arid Environment: An Overview

Department of Civil and Environmental Engineering, Old Dominion University, Norfolk, VA 23529-0241, USA
Water 2015, 7(8), 4552-4574; https://doi.org/10.3390/w7084552
Submission received: 2 July 2015 / Revised: 8 August 2015 / Accepted: 12 August 2015 / Published: 21 August 2015

Abstract

:
Evaporation from bare sandy soils is the core component of the hydrologic cycle in arid environments, where vertical water movement dominates. Although extensive measurement and modeling studies have been conducted and reported in existing literature, the physics of dry soil and its function in evaporation is still a challenging topic with significant remaining issues. Thus, an overview of the previous findings will be very beneficial for identifying further research needs that aim to advance our understanding of the vapor flow resistance (VFR) effect on soil water evaporation as influenced by characteristics of the dry soil layer (DSL) and evaporation zone (EZ). In this regard, six measurement and four modeling studies were overviewed. The results of these overviewed studies, along with the others, affirm the conceptual dynamics of DSL and EZ during drying or wetting processes (but not both) within dry sandy soils. The VFR effect tends to linearly increase with DSL thickness (δ) when δ < 5 cm and is likely to increase as a logarithmic function of δ when δ ≥ 5 cm. The vaporization-condensation-movement (VCM) dynamics in a DSL depend on soil textures: sandy soils can form a thick (10 to 20 cm) DSL while sandy clay soils may or may not have a clear DSL; regardless, a DSL can function as a transient EZ, a vapor condensation zone, and/or a vapor transport medium. Based on the overview, further studies will need to generate long-term continuous field data, develop hydraulic functions for very dry soils, and establish an approach to quantify the dynamics and VFR effects of DSLs during wetting-drying cycles as well as take into account such effects when using conventional (e.g., Penman-Monteith) evaporation models.

1. Background

Evaporation from bare sandy soils is the core component of the hydrologic cycle (dominated by vertical water movement) in arid/semiarid regions, where any disturbance to the fragile hydrology is likely to trigger land desertification and deteriorate the very sparse vegetation ecosystem [1,2,3,4,5,6,7]. For instance, the 51,700 km2 Horqin Sandy Land (HSL; 118°35′ to 123°30′ E, 42°41′ to 45°15′ N), one of the most typical sandy lands in the world and historically part of the largest and most characteristic Eurasian grassland [8], has undergone severe desertification in recent decades [9,10]: deserted land has reached 57.8% of the HSL’s total area [11]. This is primarily because inappropriate reclamation for agriculture (e.g., chisel plough tillage in fall) and overgrazing [12] has adversely altered the natural hydrologic condition [7]. As a result, this region is losing biome productivity [13] as well as incurring environmental problems such as more frequent dust storms of greater magnitude and frequency [14,15,16,17]. Similar desertification-related issues exist all over the world [18,19], including Africa and the southwestern USA [20]. Addressing these bioenvironmental problems requires that physical processes of soil evaporation (e.g., vapor and moisture advection/diffusion through variably saturated soils) are accurately described [21,22,23]. Such regions are dominated by bare sandy soils that most of the time are covered by a thin (5 to 30 cm) top dry soil layer (DSL) [7,24,25], within which soil moisture is dominantly in vapor phase and soil water potentials are usually below −1.5 × 104 cm [26]. Such a DSL can have an important vapor flow resistance (VFR) effect on the soil water evaporation rate and dynamic processes under natural conditions [23,27]. In other words, the DSL can retard underlying soils from further drying. Hereinafter, the VFR effect is measured as the difference between the soil water evaporation rate with a DSL and without a DSL. A good understanding of the VFR effect is obviously needed but currently lacking [28]. The relative VFR effect, REvfr in percent and being greater for a larger VFR effect, can be computed as:
R E r f r = E n o D S L E D S L E n o D S L × 100 %
where E n o D S L is the soil evaporation rate with no DSL, and E n o D S L is the soil evaporation rate with DSL.
In practice, the conventional evaporation models [29,30,31,32,33,34] that are used in watershed hydrology (e.g., Soil and Water Assessment Tool or SWAT) [35,36] and land-atmosphere interaction (e.g., Community Land Model or CLM) [37,38] models estimate soil water evaporation without explicitly considering the VFR effect [39,40] partially due to our insufficient knowledge of physical dynamics (e.g., thickness variation and the vaporization-condensation cycle) within DSL. Alternatively, those models simply use a lumped parameter, namely surface resistance ( r s s ), to represent the VFR effect of DSL, with r s s usually estimated as a function of soil surface moisture only [40,41,42,43,44,45,46,47,48,49,50]. In reality, for a given soil profile, a DSL can be formed on the surface during soil drying and its thickness will gradually increase with elapsed time, while a thin evaporation zone (EZ) around the bottom boundary of the DSL will be moved down into a greater depth [51,52,53,54,55]. The soil water within the EZ is predominantly in liquid phase, whereas the soil water within the DSL can either be in vapor or liquid phase, depending on the cyclic change in solar radiation and soil temperature [56]. For any given day, the EZ is active throughout the day and moves vertically with the development/reduction of the DSL at both diurnal and inter-diurnal time scales, but the DSL can act as an EZ between late morning and early afternoon and may function as a condensation zone at other times when solar radiation and soil temperature are low. Figure 1 illustrates possible distributions of DSL and EZ within a vertical soil profile as a result of repeated drying-wetting cycles. A model that cannot appropriately consider these dynamic processes is likely to have little value in addressing the aforementioned bioenvironmental problems in arid/semiarid regions. Also, this similar issue is likely to bias the prediction of land-atmosphere interactions because soil water evaporation dynamics are erroneously modeled [38,57].
Figure 1. Possible distributions of dry soil layer (DSL) and evaporation zone (EZ) within a soil profile for situations of: (a) continuously drying; (b) drying and wetting; (c) drying, wetting, and drying; (d) continuously drying with condensation/re-evaporation; (e) drying and wetting with condensation/re-evaporation and (f) drying, wetting and drying with condensation/re-evaporation.
Water 07 04552 g001
Philip and de Vries [21] developed a theory that can be modeled with a set of partial differential equations governing liquid-heat-vapor dynamic processes in porous materials (including soils). Hereinafter, this model is designated as the PdV for description purposes. Following the PdV model, [51] suggested that the desiccation of a soil profile can go through three phases (i.e., Phase I to III). In Phase I, the soil is sufficiently moist and soil water evaporation (E) is indistinguishable from that from a saturated surface (Es), whereas in Phase III, surface layers are very dry and E is sensitive to and may be negatively correlated with heat flux into soil. In Phase II, because the soil has intermediate moisture content, E is independent of Es and depends on soil moisture distribution only. During Phase I, liquid water is supplied from the lower layers and vaporized at the soil surface at rate Es, and then the vapor is transferred into the ambient atmosphere. On the other hand, during Phase II and III, vaporization takes place not at the surface but within the soil mass (e.g., the EZs), and the vapor diffuses upward through a top DSL to the surface and then into the atmosphere. The soil evaporation for the situations illustrated in Figure 1b,e can be in Phase I or II, while the soil evaporation for the other situations illustrated in Figure 1 is likely to be in Phase III. For Phase I and II, E tends to be maximal when total heat flux into the soil is greatest (e.g., seasonally in summer and daily at noon), whereas for Phase III, in contrast, E tends to be maximal when total heat flux out of the soil is greatest (e.g., seasonally in winter and daily at midnight). However, as pointed out by [26] and in my own research, due to wrong modeling premises (e.g., the traditional hydraulic functions are assumed to still be suitable for water potentials of <−1.5 × 104 cm) or insufficient and inclusive experimental (mostly laboratory soil-column) data, previous studies [22,23,53,54,55,56,57,58,59,60,61,62,63,64,65,66,67,68,69,70,71] primarily examined and reported dynamics of Phase I and II evaporation. For this reason, the features presented by those researchers are unlikely to be found at any sites under naturally dry conditions, where most of the time a top DSL lies over underlying moist soils and Phase III dominates the soil water evaporation process.
The PdV is becoming applicable in practice because of the technologic advancement of heat pulse sensors in the past decade [72,73,74,75]. However, to date, few applications (including [76,77,78,79]) in very dry regions, where Phase III dominates the hydrology cycle most of the time, have considered the insufficiency of traditional hydraulic function resulting from prevalent soil air or film flow [80]. Among the typical studies of Phase I and II, [63] parameterized a PdV model using measured data on heat flux, soil moisture, and pore air humidity of a repacked Toyoura fine sand column, and then used the model to numerically examine the dynamics of DSL. The numerical experiment revealed that soil water evaporation mainly took place at the bottom boundary of and transiently occurred within the DSL. This finding was further verified by [53] from observations at a 60 m × 50 m fallow site (35°58′ N, 140°27′ E) and at a 500 m × 500 m sand dune site (35°32′ N, 134°14′ E), where the soils are dominated by sand particles (0.02 to 2.0 mm in diameter), and by [69] from observations at a 125 m × 125 m bare field (41°59′ N, 93°41′ E), where the soil has a clay loam texture. On the other hand, [68] parameterized and used three PdV models to evaluate influences of depth- versus space-dependent values for soil thermal conductivity (λ) on simulated subsurface evaporations from repacked 15-cm-long sand, silt, and silty clay soil columns. The columns were fully saturated at the beginning of the laboratory experiments and started to become dry either under constant or diurnal atmospheric conditions. Those authors concluded that: (1) the “undetectable zone” (i.e., the layer from soil surface to first sensor needle) can cause underestimation of soil evaporation; (2) a very small (e.g., ≤1.0 mm) grid spacing near the soil surface is needed to capture vaporization/condensation dynamics within the DSL; 3) depth-dependent λ will yield more accurate estimates of subsurface evaporation; and 4) the soil-water retention functions for the sand and silt columns, whose water content tends to approach their residual values at a relatively high pressure head, are better described by the Fayer and Simmon model [81], whereas the soil-water retention function for the silty clay column is better described by the traditional van Genuchten model [82]. Moreover, Novak [22] parameterized and used a PdV model to reproduce the observed EZ dynamics at a bare silt-loam site (49°15′ N, 121°46′ W) for a 10-day rain-free period. This period was preceded by rainy days with a cumulative rainfall of 14.8 mm, yielding wet soil conditions at the beginning of the study period. The traditional Campbell (1974) model was used to describe the soil-water retention function of the site. The unique aspect of this simulation was that the grid resolution is more than adequate to correctly determine the reported location, magnitude, and shape of the subsurface evaporation zone that develops during daytime for many of the days as well as the effects of the evaporation zone on surface energy, soil temperature, and soil moisture.
The objectives of this overview were to: (1) summarize existing findings, and (2) highlight further research needs regarding Phase III soil water evaporation from sandy soils with a top DSL (soil moisture θ < 1% or water potential ψ < −1.5 × 104 cm) most of the time. In other words, this overview focused on field-measured as well as modeled dynamics of DSLs and EZs and their effects on the soil water vaporization-condensation-movement (VCM) process in very dry environments.

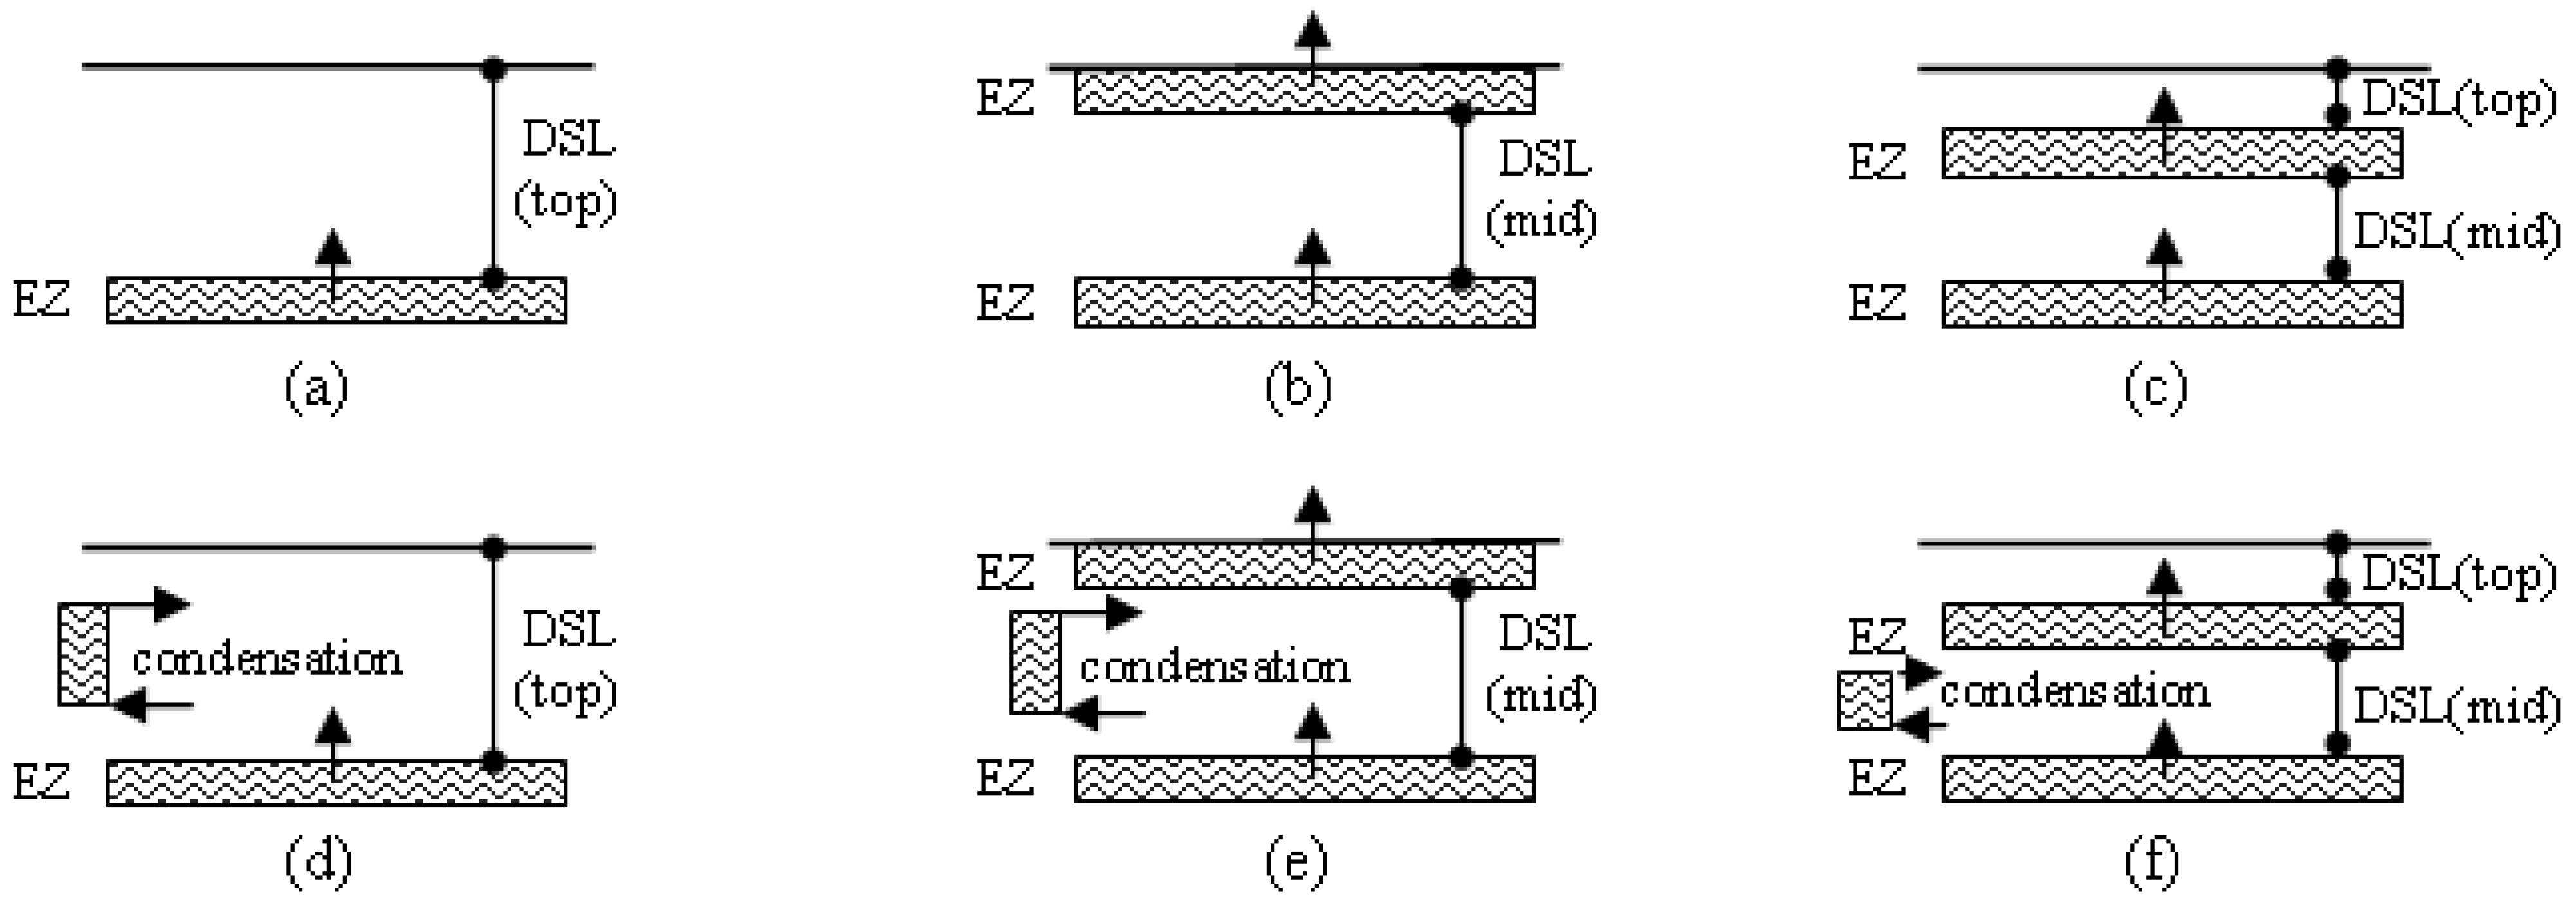
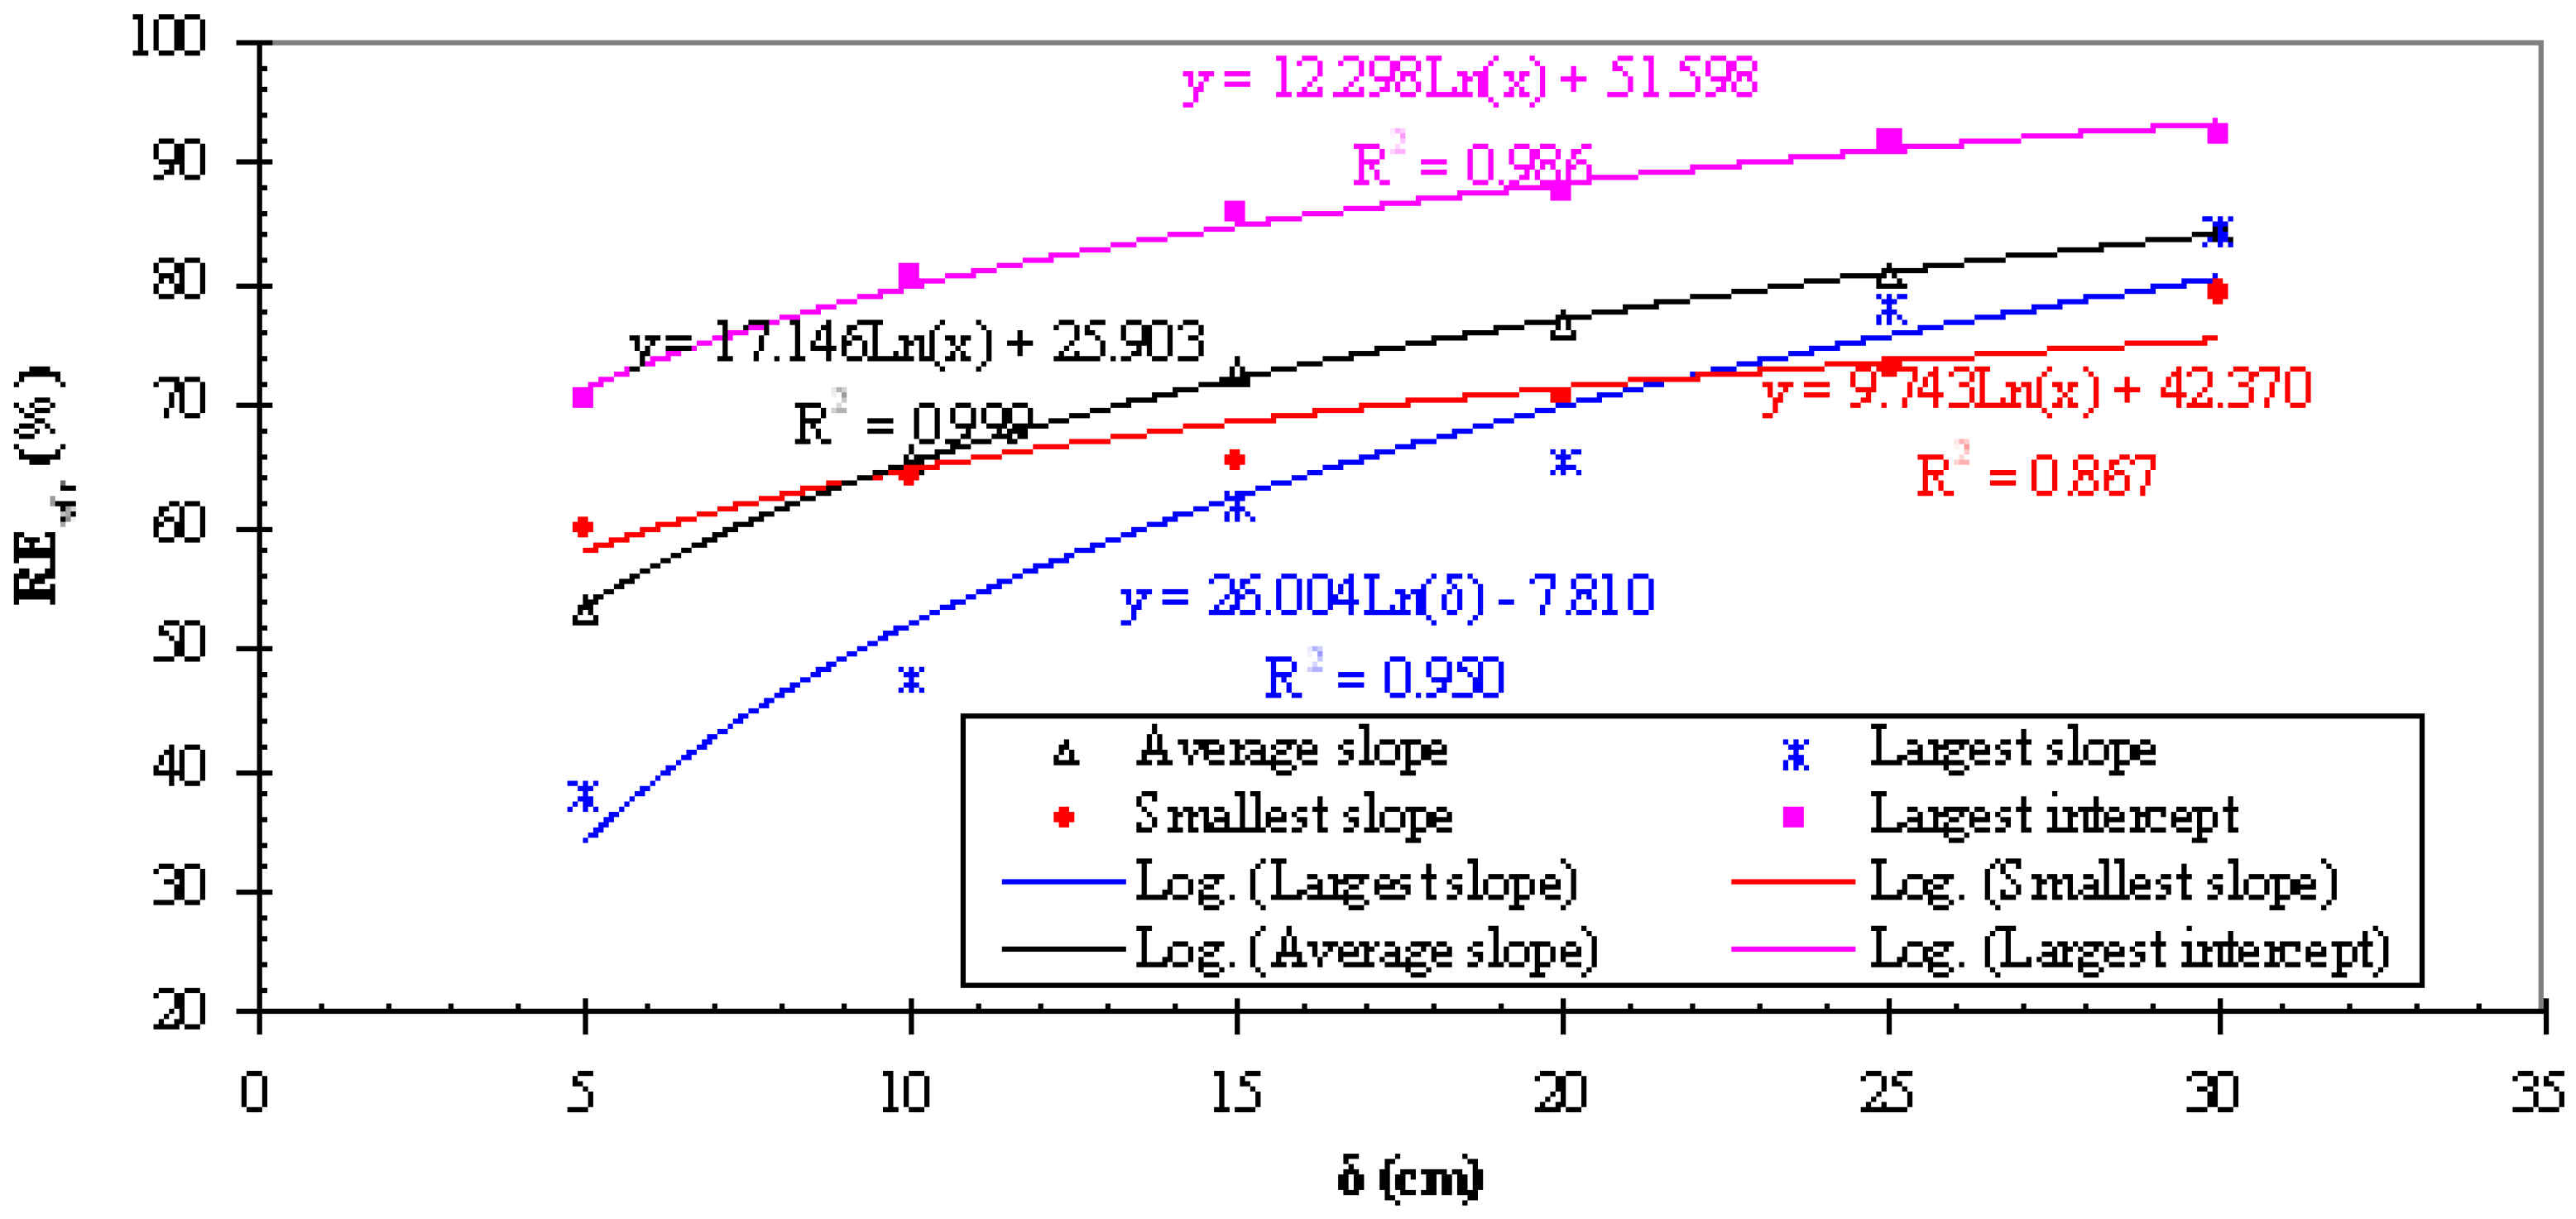
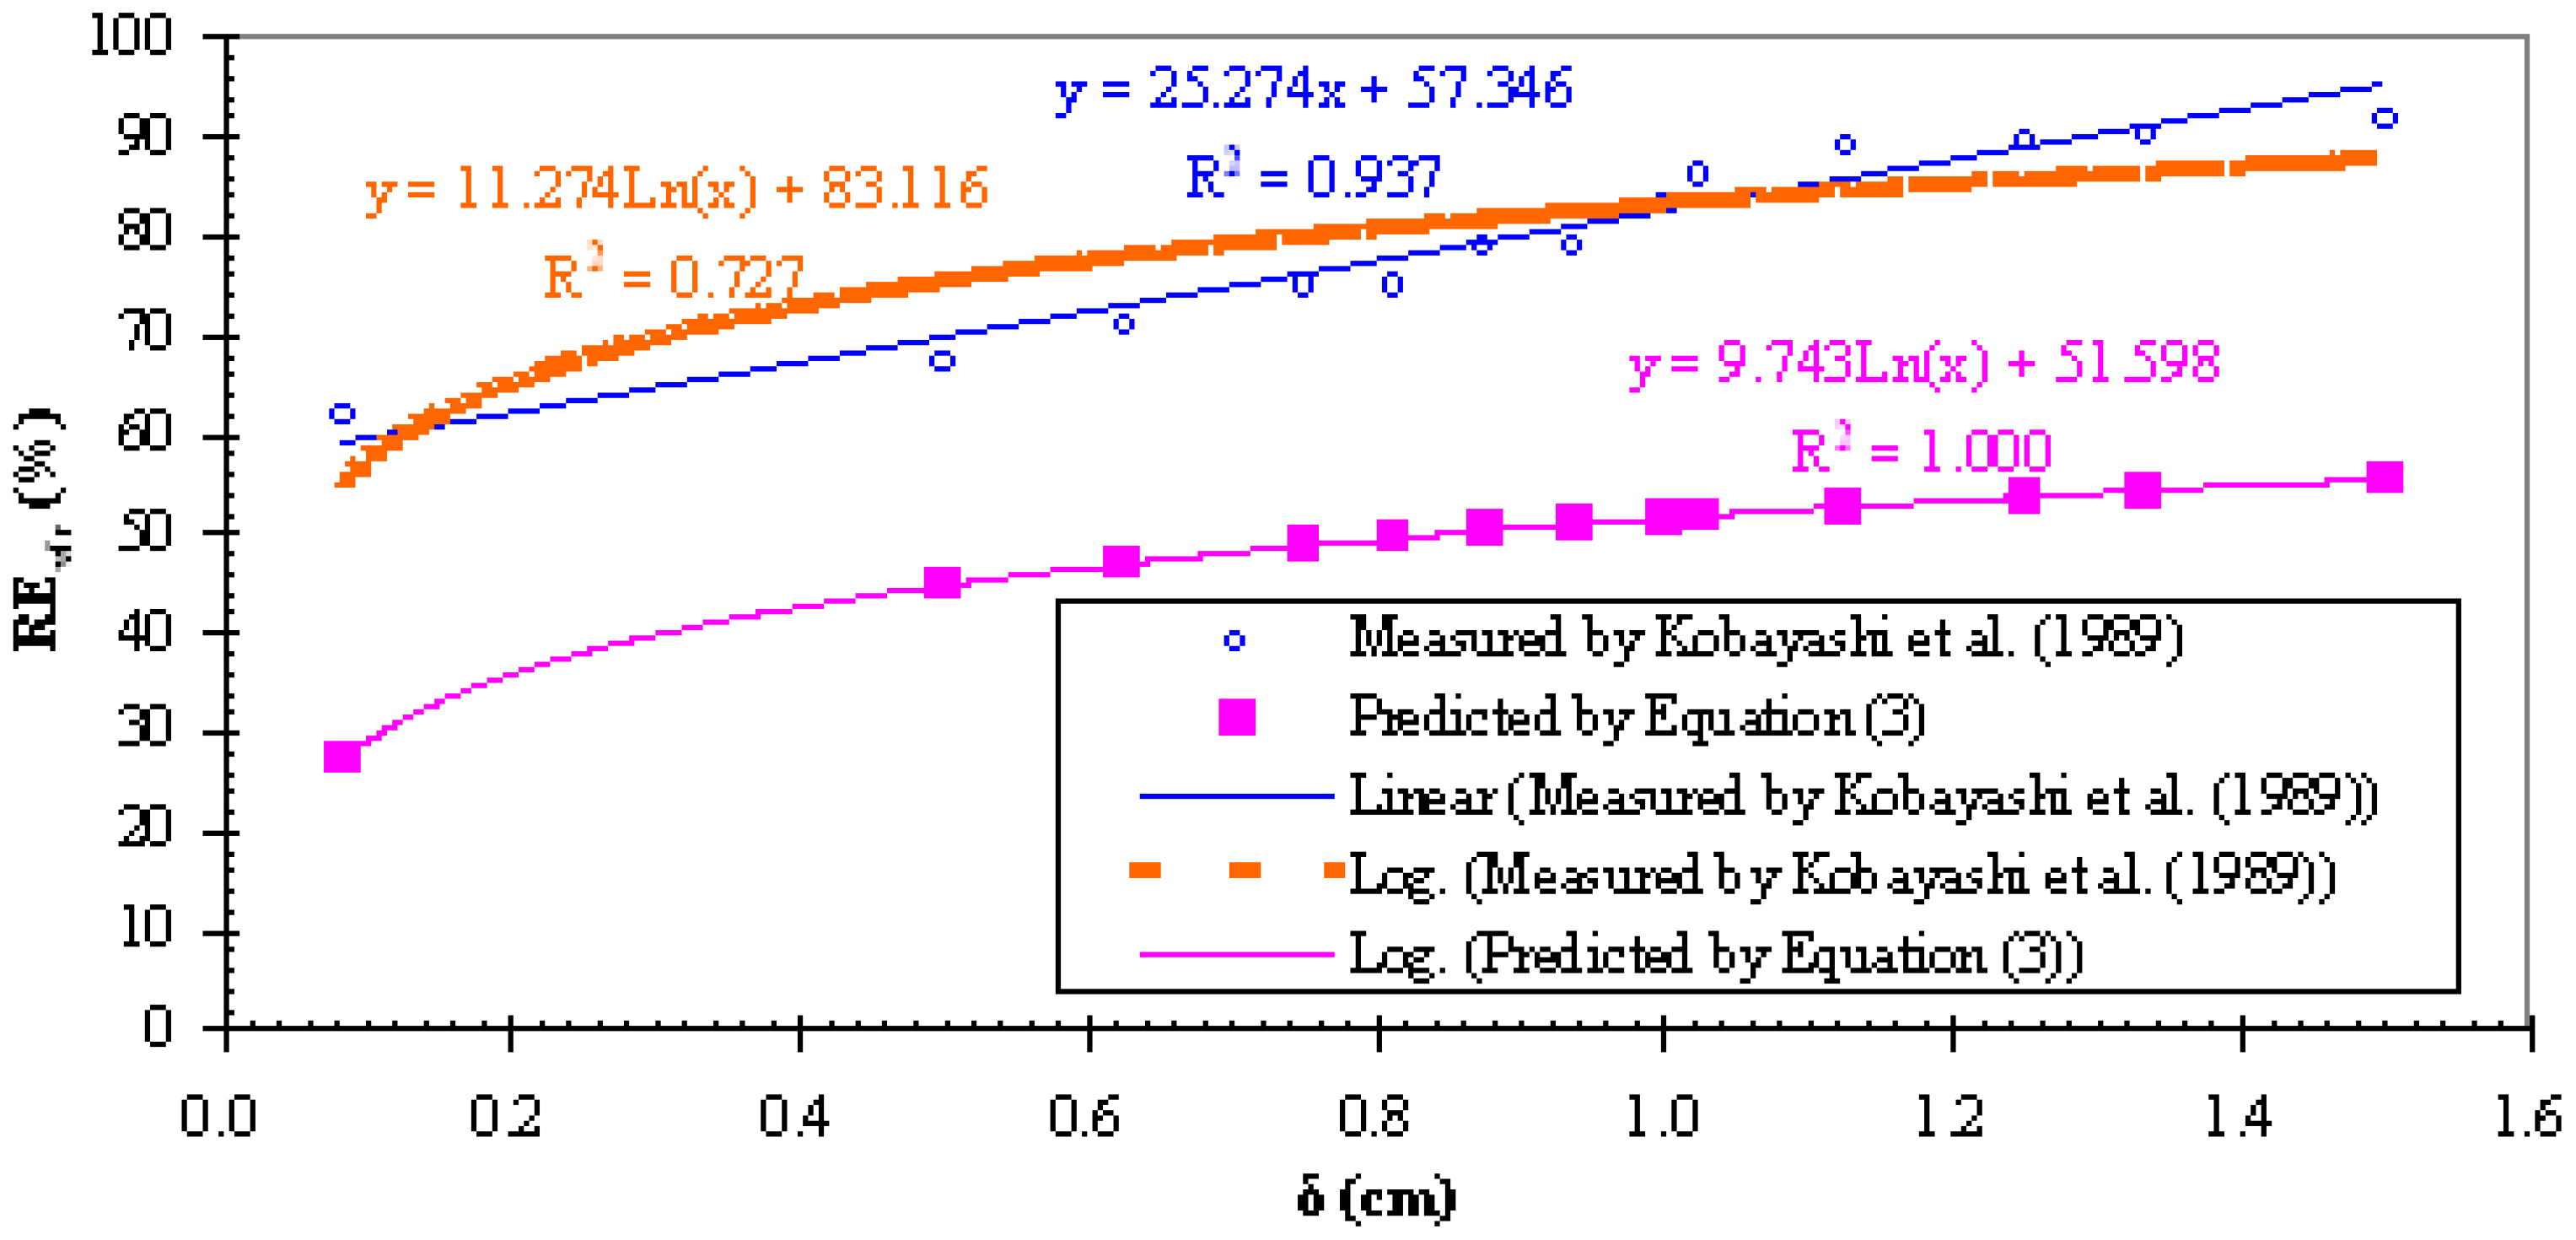
2. Measured VFR Effect

As stated above, although a number of observational studies of soil water evaporation have been presented in existing literature, few of them were conducted at sites with a perennial top DSL and were specifically designed to quantify the VFR effect on the VCM process. Among the few studies, this overview selected six representatives (Table 1), including [26], [28], [36], [53], [83] and [84], to highlight the to-date groundbreaking findings from field measurements all over the world. Herein, these six representative studies were overviewed not in their chronological order, but based on the scientific interrelation among the findings they present. Also, this overview extrapolated the data and findings from these studies to further scrutinize the interrelation.
Table 1. List of the representative studies selected for the overview.
TypeAuthorshipJournalYearDomainSoil TextureProcessUnique Findings*
MeasuringGoss and Madliger [26]Water Resources Research2007fieldSandy claydryingNo clear DSL was formed; traditional soil-water retention functions are not applicable for very dry soils
Liu et al. [28]Arid Land Geography2006fieldDune sanddryingVFR effect increases with thickness (δ) of DSL; when δ > 5 cm, evaporation is independent of climate and soil moisture in EZ.
Wang et al. [36]Arid Zone Research2006fieldDune sanddryingDSLs (θ = 0.42 to 0.54%) of δ = 10 to 18 cm were formed; EZs were at bottom boundaries of the DSLs.
Yamanaka and Yonetani [53]Journal of Hydrology1999fieldsandydryingDSLs (θ < 1%) of δ = 2 to 9 cm were formed; VFR effect increases with δ and should be considered in r s s .
Daamen and Simmonds [84]Water Resources Research1996FieldsandydryingA very thin (< 3 mm) DSL had a VFR effect of 25%.
Kobayashi et al. [83]Journal of Agricultural Meteorology1989columnDune sanddryingDSLs (θ ≤ 0.7%) of δ = 1.5 cm were formed; VFR effect linearly increases with δ.
ModelingSakai et al. [68]Water Resources Research2011columnssand, silt, silty claydryingVFR effect is larger for coarse- than fine-textured soil; DSLs can exist for all soils.
Novak [22]Agricultural and Forest Meteorology2010fieldloamdryingDSL and EZ varied diurnally; both condensation and evaporation occurred within DSL.
Sakai et al. [67]Soil Science Society of America Journal2009columnDune sandwettingTraditional water retention functions are invalid for dry soils; both condensation and evaporation occurred within DSL.
Yamanaka et al. [63]Hydrological Processes1998columnssand, loam, claydryingVery thin EZs were formed beneath DSLs of δ = 2.0 cm; both condensation and evaporation occurred within DSL.
Notes: * DSL: dry soil layer; EZ: evaporation zone; VFR: vapor flow resistance; θ: volumetric soil water content (or soil moisture); and r s s : soil surface resistance.
At a site in the HSL, [28] used PVC microlysimeters (inside diameter 5.7 cm and depths 35 to 60 cm) to measure evaporation from bare sandy soils covered by DSLs with six different thicknesses of 5, 10, 15, 20, 25, and 30 cm. At the same time, a contrasting PVC microlysimeter (inside diameter 5.7 cm and depth 20 cm) was filled with moist soils to measure VFR-free evaporation. Soil water content was measured using the conventional oven-drying method, soil and air temperature using a thermometer, and rainfall using a rain bucket. All measurements were done for a time block of 12 h (7:00 a.m. to 7:00 p.m.) on each of the 11 days from 13 May to 20 August 2005. On each measurement day, soils in the microlysimeters were completely replaced by new soil samples to minimize errors resulting from the micro-recycling of soil water [85]. The measurements indicate that EDSL decreases with the increase of DSL thickness (δ) (Equation (2)) and that REvfr increases with the increase of δ as a logarithmic function (Equation (3)). In the equations, the four positive coefficients have clear physical meanings: a 1 and a 3 reflect influences of soil water and soil thermal properties and the vertical gradient of soil water content, while a 2 and a 4 reflect influences of aerodynamic characteristics.
E D S L = a 1 δ + a 2
R E v f r = a 3 ln ( δ ) + a 4
where δ = 5 to 30 cm; and a 1 , a 2 , a 3 , and a 4 are four positive coefficients.
For the study site, a 1 = 2.383 × 10⁻⁴ to 6.503 × 10⁻⁴ (mean 4.345 × 10⁻⁴ and coefficient of variation Cv = 0.333), a 2 = 0.107 to 0.235 (0.183 and Cv = 0.221), a 3 = 9.743 to 26.004 (mean 17.146 and Cv = 0.285), and a 4 = −7.810 to 51.598 (mean 25.908 and Cv = 0.638), with a large coefficient of determination R2 > 0.85. When δ > 5 cm, EDSL was mainly controlled by the vertical gradient of soil water content and basically independent of the air temperature and soil moisture level in the buried EZ, and REvfr became as high as 92.4% (Figure 2). For a given day, the threshold of DSL thickness, δE→0 in cm, above which soil water evaporation ceases (i.e., REvfr = 100% in Equation (3)), can be estimated as:
δ E 0 = e 100 a 4 a 3
On the 11 measurement days, δE→0 varied from about 38 to 370 cm, with a mean of 106 cm and Cv = 0.90 (Figure 3). Given that the maximum DSL thickness is usually less than 30 cm [26,42,86], the large variation of δE→0 implies that soil water evaporation will always occur in the HSL though the evaporation rate can become very low.
Figure 2. Measured relative vapor flow resistance (VFR) effect (REvfr in Equation (3)) versus thickness (δ) of dry soil layer (DSL) at a site in the Horqin Sandy Land (after [28]).
Water 07 04552 g002
At a sand dune site in the Mu Su Sand Land (MSSL; 108°50′54″ to 108°58′00″ E, 37°38′42″ to 37°42′42″ N), [36] measured soil water content profiles (vertical depth 40 cm using three soil samples at each of the layers 2 cm apart) on the crest, ridge, sunshine side, and shade side of the sand dune for six consecutive days from 1 to 6 May 2004. At the same time, soil and air temperatures were measured using a thermometer, while rainfall was measured using a rain bucket. On a given day, the measurements were made one to three times. The results indicate that the thicknesses of the DSLs on the crest, sunshine side, and shade side were 10, 18, and 12 cm, respectively. However, during the entire measurement period, no DSL was formed at the ridge, where the soils were continuously moistened by water from the surrounding soils by gravity because the ridge has ground elevations lower than its surrounding areas. Those authors did not examine the VFR effects of the DSLs. Using the mean values of a 3 = 17.146 and a 4 = 25.908 in Equation (3), it was determined that REvfr > 65% for the sand dune, with the highest VFR effect of 75.5% on the sunshine side.
Figure 3. Thresholds of thickness of the dry soil layer (DSL), δE→0 in Equation (4), on the 11 measurement days at in the Horqin Sandy Land (after [28]).
Water 07 04552 g003
In a field plot, which has 91% sand (i.e., soil particle diameter 2.0 to 0.05 mm) content and is located at 40 km southeast of Niamey, Niger, [84] measured bare soil water evaporation rate on a half-hourly basis using PVC microlysimeters (inside diameter 16 cm and depth 10 cm). The microlysimeters were filled with undisturbed soil cores extracted randomly within a plot area by pushing them into the soil, excavating, and then sealing them at the bases. Each microlysimeter was mounted in an outsized liner tube in an undisturbed part of the plot and seated on a load cell at the bottom of the liner tube. The output of the load cell is a voltage that is proportional to the weight of the microlysimeter, which was monitored every 5 min and then averaged every half hour to get the soil water evaporation rate with an accuracy of ±0.1 mm·h−1. Net radiation, rainfall, and wet and dry bulb temperatures were continuously monitored at the field plot, and wind speed measurements were taken from an automatic weather station 600 m from the plot. The measurements were made in September 1991 for two days. The results indicate that a 3-mm-thick top DSL was formed with a REvfr ≈ 25%. Such a VFR effect falls in the range (20% to 40%) computed using Equation (3) with a 4 = 51.598 and any valid value for a 3 , indicating that aerodynamic characteristics might play a dominant role in soil water evaporation because of a very thin DSL (3 mm << 5 cm).
Using a transparent acrylic resin tube (inside diameter 5 cm and depth 5 cm) that was filled with repacked soils from the Japanese Tottori Sand Dune (134°14′ E, 35°32′ N), [83] measured the soil water evaporation rate and DSL thickness for 46 consecutive hours. The tube was placed in a chamber where the climate condition was maintained to be invariant: temperature 30 °C, relative humidity 60%, irradiance induced by 30,000 LX metalhalide lamps, and 0.5 m·s−1 horizontal wind provided by fans. The temperatures on the top and bottom surfaces of the column were measured using thermister thermometers at an interval of one hour. The measured REvfr tended to increase with δ by following a linear function (R2 = 0.937) better than a logarithmic function (R2 = 0.727) (Figure 4). For a given value of δ, the measured REvfr was much larger than that predicted by Equation (3) regardless of values for a 3 and a 4 . One possible reason is that Equation (3) is based on field measurements for 5 cm ≤ δ ≤ 30 cm, which is not unlikely questionable for column-based measurements for δ ≤ 1.5 cm. Another possible reason is that the climate condition in the experimental tube is much more favorable for evaporation than any realistic climate condition. Such a timely invariant climate condition might minimize aerodynamic resistance, leading to a positive linear relationship between REvfr and δ.
At one 60 m × 50 m fallow site (140°27′ E, 35°58′ N) and another 500 m × 500 m dune site (134°14′ E, 35°32′ N) located in Japan, [53] measured soil water evaporation and DSL thickness in July or August 1996. Both sites are dominated by sand particles (>70%) and have very low clay content (<10%). The soil moistures within two layers of 0 to 1 cm (θ0→1) and 0 to 5 cm (θ0→5) were measured using the conventional oven-drying method, while the bottom boundary of the DSL was visually distinguished by the contrast of color and δ was measured using a caliper. The measurements were made at noon every day and/or every 4 h on an intensive observation day. Factors on climate (i.e., radiation, air temperature, wind speed, humidity, and rainfall) and soil (i.e., temperature and heat flux) were measured using sensors at a time interval of 5 min and then averaged every hour for analysis. For the fallow site, δ approached 2 cm while θ0→1 and θ0→5 decreased to 1.25% and 8.75%, respectively, whereas for the dune site, δ approached 9 cm while both θ0→1 and θ0→5 decreased to <1.0%. Because those authors did not measure EnoDSL, it is impossible to directly determine REvfr as defined in Equation (1). Instead, r s s was computed by those authors as a function of θ0→1 without taking into account δ. The computed r s s tends to decrease with the increase of θ0→1 and the decrease of δ, indicating its generic reasonability; a hysteresis loop, however, is clearly presented, indicating limitations of conventional r s s formulas. Nevertheless, the results reveal that in dry sandy soils, liquid water transport from deeper soil layers stopped at the bottom boundary of the DSL and vapor water transport was dominant in the DSL, and that VFR effect increased with DSL thickness.
Figure 4. Measured and predicted relative vapor flow resistance (VFR) effect (REvfr in Equation (3)) versus thickness (δ) of the dry soil layer (DSL) for a 5-cm-long repacked columm of the Japanese Tottori dune sand soil (after [83]).
Water 07 04552 g004
In contrast to the above five studies, [26] measured soil water transport from 5 July to 18 October 2005 at a Tanzania site (37°38′ E, 6°51′ S). The fine-textured soil is classified as sandy clay (49% sand, 4% silt, and 47% clay) and thus may have different soil-water properties from the sandy soils of the other five studies. Using Rotronic Hygroclip SC05 sensors with a diameter of 5 mm (Retronic AG, Bassersdorf, Switzerland, http://www.rotronic.com), those authors measured soil pore air relative humidity and soil temperatures at depths until 70 cm, and then analyzed the soil-water retention function and the dynamics of soil water evaporation. The results indicate that the retention function could not be satisfactorily described by traditional van Genuchten (1980) and similar models, and that pore air relative humidity depended on soil temperature, which violates the basic assumption of the PdV model. This is because the study soil had a water potential ψ < −1.5 × 104 cm, when the movement of adsorbed water films dominated the flow in water-filled capillaries. However, unlike the findings of the other five studies, the results do not indicate a clear DSL: the layer, within which evaporation occurred, was confined to the first 1.5 cm and did not progress much further. Those authors attributed such an inconsistency to the fact that the other five studies were based on “either wrong premises or insufficient and inconclusive experimental data” and claimed that their data are the only ones reported so far that allow a clear distinction of the transition between liquid water and water vapor transport. In my view, the inconsistency is likely due to distinctly different soil-water properties of fine- versus coarse-textured soils. Because the capillary action is much stronger in fine- rather than coarse-textured soils, for the sandy clay soils at the Tanzania site, the evaporated water from the top 1.5 cm EZ could be effectively recharged by capillary water from deeper soil layers and only little water was taken from the water storage in the EZ itself, whereas for the sandy soils at the sites in the HSL, MSSL, Niger, and Japan, a lower EZ was produced by the stopping of liquid water movement at the bottom boundary of the DSL and vapor water transport was dominant in the DSL. As revealed by the measurements, when ψ < −1.5 × 104 cm, for the Tanzanian sandy clay soils, the unsaturated water conductivity is five orders of magnitude higher than the responding representative literature values, while for the sandy soils, the magnitudes of unsaturated water conductivity and vapor conductivity below the bottom boundary of the DSL are much lower and those above the DSL are much higher than the responding representative literature values.
The preliminary field measurements support the DSL and EZ dynamics illustrated in Figure 1 for sandy soils but not for sandy clay soils in very dry environments. This was hypothesized by [63]. For sandy (coarse-textured) soils, the VFR effect on the soil water evaporation rate increases with the thickness (δ) of the DSL as a linear function when δ < 5 cm but as a logarithmic function when δ ≥ 5 cm. The VFR effect depends on both aerodynamic characteristics (e.g., wind speed) and soil water/thermal properties (e.g., vertical gradients of water content and temperature), with the former being more dominant than the latter when δ < 5 cm but the latter becoming more dominant than the former when δ ≥ 5 cm. In contrast, for sandy clay (fine-textured) soils, because of a strong capillary action and a not-much-lowered unsaturated water conductivity of the top layer at very large water potential (i.e., ψ < −1.5 × 104 cm), a DSL will not be efficiently formed as a result of water recharge from deeper soil layers. Although formed under long-lasting dry climate conditions, such a DSL may be very thin and have a very small VFR effect on soil water evaporation. To date, no measurement has been reported regarding the dynamics and VFR effect of multiple DSLs resulting from repeated drying-wetting cycles.

3. Modeled VFR Effect

As with field measurement studies, although a number of modeling studies of soil water evaporation have been reported in existing literature, few of them focused on Phase III evaporation in very dry environments. Among the few studies, this overview selected four representatives (Table 1), including [22], [63], [67] and [68], to analyze advances and challenges in modeling Phase III soil water evaporation. Again, these representatives were overviewed in chronological order to highlight the continuous improvements of modeling techniques.
As stated above, primary modeling studies are based on the PdV model expressed as [21]:
{ ( θ w + θ v ) t = ( q w + q v ) z = z [ K L ψ ( ψ z + 1 ) + K L T T z + K v ψ ψ z + K v T T z ] S h t = q h z = z [ λ T z C w ( T T r ) q w C v ( T T r ) q v L q v ] S h = ( C s θ s + C w θ w + C v θ v ) ( T T r ) + L θ v
where z is the depth from the soil surface and is negative below the surface (m); t is the time (s); θw is the volumetric liquid water content (m3·m−3); θv is the volumetric water vapor content (expressed as an equivalent volumetric water content = θ air ρ v ρ w m3·m−3); qw and qv are the fluxes (positive upward) of liquid water and water vapor (expressed as equivalent liquid water) per unit horizontal-area soil (m·s−1), respectively; θair is the volumetric air content (m3·m−3); ρv and ρw are the densities of water vapor and liquid water (kg·m−3), respectively; ψ is the water potential (m); K (m·s−1) and KLT (m2·°C·s−1) are the isothermal and thermal liquid water hydraulic conductivities, respectively; K (m·s−1) and KvT (m2·°C·s−1) are the isothermal and thermal vapor hydraulic conductivities, respectively. Sh is the soil heat storage (J·m−3); qh is the total soil heat flux (J·m−2·s−1); λ is the soil thermal conductivity (W·m−1·°C−1); Tr is an arbitrary reference temperature below which qw and qv contribute no heat flux (°C); Cw (=4.18 MJ·m−3·°C−1) and Cv (=1.8 MJ·m−3·°C−1) are the volumetric heat capacities of liquid water and water vapor, respectively; Cs (=1.92·MJ m−3·°C−1) is the volumetric heat capacity of soil particles; θs is the volumetric solid content (m3·m−3); and L is the latent heat of vaporization of water (J·m−3).
The evaporation (positive) or condensation (negative) rate between the soil surface and atmosphere, E s f t (m·s−1), can be computed as:
E s f t = q w ( 0 , t ) + q v ( 0 , t )
The depth-dependent evaporation/condensation rate, e (s−1), can be determined by solving the mass conservation equation expressed as [87]:
θ v t = q v z + e
For a discretized grid with thickness of Δz, the average evaporation/condensation rate from this grid within a time interval of Δt, E i t (m·s−1), can be approximated as:
E i t = ( θ v , i t θ v , i t 1 ) Δ z Δ t + ( q v , i + 1 / 2 t 1 / 2 q v , i 1 / 2 t 1 / 2 )
where θ v , i t and θ v , i t 1 are the volumetric water vapor contents (expressed as equivalent water contents, m3·m−3) within the grid at current and previous time steps, respectively; and q v , i + 1 / 2 t 1 / 2 and q v , i 1 / 2 t 1 / 2 are the Δt-averaged fluxes of water vapor (expressed as equivalent liquid water fluxes, m·s−1) at the lower and upper faces of the grid.
Yamanaka et al. [63] set up finite-element PdV models for three 60-cm-long columns of fine sand, loam, and clay soils, and solved the models by the Crank-Nicholson implicit method [88] with Gauss elimination. The elements have a thickness from 0.5 mm near the surface to 10 cm at lower depths. Although sensors were used to continuously measure soil moisture, soil temperature, and pore-air humidity at various depths in the field from which the fine sand soil column was taken, the models used hypothetical evaporative flux and net radiation (either constant or diurnal) as the upper boundary condition. The lower boundary condition was specified as a constant temperature and no water flux. The models neglected K LT T z and C w ( T T r ) q w in Equation (5) and did not consider the enhancement factor for KvT [89,90]. The traditional van Genuchten [82] soil-water retention function was used and the unsaturated liquid water hydraulic conductivity, K, was derived by substituting the retention function into the Mualem model [91], which might be invalid in cases of low water content, as evidenced by [26]. The results show that evaporation actually took place within a very thin (<2 mm) EZ located at the bottom boundary of the 2.0-cm-thick DSL, and that condensation and evaporation occurred in the DSL during the nighttime and daytime, respectively. However, the VFR effects were not reported and could not be estimated because the responding evaporation rate without the DSL was not predicted.
Sakai et al. [67] set up a PdV model for six identical dune sand (90% of soil particles > 0.1 mm and 3% of soil particles < 0.02 mm) columns (height 10 cm and diameter 10 cm) using the HYDRUS-1D code [92], and used the model to reproduce the measured condensation dynamics. In the laboratory experiment, the tops of the columns were exposed to hot (37 °C) and moist air, while the closed bottoms of the columns were maintained at 20 °C by circulating constant-temperature water along the base of the columns using a water pump. The model used finite elements of 1 mm thickness and uniform initial soil moisture of 0.45% for all elements. The upper boundary condition was specified as the measured weight change of the entire column, while the lower boundary condition was specified as being no-flux. The soil-water retention function of Fayer and Simmons [81], parameterized using measured (ψ, θ) data until ψ = −1.0 × 104 cm, was used in the model. The unsaturated liquid water hydraulic conductivity, K, was derived by substituting the parameterized retention function into the Mualem model [91]. The results indicate that the model simulation performance was sensitive to K, which is shaped by the pore-connectivity coefficient, and KvT, which is shaped by the enhancement factor. This implies that a soil-water retention function for low water potentials (e.g., ψ < −1.5 × 104 cm) is crucial for modeling VCM dynamics within very dry sandy soils, while it is still unknown whether the Fayer-Simmons function is valid when ψ < −1.5 × 104 cm. Nevertheless, the model fairly reproduced the observed VCM dynamics that: (1) water vapor entered the soil column from the hot top surface and condensed at the cold bottom; (2) liquid water moved upward and evaporated at the moisture front in the middle of the column; (3) liquid water and water vapor then circulated between the bottom and the moisture front; and (4) increases in liquid water flow (and the evaporation rate) were compensated by increases in vapor water flow (and the condensation rate).
Novak et al. [22] set up a finite-element PdV model and solved the model using MATLAB® scripts for a Canadian bare field with dominant soils of silt loam (121°46′ W, 49°15′ N). The one-dimensional soil domain extends from z = 0 to 4 m, with an element thickness increasing logarithmically from 6.9 × 10⁻⁷ m at the soil surface to 0.025 m at the bottom of the domain. The model neglected water vapor storage (i.e., assumed θv = 0 in Equation (5)), which might be problematic for modeling vapor diffusion dynamics within the DSL. The traditional Campbell (1974) soil-water retention function and equations of unsaturated hydraulic conductivities for liquid water and water vapor were used. For a 10-day simulation period, the upper boundary condition was specified as the observed time series of water flux from the soil surface into the atmosphere and radiation, while the lower boundary condition was specified as zero gradients of water potential and temperature. The model was calibrated by adjusting saturated liquid water hydraulic conductivity to closely match the observed time series of soil temperature and soil moisture at various depths. The relatively large simulation errors for later simulation days were attributed to the fact that the model used vertically homogeneous soil hydraulic and thermal properties and/or assumed θv = 0. The results clearly indicate VCM diurnal variations and steadily decreasing peak evaporation rates (16 to 5 mm·d−1) with the lapse of days. For a given simulation day, the evaporation rates varied from zero to a peak value. On some days, evaporation solely occurred at the soil surface because the condensed water in the early morning and/or the previous night rewetted the surface soils, while on the last two simulation days, a top DSL (δ = 0.2 cm) always existed and evaporation solely occurred at the bottom boundary of the DSL. However, the VFR effect was not reported by that author, and it could not be estimated because the responding evaporation rates without the DSL were not presented either.
Sakai et al. [67] set up PdV models for three 15-cm-long sand, silt, and silty clay soil columns and another 20-cm-long silt soil column using the HYDRUS-1D code with a grid spacing of less than 1.0 mm. A hypothetical constant or diurnal climate was used as the upper boundary condition, while zero water flux and a constant temperature of 25 °C were used as the lower boundary condition. The models used traditional van Genuchten [82] and Fayer and Simmons [81] soil-water retention functions and the unsaturated hydraulic conductivities for liquid water and water vapor were estimated with the Mualem [91] pore-size distribution model for the retention functions, and λ was estimated by an empirical equation presented by Chung and Horton [93]. The models reveal that the EZ was at the soil surface in the beginning of the simulation but moved down to deeper depths with drying, and that regardless of the climates, the EZ of the silty clay soil column remained at the soil surface much longer in time than the EZs of the other two coarse-textured soil columns. In terms of the simulation results of using the constant climate, the top DSLs for the sand, silt, and silty clay soil columns reached maximum thicknesses of 0.3, 0.2, and 0.15 cm, respectively, with the responding VFR effects of 50%, 47%, and 7%, respectively. This is consistent with the finding of [26] that fine-textured soils tend to have a much thinner DSL with a smaller VFR effect on soil water evaporation. Nevertheless, as with the measurement study conducted by [83] (Figure 4), the hypothetical constant climate might be favorable for soil water evaporation, leading to the large VFR effects for not-very-large δ values. Also, because the traditional soil-water retention functions and the empirical equation for λ may become invalid when a DSL appears [26], the simulated soil water evaporation rates and VFR effects are likely uncertain in accuracy.
The primary modeling studies were used to reproduce VCM dynamics observed in laboratory soil columns, but none of them was specifically designed to quantify the VFR effect of the DSL on soil water evaporation. For this reason and because the models were driven either by artificial or hypothetical atmospheric conditions, it is unknown at what degree the modeling results can reflect situations of the real world. In addition, because the models used traditional soil-water retention functions that are probably invalid for very dry soils, as evidenced by some observations [26], and had a short simulation period covering either the drying or wetting process but not both, the modeling results are mainly for Phase I and II evaporations or, at most, the early stage of Phase III evaporation, as indicated by the fact that the modeled DSLs of the drying process have a thickness of δ ≤ 2.0 cm and soil moisture of θ > 2%. Further, the models used empirical equations (e.g., Chung and Horton [93]) for λ, which might cause large calculation errors of heat balance at the moisture front. As a result, the predicted dynamics of DSLs and EZs can be irreconcilable. Nevertheless, as with the measurement studies, the modeling studies also affirm the conceptual soil water evaporation dynamics illustrated in Figure 1.

4. Further Research Needs

Although prominent efforts have been made to understand soil water evaporation, the physics of dry soil and its function in evaporation is a challenging topic with significant remaining issues because of the lack of continuous observations with sufficiently high spatiotemporal resolutions to capture soil water VCM dynamics within very dry soils and to establish hydraulic functions that are applicable for ψ < −1.5 × 104 cm. In order to address such issues, further research will be needed in the following four aspects.
Firstly, field measurements need to be conducted to generate long-term high-resolution observations of soil water content, water potential, soil temperature, and relative humidity in pore air of in situ bare sandy soils, where Phase III evaporation is usually dominant. In this regard, typical experimental sites should be instrumented using sensors to simultaneously observe data on climate as well as soil water and soil thermal properties. Beside existing sensors, a high-resolution heat pulse sensor (HRHPS) with a needle spacing of ≤1 mm is currently not available, and it needs to be designed and fabricated to minimize errors resulting from “undetectable zone” [68]. Such a HRHPS will make it possible to: (1) continuously observe dynamics of DSLs and EZs resulting from drying-wetting cycles; and (2) capture sharp gradients of soil water and soil thermal properties within DSLs and at DSL-EZ interfaces. The 11-needle (stainless steel) heat pulse sensor proposed by [70] may have some potential, but its current design is not unproblematic and has not been tested for dry sandy soils.
Secondly, hydraulic functions for very dry sandy soils (ψ < −1.5 × 104 cm) need to be developed. As revealed by previous studies (e.g., [26]), the traditional soil water retention functions, developed by Brooks and Corey [94], Campbell [95], van Genuchten [82], Fayer and Simmon [81], and Lambot et al. [96], are applicable for unsaturated soils with a water potential of ψ > −1.5 × 104 cm. However, it is unknown and questionable whether those functions are applicable for very dry soils when Phase III evaporation is dominant. The long-term high-resolution observations will provide an opportunity to develop soil water retention functions that are applicable for different ranges of soil moisture. These retention functions in turn can be used in the Burdine [97] and/or Mualem [91] models to develop liquid water and water vapor hydraulic conductivity functions for very dry sandy soils.
Thirdly, an approach needs to be established to quantify dynamics of DSLs and EZs resulting from wetting-drying cycles as well as the VFR effect of DSLs. As illustrated in Figure 1, at a given time, a soil profile can have multiple DSLs and EZs with various thicknesses and vertical positions. During continuous drying, the top DSL will become thicker and its bottom dry front will be moved down, whereas during continuous wetting, an EZ may be formed at the soil surface and its bottom wet front will be moved down. If a top DSL already exists when wetting starts, the subsequent drying-wetting cycles can result in a striped distribution of DSLs and EZs, with an EZ beneath a DSL and vice versa. Moreover, within a DSL, isolated/patched evaporation pores can be formed from condensation of vapor [23] that diffuses into the DSL from its adjacent DSLs and/or EZs. To date, little is known about these dynamics, their influential factors, and their influences on soil water evaporation rate [27]. Our intuitive knowledge or insight is that the top DSL plays a larger role in retarding soil water loss to the ambient atmosphere than the buried DSLs that are either beneath an EZ or have patched evaporation pores. However, because these buried DSLs have a reduced heat storage capacity [98] and a lowered thermal conductivity [99,100,101], they can still exert resistances of varying degrees to vapor diffusion. Herein, such an approach can be established by analyzing the long-term high-resolution observations and simulations of VCM dynamics within in situ dry sandy soils.
Finally, a set of empirical coefficients, which can be used to correct r s s to consider the lumped effect of DSLs and EZLs on soil water evaporation, need to be created. Given the simplicity and popularity of r s s in using conventional evaporation models, such as Penman-Monteith [29,30,102] and Shuttleworth-Wallace [31], the creation of such empirical coefficients is expected to noticeably increase the accuracy of those evaporation models in predicting soil water evaporation in arid environments. The existing formulas define r s s as a function of latent heat flux from top soil layer (LEs), but such a function can become invalid for Phase III because within the top DSL almost no vaporization occurs and LEs may be negligible. However, practical applications (e.g., [103,104]) of those r s s formulas assumed that soil water vaporization solely occurs within the top soil layer, and they computed LEs as a function of total soil evaporation, leading to the overestimation of LEs due to the underestimation of r s s . A correction to r s s by the newly developed empirical coefficients will make it handy to take into account DSL VFR effects and EZ enhancement effects with no requirement to know details of DSL and EZ dynamics resulting from repeated wetting-drying cycles, maintaining the simplicity of the models. With this regard, [38] proposed (conceptually without any observational basis) a linear functional relation (Equation (9)) between r s s and δ by assuming a maximum DSL thickness of δmax <0.3 cm, which is consistent with the observations of [83]. It was found that the δ-based r s s noticeably improved the performance of the CLM in simulating evaporation in accordance with the FLUXNET-MTE (Model Tree Ensemble) data [105] and total water storage in accordance with the GRACE (Gravity Recovery and Climate Experiment) observations [106]. Because this relation is currently unique and may be a good start for developing generic correction coefficients, it is reproduced herein as:
r s s = δ D v τ
where r s s is the soil surface resistance to evaporation (s·m−1); δ is the thickness of the DSL (m); Dv is the molecular diffusivity of water vapor in air (m2·s−1); and τ is the tortuosity factor of vapor flow paths through the soil matrix (–).
δ is estimated as:
δ = { δ max θ D S L θ 0 θ D S L θ a i r θ 0 < θ D S L 0 θ 0 θ D S L
where δmax is the theoretical maximum DSL thickness (m); θDSL is the soil moisture below which the soil is defined as DSL; θ0 is the surface soil moisture; and θair is the air-dry soil moisture.
θair is estimated as:
θ a i r = θ s a t ( ψ s a t ψ a i r ) 1 b
where θsat is the saturated soil moisture; ψsat is the water potential at θsat; ψair (=106 cm) is the water potential at θair; and b is the pore size distribution index [107].
Dv is computed as:
D v = 2.12 ( T 273.15 ) 2
where T is the soil surface temperature (K).
τ is computed as:
τ = ( θ s a t θ a i r ) 2 b + 3 b ( θ s a t ) 3 b

5. Conclusions

This overview summarized the to-date advances in quantifying the VFR effect of the DSL on the soil water evaporation rate in very dry environments. Both measurement and modeling studies affirm the conceptual dynamics of DSLs and EZs resulting from either the drying or wetting process. On the one hand, because of the advancement of sensor technologies, measurement studies have shifted the focus from laboratory experiments to field observations. Although most of the studies traced temporal variations of the vertical soil moisture profile (i.e., VCM dynamics), few of them have been specifically designed to measure the VFR effect. The preliminary observations indicate that the VFR effect tends to linearly increase with DSL thickness (δ) when δ < 5 cm and is likely to increase as a logarithmic function of δ when δ ≥ 5 cm. For coarse-textured (e.g., sandy) soils covered by a DSL with δ ≥ 5 cm, the VFR effect can become so large that the soil water evaporation rate will be almost independent of climatic conditions as well as the soil moisture level of the EZ positioned at the bottom boundary of the DSL. In contrast, for fine-textured (e.g., sandy clay) soils, a thick DSL usually cannot be formed while a very thin (<1.5 cm) DSL may exist. On the other hand, extensive modeling studies have been conducted in terms of the PdV model. For unknown reasons, primary modeling studies were designed to reproduce observed VCM dynamics in laboratory columns rather than in in situ soils, and thus it is unknown at what degree the modeling results can reflect situations of the real world. Also, the use of traditional hydraulic functions by the modeling studies is unlikely to be unproblematic for very dry soils.
Based on this overview, further research will need to: (1) generate long-term high-resolution field observations of Phase III evaporation during repeated wetting-drying cycles; (2) develop hydraulic functions for very dry sandy soils; (3) establish an approach to quantify dynamics of DSLs and EZs resulting from repeated wetting-drying cycles as well as the VFR effect of DSLs; and (4) enable empirical equations of soil surface resistance ( r s s ) to take into account the VFR effect of the DSL in the simplest way, as demonstrated by [38], to improve the accuracy of conventional models (e.g., Penman-Monteith) in predicting soil water evaporation in very dry environments.

Acknowledgments

This overview was financially supported by the following contracts: the National Natural Science Foundation of China (NSFC) Basic Research Program (No. 51139002); the Ministry of Education Innovative Research Team (No. IRT13069); the Chinese Ministry of Science and Technology (No. 2010DFA71460); the Inner Mongolia Autonomous Region Science and Technology Bureau’s Major Basic Research Open Project for Oversea Excellent Scholars (No. 206202057 and its extension); the international collaboration agreement (No. 5CEC3) between Old Dominion University (ODU) and Inner Mongolia Agricultural University (IMAU); and a research project of the Inner Mongolia Autonomous Region Water Resources Department. Also, this overview was supported by the 2014 Faculty Proposal Preparation Program (FP3-2014) at ODU.

Conflicts of Interest

The author declares no conflict of interest.

References

  1. Daamen, C.C.; Simmonds, L.P.; Wallace, J.S.; Laryea, K.B.; Sivakumar, M.V.K. Use of microlysimeters to measure evaporation from sandy soils. Agric. For. Meteorol. 1993, 65, 159–173. [Google Scholar] [CrossRef]
  2. Henwood, W. The world’s temperate grasslands: A beleaguered biome. Parks 1998, 8, 1–2. [Google Scholar]
  3. Wang, X.; Melesse, A.M.; Yang, W. Influences of potential evapotranspiration estimation methods on SWAT’s hydrologic simulation in a northwestern Minnesota watershed. Transa. ASABE 2006, 49, 1755–1771. [Google Scholar] [CrossRef]
  4. Zhao, H.; Yi, X.; Zhou, R.; Zhao, X.; Zhang, T.; Drake, S. Wind erosion and sand accumulation effects on soil properties in Horqin Sandy Farmland, Inner Mongolia. Catena 2006, 65, 71–79. [Google Scholar] [CrossRef]
  5. Zhai, C.; Ma, J.; Li, Y. Soil evaporation of aeolian sandy soil in Gurbantunggut Desert. Arid Land Geogr. 2007, 30.006, 805–811. [Google Scholar]
  6. Wang, X.; Shang, S.; Yang, W.; Clary, C.R.; Yang, D. Simulation of land use-soil interactive effects on water and sediment yields at watershed scale. Ecol. Eng. 2010, 36, 328–344. [Google Scholar] [CrossRef]
  7. Duan, L.; Liu, T.; Wang, X.; Wang, G.; Ma, L.; Luo, Y. Spatio-temporal variations in soil moisture and physicochemical properties of a typical semiarid sand-meadow-desert landscape as influenced by land use. Hydrol. Earth Syst. Sci. 2011, 15, 1865–1877. [Google Scholar] [CrossRef]
  8. Wang, Z. Strategic considerations for the protection of grassland ecosystems in China. Grassl. China 2005, 27, 1–2. (In Chinese) [Google Scholar]
  9. He, S.; Qiu, L.; Jiang, D.; Lamusa, A.; Liu, Z.; Luo, Y. Sandfixing effects of Caragana microphylla shrub in Horqin Sandy. Front. For. China 2008, 3, 31–35. (in Chinese). [Google Scholar] [CrossRef]
  10. Wang, X.; Chen, F.; Hasi, E.; Li, J. Desertification in China: An assessment. Earth Sci. Rev. 2008, 88, 188–206. [Google Scholar] [CrossRef]
  11. Zhao, H.; Zhao, X.; Zhang, T.; Wu, W. (Eds.) Desertification Processes and Its Restoration Mechanisms in the Horqin Sand Land; China Ocean Press: Beijing, China, 2004.
  12. Zuo, X.; Zhao, X.; Zhang, T.; Guo, Y.; Wang, S.; Drake, S. Spatial pattern and heterogeneity of soil properties in sand dune under grazing and restoration in Horqin Sandy Land, Northern China. Soil Tillage Res. 2008, 99, 202–212. [Google Scholar] [CrossRef]
  13. Christensen, L.; Shauna, B.; Coughenour, M.B. Integrated assessment of the dynamics, stability and resilience of the Inner Mongolian grazing ecosystems. Nomadic Peoples 2005, 9, 131–145. [Google Scholar] [CrossRef]
  14. Rooyen, A.F.V. Combating desertification in the southern Kalahari: Connecting science with community action in South Africa. J. Arid Environ. 1998, 39, 285–297. [Google Scholar] [CrossRef]
  15. Dey, S.; Tripathi, S.N.; Singh, R.P.; Holben, B.N. Influence of dust storms on the aerosol optical properties over the Indo-Gangetic basin. J. Geophys. Res. Atmos. 2004, 109, D20211. [Google Scholar] [CrossRef]
  16. Portnov, B.A.; Safrielb, U.N. Combating desertification in the Negev: Dryland agriculture vs. dryland urbanization. J. Arid Environ. 2004, 56, 6590–6680. [Google Scholar] [CrossRef]
  17. Takemi, T. Explicit simulations of convective-scale transport of mineral dust in severe convective weather. J. Meteorol. Soc. Jpn. 2005, 83, 187–203. [Google Scholar] [CrossRef]
  18. GEF (Global Environment Facility); IFAD (International Fund for Agricultural Development). Land Degradation and Desertification. Available online: http://www.ifad.org/events/wssd/gef/GEF_eng.pdf (accessed on 8 February 2012).
  19. D’Odorico, P.; Bhattachan, A.; Davis, K.F.; Ravi, S.; Runyan, C.W. Global desertification: Drivers and feedbacks. Adv. Water Resour. 2013, 51, 326–344. [Google Scholar] [CrossRef]
  20. Schwartz, M.L.; Notini, J. Desertification and Migration: Mexico and the United States. A Research Report to U.S. Commission on Immigration Reform 1994; Natural Heritage Institute: San Francisco, CA, USA, 1994. [Google Scholar]
  21. Philip, J.R.; de Vries, D.A. Moisture movement in porous materials under temperature gradients. Trans. Am. Geophys. Union 1957, 38, 222–232. [Google Scholar] [CrossRef]
  22. Novak, M.D. Dynamics of the near-surface evaporation zone and corresponding effects on the surface energy balance of a drying bare soil. Agric. For. Meteorol. 2010, 150, 1358–1365. [Google Scholar] [CrossRef]
  23. Shahraeeni, E.; Lehmann, P.; Or, D. Coupling of evaporative fluxes from drying porous surfaces with air boundary layer—Characteristics of evaporation from discrete pores. Water Resour. Res. 2012, 48, 9525. [Google Scholar] [CrossRef]
  24. Liu, T.; Liu, X.; Yu, R. Field measurement of the water retention curves and simple estimation of the parameters for soils in the central region of Horqin sandy land. In Proceedings of the 2006 Western Pacific Geophysics Meeting, Beijing, China, 24–27 July 2006.
  25. Wang, Z.; Wang, L.; Liu, L.; Zheng, Q. Preliminary study on soil moisture content in dried layer of sand dunes in the Mu Us Sandland. Arid Zone Res. 2006, 23, 89–92. (In Chinese) [Google Scholar]
  26. Goss, K.U.; Madliger, M. Estimation of water transport based on in situ measurements of relative humidity and temperature in a dry Tanzanian soil. Water Resour. Res. 2007, 43, W05433. [Google Scholar] [CrossRef]
  27. Ahn, S.; Im, S.; Doerr, S. Effect of thickness of a water repellent soil layer on soil evaporation rate. In Proceedings of the EGU General Assembly 2012, Vienna, Austria, 22–27 April 2012.
  28. Liu, X.; Zhang, T.; Zhao, H.; He, Y.; Yun, J.; Li, Y. Influence of dry land bed thickness on soil moisture evaporation in mobile dune. Arid Land Geogr. 2006, 29, 523–526. [Google Scholar]
  29. Penman, H.L. Evaporation: An introductory survey. Neth. J. Agric. Sci. 1956, 4, 7–29. [Google Scholar]
  30. Monteith, J.L. Evaporation and environment. In State and Movement of Water in Living Organisms: Proceedings of the 19th Symposia Society of Experimental Biology; Cambridge University Press: Cambridge, UK, 1965; pp. 205–234. [Google Scholar]
  31. Shuttleworth, W.J.; Wallace, J.S. Evaporation from sparse crops—An energy combination theory. Q. J. R. Meteorol. Soc. 1985, 111, 839–855. [Google Scholar] [CrossRef]
  32. Granger, R.J. A complementary relationship approach for evaporation from nonsaturated surfaces. J. Hydrol. 1989, 111, 31–38. [Google Scholar] [CrossRef]
  33. Granger, R.J.; Gray, D.M. Evaporation from natural nonsaturated surfaces. J. Hydrol. 1989, 111, 21–29. [Google Scholar] [CrossRef]
  34. Liu, B.C.; Liu, W.; Peng, S.W. Study of heat and moisture transfer in soil with a dry surface layer. Int. J. Heat Mass Transf. 2005, 48, 4579–4589. [Google Scholar] [CrossRef]
  35. Arnold, J.G.; Fohrer, N. SWAT2000: Current capabilities and research opportunities in applied watershed modelling. Hydrol. Process. 2005, 19, 563–572. [Google Scholar] [CrossRef]
  36. Wang, X.; Melesse, A.M. Effects of STATSGO and SSURGO as inputs on SWAT model’s snowmelt simulation. J. Am. Water Resour. Assoc. 2006, 42, 1217–1236. [Google Scholar] [CrossRef]
  37. NCAR (National Center for Atmospheric Research). Technical Description of Version 4.0 of the Community Land Model (CLM). Available online: http://www.cesm.ucar.edu/models/ccsm4.0/clm/CLM4_Tech_Note.pdf (accessed on 2 April 2013).
  38. Swenson, S.C.; Lawrence, D.M. Assessing a dry surface layer-based soil resistance parameterization for the Community Land Model using GRACE and FLUXNET-MTE data. J. Geophys. Res.: Atmos. 2014, 119, 10299–10312. [Google Scholar] [CrossRef]
  39. Wallace, J.S.; Gash, J.H.C.; Sivakumar Icrisat, M.V.K. Preliminary measurements of net radiation and evaporation over bare soil and fallow bushland in the Sahel. Int. J. Climatol. 1990, 10, 203–210. [Google Scholar] [CrossRef]
  40. Qiu, G.; Yano, T.; Momii, K. An improved methodology to measure evaporation from bare soil based on comparison of surface temperature with a dry soil surface. J. Hydrol. 1998, 210, 93–105. [Google Scholar] [CrossRef]
  41. Fuchs, M.; Tanner, C.B. Evaporation from drying soil. J. Appl. Meteorol. 1967, 6, 852–857. [Google Scholar] [CrossRef]
  42. Van de Griend, A.A.; Owe, M. Bare soil surface-resistance to evaporation by vapor diffusion under semiarid conditions. Water Resour. Res. 1994, 30, 181–188. [Google Scholar] [CrossRef]
  43. Durar, A.A.; Steiner, J.L.; Evett, S.R.; Skidmore, E.L. Measured and simulated surface soil drying. Agron. J. 1995, 87, 235–244. [Google Scholar] [CrossRef]
  44. Viterbo, P. A Review of Parameterization Schemes for Land Surface Processes. 2002. Available online: http://www.ecmwf.int/newsevents/training/lecture_notes/.../Land_surf.pdf (accessed on 3 April 2013).
  45. Ács, F. A comparative analysis of transpiration and bare soil evaporation. Bound. Layer Meteorol. 2003, 109, 139–162. [Google Scholar] [CrossRef]
  46. Aluwihare, S.; Watanabe, K. Measurement of evaporation from bare soil and a new approach to surface resistance. J. Environ. Eng. 2003, 129, 1157–1169. [Google Scholar] [CrossRef]
  47. Mutziger, A.J.; Burt, C.M.; Howes, D.J.; Allen, R.G. Comparison of measured and FAO-56 modeled evaporation from bare soil. J. Irrig. Drain. Eng. 2005, 131, 59–72. [Google Scholar] [CrossRef]
  48. Konukcu, F. Modification of the Penman method for computing bare soil evaporation. Hydrol. Process. 2007, 21, 3627–3634. [Google Scholar] [CrossRef]
  49. Bittelli, M.; Ventura, F.; Campbell, G.S.; Snyder, R.L.; Gallegati, F.; Pisa, P.R. Coupling of heat, water vapor, and liquid water fluxes to compute evaporation in bare soils. J. Hydrol. 2008, 362, 191–205. [Google Scholar] [CrossRef]
  50. Verstraeten, W.W.; Veroustraete, F.; Feyen, J. Assessment of evapotranspiration and soil moisture content across different scales of observation. Sensors 2008, 8, 70–117. [Google Scholar] [CrossRef]
  51. Philip, J.R. Evaporation, and moisture and heat fields in the soil. J. Meteorol. 1958, 14, 354–366. [Google Scholar] [CrossRef]
  52. Gardner, H.R.; Hanks, R.J. Evaluation of the evaporation zone in soil by measurement of heat flux. Proc. Soil Sci. Soc. Am. 1966, 30, 425–428. [Google Scholar] [CrossRef]
  53. Yamanaka, T.; Yonetani, T. Dynamics of the evaporation zone in dry sandy soils. J. Hydrol. 1999, 217, 135–148. [Google Scholar] [CrossRef]
  54. Heitman, J.L.; Horton, R.; Sauer, T.J.; DeSutter, T.M. Sensible heat observations reveal soil-water evaporation dynamics. J. Hydrometeorol. 2008, 9, 165–171. [Google Scholar] [CrossRef]
  55. Heitman, J.L.; Xiao, X.; Horton, R.; Sauer, T.J. Sensible heat measurements indicating depth and magnitude of subsurface soil water evaporation. Water Resour. Res. 2008, 44, W00D05. [Google Scholar] [CrossRef]
  56. Kobaysahi, T.; He, W.; Nagai, H. Mechanisms of evaporation from soil with a dry surface. Hydrol. Process. 1998, 12, 2185–2191. [Google Scholar] [CrossRef]
  57. Lawrence, D.M.; Thornton, P.E.; Oleson, K.W.; Bonan, G.B. The Partitioning of Evapotranspiration into Transpiration, Soil Evaporation, and Canopy Evaporation in a GCM: Impacts on Land-Atmosphere Interaction. J. Hydrometeorol. 2007, 8, 860–880. [Google Scholar] [CrossRef]
  58. Van Bavel, C.H.M.; Hillel, D.I. A simulation study of soil heat and moisture dynamics as affected by a dry mulch. In Proceedings of 1975 Summer Computer Simulation Conference, San Francisco, CA, USA, July 19–24 1975; Simulation Councils Inc.: La Jilla, CA, USA, 1975; pp. 815–821. [Google Scholar]
  59. Van Bavel, C.H.M.; Hillel, D.I. Calculating potential and actual evaporation from a bare soil surface by simulation of concurrent flow of water and heat. Agric. Meteorol. 1976, 17, 453–476. [Google Scholar] [CrossRef]
  60. Mahfouf, J.F.; Noilhan, J. Comparative study of various formulations of evaporation from bare soil using in situ data. J. Appl. Meteorol. 1991, 30, 1354–1365. [Google Scholar] [CrossRef]
  61. Kondo, J.; Saigusa, N.; Sato, T. A model and experimental study of evaporation from bare-soil surfaces. J. Appl. Meteorol. 1992, 31, 304–312. [Google Scholar] [CrossRef]
  62. Bristow, K.L.; Horton, R. Modeling the impact of partial surface mulch on soil heat and water flow. Theor. Appl. Climatol. 1996, 54, 85–98. [Google Scholar] [CrossRef]
  63. Yamanaka, T.; Takeda, A.; Shimada, J. Evaporation beneath the soil surface: Some observational evidence and numerical experiments. Hydrol. Process. 1998, 12, 2193–2203. [Google Scholar] [CrossRef]
  64. Mori, Y.; Hopmans, J.W.; Mortensen, A.P.; Kluitenberg, G.J. Multi-functional heat pulse probe for the simultaneous measurement of soil water content, solute concentration, and heat transport parameters. Vadose Zone J. 2003, 2, 561–570. [Google Scholar] [CrossRef]
  65. Saito, H.; Šimůnek, J.; Mohanty, B. Numerical analyses of coupled water, vapor and heat transport in the vadose zone. Vadose Zone J. 2006, 5, 784–800. [Google Scholar] [CrossRef]
  66. Saito, H.; Šimůnek, J.; Hopmans, J.W.; Tuli, A. Numerical evaluation of alternative heat pulse probe designs and analysis. Water Resour. Res. 2007, 43, W07408. [Google Scholar] [CrossRef]
  67. Sakai, M.; Toride, N.; Šimůnek, J. Water and vapor movement with condensation and evaporation in a sandy column. Soil Sci. Soc. Am. J. 2009, 73, 707–717. [Google Scholar] [CrossRef]
  68. Sakai, M.; Jones, S.B.; Tuller, M. Numerical evaluation of subsurface soil water evaporation derived from sensible heat balance. Water Resour. Res. 2011, 47, W02547. [Google Scholar] [CrossRef]
  69. Xiao, X.; Horton, R.; Sauer, T.J.; Heitman, J.L.; Ren, T. Cumulative soil water evaporation as a function of depth and time. Vadose Zone J. 2011, 10, 1016–1022. [Google Scholar] [CrossRef]
  70. Xiao, Z.; Lu, S.; Heitmanc, J.; Hortond, R.; Ren, T. Measuring subsurface soil-water evaporation with an improved heat-pulse probe. Soil Sci. Soc. Am. J. 2012, 76, 876–879. [Google Scholar] [CrossRef]
  71. Liu, G.; Wen, M.; Chang, X.; Ren, T.; Horton, R. A self-calibrated dual probe heat pulse sensor for in situ calibrating the probe spacing. Soil Sci. Soc. Am. J. 2013, 77, 417–421. [Google Scholar] [CrossRef]
  72. Bristow, K.L.; Campbell, G.S.; Calissendorff, K. Test of a heat-pulse probe for measuring changes in soil water content. Soil Sci. Am. J. 1993, 57, 930–934. [Google Scholar] [CrossRef]
  73. Bristow, K.L.; Kluitenberg, G.J.; Goding, C.J.; Fitzgerald, T.S. A small multi-needle probe for measuring soil thermal properties, water content and electrical conductivity. Comput. Electron. Agric. 2001, 31, 265–280. [Google Scholar] [CrossRef]
  74. Liu, X. Evaluation of the heat-pulse technique for measuring soil water content with thermo-TDR sensor. Procedia Environ. Sci. 2011, 11, 1234–1239. [Google Scholar] [CrossRef]
  75. Kamai, T. Development of Heat Pulse Sensors to Measure Vadose Zone Thermal Properties, Water Content, and Water Flux Density. Ph.D. Thesis, University of California-Davis, Davis, CA, USA, March 2013. [Google Scholar]
  76. Zeng, Y.; Su, Z.; Wan, L.; Yang, Z.; Zhang, T.; Tian, H.; Shi, X.; Wang, X.; Cao, W. Diurnal pattern of the drying front in desert and its application for determining the effective infiltration. Hydrol. Earth Syst. Sci. 2009, 13, 703–714. [Google Scholar] [CrossRef]
  77. Zeng, Y.; Wan, L.; Su, Z.; Saito, H.; Huang, K.; Wang, X. Diurnal soil water dynamics in the shallow vadose zone (field site of China University of Geosciences, China). Environ. Geol. 2009, 58, 11–23. [Google Scholar] [CrossRef]
  78. Zeng, Y.; Su, Z.; Wan, L.; Wen, J. Numerical analysis of air-water-heat flow in unsaturated soil: Is it necessary to consider airflow in land surface models. J. Geophys. Res. Atmos. 2011, 116. [Google Scholar] [CrossRef]
  79. Zeng, Y.; Su, Z.; Wan, L.; Wen, J. A simulation analysis of the advective effect on evaporation using a two-phase heat mass flow model. Water Resour. Res. 2011, 47. [Google Scholar] [CrossRef]
  80. Zeng, Y.; Su, Z. Reply to comment by Binayak P. Mohanty and Zhenlei Yang on “A simulation analysis of the advective effect on evaporation using a two-phase heat and mass flow model”. Water Resour. Res. 2013, 49, 7836–7840. [Google Scholar] [CrossRef]
  81. Fayer, M.J.; Simmons, C.S. Modified soil-water retention functions for all matric suctions. Water Resour. Res. 1995, 31, 1233–1238. [Google Scholar] [CrossRef]
  82. Van Genuchten, M.T. A closed-form equation for predicting the hydraulic conductivity of unsaturated soils. Soil Sci. Soc. Am. J. 1980, 44, 892–898. [Google Scholar] [CrossRef]
  83. Kobayashi, T.; Matsuda, A.; Kamichika, M. A simple method for estimating the rate of evaporation from a dry sand surface. J. Agric. Meteorol. 1989, 44, 269–274. [Google Scholar] [CrossRef]
  84. Daamen, C.C.; Simmonds, L.P. Measurement of evaporation from bare soil and its estimation using surface resistance. Water Resour. Res. 1996, 32, 1393–1402. [Google Scholar] [CrossRef]
  85. Sun, H.; Liu, C.; Zhang, X. Effect of the different length micro-lysimeters on the evaporation. J. Northwest Sci. Technol. Univ. Agric. For. Nat. Sci. Ed. 2003, 31, 167–170. [Google Scholar]
  86. Smits, K.M.; Ngo, V.V.; Cihan, A.; Sakaki, T.; IIIangasekare, T.H. An evaluation of models of bare soil evaporation formulated with different land surface boundary conditions and assumptions. Water Resour. Res. 2012, 48, W12526. [Google Scholar] [CrossRef]
  87. Nassar, I.N.; Globus, A.M.; Horton, R. Simultaneous soil heat and water transfer. Soil Sci. 1992, 154, 465–472. [Google Scholar] [CrossRef]
  88. Ames, W.F. Numerical Methods for Partial Differential Equations, 3rd ed.; Academic Press: San Diego, NM, USA, 1992; ISBN 978-0120567614. [Google Scholar]
  89. Cass, A.; Campbell, G.S.; Jones, T.L. Enhancement of thermal water vapor diffusion in soil. Soil Sci. Soc. Am. J. 1984, 48, 25–32. [Google Scholar] [CrossRef]
  90. Campbell, G.S. Soil Physics with Basic: Transport Models for Soil-Plant System; Elsevier: New York, NY, USA, 1985. [Google Scholar]
  91. Mualem, Y. A new model for predicting the hydraulic conductivity of unsaturated porous media. Water Resour. Res. 1976, 12, 513–522. [Google Scholar] [CrossRef]
  92. Šimůnek, J.; van Genuchten, M.Th. Modeling nonequilibrium flow and transport with HYDRUS. Vadose Zone J. 2008, 7, 782–797. [Google Scholar] [CrossRef]
  93. Chung, S.O.; Horton, R. Soil heat and water flow with a partial surface mulch. Water Resour. Res. 1987, 23, 2175–2186. [Google Scholar] [CrossRef]
  94. Brooks, R.H.; Corey, A.T. Hydraulic properties of porous media. In Hydrology Paper 3; Colorado State University: Fort Collins, CO, USA, 1964. [Google Scholar]
  95. Campbell, G.S. A simple method for determining unsaturated conductivity from moisture retention data. Soil Sci. 1974, 117, 311–314. [Google Scholar] [CrossRef]
  96. Lambot, S.; Hupet, F.; Javaux, M.; Vanclooster, M. Laboratory evaluation of a hydrodynamic inverse modeling method based on water content data. Water Resour. Res. 2004, 40, W03506. [Google Scholar] [CrossRef]
  97. Burdine, N.T. Relative permeability calculations from pore-size data. Trans. Am. Inst. Min. Eng. 1953, 198, 71–77. [Google Scholar] [CrossRef]
  98. Ochsner, T.E.; Sauer, T.J.; Horton, R. Soil heat capacity and heat storage measurements in energy balance studies. J. Agron. 2007, 99, 311–319. [Google Scholar] [CrossRef]
  99. Farouki, O.T. Thermal properties of soils. In CRREL Monograph 81-1; United States Army Corps of Engineers Cold Regions Research and Engineering Laboratory: Hanover, NH, USA, 1981. [Google Scholar]
  100. Tarnawski, V.R.; Leong, W.H. Thermal conductivity of soils at very low moisture content and moderate temperatures. Transp. Porous Media 2000, 41, 137–147. [Google Scholar] [CrossRef]
  101. Ghuman, B.S.; Jalota, S.K. Heat capacity of soil. Encycl. Soil Sci. 2006, 1, 811–813. [Google Scholar] [CrossRef]
  102. Monteith, J.L. Evaporation from land surfaces: Progress in analysis and prediction since 1948. In Proceedings of National Conference on Advances in Evapotranspiration, Chicago, IL, USA, 16–17 December 1985; pp. 4–12.
  103. Brisson, N.; Itier, B.; L’Hotel, J.C.; Lorendeau, J.Y. Parameterisation of the Shuttleworth-Wallace model to estimate daily maximum transpiration for use in crop models. Ecol. Model. 1998, 107, 159–169. [Google Scholar] [CrossRef]
  104. Zhou, M.C.; Ishidaira, H.; Hapuarachchi, H.P.; Magome, J.; Kiem, A.S.; Takeuchi, K. Estimating potential evapotranspiration using Shuttleworth-Wallace model and NOAA-AVHRR NDVI data to feed a distributed hydrological model over the Mekong River basin. J. Hydrol. 2006, 327, 151–173. [Google Scholar] [CrossRef]
  105. Jung, M.; Reichstein, M.; Bondeau, A. Towards global empirical upscaling of FLUXNET eddy covariance observations: Validation of a model tree ensemble approach using a biosphere model. Biogeosciences 2009, 6, 2001–2013. [Google Scholar] [CrossRef]
  106. Tapley, B.D.; Bettadpur, S.; Watkins, M.; Reigber, C. The gravity recovery and climate experiment: Mission overview and early results. Geophys. Res. Lett. 2004, 31, L09607. [Google Scholar] [CrossRef]
  107. Assouline, S. On the relationships between the pore size distribution index and characteristics of the soil hydraulic functions. Water Resour. Res. 2005, 41, W07019. [Google Scholar] [CrossRef]

