Article

Forms of Nutrients in Rivers Flowing into Lake Chaohu: A Comparison between Urban and Rural Rivers

1
State Key Laboratory of Lake Science and Environment, Nanjing Institute of Geography and Limnology, Chinese Academy of Sciences, Nanjing 210008, China
2
College of Hydrology and Water Resource, Hohai University, Nanjing 210098, China
3
Department of Environmental Science, China Pharmaceutical University, Nanjing 211198, China
*
Author to whom correspondence should be addressed.
Water 2015, 7(8), 4523-4536; https://doi.org/10.3390/w7084523
Submission received: 9 June 2015 / Revised: 10 August 2015 / Accepted: 12 August 2015 / Published: 19 August 2015

Abstract

:
Nutrient inputs from rivers play an important role in lake eutrophication. To compare the forms characteristics of phosphorus (P) and nitrogen (N) in rivers flowing through rural and urban areas, water samples were collected seasonally from five urban rivers and six rural rivers flowing to Lake Chaohu, China. Higher total phosphorus (TP), particulate phosphorus (PP), soluble reactive phosphorus (SRP), and dissolved nonreactive phosphorus (DNP) concentrations and SRP/TP percentages were observed in urban rivers than in rural rivers, and PP/TP and DNP/TP ratios were lower in urban rivers than in rural rivers. The concentrations of total nitrogen (TN) and all N forms other than dissolved organic nitrogen (DON) were significantly higher in urban rivers than in rural rivers. NH4+/TN levels were higher in urban rivers, whereas PN/TN and DON/TN ratios were significantly lower in urban rivers compared with rural rivers. NO3/TN and NO2/TN levels were similar between the two groups of rivers. TP, BD-P, and NaOH-P levels in urban river surface sediments were significantly higher than those in rural rivers. NaOH-P/TP ratios were significantly elevated in urban rivers, whereas HCl-P/TP and Res-P/TP ratios were significantly lower compared with rural rivers. Urban rivers have transferred large quantities of NH4+ and SRP into Lake Chaohu, resulting in higher TP and TN levels and NH4+/TN and SRP/TP ratios. Decreasing the input of NH4+ and SRP into urban rivers is a high priority for mitigating eutrophication and algal blooms in Lake Chaohu.

1. Introduction

Eutrophication has become the primary water quality issue in most freshwater and coastal marine ecosystems worldwide [1,2]. Algal blooms resulting from eutrophication affect public health, tourism, fisheries, and ecosystems because they can be toxic and adversely affect water taste and odor [3,4]. Eutrophication is caused by excessive phosphorus (P) and nitrogen (N) inputs [2,5]. Both point and non-point nutrient inputs are key drivers of lake eutrophication [6]. Effluent from rivers is a primary point source for lakes [7]. In the absence of anthropogenic activity, the presence of nutrients in river water depends on the ecological and geological characteristics of the surrounding environment. However, anthropogenic activity is known to increase both P and N levels in rivers [8,9], and this increase results in higher nutrient inputs into lakes, thereby accelerating lake eutrophication [10]. There, intensive anthropogenic activities in the urban areas, which causes a large quantity of domestic sewage, industrial waste water, and urban stormwater runoff, flow into nearby streams [11].
Studies have shown that both the composition and the size of the nutrient pool impact eutrophication and greatly encourage harmful algal blooms [1,12]. For example, orthophosphate availability influences phytoplankton ecology [13]. Ammonium (NH4+) is a key factor in determining the distribution of common algal species and cyanobacteria blooms in freshwater systems [14]. When Microcystis utilize NH4+, they exhibit higher growth rates and photosynthesis abilities than other N forms, and an increased proportion of NH4+ in the N source facilitates Microcystis competition [12]. The higher ammonium/oxidized N ratio increases Cyanobacteria levels while decreases diatom levels [15]. Thus, it is critical to recognize the composition of the nutrients flowing into a lake to better understand the influence of river inputs on lake eutrophication and algal blooms.
Lake Chaohu is a large, shallow lake in Anhui Province, Eastern China (31°25′–31°43′ N, 117°16′–117°5′ E) and has an area of 770 km2 [16]. The lake plays an important role in intensive commercial fishing, water supply, irrigation, navigation, tourism, and recreational activities throughout the region. However, eutrophication and algal blooms in Lake Chaohu have become serious issues in the past several decades [17]. A recent 11-year study indicates there have been no substantial improvement in water quality from 2001 to 2011, and Lake Chaohu remains highly eutrophic [18]. River inputs have accelerated the eutrophication of Lake Chaohu [10]. There are 11 main rivers that flow into Lake Chaohu, five of which pass through urban areas and six of which flow through rural lands. The present study aimed to compare the characteristics of P and N forms in the urban and rural rivers that flow into Lake Chaohu (Figure 1). To achieve this goal, (1) a year-long study was conducted on all 11 rivers; (2) the concentrations and compositions of P and N in rural and urban river water were compared; and (3) total nitrogen (TN), total phosphorus (TP), and the ratios of P forms as a proportion of TP in sediments from the urban and rural rivers were also compared.
Figure 1. Sketch of the sampling sites and 11 rivers flowing into Lake Chaohu.
Water 07 04523 g001

2. Materials and Methods
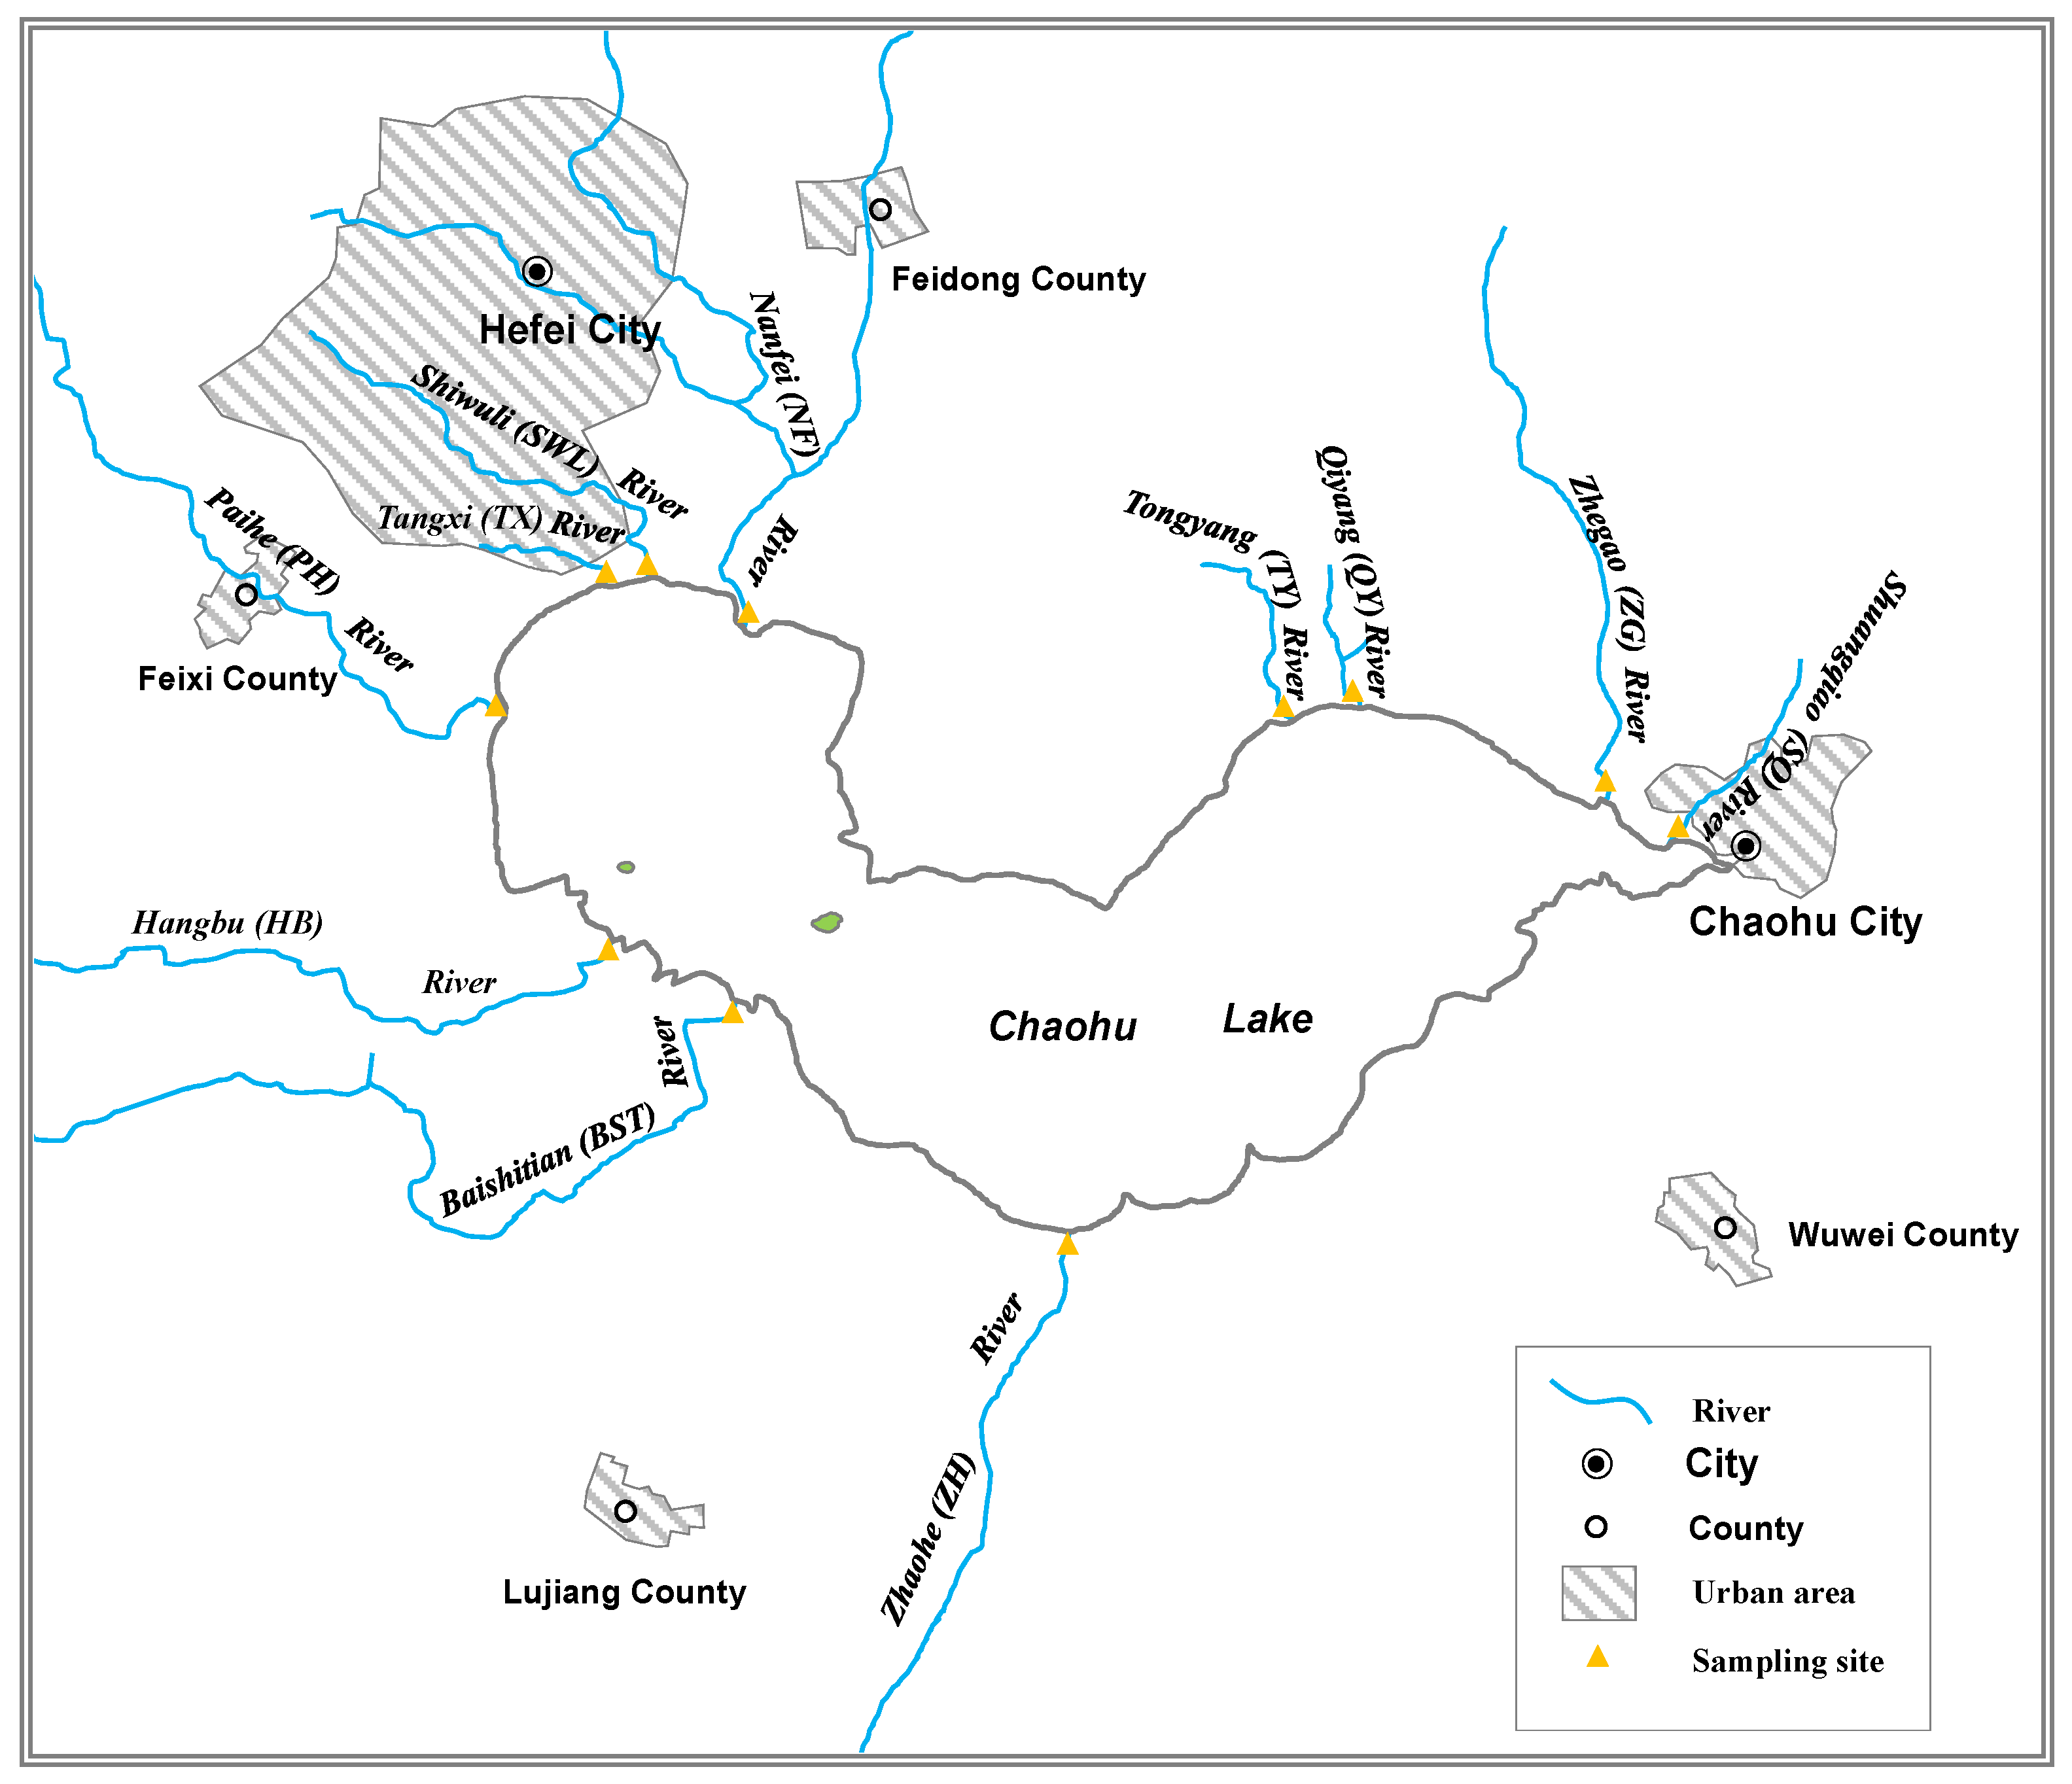
2.1. Field Sampling

The following rivers flowing into Lake Chaohu were studied: Nanfei River (NF), Shiwuli River (SWL), Tangxi River (TX), Paihe River (PH), Hangbu River (HB), Baishitian River (BST), Zhaohe River (ZH), Shuangqiao River (SQ), Zhegao River (ZG), Qiyang River (QY), and Tongyang River (TY) (Figure 1). In this study we classified rivers flowing through city and county town as the urban river group, and grouped other rivers as rural river group. NF, SWL, and TX flow through Hefei City, the provincial capital of Anhui Province. PH and SQ flow through the county town of Feixi and Chaohu City, respectively. The urban population of Hefei City, Feixi county town, and Chaohu City were separately 2,408,000, 148,000 and 272,000 [19,20]. These 5 rivers were classified as the urban group. The other 6 rivers did not flow through any city and county town, and they were classified as the rural group. In the Chaohu basin, the rural land is covered by cropland, forest, and grassland, with a ratio of about 15:3.6:1 [21]. The main agricultural crops are rice, wheat, and corn.
Each sampling site was located approximately 0.5 km upstream from the river mouth. Because nutrient levels fluctuate throughout the year, water samples were collected in December 2013 and April, July, and October 2014 to obtain data for winter, spring, summer, and autumn, respectively. When sampling, the water depth was first determined, and water samples were then collected using a handheld water sampler at 0.5 m above the river’s bed. Water temperature, dissolved oxygen (DO), and pH were measured onsite using a handheld DO meter (JPB-607A, Inesa, Shanghai, China) and a handheld pH meter (PHB-4, Inesa, Shanghai, China). Then, 250 mL of water was filtered through 0.45 μm cellulose acetate membranes. Both 250 mL of filtered water and 250 mL of unfiltered water were stored in a cooler box with ice. Sediment cores were collected in December 2013 only. One sediment core was collected at each site using a core sampler with a plexiglas tube (length 50 cm, inner diameter 8.6 cm), and each tube was sealed with rubber stoppers at both ends. All water samples and sediment cores were transported to the laboratory immediately after sampling. Water samples were preserved in a refrigerator at 4 °C for analysis.

2.2. Analyses of Water Samples

Nitrate N (in short nitrate or NO3), nitrite N (in short nitrite or NO2), ammonium N (in short ammonium or NH4+), total dissolved nitrogen (TDN), soluble reactive phosphorus (SRP), and total dissolved phosphorus (TDP) in the filtered water were analyzed separately. TN and TP in unfiltered samples were also examined. NH4+ and NO2 were determined using Nesster’s reagent and N-(1-Naphthyl) ethylenediamine dihydrochloride spectrophotometry, respectively. To examine TDN, TDP, TN, and TP, water samples were digested in an alkaline potassium persulfate solution. TDN, TN, and NO3 were measured using ultraviolet spectrophotometry. SRP, TDP, TP were determined using the molybdenum blue method. These methods were performed according to the Methods for the Examination of Water and Wastewater protocols [22]. All measurements of absorbance were examined using a UV-Vis spectrophotometer (UV-2550, Shimadzu, Kyoto, Japan). All samples were analyzed within 3 days of sampling.
The relationships between different forms of P and N were summarized as follows [23]. Particulate phosphorus (PP) was determined as the difference between TP and TDP, and dissolved nonreactive phosphorus (DNP, sometimes defined as dissolved organic P) was determined as the difference between TDP and SRP. Dissolved inorganic nitrogen (DIN) was determined as the sum of NH4+, NO3, and NO2. Dissolved organic nitrogen (DON) was calculated as TDN minus DIN, and particulate nitrogen (PN) was calculated as TN minus TDN. Thus, there were 3 basic forms (PP, SRP, and DNP) of TP and 5 basic forms of TN (NH4+, NO3, NO2, DON, and PN):
TP = TDP + PP = SRP + DNP + PP
TN = TDN + PN = DIN + DON + PN = NH4+ + NO3 + NO2 + DON + PN
The results and discussion presented herein focus on the analysis of these 8 forms.

2.3. Analyses of Sediment Cores

The top 10 cm of each sediment core was sectioned into 5 layers at 2-cm intervals. A portion of the fresh surface sediment (0–2 cm) samples was used to examine P fractions following a sequential extraction [24,25]. Sediment samples were successively extracted using 0.46 mol·L−1 NaCl, 0.11 mol·L−1 NaBD (0.11 mol·L−1 Na2S2O4 in 0.11 mol·L−1 NaHCO3), 0.1 mol·L−1 NaOH, and 0.5 mol·L−1 HCl; the residue was then ashed at 550 °C for 2 h and extracted with 1 mol·L−1 HCl. The P fractions were labeled as NaCl-P, BD-P, NaOH-P, HCl-P, and Res-P, respectively. The NaOH extract was digested with potassium persulfate (K2S2O8) for the measurement of the total P extracted using NaOH. The difference between total P and SRP in the NaOH extract was considered the organic P (Org-P) content of the sediment. The remaining sediment samples were dried under 45 °C and ground to pass through 150 μm mesh. Sediment TN was examined after digestion by alkaline potassium persulfate, and TP in sediment samples was extracted using 3.5 mol·L−1 HCl according to the SMT method [26]. All P extracts and TN samples were also analyzed using a UV-Vis spectrophotometer according to the molybdenum blue and ultraviolet methods, respectively.

2.4. Statistical Analysis

Differences in concentrations of P and N forms and the ratios of those forms as a proportion of TP and TN between the two groups of rivers were examined using a t test with SPSS 13.0 software (SPSS Inc., Chicago, IL, USA).

3. Results

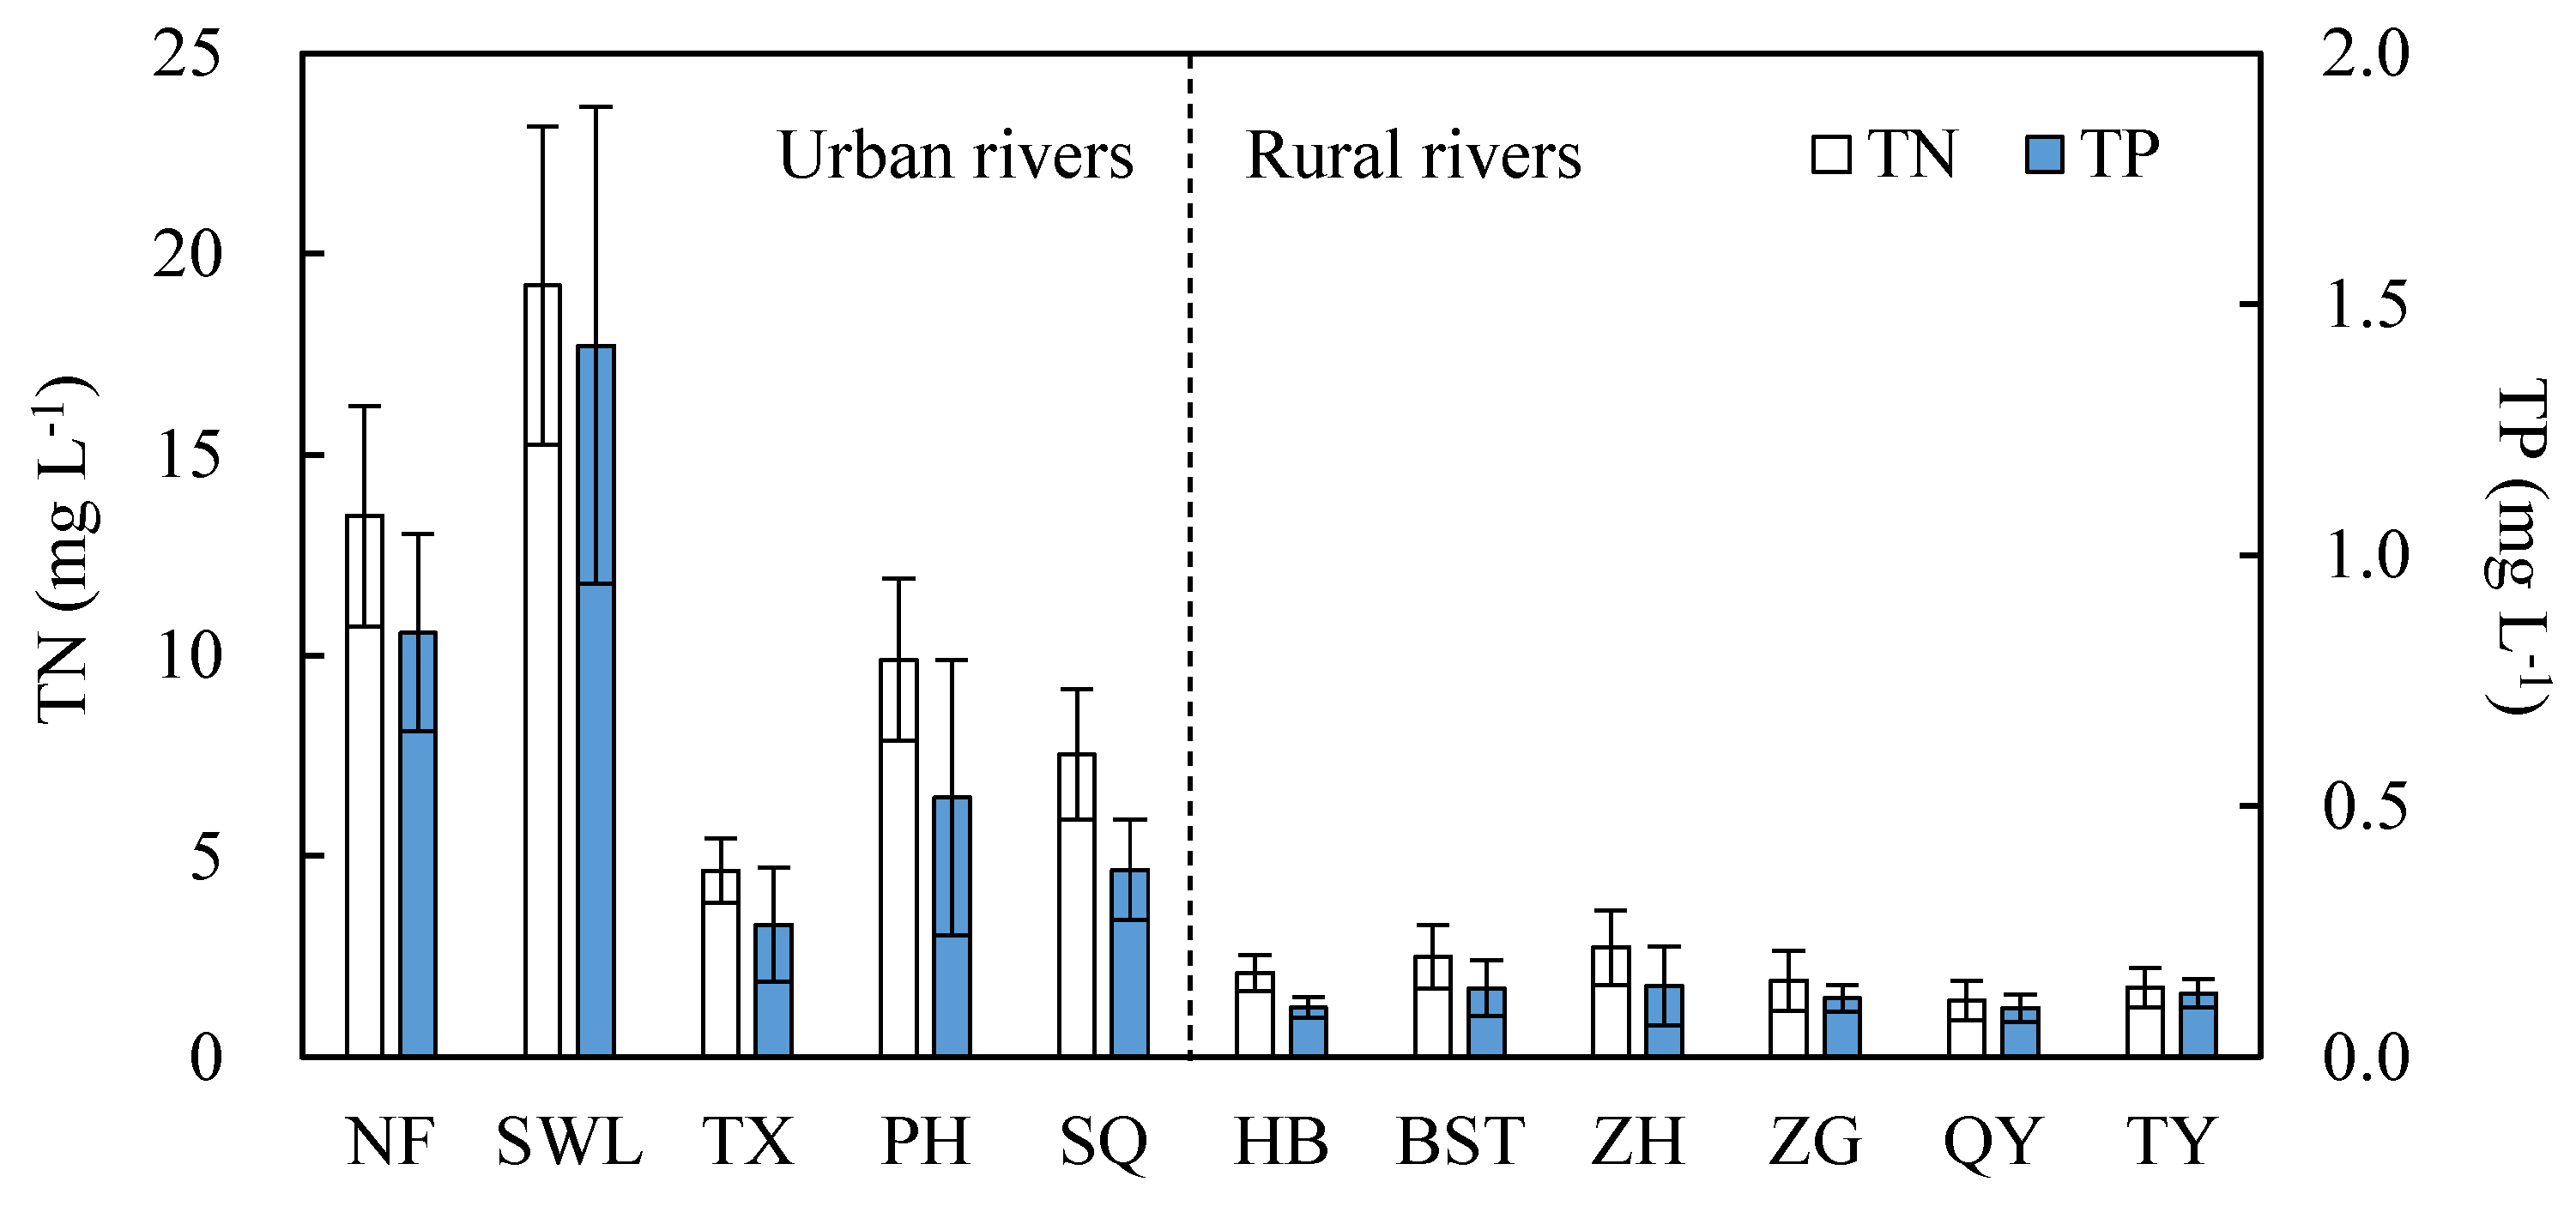
3.1. General Results

Of the 11 rivers flowing into Lake Chaohu, NF, PH, HB, BST, ZH, and ZG were the larger and had the greater water depths (≥3.5 m, Table 1). Lower DO levels were found in all of the urban rivers, except TX, compared with levels found in the rural rivers. Temperature and pH levels were similar in all rivers. The highest mean annual levels of TP and TN in water were detected in SWL, whereas the lowest levels were found in QY (Figure 2). For the five rivers flowing through urban areas, TP and TN ranged from 1.42 ± 0.476 to 0.265 ± 0.113 mg·L−1 and from 19.2 ± 3.96 to 4.65 ± 0.795 mg·L−1, respectively. For the six rural rivers, TP varied between 0.142 ± 0.079 and 0.098 ± 0.027 mg·L−1, and TN varied between 2.73 ± 0.934 and 1.41 ± 0.495 mg·L−1. The results of the statistical analysis indicated that TP and TN levels were significantly higher in the urban rivers (0.684 ± 0.208 mg·L−1 and 11.0 ± 2.52 mg·L−1) than in the rural rivers (0.120 ± 0.008 mg·L−1 and 2.09 ± 0.196 mg·L−1) (Figure 3a and Figure 4a).
Table 1. Physico-chemical parameters of 11 rivers flowing into Lake Chaohu at the time of sampling.
GroupRiver (Abbreviation)Water Depth (m)Water Temperature (°C)DO (mg·L−1)pH
MeanMinMaxMeanMinMaxMeanMinMaxMeanMinMax
UrbanNanfei River (NF)3.12.83.518.39.224.94.13.24.97.537.467.56
Shiwuli River (SWL)2.21.92.518.19.325.01.60.82.57.617.367.75
Tangxi River (TX)2.22.02.317.79.324.27.46.68.77.547.287.69
Paihe River (PH)4.13.14.617.710.222.83.51.87.57.457.177.60
Shuangqiao River (SQ)2.51.73.418.310.824.22.11.52.87.557.197.97
RuralHangbu River (HB)3.73.43.918.09.723.39.17.89.97.507.227.76
Baishitian River (BST)4.03.54.517.99.423.97.87.18.67.467.097.80
Zhaohe River (ZH)3.12.43.518.010.123.87.46.78.07.477.047.76
Zhegao River (ZG)4.34.14.518.310.824.77.56.88.57.557.307.72
Qiyang River (QY)1.81.62.018.310.625.17.16.48.17.607.327.88
Tongyang River (TY)1.81.22.218.510.425.07.35.98.17.487.317.72
Figure 2. Total phosphorus (TP) and total nitrogen (TN) in 11 rivers flowing into Lake Chaohu. NF = Nanfei River; SWL = Shiwuli River; TX = Tangxi River; PH = Paihe River; HB = Hangbu River; BST = Baishitian River; ZH = Zhaohe River; SQ = Shuangqiao River; ZG = Zhegao River; QY = Qiyang River; TY = Tongyang River.
Water 07 04523 g002
Figure 3. Concentrations of TP, TDP, PP, SRP, and DNP (a); and percentages of TDP/TP, PP/TP, SRP/TP, and DNP/TP (b) in rural and urban rivers. TP = total phosphorus; TDP = total dissolved phosphorus; PP = particulate phosphorus; SRP = soluble reactive phosphorus; DNP = dissolved nonreactive phosphorus. * (p < 0.05) and ** (p < 0.01) indicate significant differences between the rural and urban rivers (t test).
Water 07 04523 g003
Figure 4. Concentrations of TN, TDN, PN, DIN, DON, NH4, NO3, and NO2 (a); and percentages of TDN/TN, PN/TN, DIN/TN, DON/TN, NH4/TN, NO3/TN, and NO2/TN (b) in the rural and urban rivers. TN = total nitrogen; TDN = total dissolved nitrogen; PN = particulate nitrogen; DIN = dissolved inorganic nitrogen; DON = dissolved organic nitrogen; NH4 = ammonium; NO3 = nitrate; NO2 = nitrite. * (p < 0.05); ** (p < 0.01); and *** (p < 0.001) indicate significant differences between the urban and rural rivers (t test).
Water 07 04523 g004

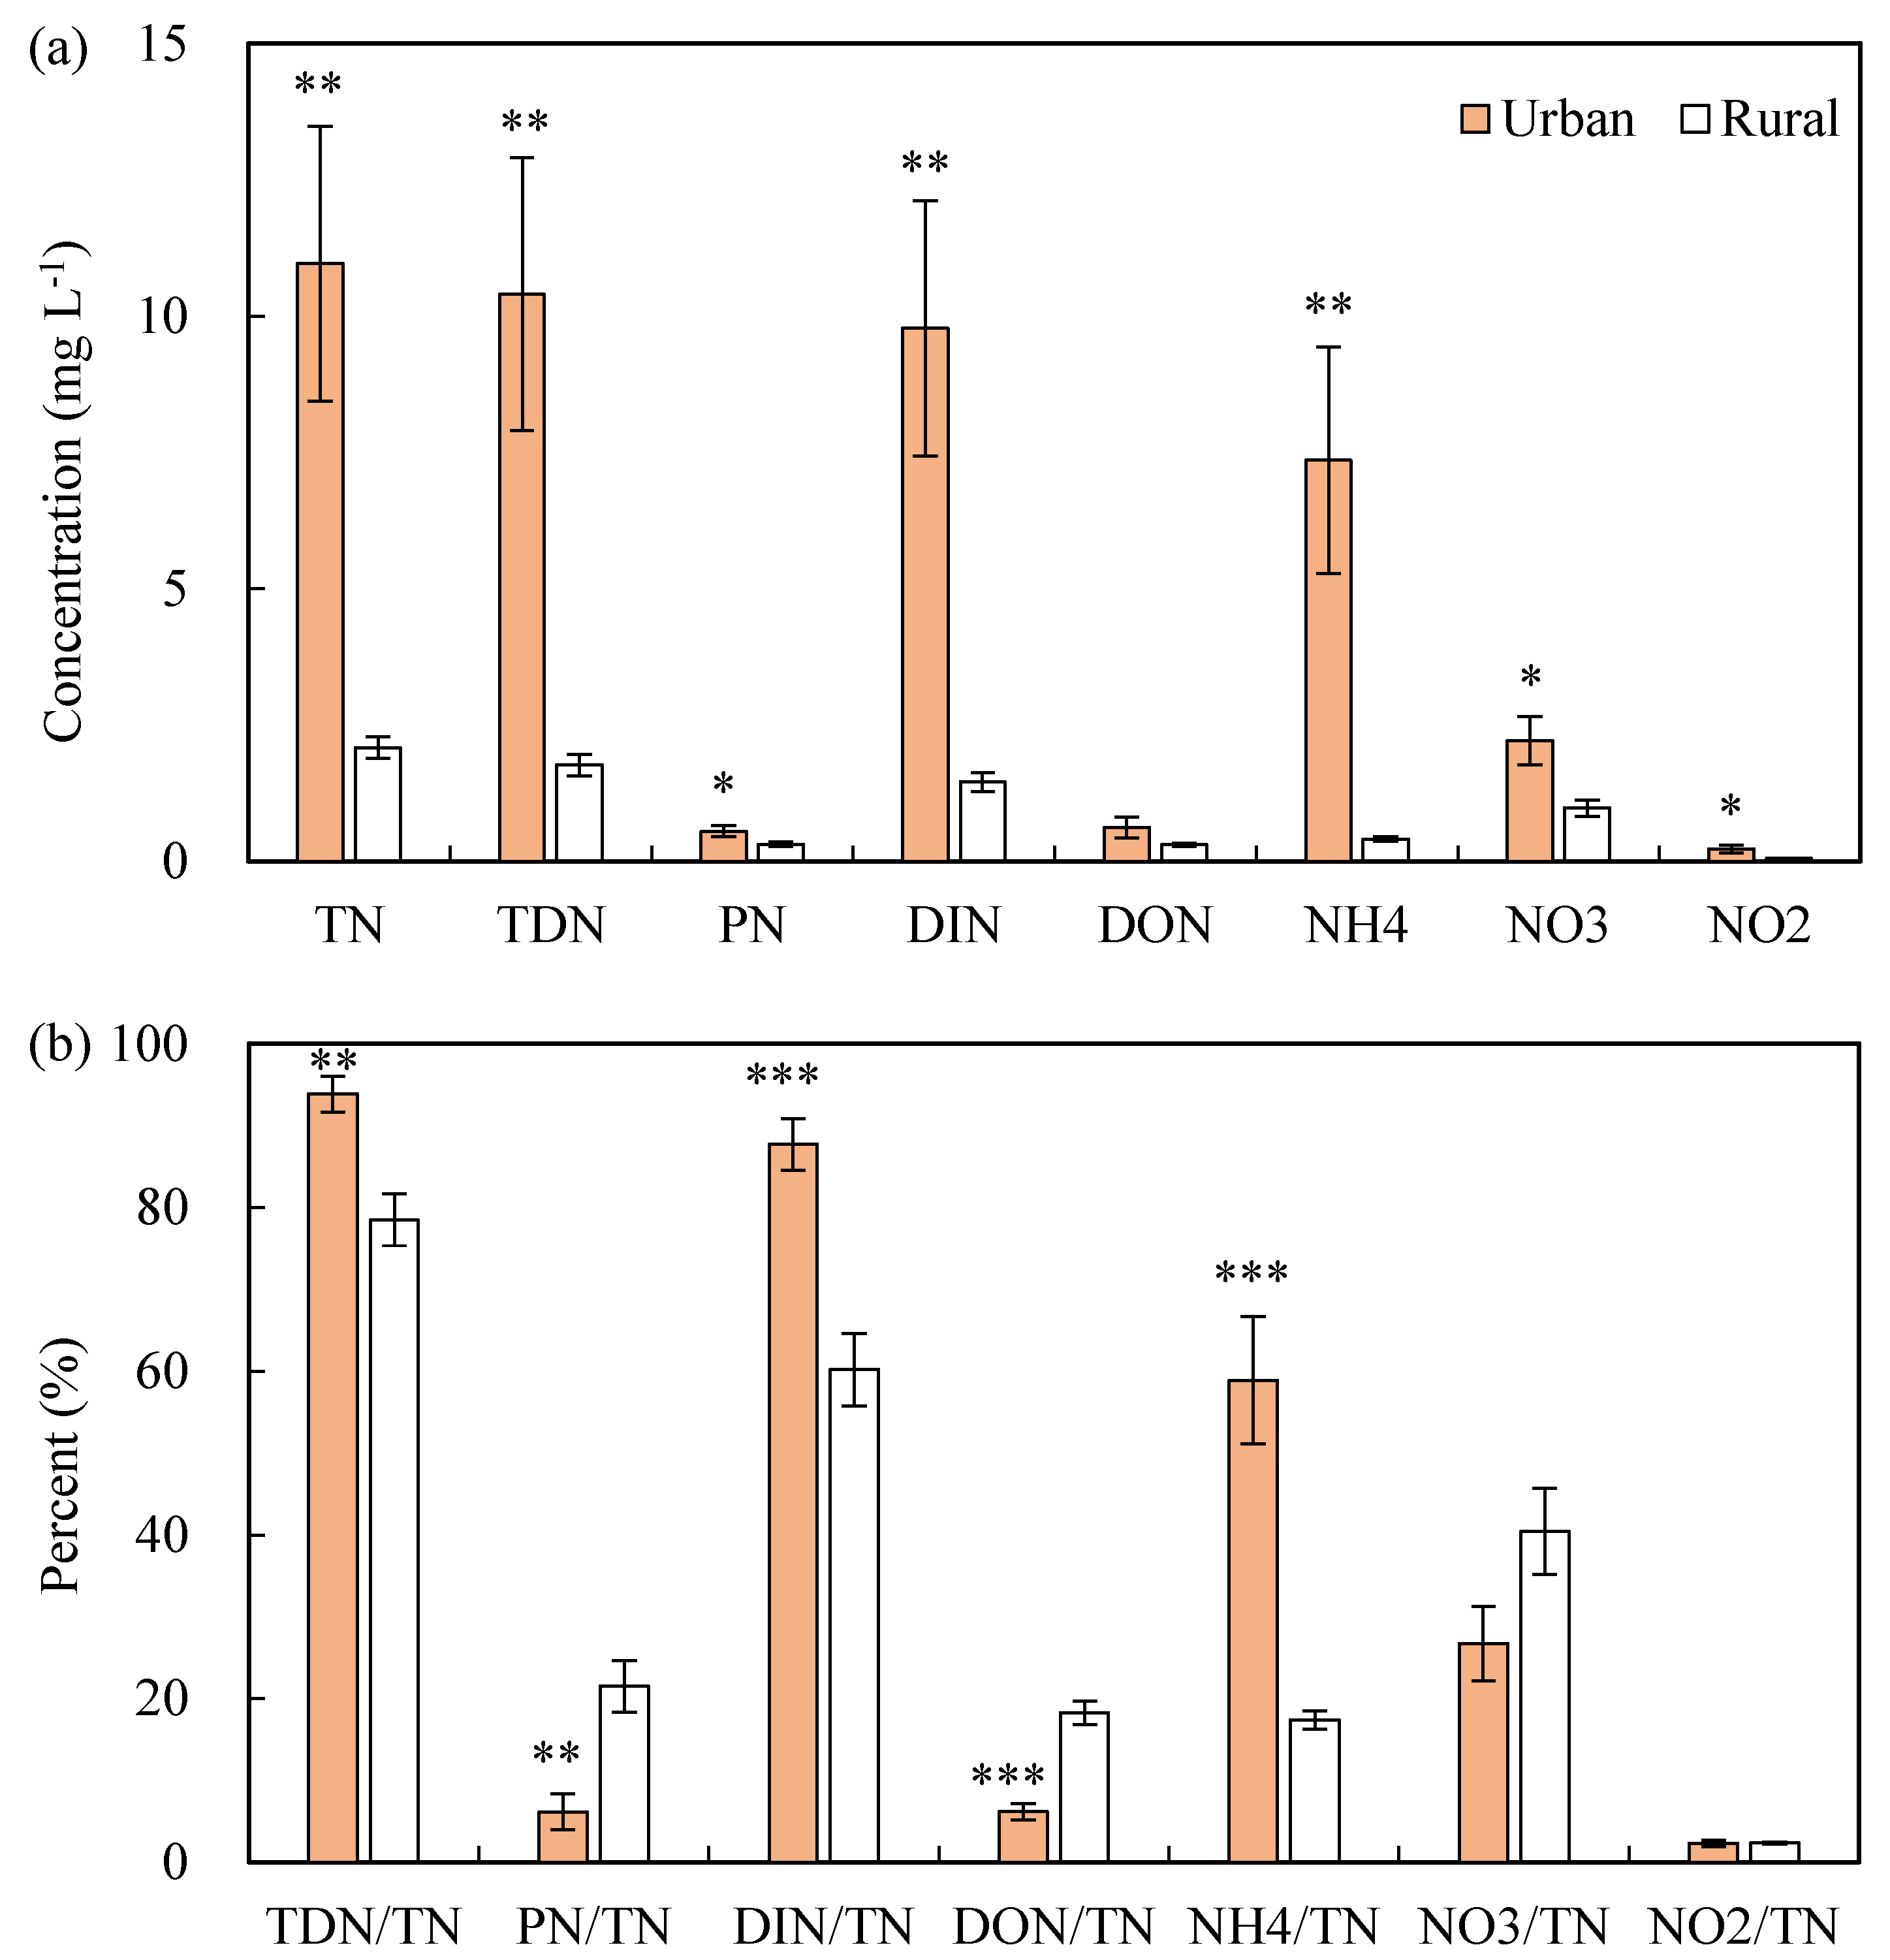
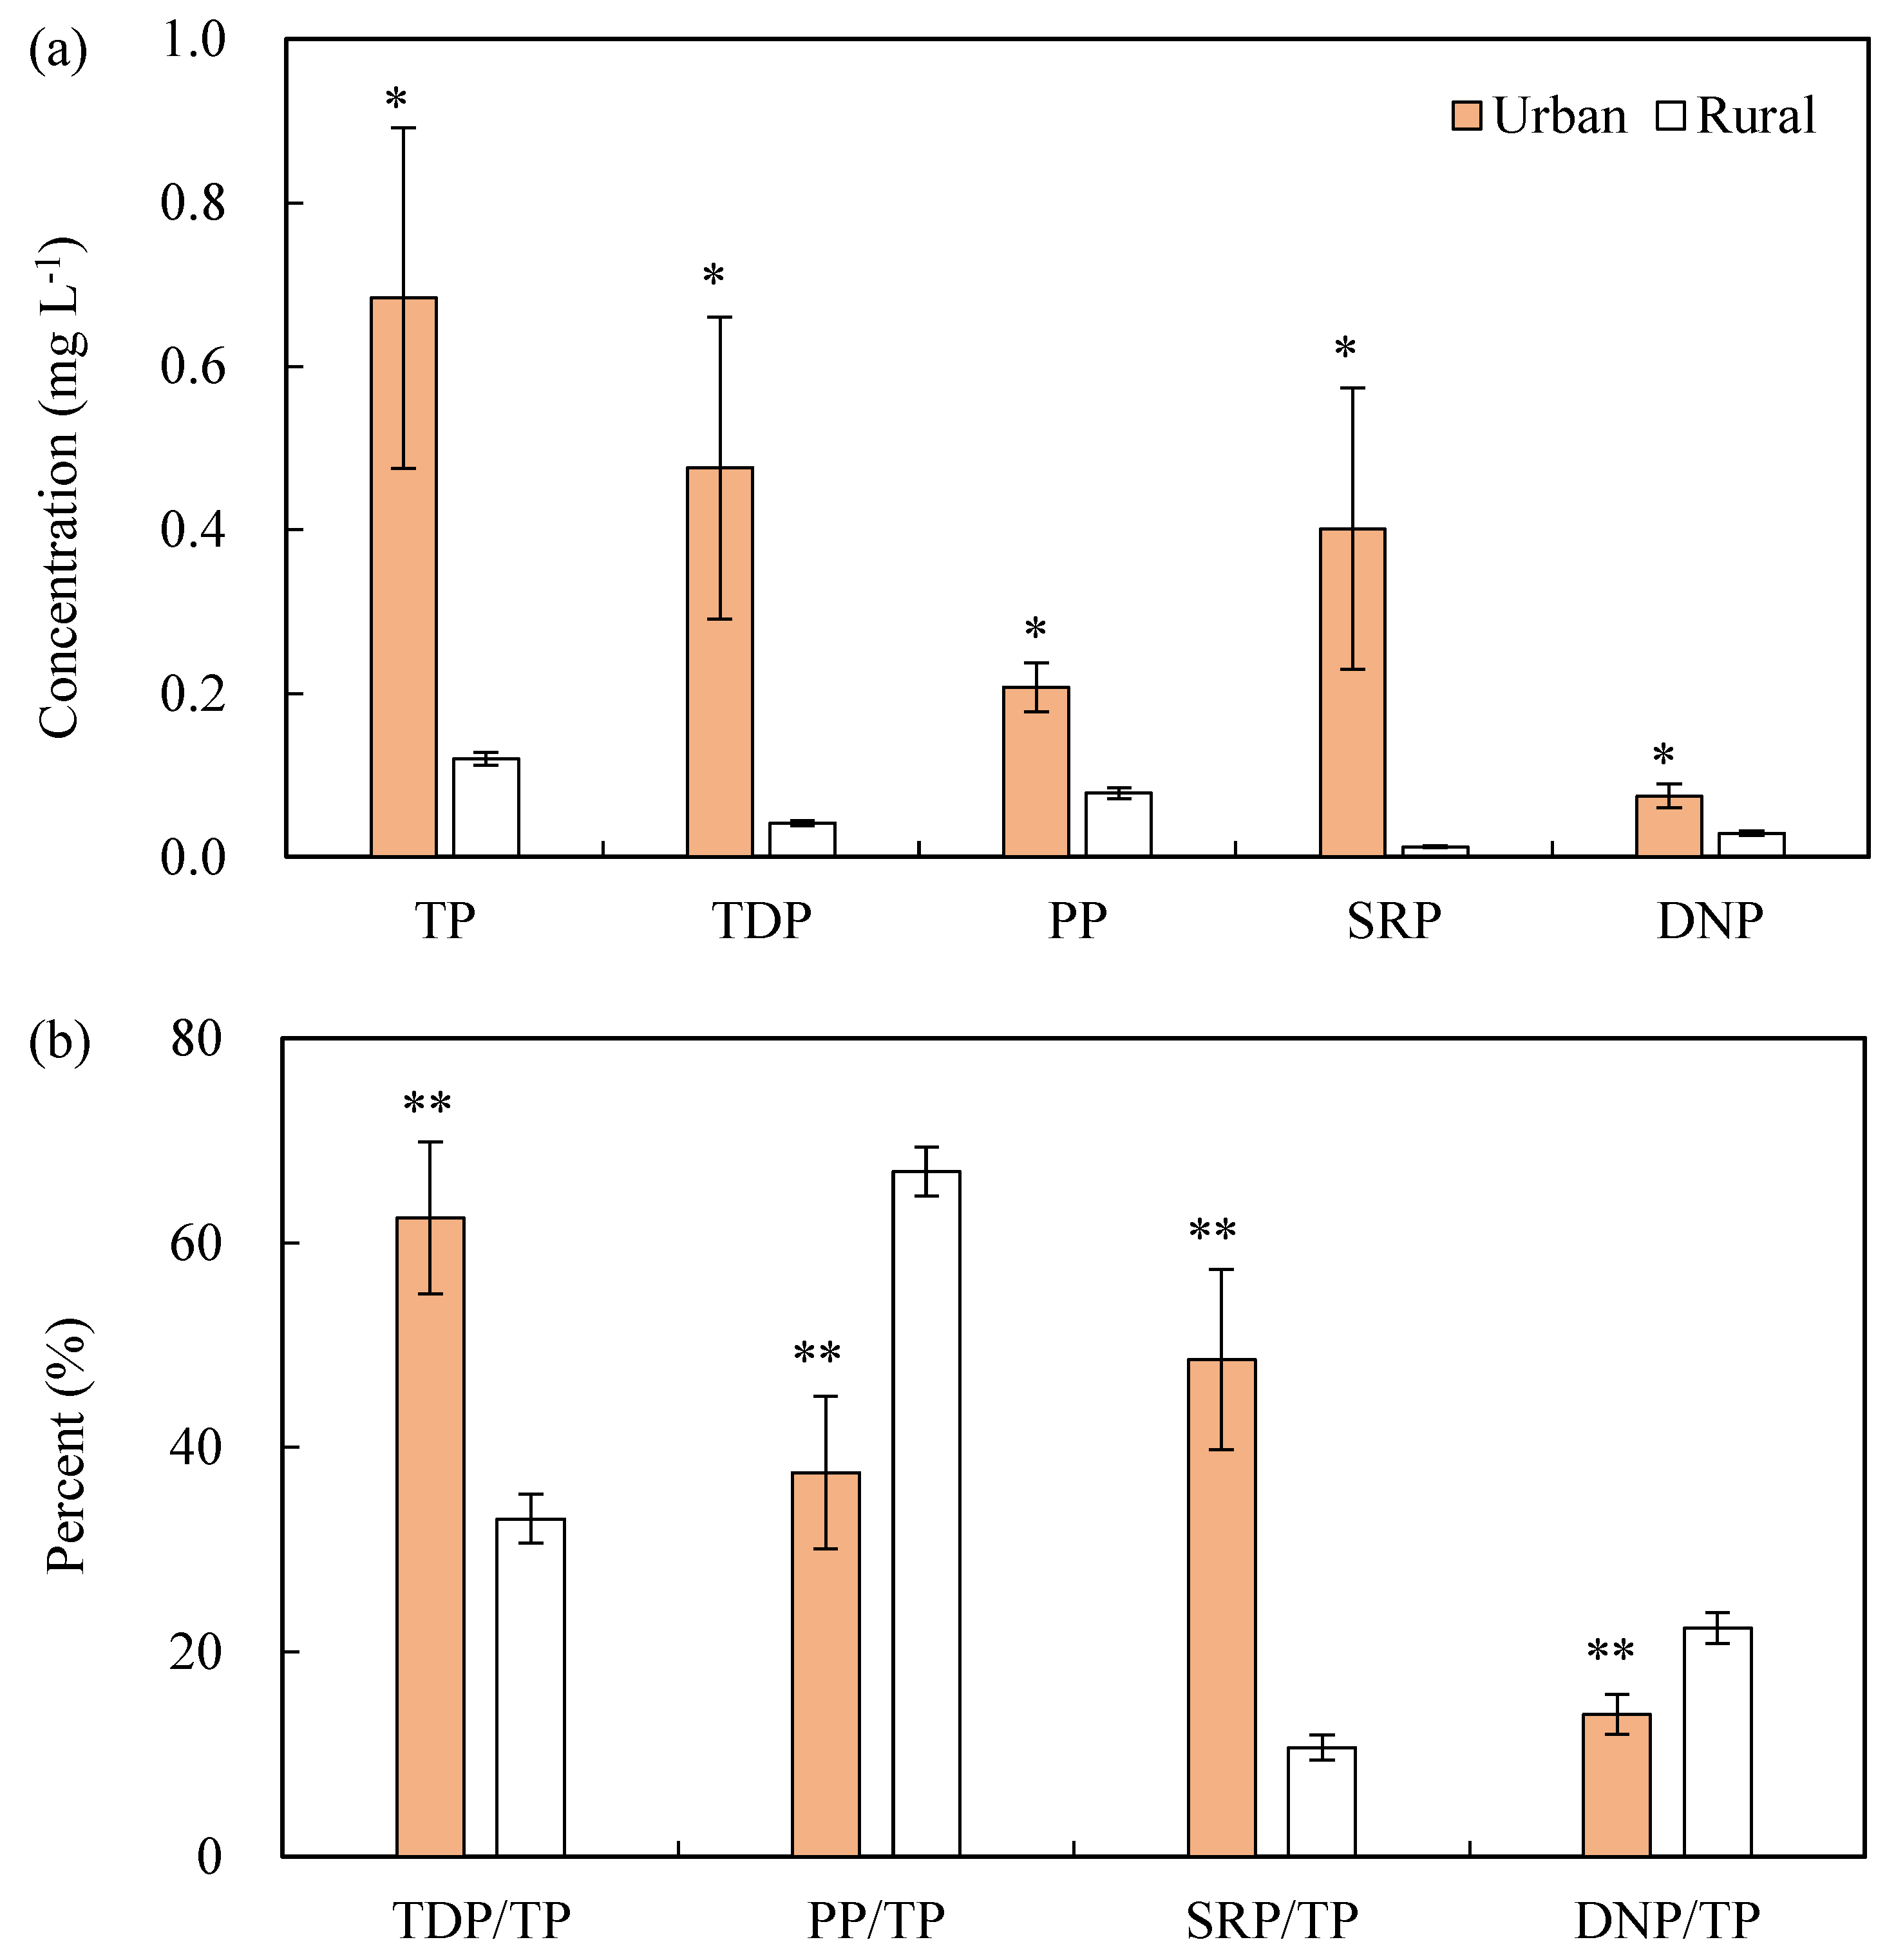
3.2. Composition of P and N in Water

The concentrations of TP and P forms detected in each river were summarized in Table S1, and the ratios of P forms to TP were listed in the Table S2 in the supplementary material. Statistical analyses were conducted in the urban and rural group rivers. TDP, PP, SRP, and DNP concentrations were significantly higher in the urban rivers than in the rural rivers. Of the three basic TP forms (PP, SRP, and DNP), SRP was the dominant form in the urban rivers; however, in the rural rivers, SRP was the least abundant form, whereas PP was the most abundant form (Figure 3a). The TDP/TP ratio was significantly higher in urban rivers than in rural rivers, and the PP/TP ratio was significantly lower in urban rivers. Of the two TDP forms, SRP/TP was significantly higher in urban rivers than in the rural rivers, whereas DNP/TP was significantly lower in the urban rivers (Figure 3b).
The annual mean of TN, TDN, PN, DIN, DON, NH4+, NO3, and NO2 in different rivers were separately grouped in Table S3 in the supplementary material. The ratio of TDN/TN, PN/TN, DIN/TN, DON/TN, NH4+/TN, NO3/TN, and NO2/TN in different rivers were listed in Table S4. The statistical analyses were carried out between the urban and rural groups. With the exception of DON, the concentrations of TN forms were significantly higher in the urban rivers compared with the rural rivers. Of the five basic TN forms (NH4+, NO3, NO2, DON, and PN), NH4+ was the most abundant form in the urban rivers, whereas NO3 was the most abundant form in the rural rivers. NO2 was the least abundant form in both urban and rural rivers (Figure 4a). TDN/TN was found to be significantly higher in urban rivers than in rural rivers, whereas the situation was reversed for PN/TN. For the TDN forms, DIN/TN was significantly elevated in the urban rivers, whereas DON/TN was significantly lower in the urban rivers compared with the rural rivers. NH4+/TN was also higher in the urban rivers than in the rural rivers, although there were no significant differences between NO3/TN or NO2/TN levels in the urban and rural groups (Figure 4b).

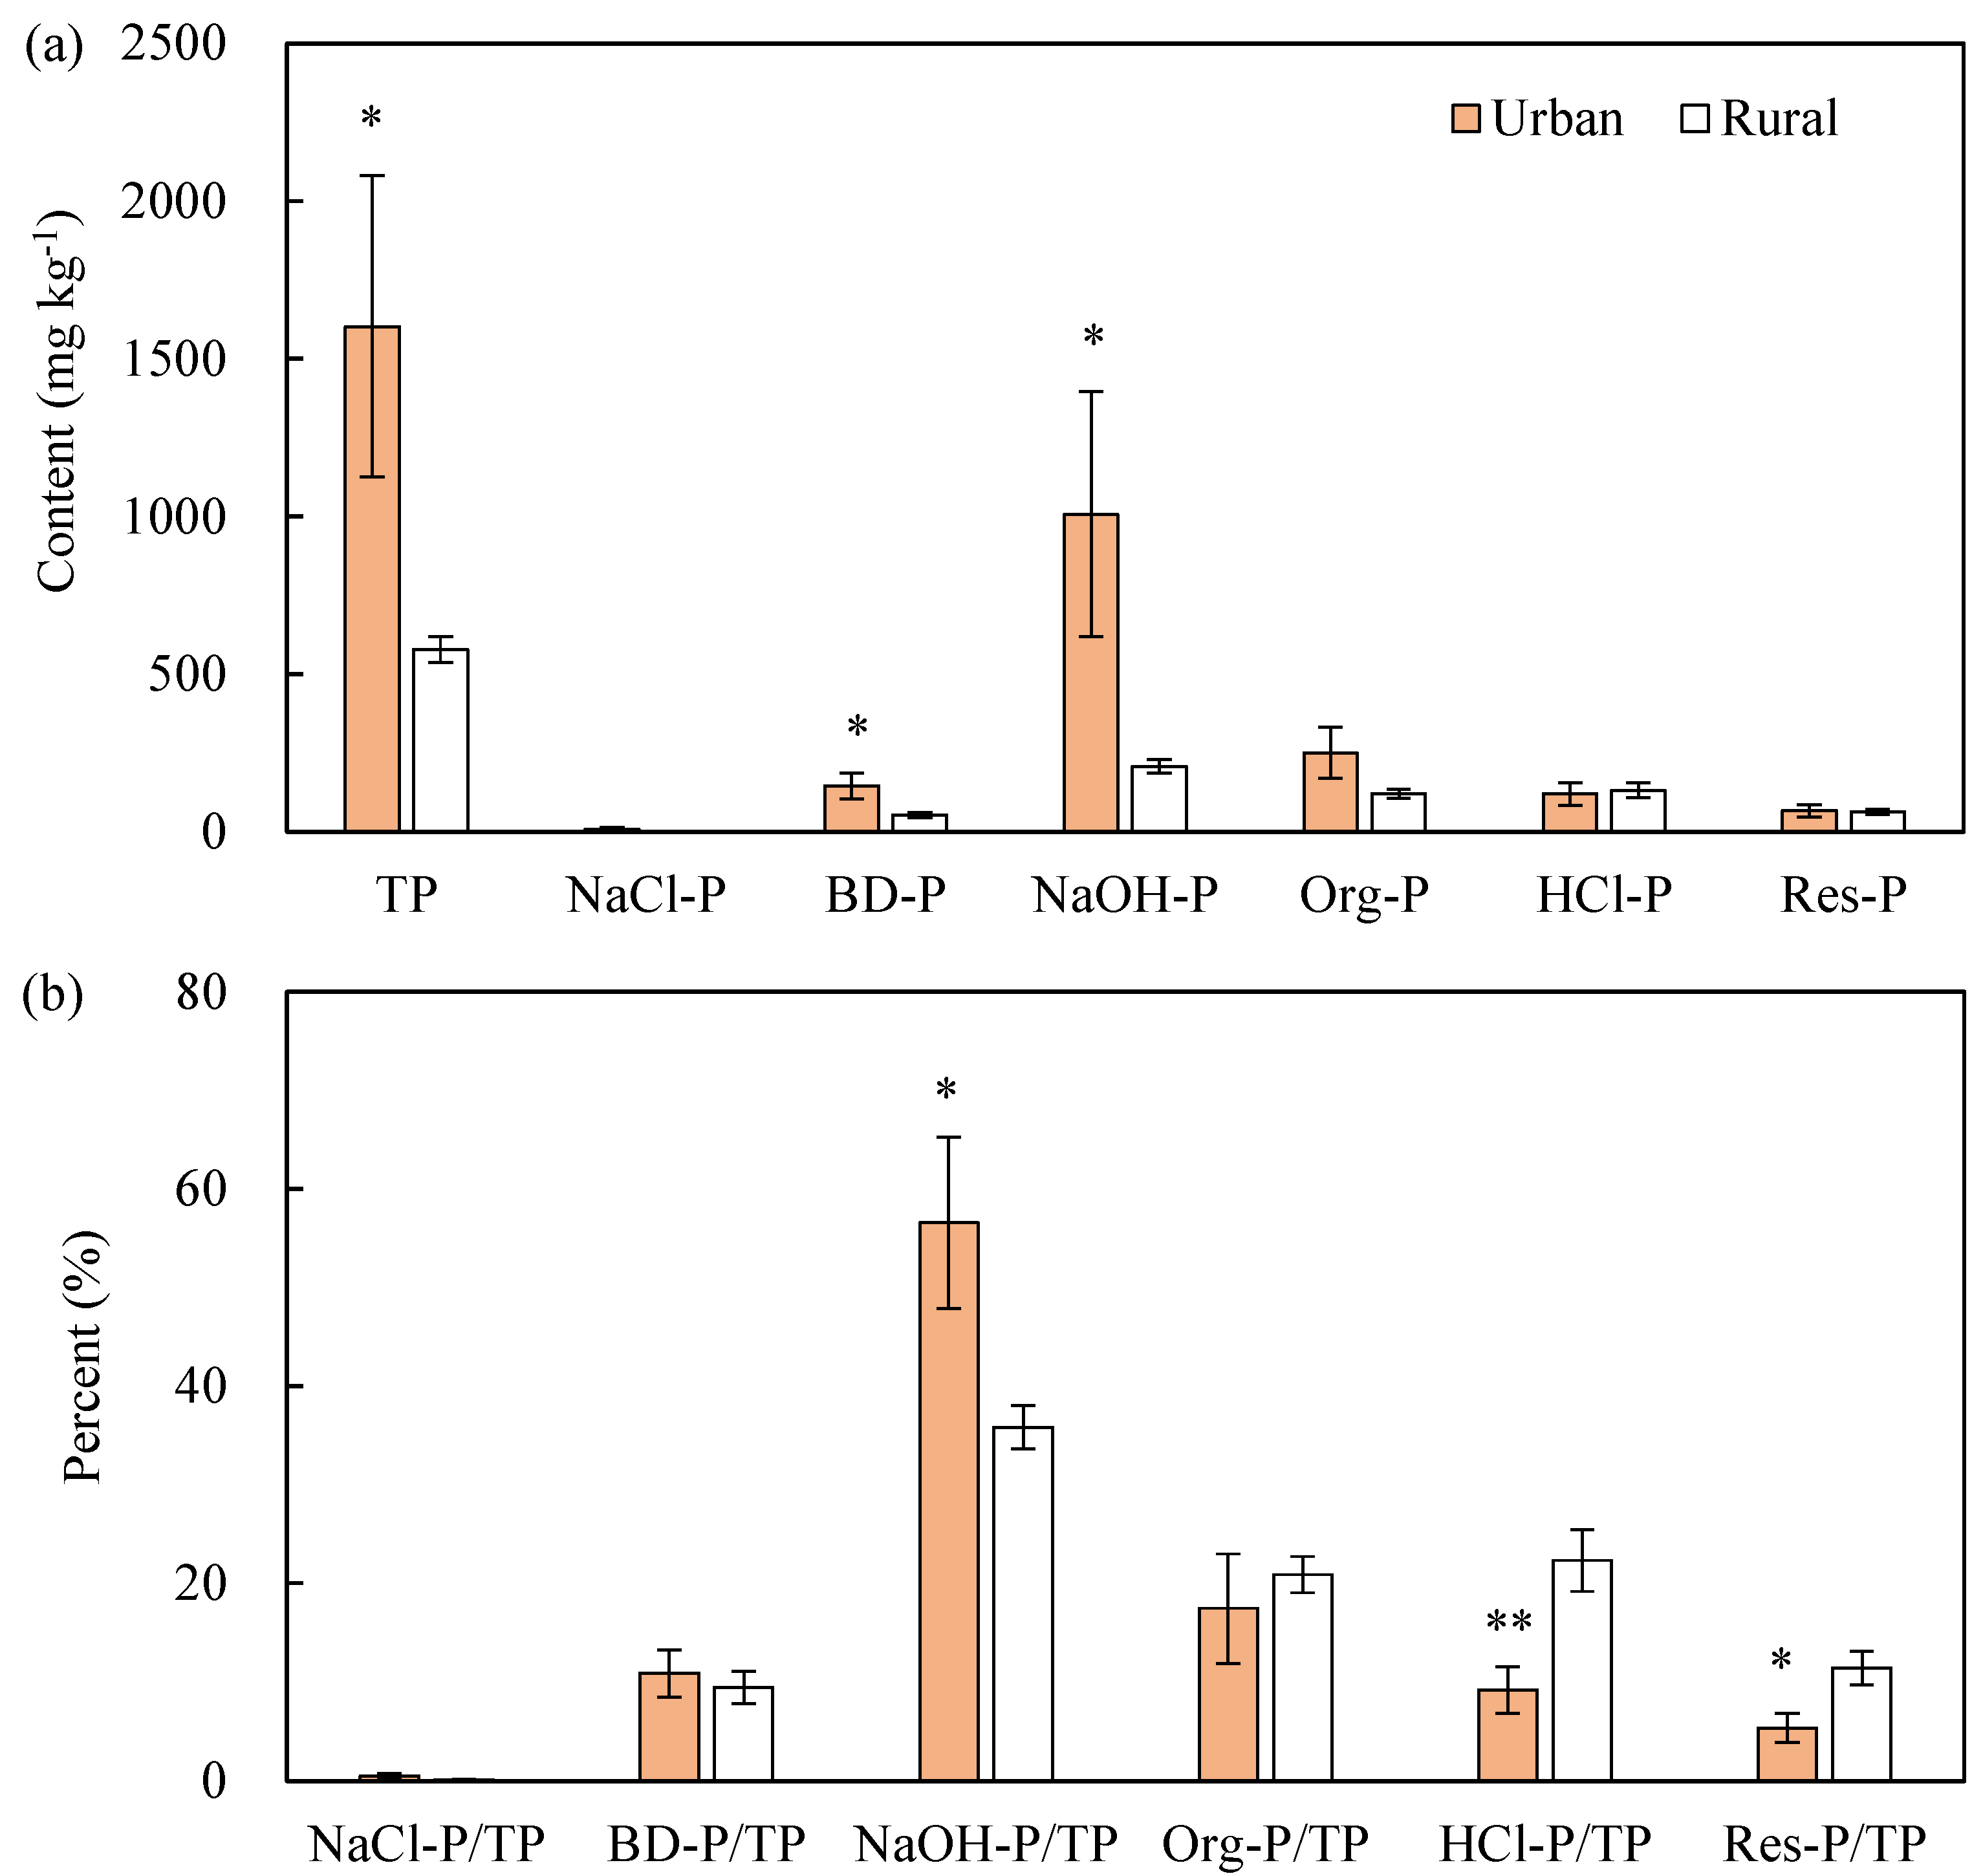
3.3. P and N in Sediments

Sediment TN was greater than 2 mg·g−1 in BST and SQ and less than 0.5 mg·g−1 in HB. In the other eight rivers, sediment TN varied between 1 and 2 mg·g−1 (Figure 5). For all rivers, sediment TP levels were highest in NF and SQ. Sediment TP levels in SWL and PH were lower than in NF and SQ, however, these levels were higher than the TP levels in the other seven rivers. The detailed TP and P forms in the surface sediments for the eleven studied rivers were listed in the Table S5, and the ratio of different P forms to TP were summarized in Table S6 in the supplementary material. Statistical analyses indicated that surface sediment TP levels were significantly higher in the urban rivers than in the rural rivers (Figure 6a). BD-P and NaOH-P levels were both significantly greater in urban rivers than in rural rivers. NaCl-P, Org-P, HCl-P, and Res-P levels were similar across the two groups of rivers. The NaOH/TP ratios were significantly greater in the urban rivers, whereas the HCl-P/TP and Res-P/TP ratios were significantly lower in the urban compared with rural rivers. The percentages of NaCl-P, BD-P, and Org-P in TP were similar in both river types (Figure 6b).
Figure 5. Distributions of TN (total nitrogen) and TP (total phosphorus) in sediment cores from 11 rivers flowing into Lake Chaohu.
Water 07 04523 g005
Figure 6. TP and P fractions (a); and percentages of P fractions of TP (b) in surface sediments (0–2 cm depth) from the urban and rural rivers flowing into Lake Chaohu. NaCl-P = P extracted by NaCl; BD-P = P extracted by Na2S2O4 and NaHCO3; NaOH-P = P extracted by NaOH; Org-P = organic P; HCl-P = P extracted by HCl; Res-P = residual P. * (p < 0.05) and ** (p < 0.01) indicate significant differences between the urban and rural rivers (t test).
Water 07 04523 g006

4. Discussion

In rivers discharging into Lake Chaohu, the most polluted rivers are those that flow through urban areas (NF, SWL, PH, and SQ) [27]. Our results further indicated that there were higher P and N levels in rivers flowing through urban areas before entering Lake Chaohu than those flowing through rural areas (Figure 2). In addition, the N and P forms were also significantly different between rivers flowing through urban areas and the rural areas (Figure 3 and Figure 4).
In the urban rivers, the elevated level of three basic components (PP, SRP, DNP) of P resulted in a significant higher TP compared with rural rivers. It should be noted that SRP increased at a greater rate than TP, PP, and DNP. Five rivers flowing through cities received large quantities of wastewater [28]. It has been verified that P from wastewater treatment effluent is primarily composed of TDP, and TDP primarily consists of SRP [29]. There is a positive correlation between SRP in wastewater treatment plant effluent and SRP in the receiving river [30,31]. This may be why there were higher TP and SRP levels and larger SRP/TP proportion in urban rivers. Surface runoff is a main way for P entering into rural rivers, and the major P form in surface runoff from soil is PP [32]. This explains why there was a significantly higher percentage of PP/TP in the rural rivers compared with the urban rivers in this study.
The elevated levels of TP in surface sediment of the urban rivers were attributed to rise in BD-P and NaOH-P (Figure 6). Both of these fractions correspond to metal-bound P. Specifically, BD-P, also called Fe-P, is a redox-sensitive form of P bound to reducible Fe and Mn oxides, and NaOH-P correspond to P bound to Al oxides and non-reducible Fe oxides [25,33]. Fe-P is positively correlated with TP and SRP in water [34], and higher levels of Fe-P have been detected in more heavily polluted sediments [35]. NaCl-P is P loosely adsorbed onto sediment particles and P in pore water [36], and thus, this P fraction has a high likelihood of being released [37]. These traits made NaCl-P more likely to be found at greater levels in the urban rivers than in the rural rivers, in terms of both the content and percentage of P (Figure 6), although no significant differences were identified between the two groups. HCl-P mainly corresponds to P bound to carbonates and apatite-P [33]. HCl-P is typically determined by the geology and geochemistry of the studied basin and generally mirrors the characteristics of the basin. For this reason, HCl-P was similar in both urban and rural rivers. However, the HCl-P/TP ratio in urban rivers was lower than the rural rivers due to the raise of TP and the stability of HCl-P in urban rivers. Res-P represents the refractory organic P and inert inorganic P fractions [25]. Res-P levels were similar between the urban and rural rivers, and TP in urban rivers were higher than the rural rivers. Thus, we observed the lower Res-P to TP ratio in urban rivers.
In Chaohu and other basins, urban rivers receive large amounts of N pollutants from wastewater effluent [9,11,27], which explains the higher levels of TN in the urban rivers in our study (Figure 4). The higher TN levels in urban rivers resulted from raise of PN, NH4+, NO3, and NO2 (Figure 4). In previous study there were also higher NH4+ in NF, SWL, PH, and SQ rivers that flowing through urban areas [27]. Ammonium is the greatest N form in rivers receiving effluent from urban sources [9,38,39]. This is why we observed the higher NH4+ concentration and larger NH4+/TN ratio in urban rivers. The high levels of NH4+ in urban rivers also correlated with lower DO levels (Table 1). For the rural rivers, relatively higher DO levels were found in the water (Table 1), which supported high NO3 levels also found in rural rivers. However, there was no difference in NO3/TN and NO2/TN ratios between the two river types because NO3, NO2 and TN increased at similar rates. PN originates from phytoplankton, plankton, bacteria, and organic detritus found in water [23], whereas effluent from wastewater treatment plants contain large quantities of organic particulate matter [11]. Thus, PN levels in the urban rivers were greater than those in the rural rivers. However, PN levels increased less than TN levels, resulting in a reduced PN/TN ratio in the urban rivers compared with the rural rivers.
The urban rivers NF, SWL, TX, and PH are located in the northwestern region of the Lake Chaohu basin. Flow rates for NF, SWL, and PH were 14.3, 3.49, and 12.7 m3·s−1, respectively. SQ, located in the northeast, had a flow rate of 1.3 m3·s−1 [27]. Therefore, most of the pollutants from urban flows have been deposited in the western part of Lake Chaohu. These pollutants are mainly comprised of SRP and NH4+, suggesting that urbanization is responsible for the large quantity of SRP and NH4+ that has entered West Lake Chaohu over the past three decades. SRP has a greater capacity to facilitate river eutrophication [30]. Ammonium is also a key factor in determining the distribution of algal species and cyanobacteria blooms in freshwater ecosystems [14]. Cyanobacteria levels increase with higher NH4+/oxidized N ratios [15], and raise in NH4+ in N sources enhance competition by Microcystis [12]. These factors explain the extensive algal blooms that occur in West Lake Chaohu during the spring and summer [17,40]. Furthermore, decreases in SRP found in wastewater treatment plant effluent result in decreases in SRP concentrations in receiving rivers [31]. A reduction of SRP and NH4+ in river bodies will decrease their concentrations in the receiving lake and mitigate both eutrophication and algal blooms [5]. Thus, to reduce eutrophication and algal blooms in Lake Chaohu, we must first reduce the levels of SRP and NH4+ flowing into NF, SWL, TX, PH, and SQ.

5. Conclusions

This study indicates that there were higher levels of TP and TN in rivers flowing through urban areas than those flowing through rural regions. Higher TP levels in urban rivers were attributed to the higher PP, DNP, and SRP. Compared with rural rivers, there were higher SRP/TP ratios and lower DNP/TP and PP/TP ratios in urban rivers. The higher TN levels in urban rivers resulted from increases in PN, NH4+, NO3, and NO2. NH4+/TN ratios were higher and PN/TN and DON/TN were lower in urban rivers compared with rural rivers. NO3/TN and NO2/TN occurred at similar levels in both river types. Surface sediment TP, BD-P, and NaOH-P were significantly higher in urban rivers than in rural rivers. NaOH-P/TP ratios were significantly greater in urban rivers, whereas HCl-P/TP and Res-P/TP were significantly lower than in rural rivers. Due to the higher TN and TP levels and NH4+/TN and SRP/TP ratios in the urban rivers, urban rivers transferred a large quantity of NH4+ and SRP into Lake Chaohu. Of the five urban rivers, four were located to the northwest of Lake Chaohu and resulted in more serious eutrophication and algal blooms in the western region of the lake. To mitigate eutrophication and algal blooms in Chaohu, we must first reduce SRP and NH4+ levels flowing into NF, SWL, TX, PH, and SQ from urban areas.

Supplementary Files

Supplementary File 1

Acknowledgments

The study was funded by the State Major Project for Water Pollution Control and Management (2012ZX07103-005) and the National Natural Science Foundation of China (41103033). We sincerely thank Zhaode Wang, Qiushi Shen and Xiaozhi Gu for their suggestions during the preparation of this manuscript.

Author Contributions

This study was designed by Lei Zhang. Field sampling was conducted by Shiguang Shao, Lei Zhang and Cheng Liu. Chemical analysis in the laboratory was performed by Tingting Xu, Cheng Liu and Shiguang Shao. The manuscript was prepared by Lei Zhang and revised by Chengxin Fan.

Conflicts of Interest

The authors declare no conflict of interest.

References

  1. Heisler, J.; Glibert, P.; Burkholder, J.M.; Anderson, D.; Cochlan, W.; Dennison, W.; Dortch, Q.; Gobler, C.; Heil, C.; Humphries, E. Eutrophication and harmful algal blooms: A scientific consensus. Harmful Algae 2008, 8, 3–13. [Google Scholar] [CrossRef]
  2. Smith, V.H.; Schindler, D.W. Eutrophication science: Where do we go from here? Trends Ecol. Evol. 2009, 24, 201–207. [Google Scholar] [CrossRef] [PubMed]
  3. Paerl, H.W.; Fulton, R.S.; Moisander, P.H.; Dyble, J. Harmful freshwater algal blooms, with an emphasis on cyanobacteria. Sci. World J. 2001, 1, 76–113. [Google Scholar] [CrossRef] [PubMed]
  4. Anderson, D.M.; Cembella, A.D.; Hallegraeff, G.M. Progress in understanding harmful algal blooms: Paradigm shifts and new technologies for research, monitoring, and management. Ann. Rev. Mar. Sci. 2012, 4, 143–176. [Google Scholar] [CrossRef] [PubMed]
  5. Conley, D.J.; Paerl, H.W.; Howarth, R.W.; Boesch, D.F.; Seitzinger, S.P.; Havens, K.E.; Lancelot, C.; Likens, G.E. Controlling eutrophication: Nitrogen and phosphorus. Science 2009, 323, 1014–1015. [Google Scholar] [CrossRef] [PubMed]
  6. Qin, B.; Xu, H.; Dong, B. The Principle and Practice of Eutrophic Lake Restoration and Management; Higher Education Press: Beijing, China, 2011. [Google Scholar]
  7. Paerl, H.W.; Gardner, W.S.; McCarthy, M.J.; Peierls, B.L.; Wilhelm, S.W. Algal blooms: Noteworthy nitrogen. Science 2014, 346. [Google Scholar] [CrossRef] [PubMed]
  8. Howarth, R.; Sharpley, A.; Walker, D. Sources of nutrient pollution to coastal waters in the United States: Implications for achieving coastal water quality goals. Estuaries 2002, 25, 656–676. [Google Scholar] [CrossRef]
  9. Yu, Y.; Wu, J.; Wang, X.Y.; Zhang, Z.M. Degradation of inorganic nitrogen in Beiyun River of Beijing, China. Procedia Environ. Sci. 2012, 13, 1069–1075. [Google Scholar] [CrossRef]
  10. Mao, G.; Yang, L.; Yan, W.; Lei, K. The influence of pollutant inputs from the major tributaries on water quality of Chaohu Lake. J. Agro Environ. Sci. 2014, 33, 141–147. [Google Scholar]
  11. Paul, M.J.; Meyer, J.L. Streams in the Urban Landscape. In Urban Ecology; Marzluff, J.M., Shulenberger, E., Endlicher, W., Alberti, M., Bradley, G., Ryan, C., Simon, U., ZumBrunnen, C., Eds.; Springer: New York, NY, USA, 2008. [Google Scholar]
  12. Zhou, T. The Role of Nitrogen in Bloom Formation and Maintenance of Lake Taihu. Master’s Thesis, Nanjing University, Nanjing, China, 26 May 2013. [Google Scholar]
  13. Mackey, K.R.M.; Labiosa, R.G.; Calhoun, M.; Street, J.H.; Post, A.F.; Paytan, A. Phosphorus availability, phytoplankton community dynamics, and taxon-specific phosphorus status in the Gulf of Aqaba, Red Sea. Limnol. Oceanogr. 2007, 52, 873–885. [Google Scholar] [CrossRef]
  14. Dai, G.; Shang, J.; Qiu, B. Ammonia may play an important role in the succession of cyanobacterial blooms and the distribution of common algal species in shallow freshwater lakes. Glob. Ch. Biol. 2012, 18, 1571–1581. [Google Scholar] [CrossRef]
  15. McCarthy, M.J.; James, R.T.; Chen, Y.; East, T.L.; Gardner, W.S. Nutrient ratios and phytoplankton community structure in the large, shallow, eutrophic, subtropical Lakes Okeechobee (Florida, USA) and Taihu (China). Limnology 2009, 10, 215–227. [Google Scholar] [CrossRef]
  16. Wang, S.; Dou, H. Biography of Lakes in China; Science Press: Beijing, China, 1998. [Google Scholar]
  17. Xie, P. Reading about the Histories of Cyanobacteria, Eutrophication and Geological Evolution in Lake Chaohu; Science Press: Beijing, China, 2009. [Google Scholar]
  18. Yang, L.; Lei, K.; Meng, W.; Fu, G.; Yan, W. Temporal and spatial changes in nutrients and chlorophyll-α in a shallow lake, Lake Chaohu, China: An 11-year investigation. J. Environ. Sci. 2013, 25, 1117–1123. [Google Scholar] [CrossRef]
  19. Hefei Municipal Bureau of Statistics. 3–8 Urban Population of Hefei City (2013). Available online: http://tjj.hefei.gov.cn/n7216006/n9376603/n9377097/n9377118/n36794982/36834889.html (accessed on 8 August 2015). (In Chinese)
  20. Hefei Municipal Bureau of Statistics. 3–9 Populations of Four Counties and One County-Level City in Hefei City (2013). Available online: http://tjj.hefei.gov.cn/n7216006/n9376603/n9377097/n9377118/n36794982/36834924.html (accessed on 8 August 2015). (In Chinese)
  21. Wu, L. Analysis on land-use change and ecosystem function value for the Chaohu Lake basin during past 20 years. Soils 2009, 41, 986–991. [Google Scholar]
  22. Chinese EPA. Methods for the Examination of Water and Wastewater, 4th ed.; China Environmental Science Press: Beijing, China, 2002. [Google Scholar]
  23. Worsfold, P.J.; Monbet, P.; Tappin, A.D.; Fitzsimons, M.F.; Stiles, D.A.; McKelvie, I.D. Characterisation and quantification of organic phosphorus and organic nitrogen components in aquatic systems: A review. Anal. Chim. Acta 2008, 624, 37–58. [Google Scholar] [CrossRef] [PubMed]
  24. Lukkari, K.; Hartikainen, H.; Leivuori, M. Fractionation of sediment phosphorus revisited: I Fractionation steps and their biogeochemical basis. Limnol. Oceanogr. Meth. 2007, 5, 433–444. [Google Scholar] [CrossRef]
  25. Rydin, E. Potentially mobile phosphorus in Lake Erken sediment. Water Res. 2000, 34, 2037–2042. [Google Scholar] [CrossRef]
  26. Ruban, V.; López-Sánchez, J.; Pardo, P.; Rauret, G.; Muntau, H.; Quevauviller, P. Selection and evaluation of sequential extraction procedures for the determination of phosphorus forms in lake sediment. J. Environ. Monit. 1999, 1, 51–56. [Google Scholar] [CrossRef] [PubMed]
  27. Wang, S.; Jiang, X.; Jin, X. Classification and pollution characteristic analysis for inflow rivers of Chaohu Lake. Environ. Sci. 2011, 32, 2834–2839. [Google Scholar]
  28. Ji, L.; Li, J.; Wang, J. Research on water environmental capacity in Nanfeihe River in Hefei city. J. Anhui Univ. Nat. Sci. 2004, 28, 71–75. [Google Scholar]
  29. Dueñas, J.F.; Alonso, J.R.; Rey, À.F.; Ferrer, A.S. Characterisation of phosphorous forms in wastewater treatment plants. J. Hazard. Mater. 2003, 97, 193–205. [Google Scholar] [CrossRef]
  30. Jarvie, H.P.; Neal, C.; Withers, P.J.A. Sewage-effluent phosphorus: A greater risk to river eutrophication than agricultural phosphorus? Sci. Total Environ. 2006, 360, 246–253. [Google Scholar] [CrossRef] [PubMed]
  31. Neal, C.; Martin, E.; Neal, M.; Hallett, J.; Wickham, H.D.; Harman, S.A.; Armstrong, L.K.; Bowes, M.J.; Wade, A.J.; Keay, D. Sewage effluent clean-up reduces phosphorus but not phytoplankton in lowland chalk stream (River Kennet, UK) impacted by water mixing from adjacent canal. Sci. Total Environ. 2010, 408, 5305–5316. [Google Scholar] [CrossRef] [PubMed]
  32. Uusitalo, R.; Turtola, E.; Kauppila, T.; Lilja, T. Particulate phosphorus and sediment in surface runoff and drainflow from clayey soils. J. Environ. Qual. 2001, 30, 589–595. [Google Scholar] [CrossRef] [PubMed]
  33. Zhang, L.; Liao, Q.; Zeng, C.; Mo, Q.; Fan, C. Effects of pretreatment on the sequential phosphorus fractionation of anaerobic sediment. J. Limnol. 2014, 73, 274–281. [Google Scholar] [CrossRef]
  34. Zhu, G.; Zhang, L. Phosphorus fractions and algae availability in sediment from lakes in the middle and lower reaches of the Yangtze River. Sci. China Ser. D 2005, 35, 24–32. [Google Scholar]
  35. Wang, X.; Wang, X.; Feng, Y.; Xue, J. Study on content of total phosphorus and forms of inorganic phosphorus in sediments of Chaohu Lake. J. Soil Water Conserv. 2007, 21, 56–59. [Google Scholar]
  36. Jensen, H.S.; Thamdrup, B. Iron-bound phosphorus in marine sediments as measured by bicarbonate-dithionite extraction. Hydrobiologia 1993, 253, 47–59. [Google Scholar] [CrossRef]
  37. Meis, S.; Spears, B.M.; Maberly, S.C.; O’Malley, M.B.; Perkins, R.G. Sediment amendment with Phoslock® in Clatto Reservoir (Dundee, UK): Investigating changes in sediment elemental composition and phosphorus fractionation. J. Environ. Manag. 2012, 93, 185–193. [Google Scholar] [CrossRef] [PubMed]
  38. Liu, S.; Kong, F.; Cai, Y.; Yang, Z.; Wang, J.; Shi, X. Nitrogen stable isotope study on nitrate nitrogen pollution of four inflowing rivers of Lake Chaohu. J. Lake Sci. 2012, 24, 952–956. [Google Scholar]
  39. Zhao, Y.; Shan, B.; Zhang, W.; Wang, C. Forms and spatial distribution characteristics of nitrogen in Ziya River basin. Environ. Sci. 2014, 35, 143–149. [Google Scholar]
  40. Jiang, Y.J.; He, W.; Liu, W.X.; Qin, N.; Ouyang, H.L.; Wang, Q.M.; Kong, X.Z.; He, Q.S.; Yang, C.; Yang, B.; et al. The seasonal and spatial variations of phytoplankton community and their correlation with environmental factors in a large eutrophic Chinese lake (Lake Chaohu). Ecol. Indic. 2014, 40, 58–67. [Google Scholar] [CrossRef]

