4.1. Determination of the Operating Time
The correlations of silting rates and operating times, presented in
Figure 3 and
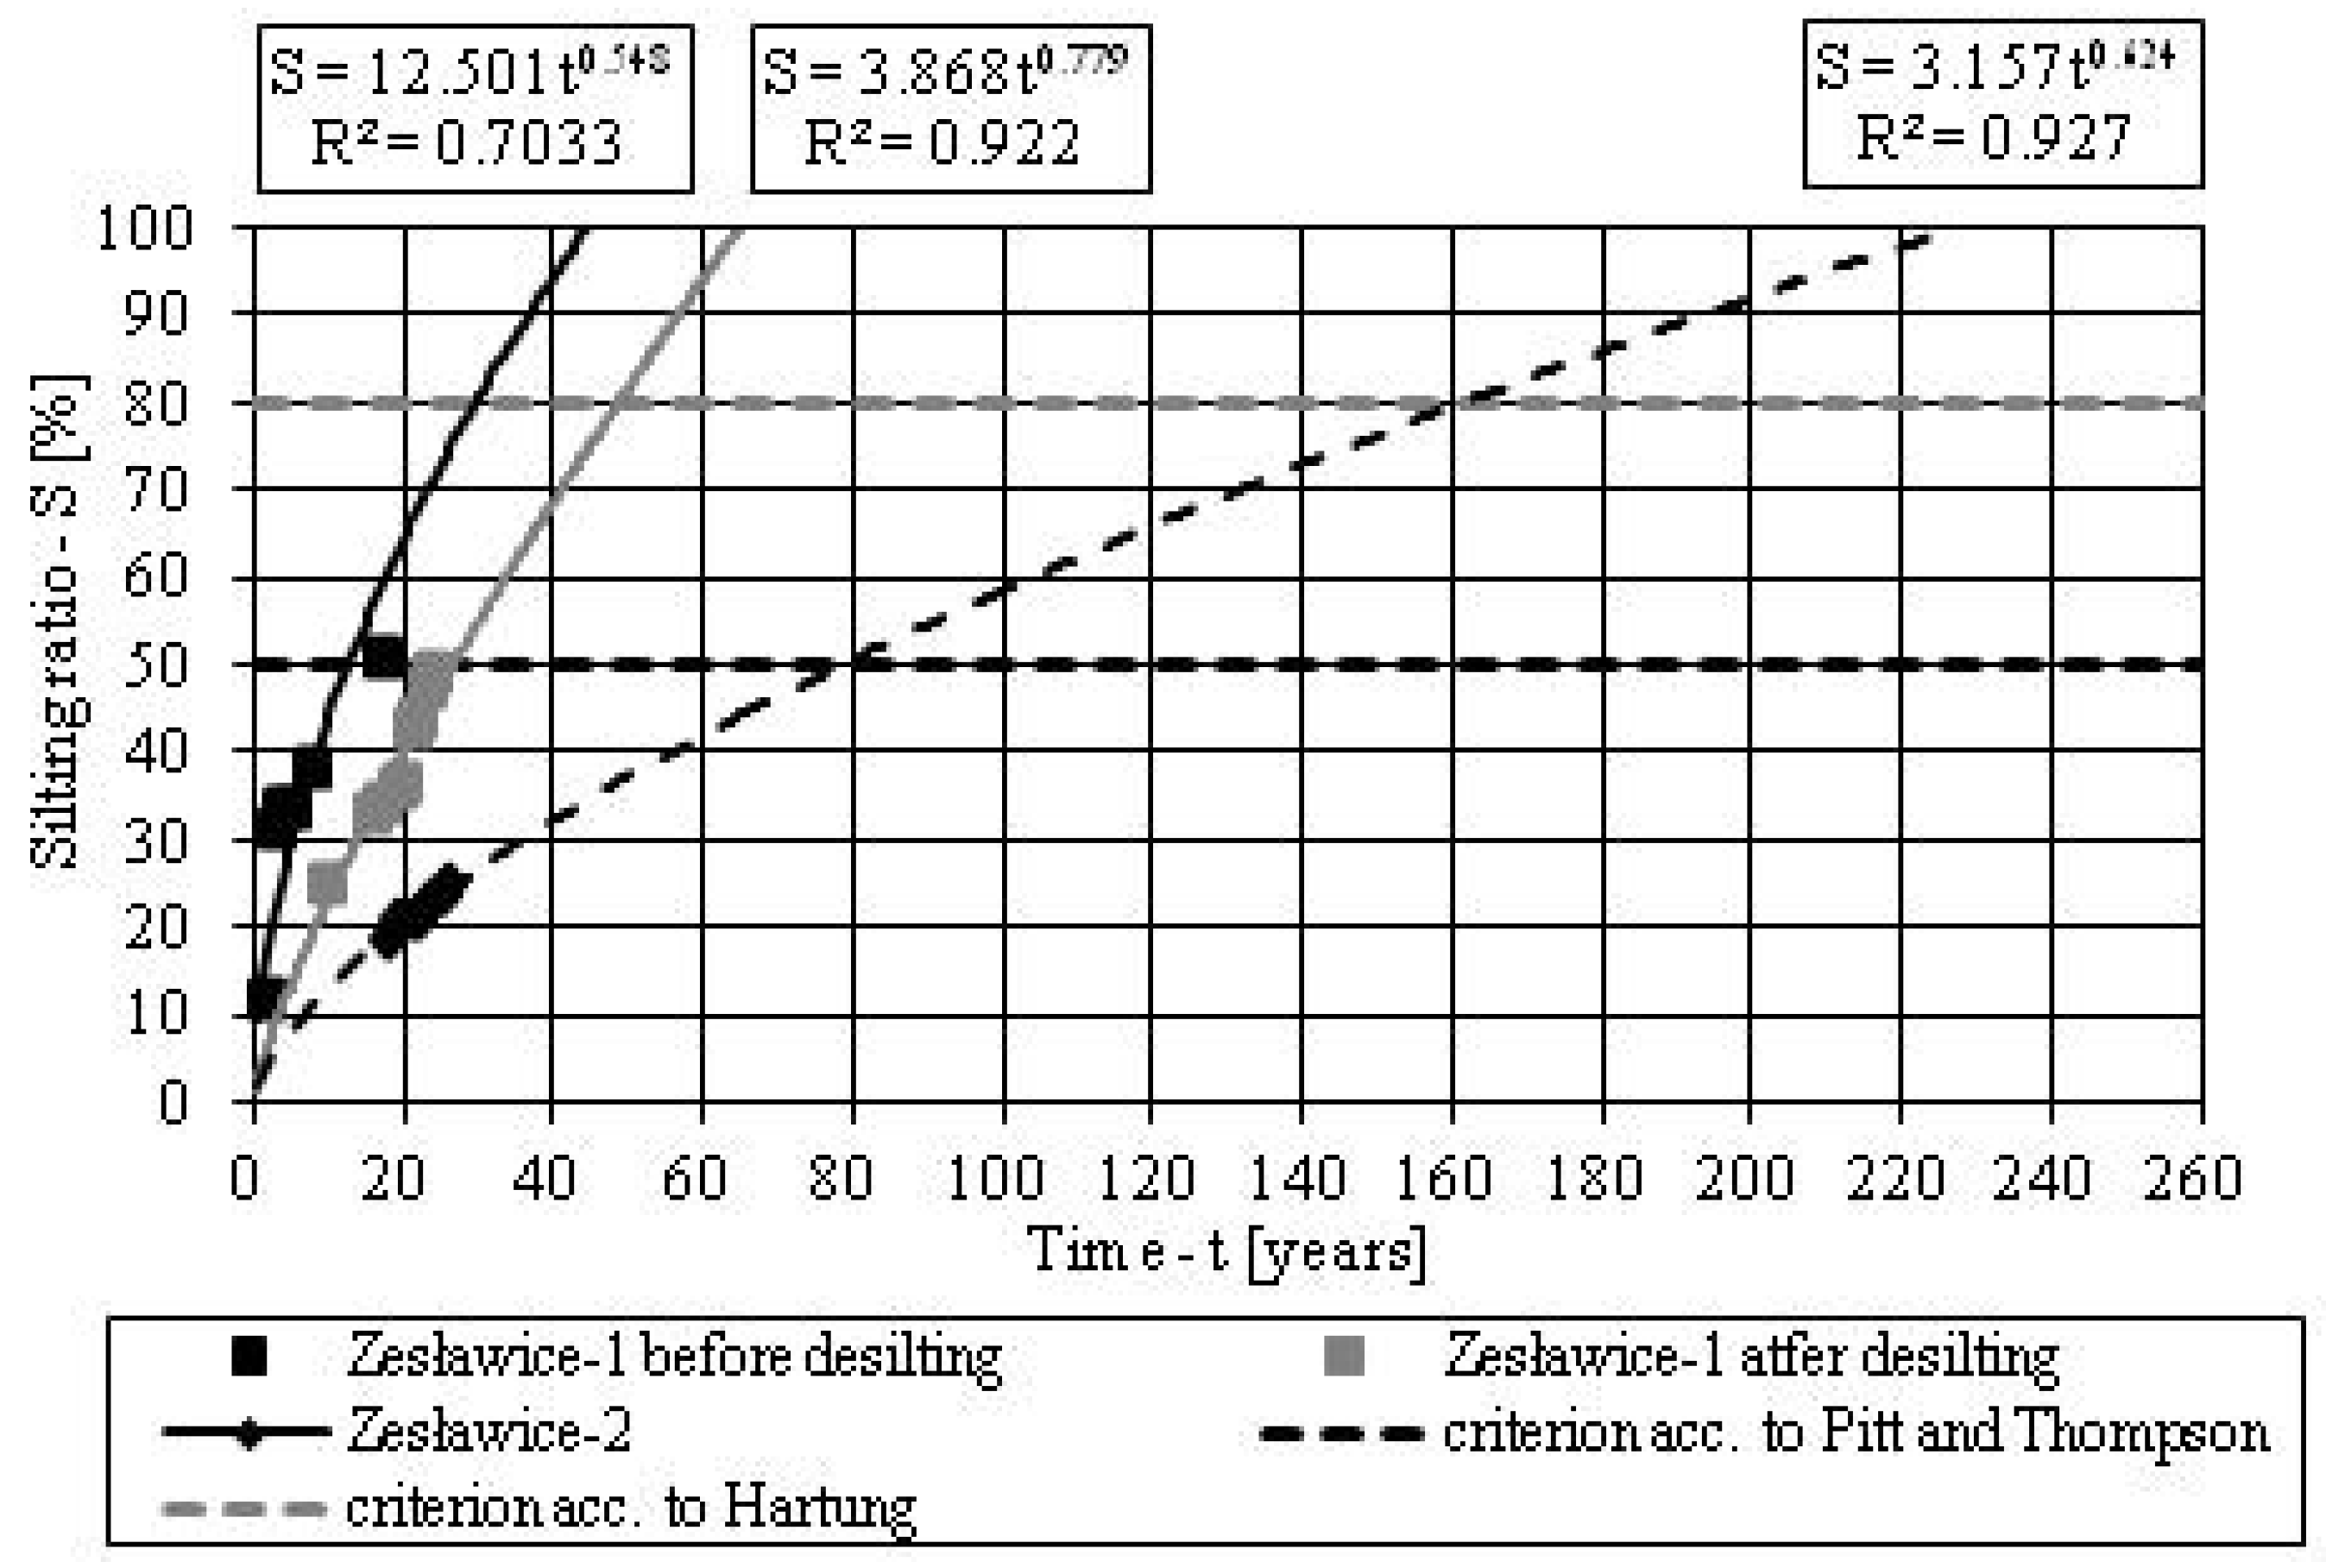
Figure 4, are respective curves predicting the volume reduction of reservoirs at Zesławice and at Krempna. Before dredging, the Zesławice-1 reservoir’s volume (
Figure 3) will be reduced by 50%, according to the criteria of Pitt and Thompson [
4], after 13 years. However, after dredging the silting time of this reservoir will be extended to 30 years of operation. This is due to the construction of the assistant reservoir (Zesławice-2), which captures a part of the incoming sediment. On the other hand, silting of the Zesławice-2 reservoir, equal to 50%, will occur after 79 years of operation. The volume reduction by 80%—according to Hartung’s criterion [
3]—will occur after a much longer time period of the reservoirs’ operation (
Figure 3).
Figure 3.
Correlation relationship between the silting rate of reservoirs at Zesławice and their time of operation.
Figure 3.
Correlation relationship between the silting rate of reservoirs at Zesławice and their time of operation.
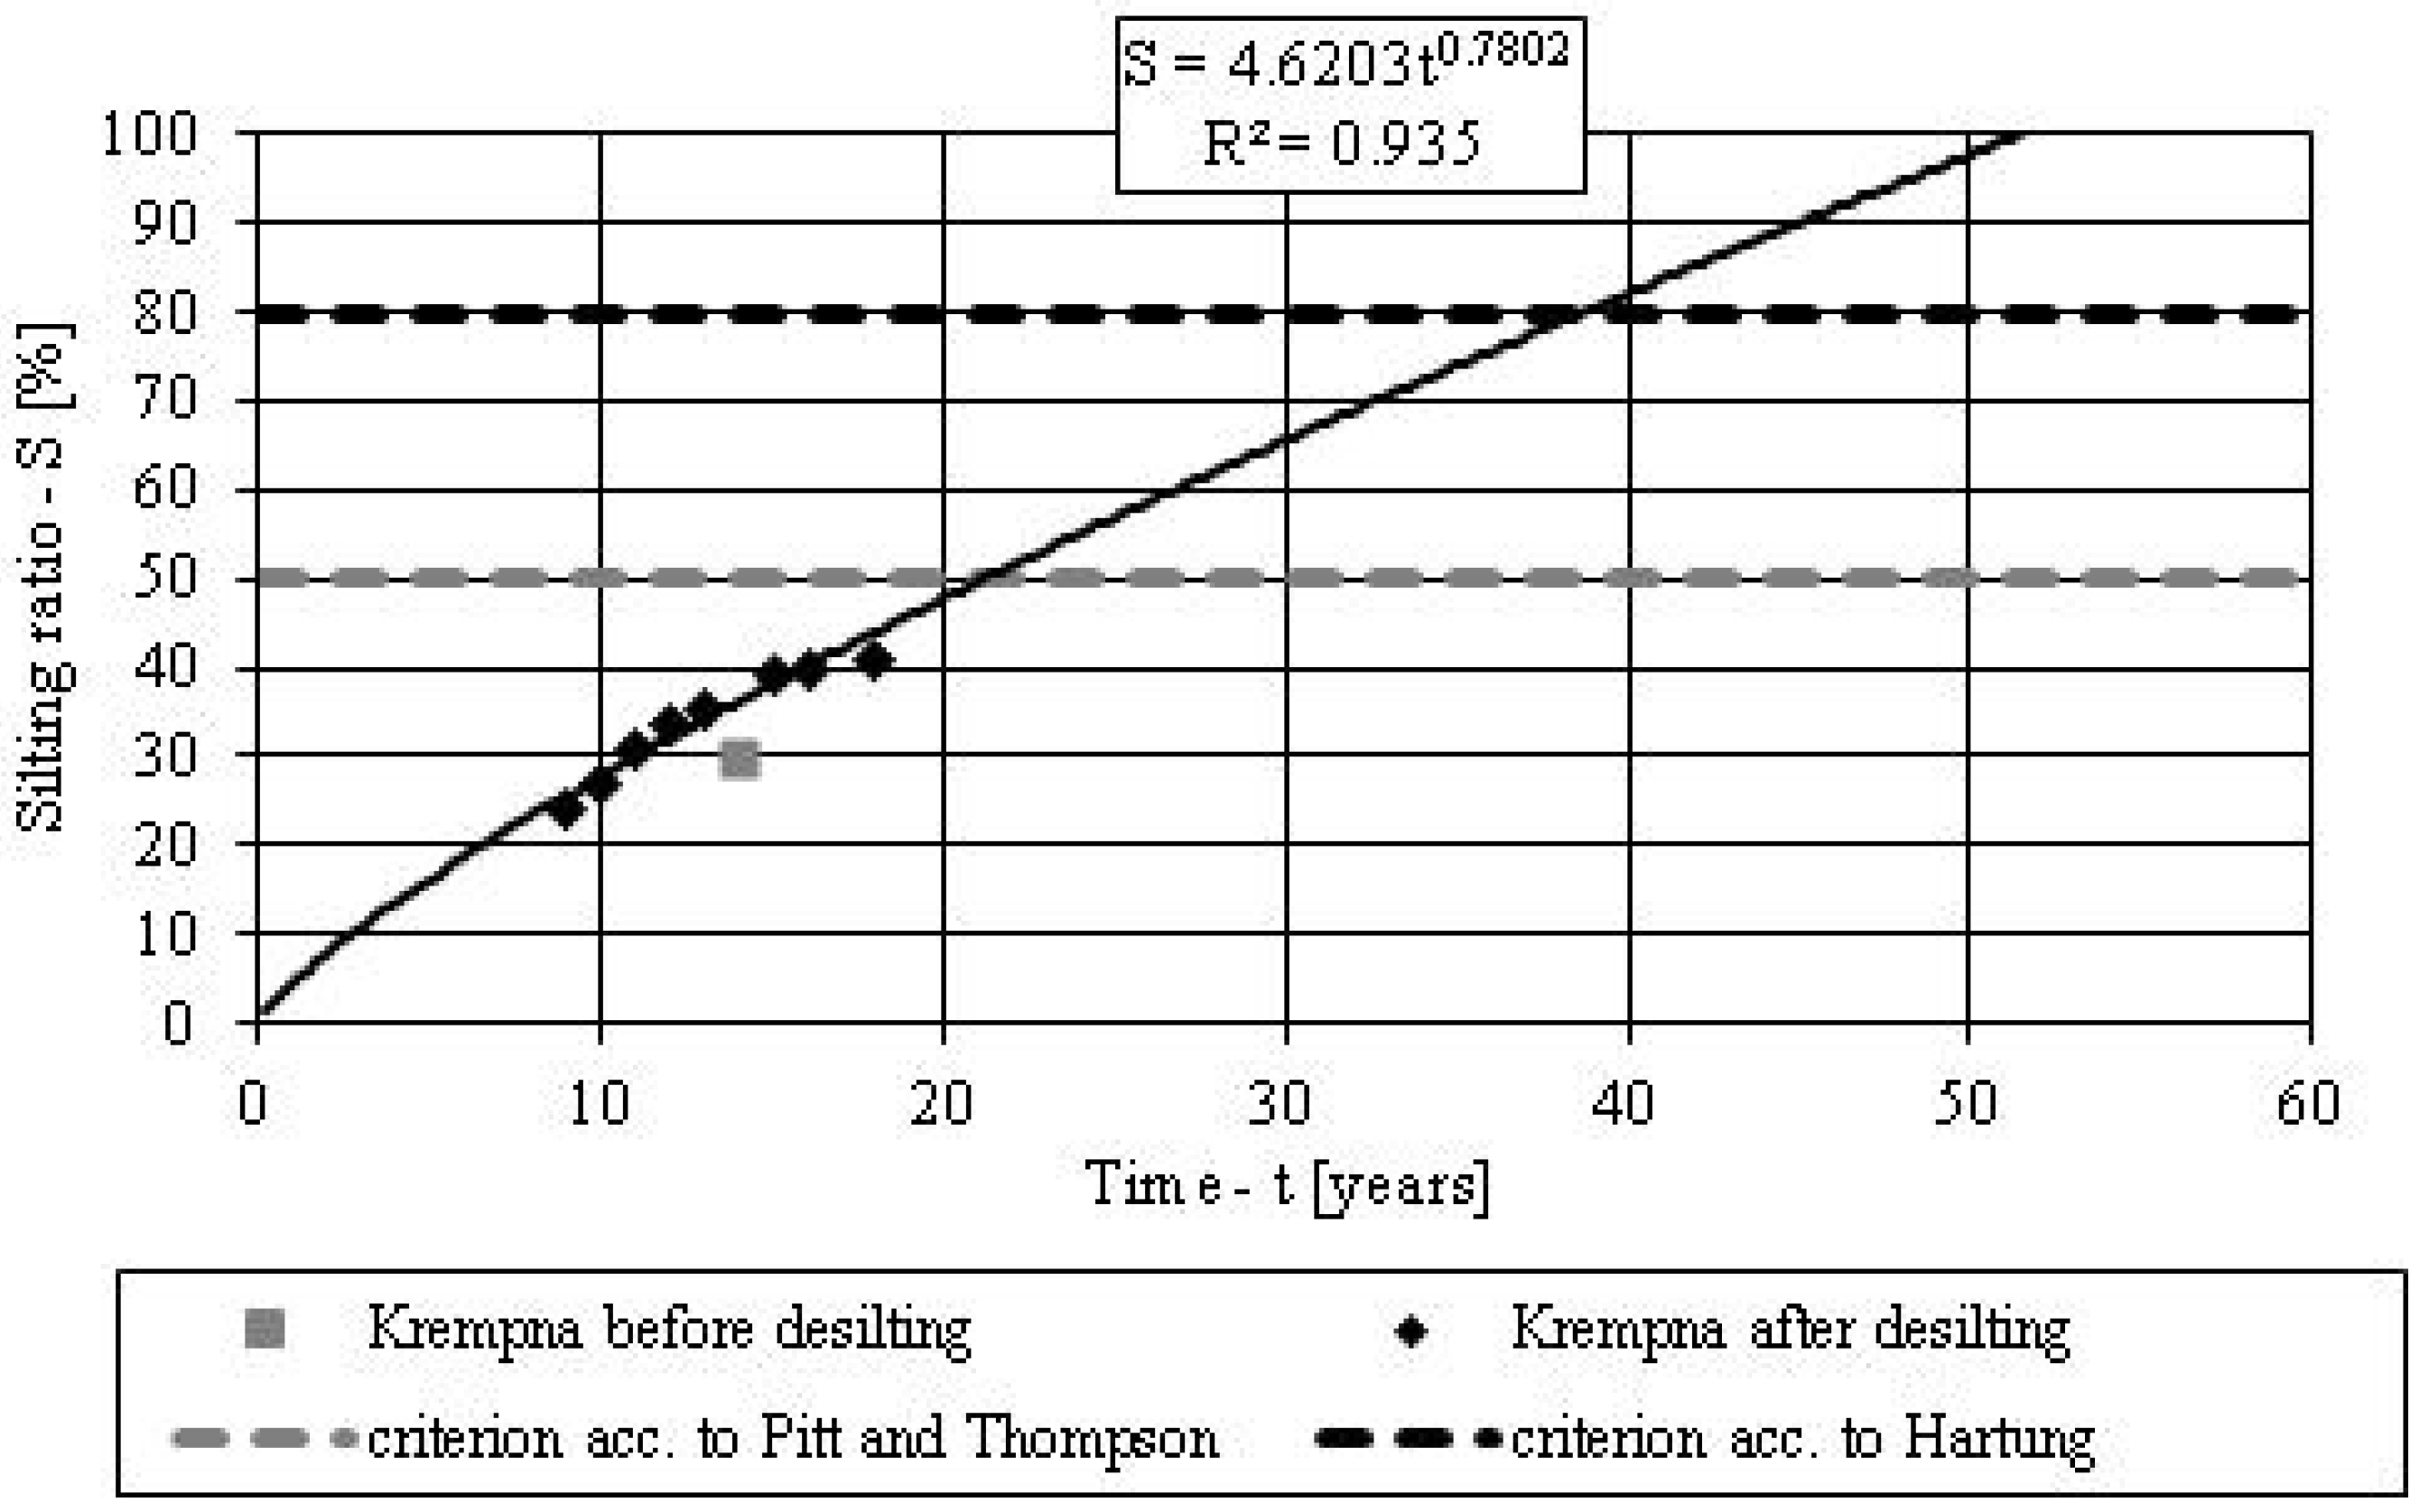
As a consequence of the fact that only one measurement of silting was performed at Krempna reservoir, the correlation between the silting rate and the operating time was not specified. After dredging, eight silting measurements were performed, which were the basis for drawing the curve, thus predicting the reduction of the reservoir’s volume (
Figure 4). Silting of the Krempna reservoir by 50% after dredging will occur after 21 years of operation.
Figure 4.
Correlation relationship between the silting rate of reservoir at Krempna and its time of operation.
Figure 4.
Correlation relationship between the silting rate of reservoir at Krempna and its time of operation.
Before dredging, the Zesławice-1 reservoir was characterized by the highest silting rate,
i.e., on average 2.7% per year. The initial capacity-inflow ratio (C-I ratio) of the main reservoir before dredging was 0.66%. The C-I ratio was determined as the proportion of the reservoir’s capacity and the average annual water inflow, while the average annual inflow is 1.09 m
3·s
−1. After dredging and redirecting part of water to Zesławice-assistant side reservoir, the average annual water inflow to Zesławice-1 decreased. Due to the separation of water into two reservoirs, the average annual water inflow to the reservoir Zesławice-1 is 0.71 m
3·s
−1 and in the reservoir Zesławice-2 it is equal to 0.38 m
3·s
−1. In such conditions, with an increase of initial capacity-inflow ratio to 1.02%, the intensity of silting in Zesławice-1 reservoir decreased, which is suggested by the average annual silting rate of this reservoir after dredging—2.1% (
Table 1). The lowest silting rate,
i.e., on average 1.0% per year, is observed in the side reservoir Zesławice-2. The initial capacity-inflow ratio of this reservoir is 1.65%.
The determined silting intensity of the examined reservoirs, amounting to an average annual of 1.0%–2.7% is higher than the average annual silting rate of small water reservoirs recorded in Great Britain. As reported by Vincent
et al. [
28], the average annual silting rate of small water reservoirs in Great Britain, determined based on the analysis of 123 reservoirs, is only 0.13%. Much more diverse values were reported by the researchers in the United States. The average annual value of silting of the water reservoir Chili Bar [
29], with a capacity of 1.25 million m
3, calculated based on 40 years of observations, reached 0.8%. On the other hand, according to Reed and Hoffman [
30], the average annual silting rate ranges from 0.57% to 2.43%. The results obtained in this study are similar to those provided by Reed and Hoffman for the reservoirs in the United States and are also close to the values characteristic of the reservoirs from the East Africa region. According to Haregeweyn
et al. [
31], the annual total capacity loss values ranged between 0.18% and 4% for 13 reservoirs in northern Ethiopia. Similar studies carried out by the Department For International Development [
32] reported silting rates ranging between 1% and 3% in Zimbabwe and 1% and 4% in Tanzania. The data given above indicate that the problem of silting intensity of small water reservoirs affects many parts of the world. One way to reduce the silting intensity of small reservoirs may be the application of residuum lodges on feeder streams immediately before the reservoir entrance. Such solution requires frequent dredging of the residuum lodges. Kay
et al. [
33] estimated that the cleared residuum lodge in reservoir with 974 × 10
3 m
3 storage capacity would take 12 years to refill. The silting rate may be also reduced by appropriate shaping of the reservoir basin, which may contribute to the reduction in the sediment trap efficiency, thus reducing the sediment deposition in the reservoir. This was evidenced by Dufresne
et al. [
34] in their experimental studies, analyzing flow patterns and sediment deposition in rectangular shallow reservoirs.
Determination of the coefficients of correlation equations (
Figure 3 and
Figure 4), being a descriptive measure of regression model fitness to data, indicates strong and very strong data correlation. Therefore, it may be concluded that the silting measurement error does not significantly affect the results. The above examples indicate that the so-called long duration operation cannot be unambiguously determined by using a specific range of years of operation. This parameter needs to be determined using the silting rate. The determination of small reservoirs’ silting rate, indicating the so-called long duration operation, was enabled by the analyses of dependency between the relative depth (h
i/H) and the relative volume (
Vi/V), developed based on the results of silting measurements and corresponding to different silting rates of the studied reservoirs, that were compared to RDSF curves (Equation (1)).
4.2. Determination of the Sediment Distribution in the Reservoirs
A change in water flow conditions at Zesławice-1 reservoir, as a consequence of redirecting part of water and sediment to the side reservoir Zesławice-2 alters the conditions of transport and sedimentation, and may affect the distribution of sediments in the reservoir, which was demonstrated on the basis of the graphs of the sediment distribution in accordance with the methodology specified by Rahmanian and Banihashemi [
17]. The results of calculations of the relative depth (
hi/H) and the relative volume (
Vi/V) of Zesławice-1 and Zesławice-2 reservoirs and Relative Depth Shape Function values for different heights from reservoir bed are presented in
Table 5 and
Table 6.
Table 5.
Relative Depth Shape Function for different elevations from reservoir bed established for Zesławice-1 reservoir.
Table 5.
Relative Depth Shape Function for different elevations from reservoir bed established for Zesławice-1 reservoir.
| Elevation (m a.s.l.) | Sum of Volume (m3) | Relative Depth hi/H | Relative Volume Vi/V | 1/α | RDSF |
|---|
| 211.60 | 0 | 0 | 0.00 | 0.00 | 0.00 |
| 211.80 | 489 | 0.06 | 0.00 | 17.00 | 0.04 |
| 212.20 | 7756 | 0.18 | 0.03 | 5.67 | 0.19 |
| 212.60 | 25,237 | 0.29 | 0.11 | 3.40 | 0.38 |
| 213.00 | 52,648 | 0.41 | 0.23 | 2.43 | 0.56 |
| 213.40 | 86,916 | 0.53 | 0.38 | 1.89 | 0.72 |
| 213.80 | 121,680 | 0.65 | 0.53 | 1.55 | 0.82 |
| 214.20 | 156,782 | 0.76 | 0.69 | 1.31 | 0.90 |
| 214.60 | 192,222 | 0.88 | 0.84 | 1.13 | 0.96 |
| 215.00 | 228,000 | 1.00 | 1.00 | 1.00 | 1.00 |
Table 6.
Relative Depth Shape Function for different elevations from reservoir bed established for Zesławice-2 reservoir.
Table 6.
Relative Depth Shape Function for different elevations from reservoir bed established for Zesławice-2 reservoir.
| Elevation (m a.s.l.) | Sum of Volume (m3) | Relative Depth hi/H | Relative Volume Vi/V | 1/α | RDSF |
|---|
| 212.85 | 0 | 0 | 0.00 | 0.00 | 0.00 |
| 213.00 | 694 | 0.07 | 0.00 | 14.33 | 0.05 |
| 213.20 | 4376 | 0.09 | 0.02 | 6.14 | 0.14 |
| 213.40 | 11,153 | 0.26 | 0.06 | 3.91 | 0.22 |
| 213.60 | 21,380 | 0.35 | 0.11 | 2.87 | 0.31 |
| 213.80 | 35,968 | 0.44 | 0.18 | 2.26 | 0.41 |
| 214.00 | 56,814 | 0.53 | 0.29 | 1.87 | 0.54 |
| 214.20 | 83,506 | 0.63 | 0.42 | 1.59 | 0.67 |
| 214.40 | 111,940 | 0.72 | 0.57 | 1.39 | 0.78 |
| 214.60 | 140,373 | 0.81 | 0.71 | 1.23 | 0.87 |
| 214.80 | 169,187 | 0.91 | 0.85 | 1.10 | 0.94 |
| 215.00 | 198,000 | 1.00 | 1.00 | 1.00 | 1.00 |
Sediment distributions before and after dredging of Zesławice-1 reservoir are presented in
Figure 5, and the sediment distribution at Zesławice-2 reservoir based on the measurements and the curve of the predicted sediment distribution is presented in
Figure 6.
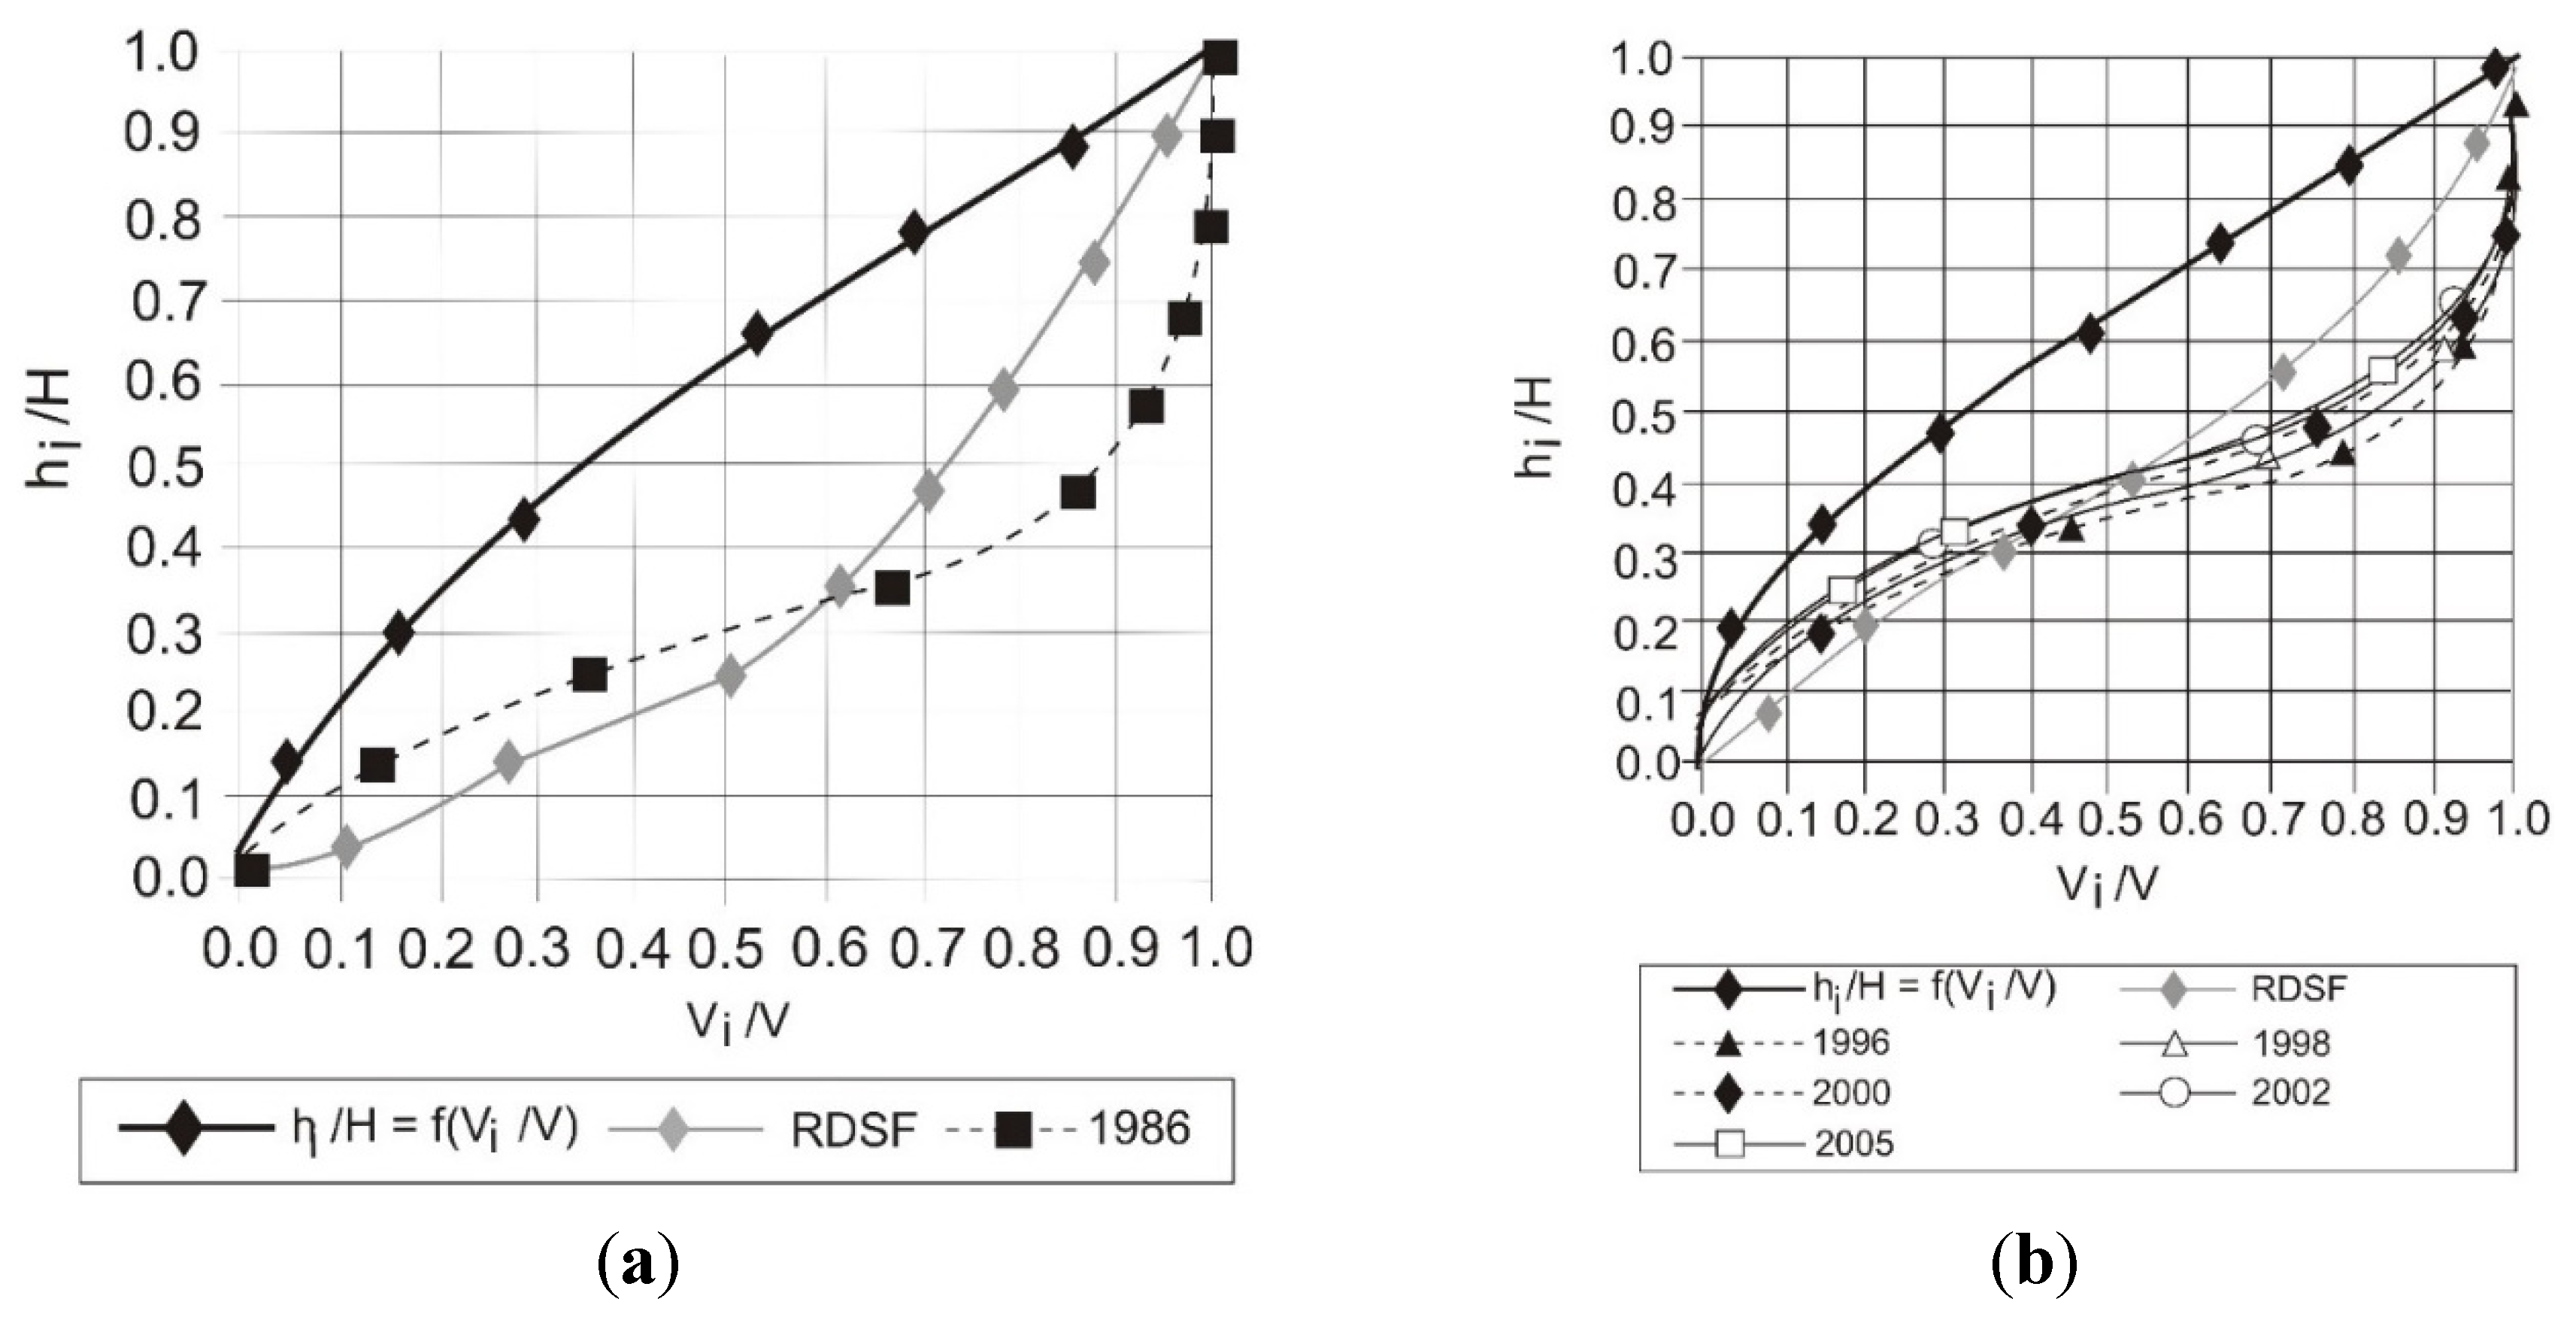
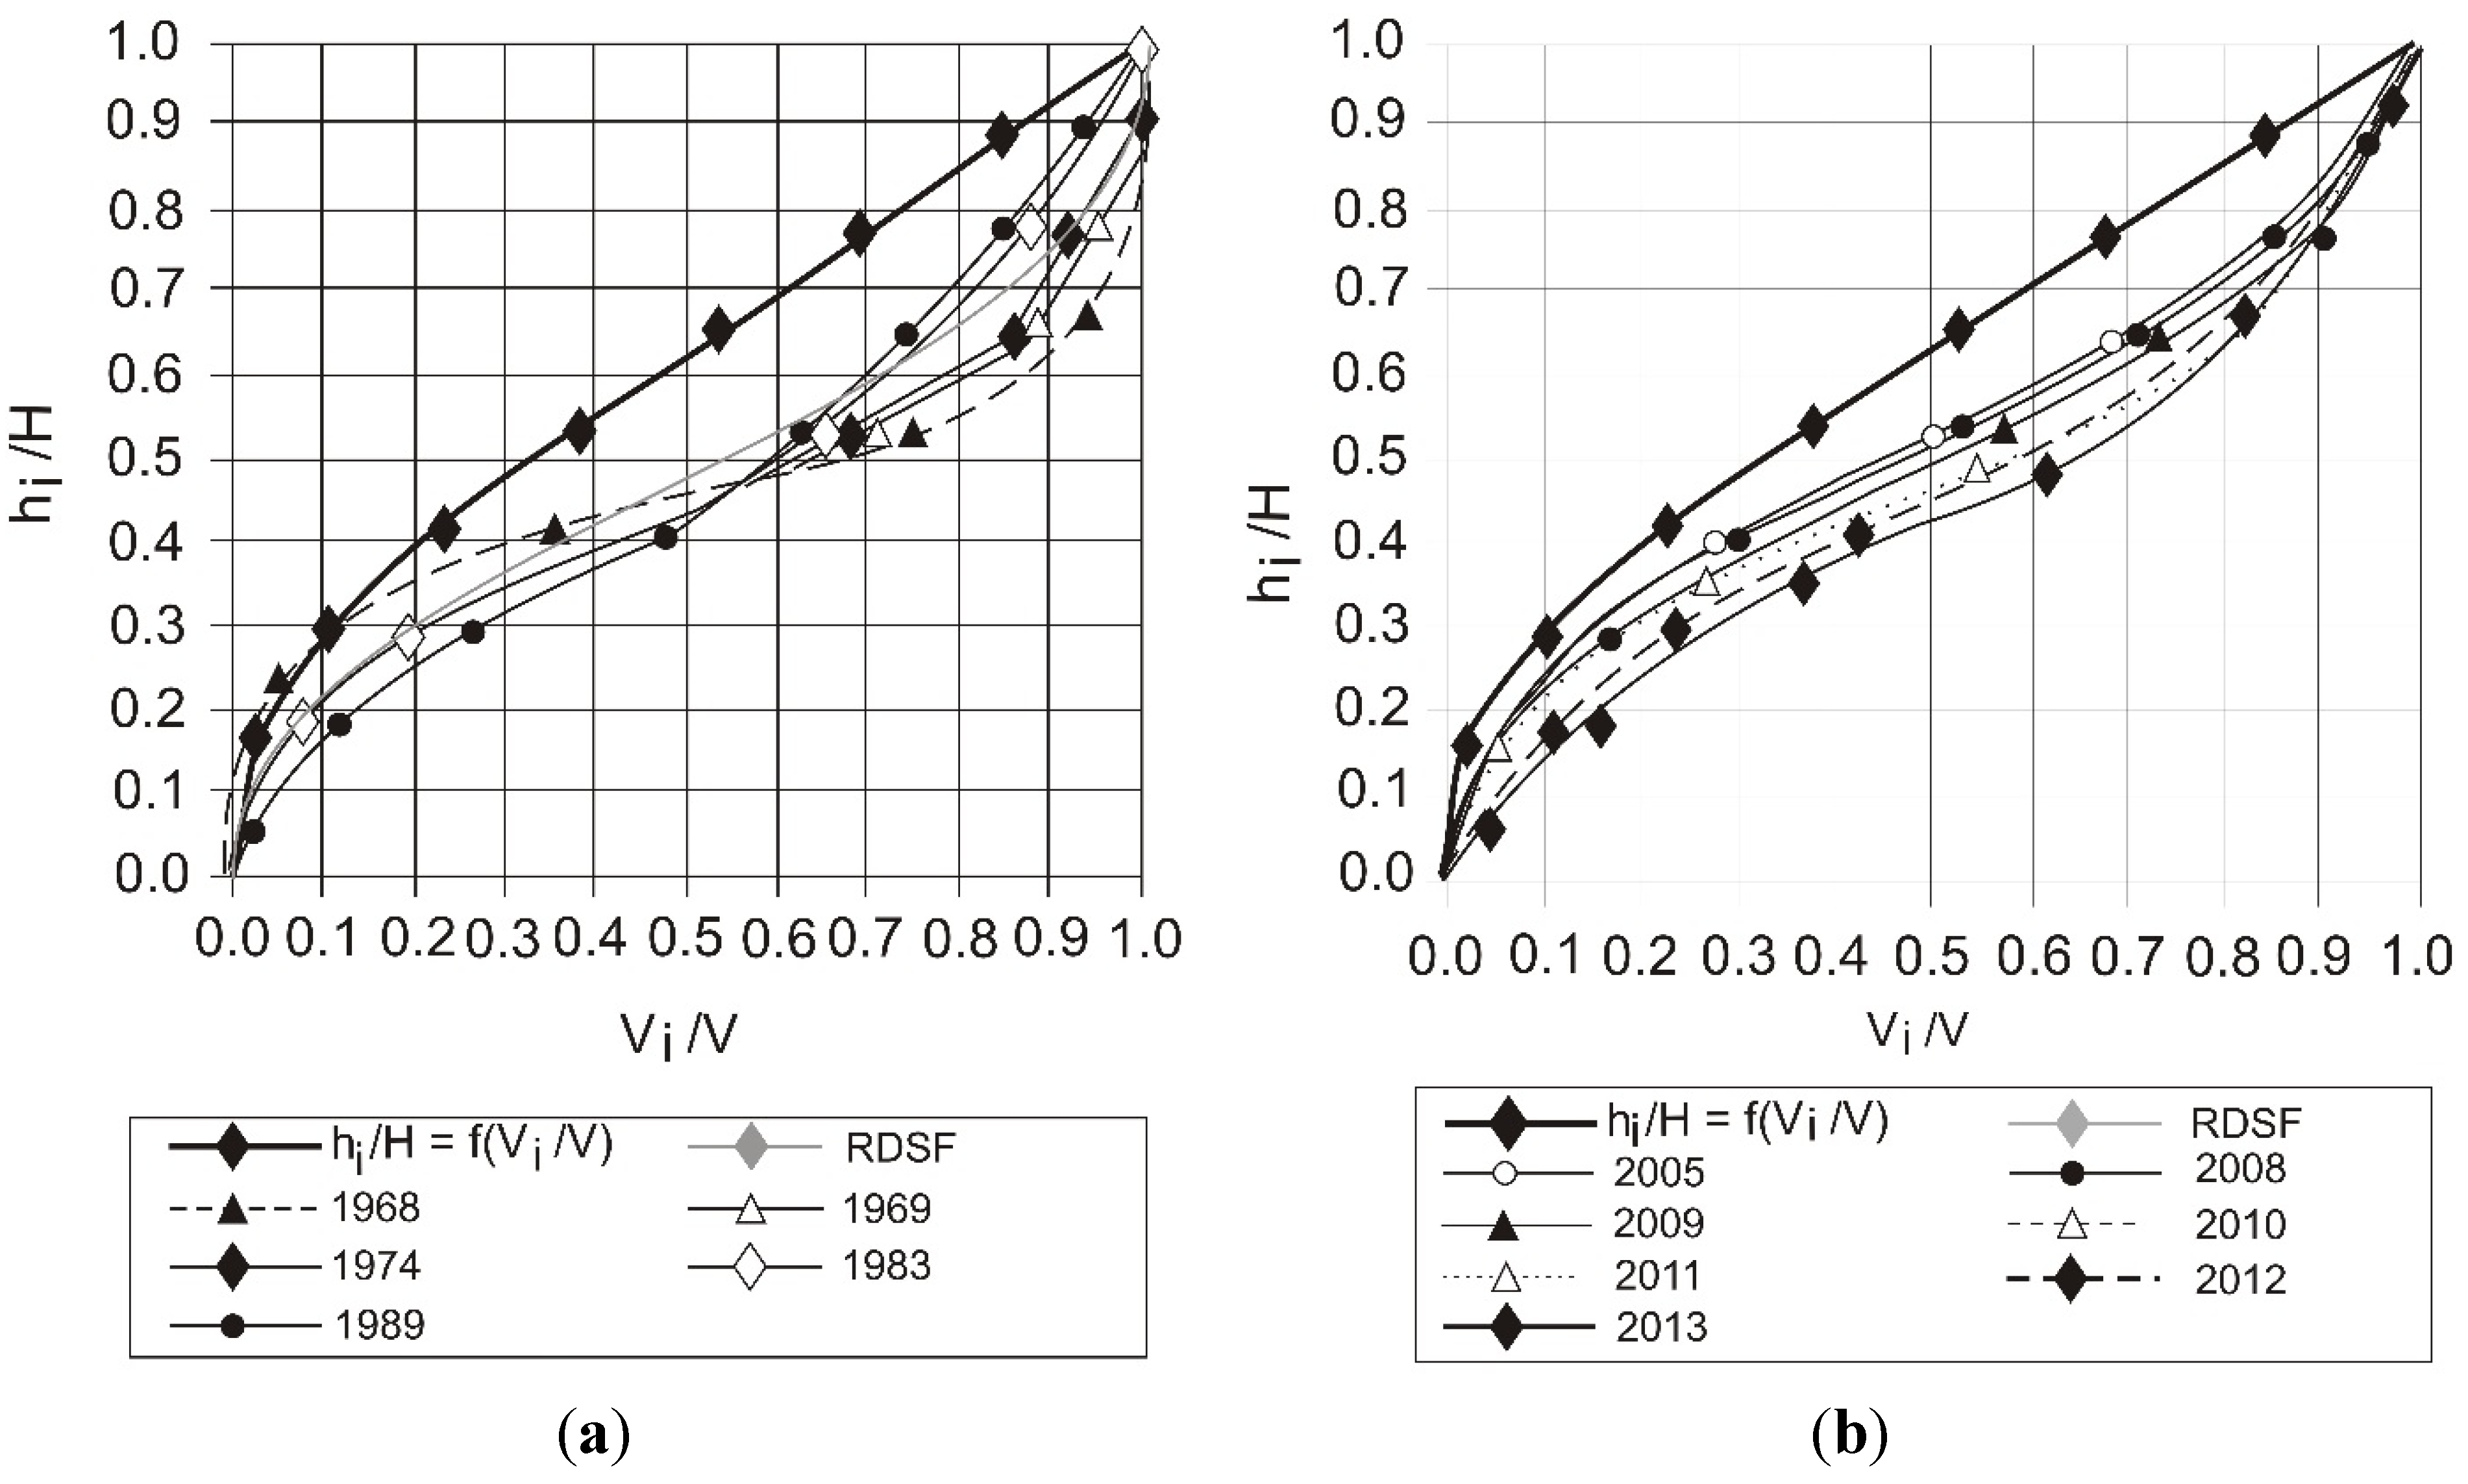
Figure 5.
Comparison of cumulative depth of sediment deposition in reservoir Zesławice-1, described with function hi/H = f(Vi/V), with relative cumulative sediment distribution described according to RDSF parameter; where hi/H is the relative depth, and Vi/V is the relative volume, rel. V is the cumulative curve of the reservoir’s volume; (a)—reservoir before dredging; (b)—reservoir after dredging.
Figure 6.
Comparison of cumulative depth of sediment deposition in reservoir Zesławice-2, described with function hi/H = f(Vi/V), with relative cumulative sediment distribution described according to RDSF parameter; where hi/H is the relative depth, Vi/V is the relative volume, and rel. V is the cumulative curve of the reservoir’s volume.
In the first years of operation (
i.e., in 1968, 1969 and 1974), before dredging of Zesławice-1 reservoir (
Figure 5a), sediments were deposited mainly in shallow areas, located near the reservoir inlet. In the near-dam zone, where h/H ranges from 0.0 to 0.3, the amount of deposited sediment is small—cumulative curves of sediment deposits only slightly differed from a cumulative curve of the reservoir’s volume (curve
hi/H =
f(
Vi/V) in
Figure 5a). In subsequent years,
i.e., in 17th and 23rd year of the reservoir’s operation (respective curves for 1983 and 1989 in
Figure 5a), the sediment distribution was increasingly proportional at each relative depth. The sediment distribution curve determined based on silting measurements in 1989 (
Figure 5a) is the most similar to the curve predicting the sediment distribution: the Relative Depth Shape Function for different heights from reservoir bed (Equation (1)). The actual vertical distribution of sediment was based on measurement data corresponding to silting of Zesławice-1 reservoir of over 61%. It was also observed that after dredging of this reservoir (
Figure 5b), the sediment distribution is nearly the same as before dredging,
i.e., in subsequent years of the operation, the relative volume of sediment depositions increased on shallower relative depths, which correspond to the areas of reservoir’s bottom located closer to the dam. However, due to water distribution in a junction, which directs part of water inflow to the side reservoir Zesławice-2, small amount of sediment is deposited in the area closest to the dam. Therefore, the layout of sediment distribution curves in
Figure 5b, based on the silting measurements is significantly different from the predicted sediment distribution at the relative depths from 0.0 to 0.5. The sediment distribution estimated from the latest measurement, performed in 2013, presented in
Figure 5b, is significantly consistent with the predicted sediment distribution (grey RDSF line). The results differ on average only by 5%. It should, however, be noted that the change in water flow through this reservoir, resulting from water distribution, not only caused a decrease in the amount of sediment deposited in the near-dam parts of the reservoir (relative depths from 0.0 to 0.5), but also contributed to the intense sediment deposition in the reservoir inlet. In this zone, sediment deposition formed an island composed of sediments that rise above the water level. Thus, in
Figure 5b relative sediment volumes for the relative depth of 1.0 range from 0.95 to 0.99.
Sediment deposition over water surface was also found before dredging of this reservoir—presented by the sediment distribution curve based on the measurements performed in 1989 (
Figure 5a). Island-formation from sediments causes discrepancies in predicting the distribution of sediments using the RDSF curve. The sediment distribution in the assistant side reservoir Zesławice-2 (
Figure 6), based on the measurements in 2005–2013, indicated the initial stage of reservoir silting. Sediment depositions are relatively evenly distributed in parts of the reservoir corresponding to the relative depths of 0.07–0.81. This means that sediment is not deposited in the deepest zones,
i.e., of the relative depths below 0.07, the near-dam and in the most shallowest zones, of the relative depths over 0.81, by the reservoir inlet. The sediment distribution, presented in
Figure 6, corresponds to relatively small reservoir silting—it ranged from 18.8% in 2005 to 22.5% in 2010 (
Table 3). One can suppose that in subsequent years of operation sediment will be deposited not only in the aforementioned zones of Zesławice-2 reservoir, but also in more shallow zones (at the reservoir inlet), which will cause the approaching of cumulative depth of sediment deposition curves to the RDSF curve.
The results of calculations of the relative depth (
hi/H) and the relative volume (
Vi/V) at Krempna reservoir before and after dredging and Relative Depth Shape Function for different elevations from reservoir bed values are presented in
Table 7 and
Table 8, respectively.
Table 7.
Relative Depth Shape Function for different elevations from the reservoir bed for Krempna reservoir before dredging.
Table 7.
Relative Depth Shape Function for different elevations from the reservoir bed for Krempna reservoir before dredging.
| Elevation (m a.s.l.) | Sum of Volume (m3) | Relative Depth hi/H | Relative Volume Vi/V | 1/α | RDSF |
|---|
| 366.28 | 70 | 0.00 | 0.00 | 0.00 | 0.00 |
| 366.40 | 400 | 0.03 | 0.00 | 31.00 | 0.10 |
| 366.80 | 4590 | 0.14 | 0.04 | 7.15 | 0.28 |
| 367.20 | 14,570 | 0.25 | 0.12 | 4.04 | 0.49 |
| 367.60 | 26,480 | 0.35 | 0.22 | 2.82 | 0.63 |
| 368.00 | 38,520 | 0.46 | 0.32 | 2.16 | 0.70 |
| 368.40 | 51,860 | 0.57 | 0.44 | 1.75 | 0.76 |
| 368.80 | 67,590 | 0.68 | 0.57 | 1.48 | 0.84 |
| 369.20 | 84,570 | 0.78 | 0.71 | 1.27 | 0.90 |
| 369.60 | 101,680 | 0.89 | 0.85 | 1.12 | 0.96 |
| 370.00 | 119,100 | 1.00 | 1.00 | 1.00 | 1.00 |
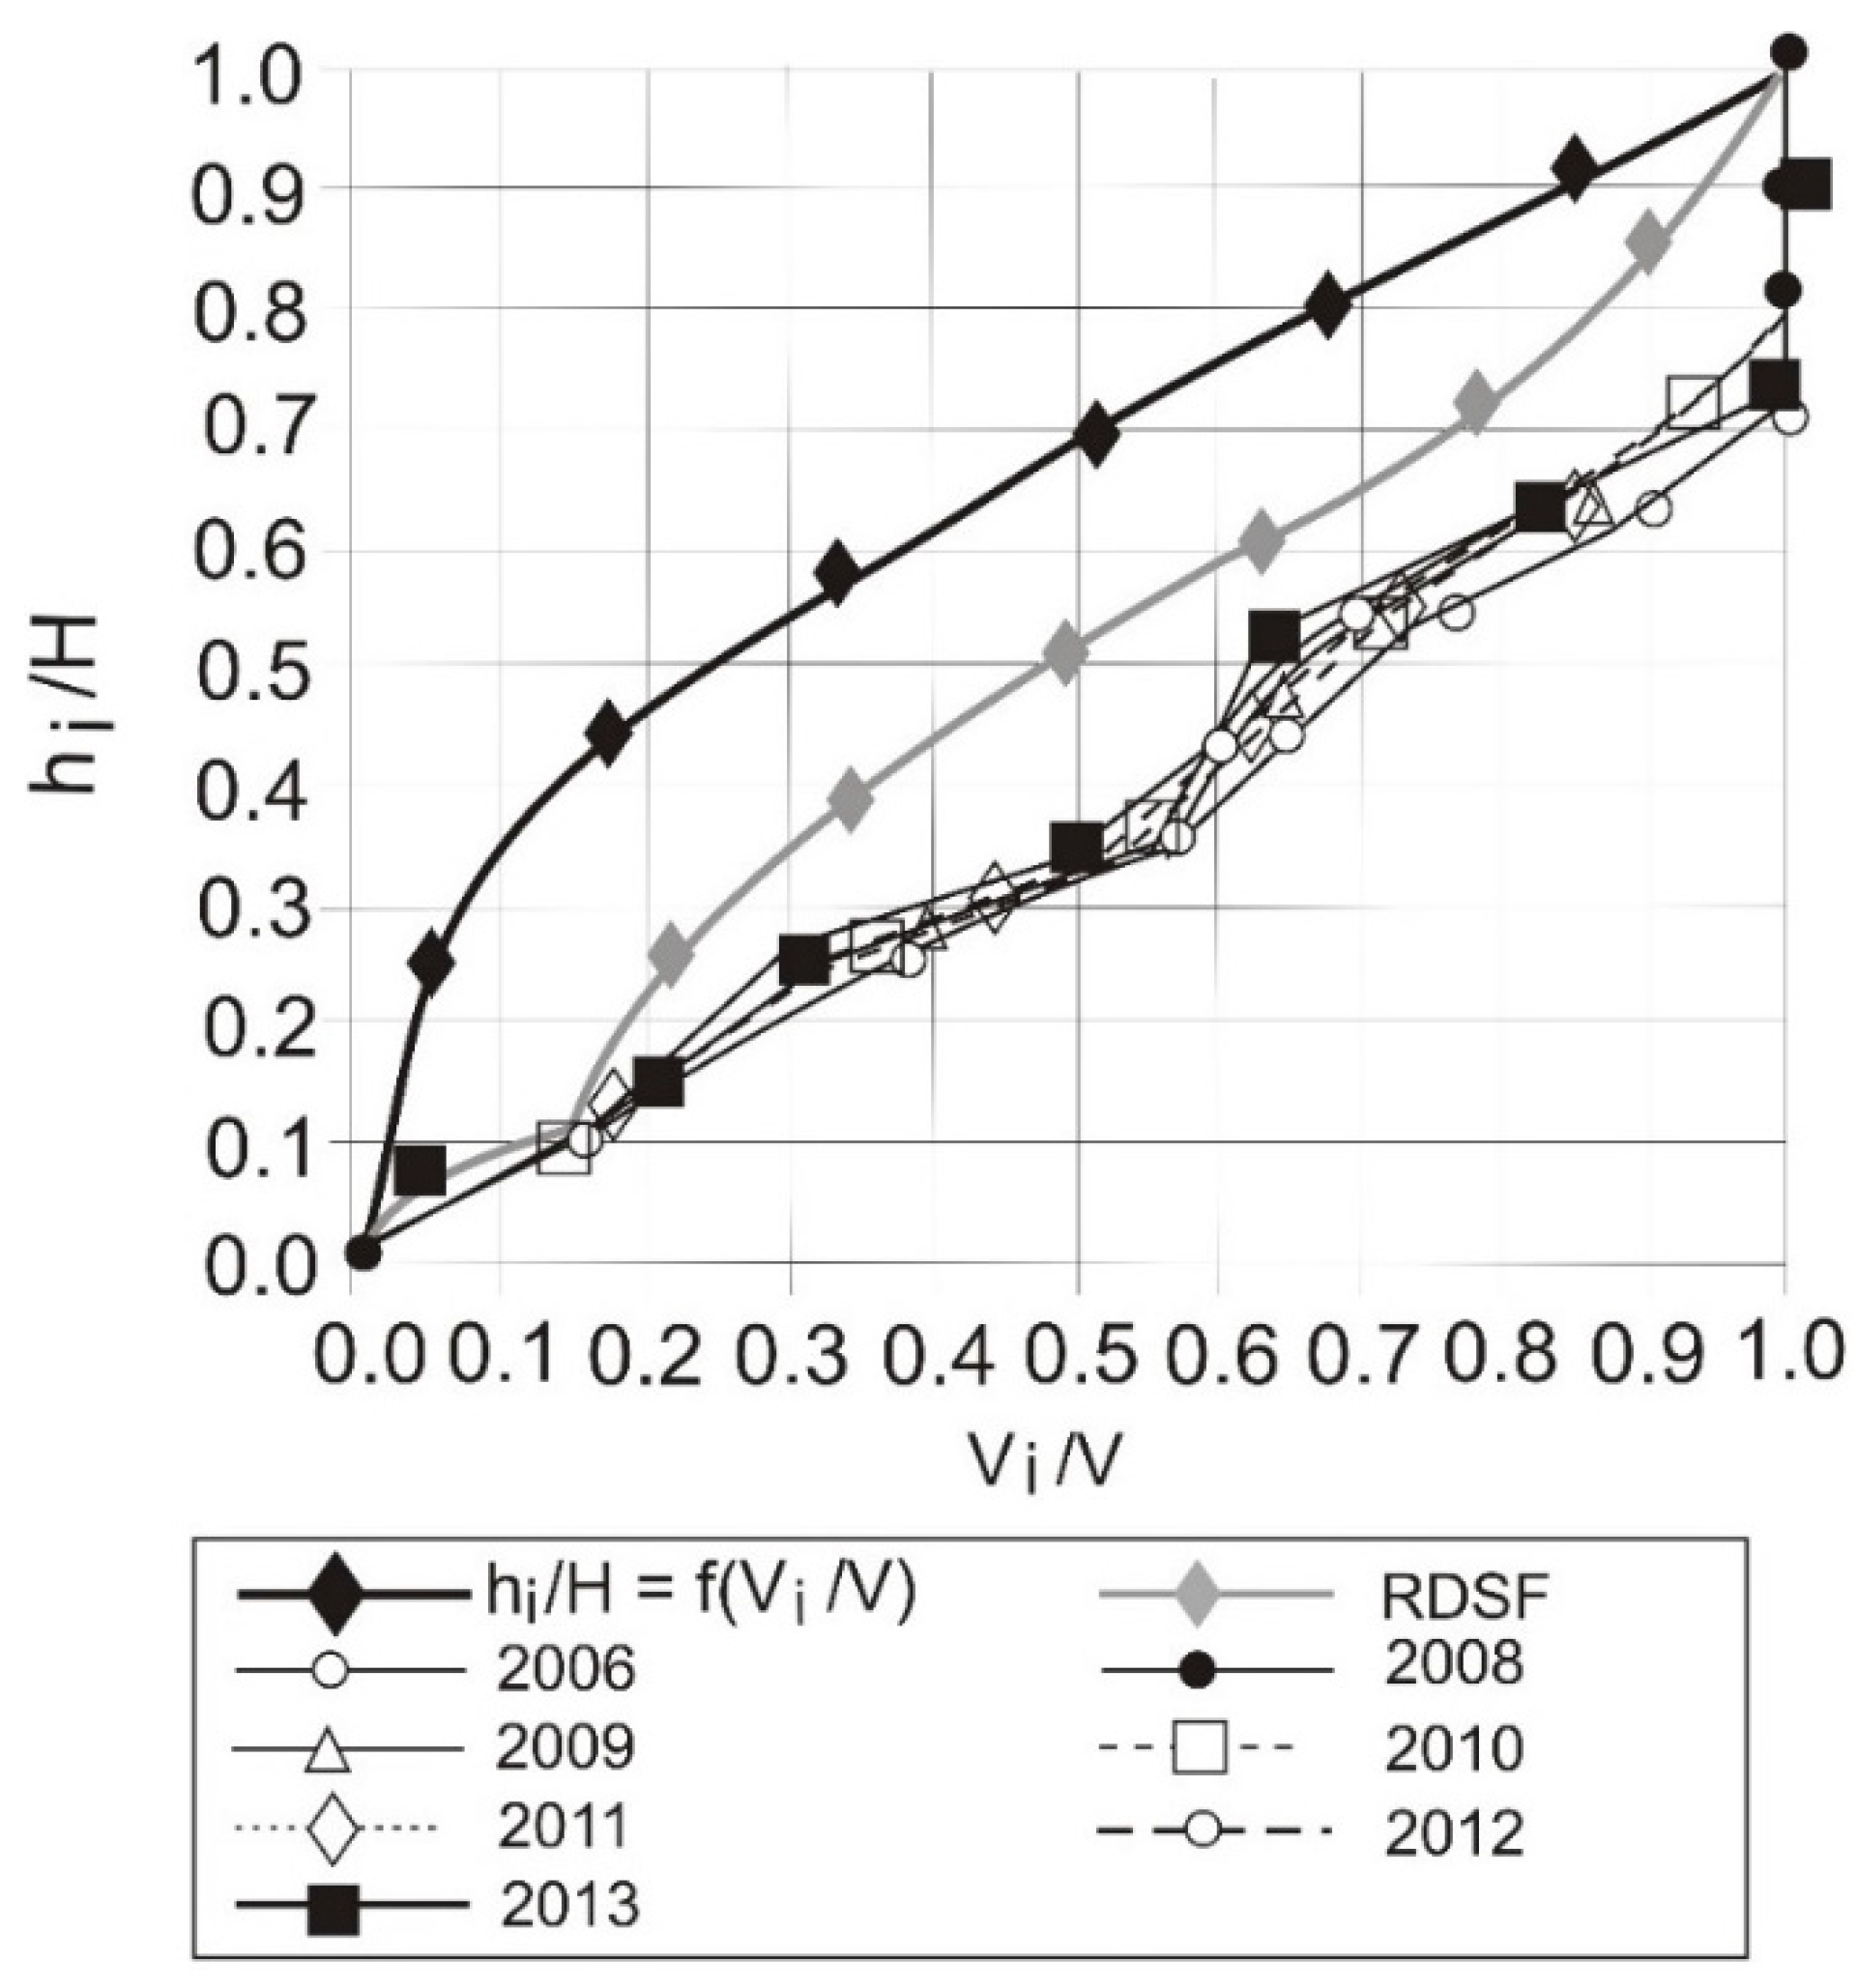
Before dredging of Krempna reservoir (
Figure 7a) in the 14th year of operation, sediment deposition in the deepest part of the reservoir (relative depths from 0.0 to 0.6) is similar to the one described by the RDSF curve. Smaller amounts of sediments are deposited at inlet zones with relative depths from 0.6 to 1.0—the sediment distribution curve deviates significantly from the one predicted with the RDSF curve. The sediment distribution, presented in
Figure 7a has been determined for a 30% silting rate. As shown in
Figure 7b, at higher silting rate, the sediment distribution layout approaches the RDSF curve. After dredging of the Krempna reservoir, the discrepancy between sediment distribution curves and RSFD curve in the deepest part of the reservoir (relative depths from 0.0 to 0.6) increases for higher silting rates.
Table 8.
Relative Depth Shape Function for different elevations from the reservoir bed for Krempna reservoir after dredging.
Table 8.
Relative Depth Shape Function for different elevations from the reservoir bed for Krempna reservoir after dredging.
| Elevation (m a.s.l.) | Sum of Volume (m3) | Relative Depth hi/H | Relative Volume Vi/V | 1/α | RDSF |
|---|
| 366.50 | 50 | 0.00 | 0.00 | 0.00 | 0.00 |
| 366.80 | 860 | 0.09 | 0.01 | 11.67 | 0.09 |
| 367.20 | 4420 | 0.20 | 0.04 | 5.00 | 0.20 |
| 367.60 | 13,200 | 0.31 | 0.12 | 3.18 | 0.37 |
| 368.00 | 27,500 | 0.43 | 0.25 | 2.33 | 0.57 |
| 368.40 | 43,060 | 0.54 | 0.38 | 1.84 | 0.71 |
| 368.80 | 60,010 | 0.66 | 0.54 | 1.52 | 0.82 |
| 369.20 | 77,220 | 0.77 | 0.69 | 1.30 | 0.89 |
| 369.60 | 94,540 | 0.89 | 0.84 | 1.13 | 0.95 |
| 370.00 | 112,000 | 1.00 | 1.00 | 1.00 | 1.00 |
Figure 7.
Comparison of cumulative depth of sediment deposition in Krempna reservoir, described with function hi/H = f(Vi/V), with relative cumulative sediment distribution calculated according to Relative Depth Shape Function (RDSF) parameter; where hi/H is the relative depth, Vi/V is the relative volume, and rel. V is the cumulative curve of the reservoir’s volume; (a)—reservoir before dredging; (b)—reservoir after dredging.
In 1996,
i.e., in the ninth year of operation, the silting rate of Krempna reservoir was 24.1%—there was the greatest difference between the sediment distribution (
Figure 7a) and the forecast of distribution according to the RDSF curve. In 2005,
i.e., in the 18th year of operation, the silting rate was less than 41%—the sediment distribution curve (
Figure 7b) was the most similar to the RDSF curve. It may be assumed that, after the reservoir is silted by 50%, which, according to criteria of Pitt and Thompson [
4], restricts the reservoir’s operational conditions, the actual sediment deposition will be similar to the one described by the RDSF curve.


