1. Introduction
Global climate change has led to an increase in the number of extreme rainfall events. In Taiwan, continual precipitation during the rainy season or typhoon season between July and October commonly leads to severe landslides and mudflow. Approximately 70% of these disasters are shallow landslides that present a considerable threat to the lives and property of residents in the mountains [
1]. Moreover, rainfall-induced shallow landslides affecting deposits of small thickness are common phenomena all over the world. Important events have been recorded in many regions of Italy [
2,
3,
4], in the Czech Republic [
5], Switzerland [
6], Slovakia [
7], Turkey [
8], India [
9], Malaysia [
10], Hong Kong [
11], and the USA [
12,
13]. Intense rains brought by Typhoon Morakot of 2009 caused multiple landslides in Southern Taiwan, which were accompanied by debris flows that directly or indirectly led to the destruction of Xiaolin Village in Jiasian District in the catchment of the Gaoping River. History reminds us that engineering measures cannot always provide sufficient protection against the forces of nature. Thus, it is imperative that effective warning systems should be developed to avoid slope disasters caused by severe weather. Kniveton [
14] used to use remote sensing tools to develop prediction techniques related to mass movement in Europe. To this end, this study investigated the influence of extreme rainfall on shallow landslides.
However, before giving a more detailed introduction, we will examine various types of landslides. Among the numerous landslide classification systems that have been proposed, the one presented by Varnes in 1978 is the most widely adopted (
Table 1).
Table 1.
Types of landslides. Abbreviated version of Varnes’ classification of slope movements (Varnes [
15]).
Table 1.
Types of landslides. Abbreviated version of Varnes’ classification of slope movements (Varnes [15]).
| Type of Movement | Type of Material |
|---|
| Bedrock | Engineering Soils |
|---|
| Predominantly Coarse | Predominantly Fine |
|---|
| Falls | Rock fall | Debris Fall | Earth Fall |
| Topples | Rock Topple | Debris Topple | Earth Topple |
| Slides | Rotational | Rock Slump | Debris Slump | Earth Slump |
| Translational | Rock Block Slide | Debris Block Slide | Earth Block Slide |
| Rock Slide | Debris Slide | Earth Slide |
| Lateral spreads | Rock Spread | Debris Spread | Earth Spread |
| Flows | Rock Flow | Debris Flow | Earth Flow |
| Complex | Combination of two or more principal types of movement |
Landslides are broadly defined as slope movements, and the landslide areas or slopes where the landslides take place refer to the location of these movements. This study focused on shallow landslides; i.e., the types of slides mentioned above. The infiltration of rainfall can have a profound influence on shallow landslides; therefore, we focused on shallow translational sliding failures.
Existing models used for the analysis of large-scale catchments are based on statistical or deterministic methods [
16,
17,
18]. Statistical approaches are generally adopted for the evaluation of landslide potential; however, this approach does not deal with the physical mechanisms or dynamic behavior of landslides in catchment areas. In these models, factors such as soil cohesion, friction angle, and rainfall intensity are of only marginal relevance to landslides. Most existing warning systems in Taiwan [
19,
20] are based on statistical methods, wherein warnings are issued when observed values reach a statistical threshold established by examining actual disasters in the past. However, the physical characteristics of the soil at actual locations are not taken into account. This study conducted slope stability analysis using the TRIGRS model, while taking into consideration the physical conditions of the soil. A deterministic analysis method was also employed to establish rainfall thresholds with which to guide the issuance of warnings pertaining to shallow landslides.
Existing methods used for the analysis of landslide disasters can be divided into four categories: expert evaluation, statistical analysis, artificial intelligence, and deterministic analysis. Brief introductions to these methods are presented in the following.
Expert evaluation: Experts survey the conditions in landslide-prone areas, identify factors, and conduct evaluations of the geology, terrain, and climate within the areas, based primarily on experience [
21]. They rank and/or weight the impact of each factor in the landslide, superimpose them, and calculate the cumulative weight to derive a landslide susceptibility index [
22]. Unfortunately, this approach relies on the experience of experts, consumes considerable manpower and material resources, and tends to be somewhat subjective.
Statistical analysis: Statistical analysis methods involve the use of cataloged landslide layers to extract physiographic factors that contribute to landslides within a given region and then identify those that have the greatest impact [
23,
24,
25]. In this approach, the factors are easy to obtain and tend to be dealt with objectively. Statistical analysis emphasizes induction and correlation, such that a substantial quantity of data from the study area is required.
Artificial intelligence: Landslide and mudslide susceptibility can also be evaluated using neural networks and fuzzy sets [
26]. Neural networks are exceptional classification tools capable of dividing a region into areas with or without landslide potential; however, this approach is unable to produce continuously distributed indices of landslide susceptibility [
27,
28].
Deterministic analysis: Deterministic analysis is based on physical and mechanical concepts. Physical models, which are founded on the infinite slope method [
29,
30,
31] based on Mohr-Coulomb failure criteria, reveal landslide potential. The plane sliding model is representative of these methods in which it is assumed that slope instability can be extended indefinitely. Safety factors and the possible location of failure at the surface can be obtained using the limit equilibrium method.
In deterministic analysis, changes in water pressure in unsaturated pores caused by the infiltration of rain can be derived using Richard’s equation, which is based on Darcy’s law and the principle of mass conservation. It is one of the most important control equations with regard to the movement of fluid in layers of unsaturated soil [
32,
33,
34,
35,
36]. Using an analytic solution approach, Iverson [
37] solved a simplified form of Richard’s equation for flow [
38] in order to determine the influence of rainfall infiltration on the increase in groundwater pressure in order to evaluate changes in the stability of an infinite slope in response to rainfall duration. The modified Iverson’s approach was to deal with rainfall events with boundary conditions of even greater complexity. This led to the development of the Transient Rainfall Infiltration and Grid-based Regional Slope-Stability (TRIGRS) model, which is capable of gauging the landslide potential of all slope units within a wide-range catchment, based on rainfall infiltration conditions using automated analysis [
12].
TRIGRS is currently the most representative transient analysis model for landslide disasters, which has been employed by a number of researchers in landslide analysis and case studies [
39,
40,
41,
42]. Bisanti,
et al. [
43] used survey data from landslide-prone areas to verify the efficacy of the TRIGRS model. These studies identified soil slips caused by rainfall as one of the most hazardous types of slope disaster [
37,
44,
45]. When high intensity rain induces failure in saturated soil, slippages are often shallow, translational movements that occur with little or no warning.
Huang [
18] compared Stability Index MAPping (SINMAP), the Shallow Slope Stability Model (SHALSTAB), and TRIGRS evaluation models for shallow landslides and found that only the TRIGRS model considers the factor of time, thereby enabling the transient analysis of rainfall-induced landslides. Moreover, this approach takes full account of terrain, rainfall infiltration, and transient groundwater pressure as well as the thickness, mechanical characteristics, and hydrogeological characteristics of the regolith and variations in the spatial and temporal distributions of rainfall. Together, this provides a highly effective description of shallow landslides caused by rainfall infiltration.
Another focus in this study was rainfall thresholds. For further information related to empirical thresholds [
46,
47,
48,
49,
50,
51,
52,
53] or physically based thresholds, readers may refer to relevant references [
54,
55,
56].
2. Introduction to the TRIGRS Model
The deterministic approach is currently the most effective method used in the assessment of shallow landslides, due to the objective consideration of onsite physical conditions. The deterministic approach was therefore employed in the following analysis.
The TRIGRS model uses grids to facilitate analysis of slope stability and the influence of transient rainfall infiltration. This approach can simulate changes in safety factors and pore pressure at various depths in the soil resulting from the infiltration of rainfall following rainfall of various durations. The rainfall infiltration mechanisms of the TRIGRS model is based on the linear solution to the Richards equation derived by Iverson [
37]. Automated analysis can be used to present the landslide potential of all slope units within catchment areas, based on rainfall infiltration conditions. Furthermore, this method takes into consideration the soil and hydrological characteristics of various study sites. The calculation of the factor of safety (FS) in each grid is based on infinite slope theory to enable slope stability analysis of large areas. The following equation is used in the TRIGRS model to calculate the FS for each grid:
where
denotes soil cohesiveness,
is the effective friction angle,
represents the angle of the slope,
and
indicate the unit weight of water and soil, respectively, and
denotes changes in pore pressure at various times and depths. Using Equation (1), the TRIGRS model calculates the FSs corresponding to water pressure at various depths within a given grid at different times.
As indicated in Equation (1), when FS is less than 1, the downward sliding force of the soil mass exceeds the resistance. In other words, the sliding mass is unstable. In contrast, when FS exceeds 1, the sliding mass is stable. Analyzing the FS of the soil mass in each grid makes it possible to observe the distribution of unstable sites within a study region. In this study, FS was linked to the slope instability caused by changes in pore pressure following the infiltration of rainfall, which was then used to consider the stability of soil masses within the study region in order to establish thresholds for early warning systems.
3. Modeling the Study Region
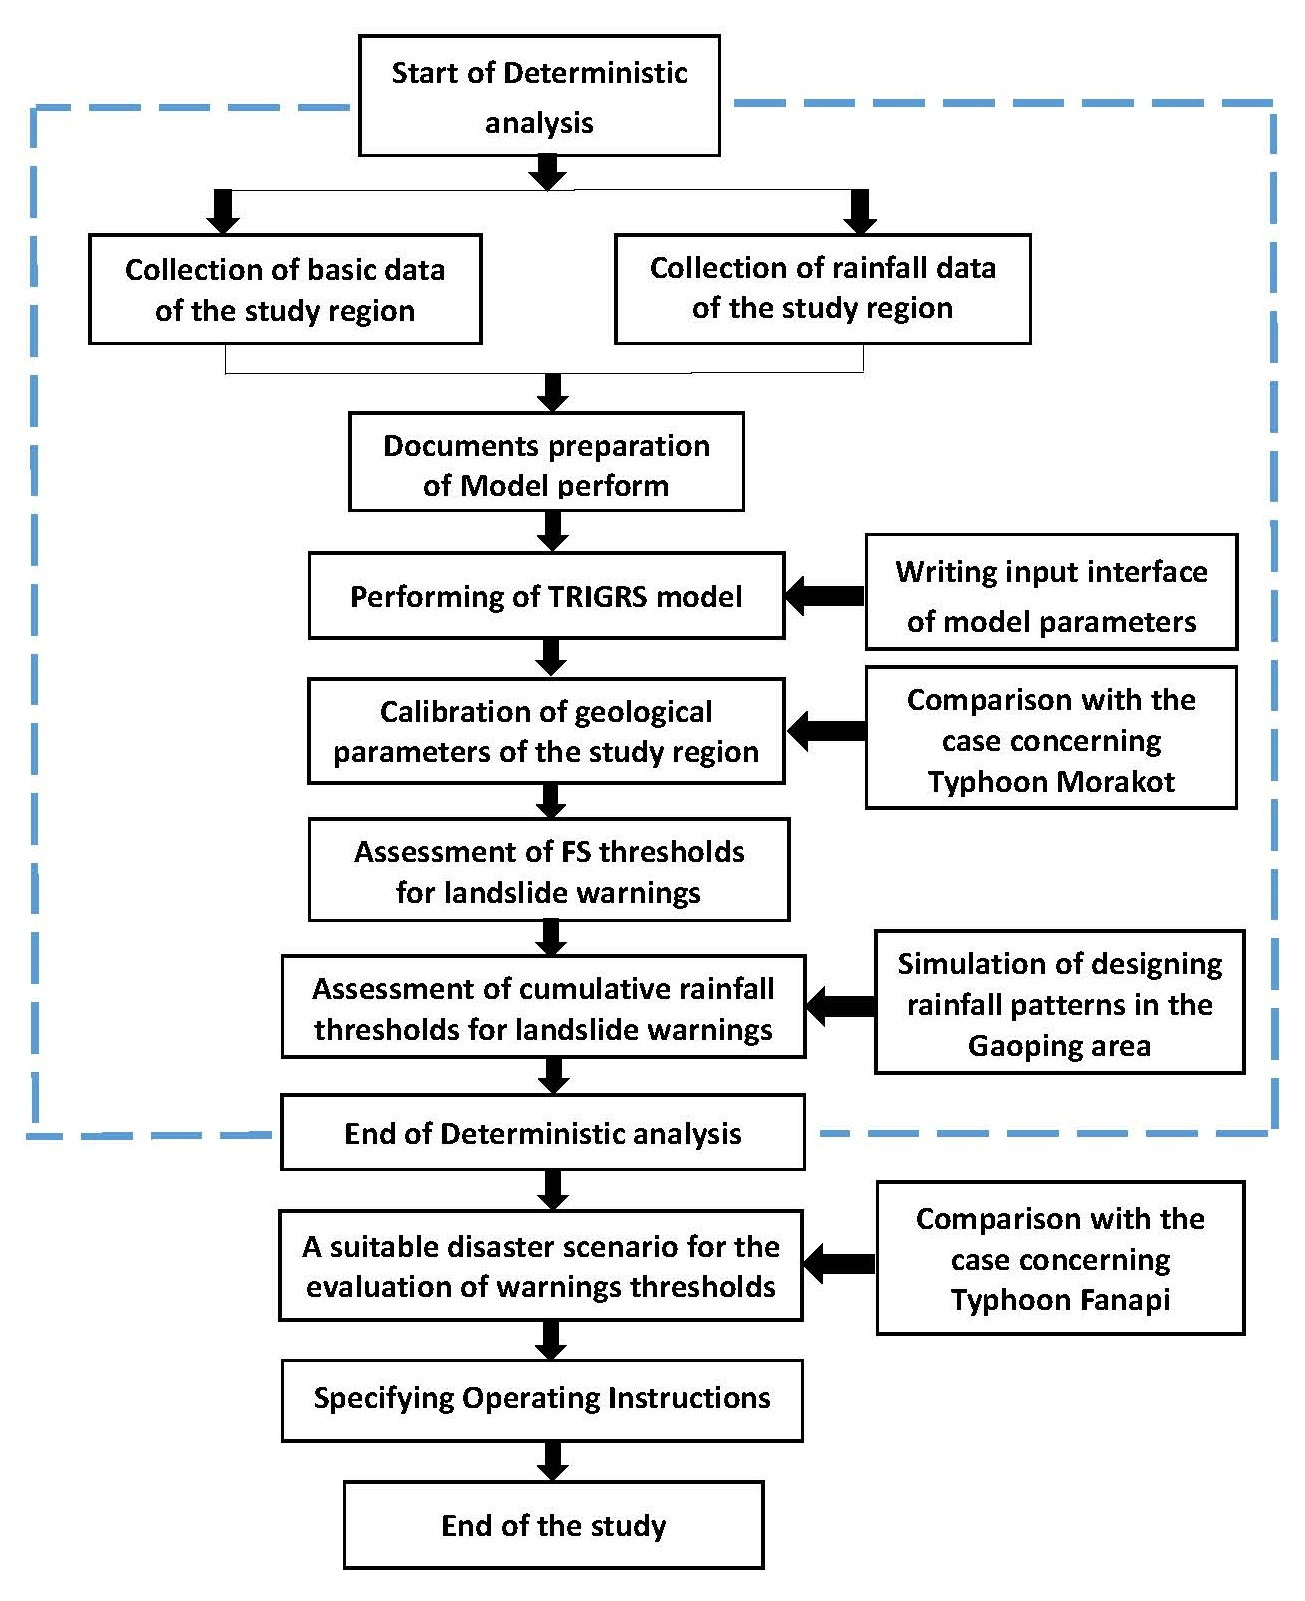
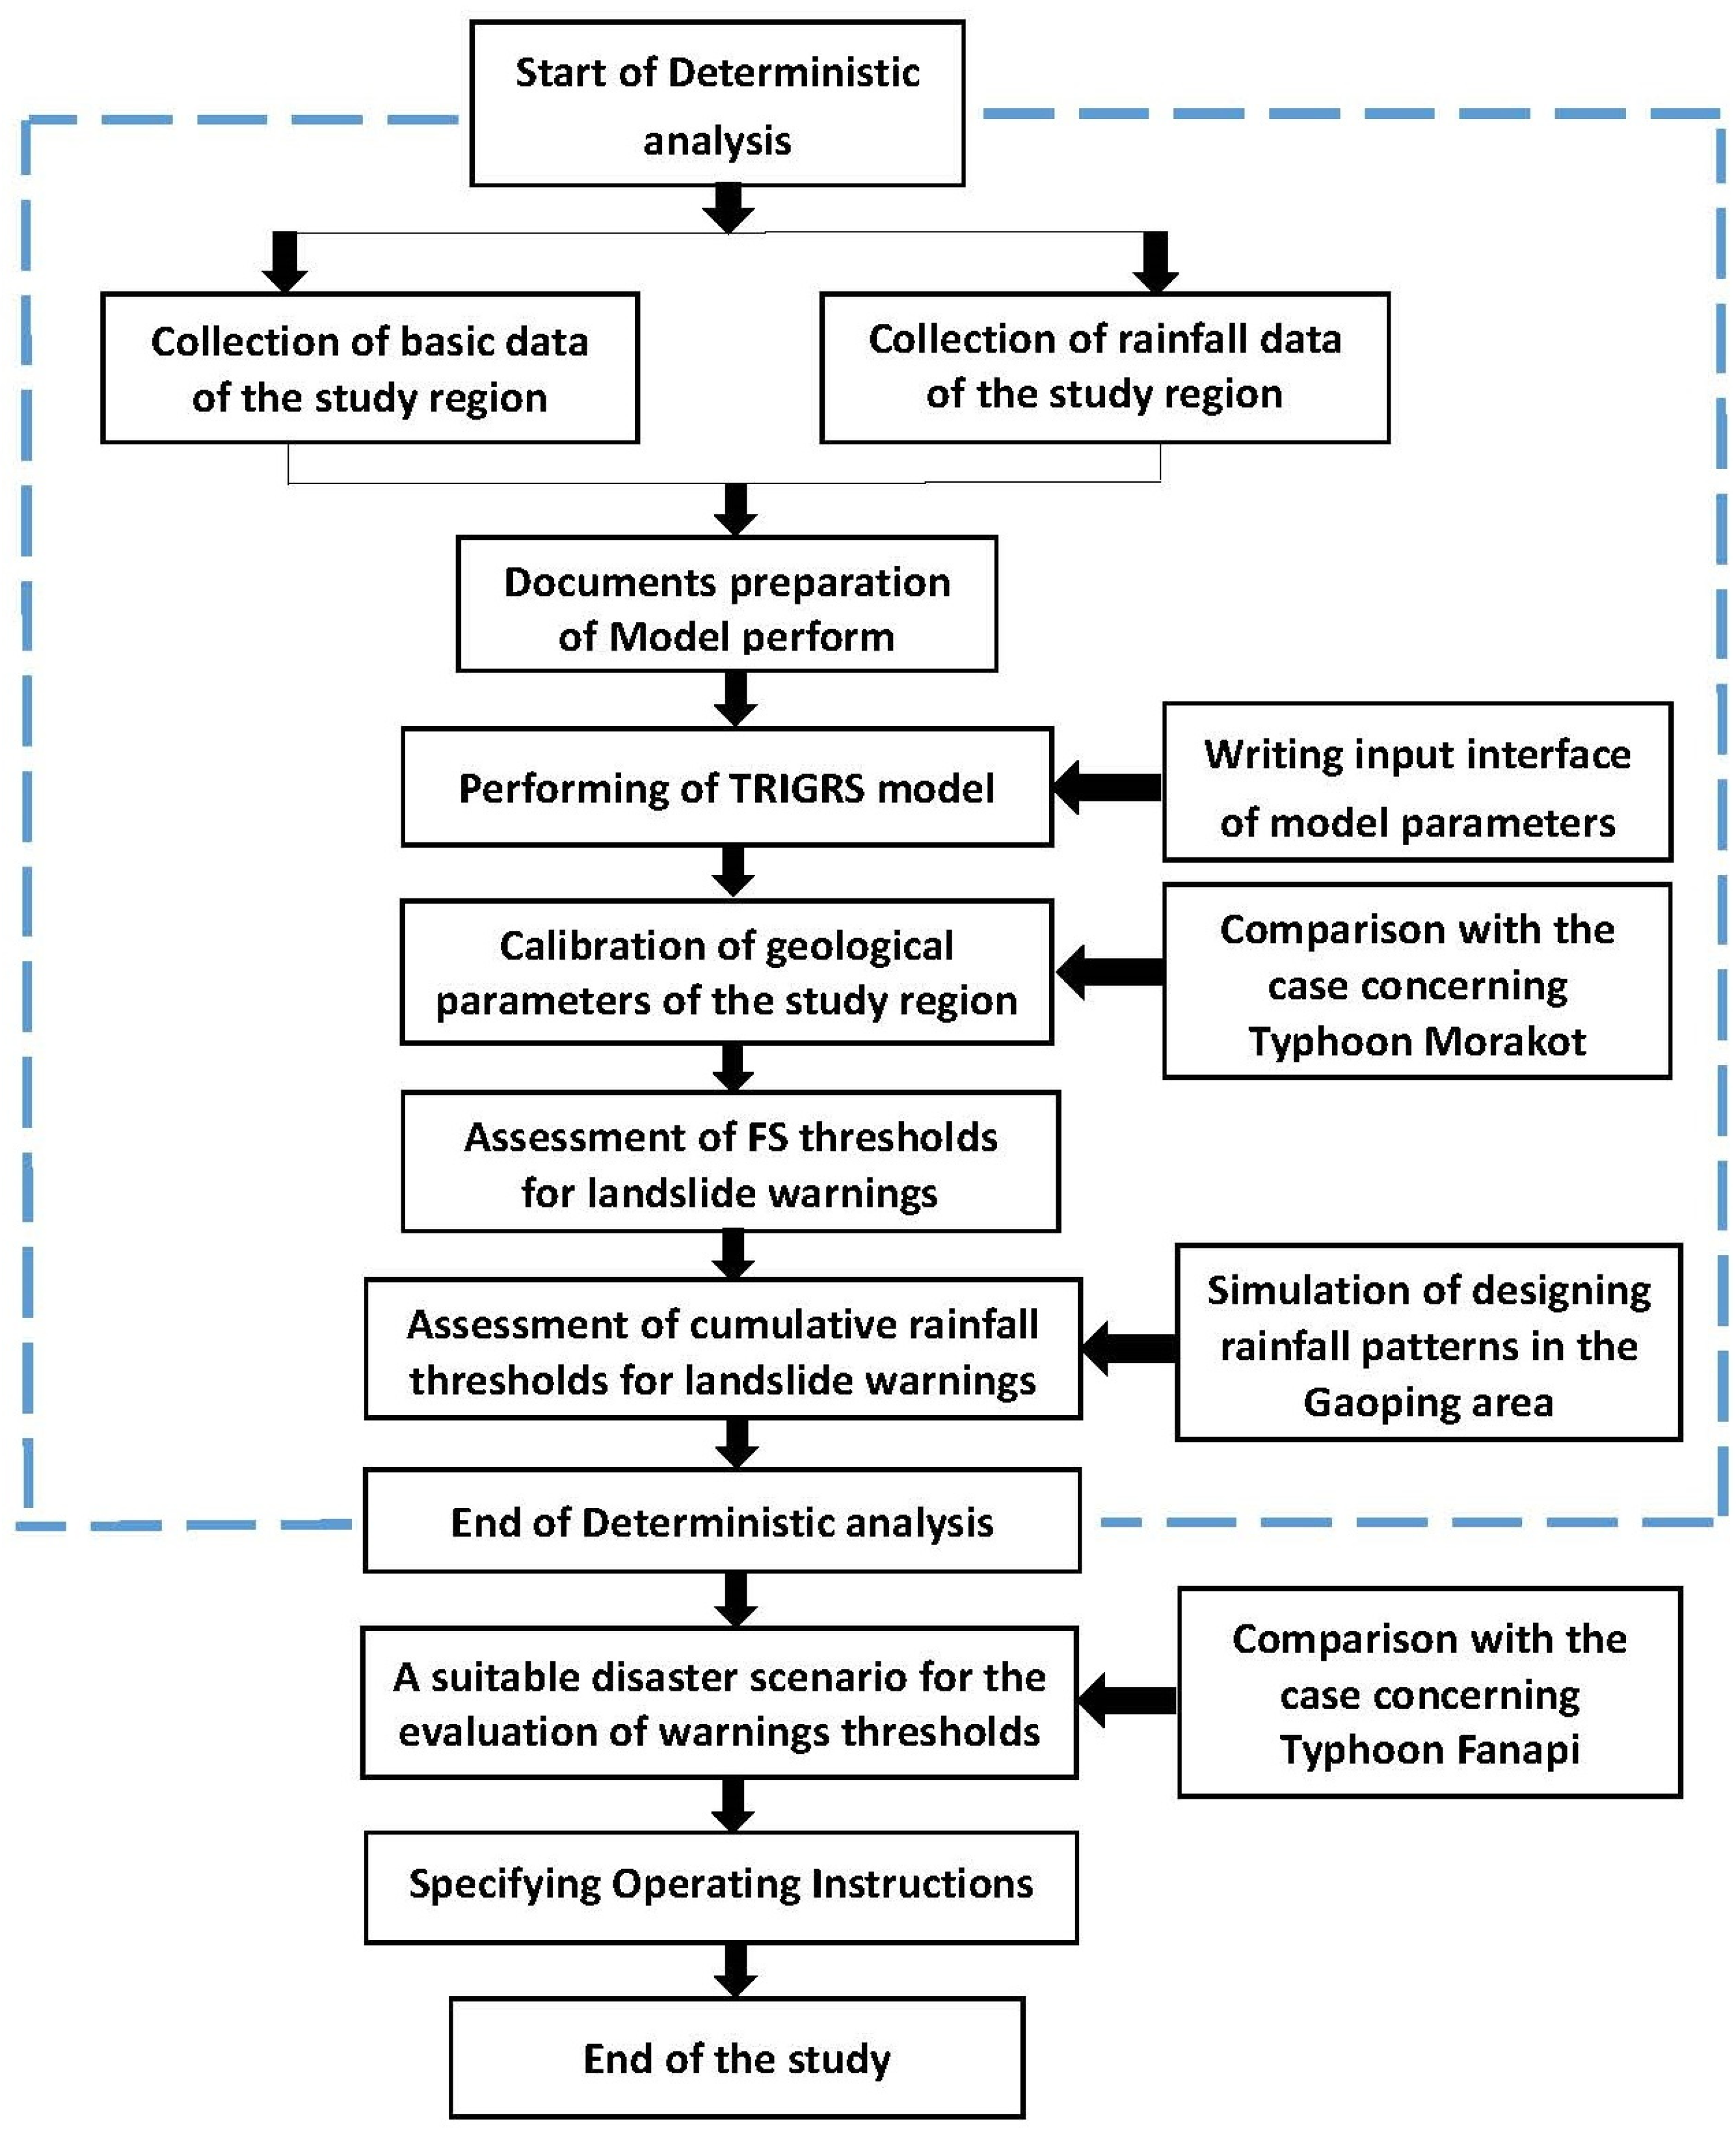
Following the collection of basic geological data and simulation rainfall data of the entire study region, the TRIGRS model was adopted to calculate FS as it varies with rainfall. The geological parameters of the study region were calibrated using data related with Typhoon Morakot in 2009. The FS threshold was then estimated for early warnings and simulations were conducted using the designed rainfall patterns.
Figure 1 displays the modeling process as well as the methods used in the analysis of landslide results:
Figure 1.
Modeling, result analysis, and assessment procedures employed in this study.
Figure 1.
Modeling, result analysis, and assessment procedures employed in this study.
3.1. Selection of Study Region
The area examined in this study was selected according to the number of disasters and their distribution between 2008 and 2012, as indicated in surveys by the Soil and Water Conservation Bureau (SWCB). The data was incorporated in a map of the catchments in Taiwan to obtain the distribution of disasters within all of the catchments, whereupon the one with the greater number of disasters was selected:
i.e., the catchment of the Gaoping River. After further consideration with regard to disaster prevention and the location of structures requiring protection, all of the villages and towns in the catchment of the Gaoping River were analyzed. Based on the Major Landslide Disaster Bulletin for Typhoon Morakot of 2009 (a report compiled by the SWCB) [
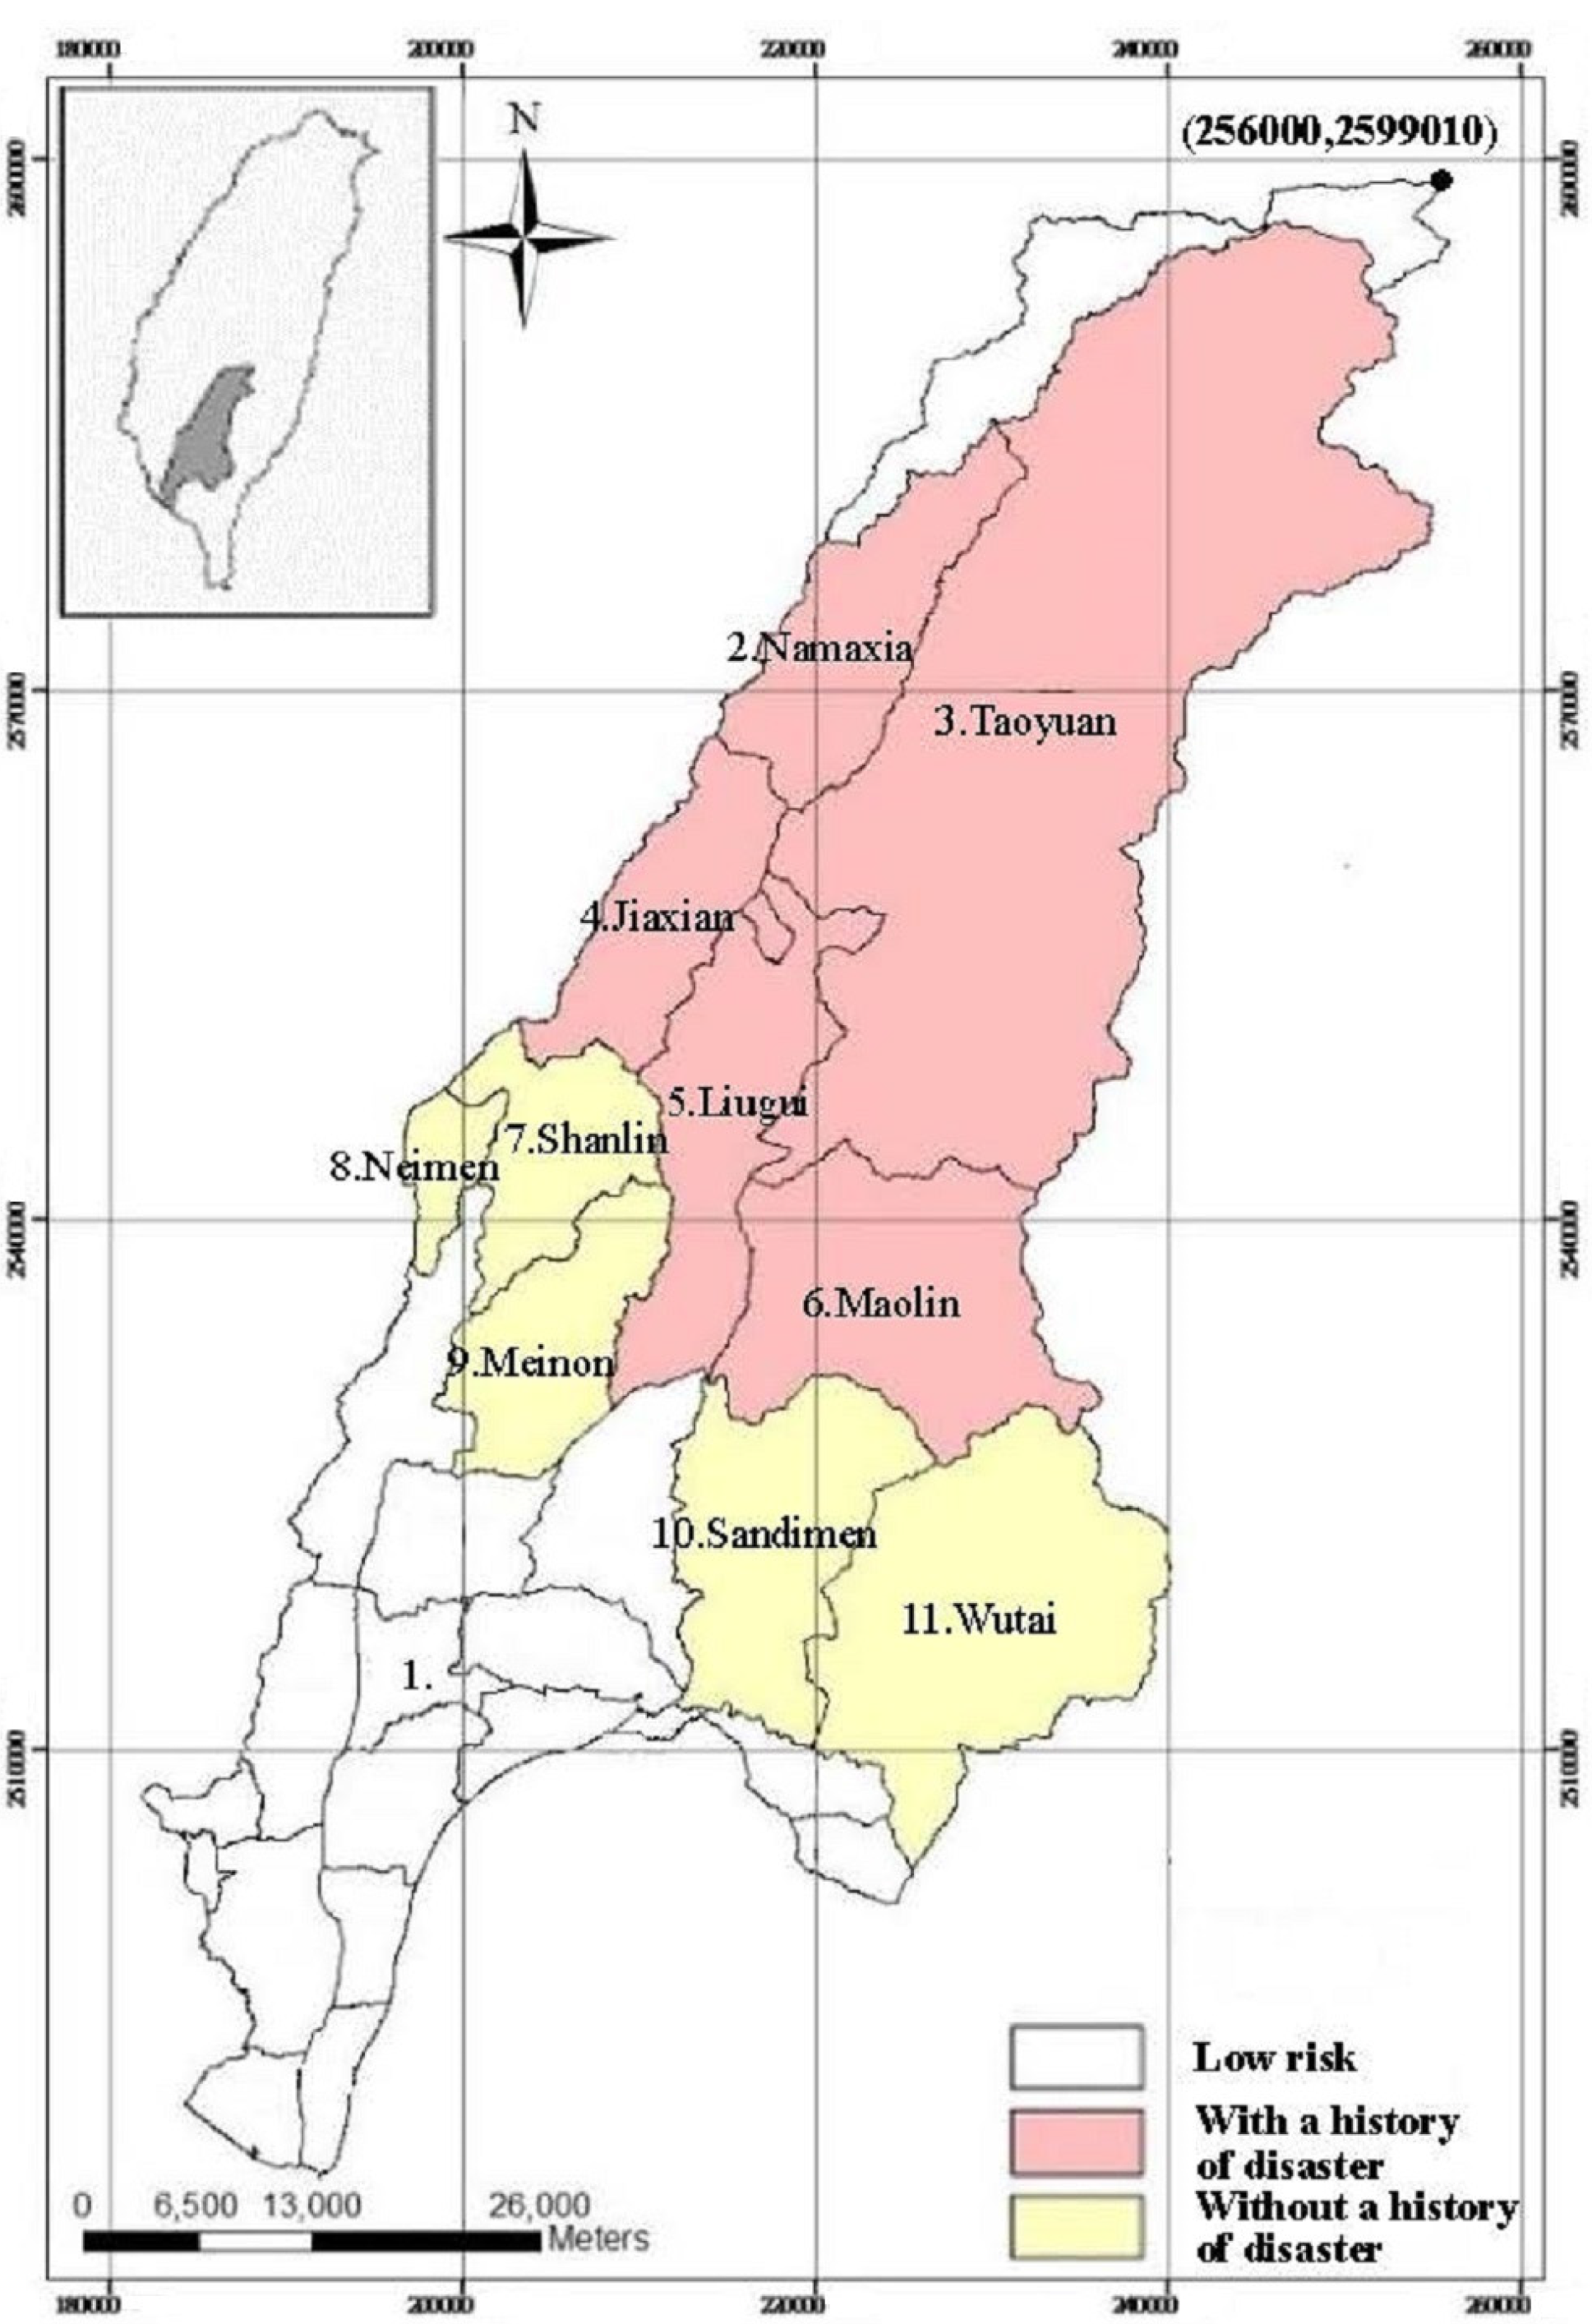
57], the study region was then divided into high-risk zones and low-risk zones, the former of which were further categorized according to whether they had a history of disasters. The geographical locations of these zones are presented in
Figure 2. A total of 11 zones were derived in three categories, the classification principles of which are as follows:
High-risk zones with a history of disaster: Five zones where disasters had occurred due to Typhoon Morakot, including the Namaxia District.
High-risk zones without a history of disaster: Five zones where disasters had not occurred due to Typhoon Morakot, including the Shanlin District.
Low-risk zones: Zones that were deemed to have no protection targets (via satellite images) or were situated in relatively flat and level areas with an FS exceeding 8 and low risk of slope instability.
Figure 2 presents the categories of the various zones and the numbers used for identification.
Figure 2.
Zones in study region (at village/town level).
Figure 2.
Zones in study region (at village/town level).
3.2. Processing of Model Parameters
3.2.1. Slope and Soil Thickness
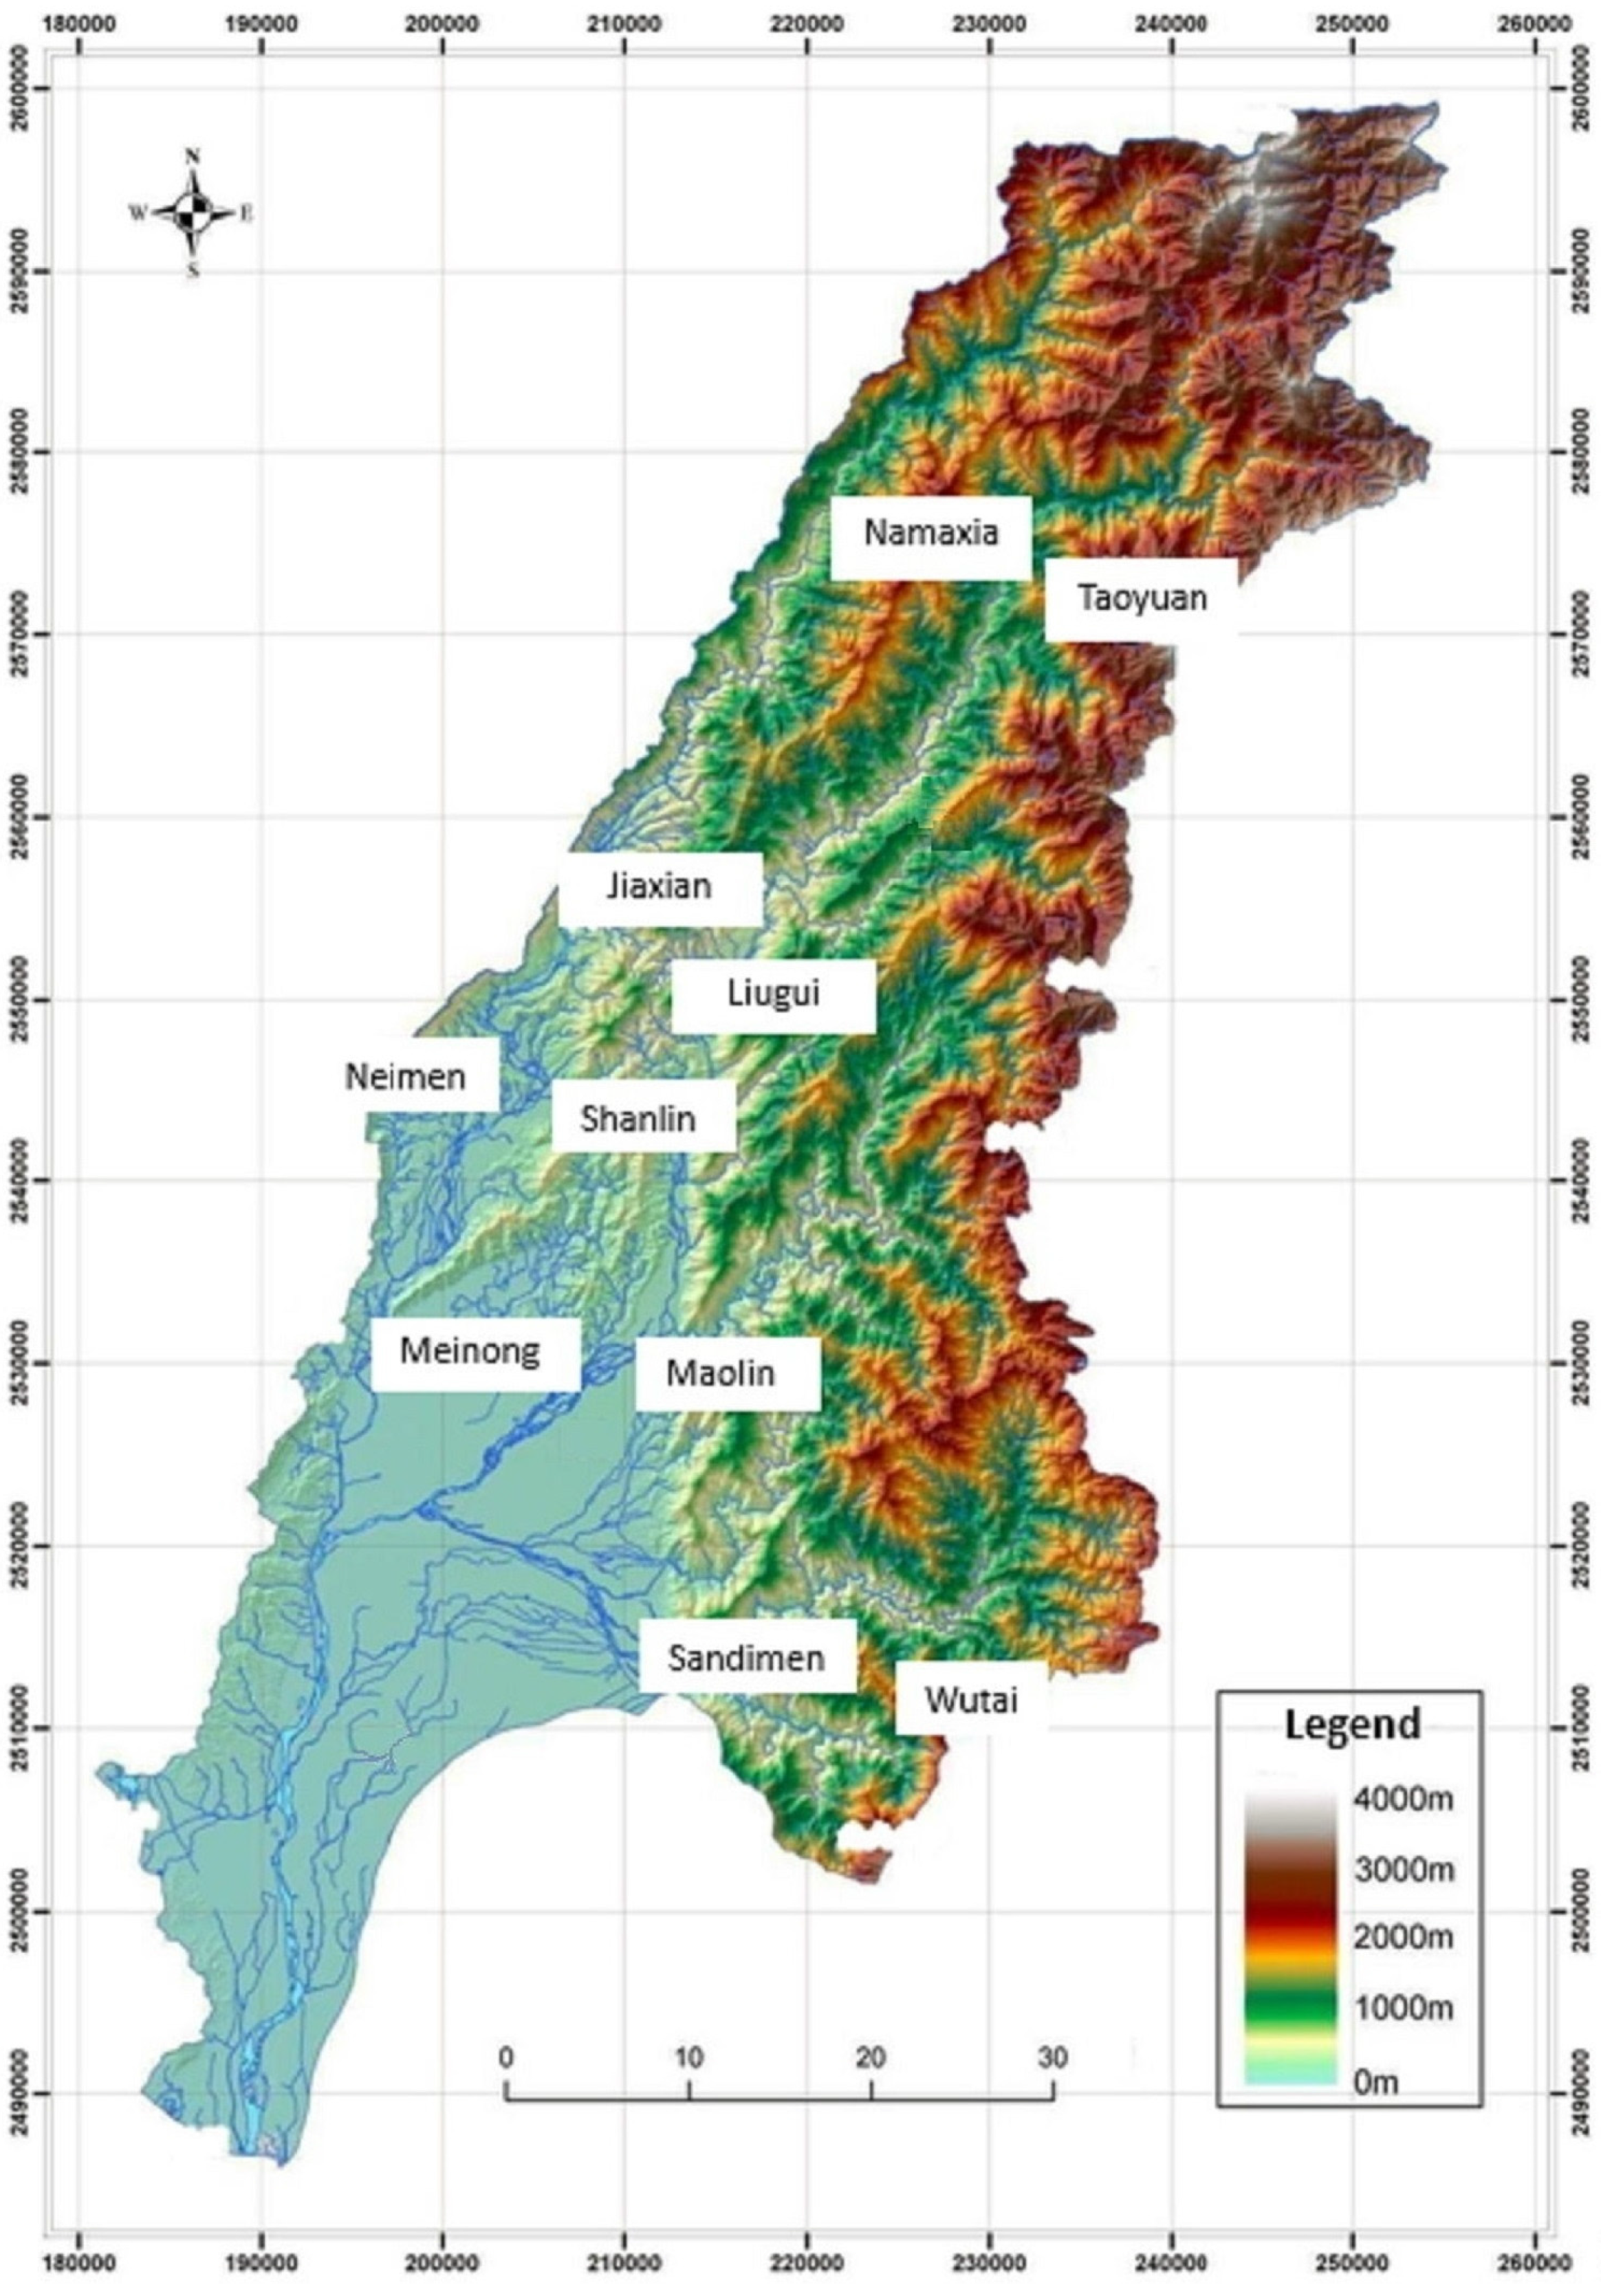
This study employed a digital elevation model (DEM) of the Gaoping River catchment with a 40 m × 40 m square grid (As shown in
Figure 3). Data related to slope degree was obtained via field survey or calculation using the DEM. Wang,
et al. [
58] examined the pros and cons of these two methods. The latter approach was selected for the calculation of slope, using the elevation data from the DEM itself. The spatial analysis tool of the GIS platform was used to convert elevation data into mean values. Slope degrees (°) were used as the unit to facilitate integration with the physical model.
Figure 3.
The DEM and river network map in the catchment of the Gaoping River (CGS, 2009).
Figure 3.
The DEM and river network map in the catchment of the Gaoping River (CGS, 2009).
With regard to soil thickness, most of the slope collapses investigated in this study occurred in weathered surface soil in mountainous regions. It was therefore necessary to estimate the thickness of the surface soil. An investigation conducted by the Central Geology Survey (CGS) of the Ministry of Economic Affairs indicated that the thickness of soil in mountainous areas in Taiwan ranges between 0.25 and 3.6 m, concentrated between 0 and 2 m [
18].
Using an empirical formula, Chen,
et al. [
59] estimated landslide volume by using the product of landslide area and depth and conducted statistical analysis on the landslide volume and the corresponding landslide area.
Table 2 presents the results integerized by the National Science and Technology Center for Disaster Reduction (NCDR) [
60]. Owing to the local applicability of the results, the depths corresponding to the range of angles used by the NCDR were employed for the estimation of slope.
Table 2.
Slope and depths used by National Science and Technology Center for Disaster Reduction (NCDR).
Table 2.
Slope and depths used by National Science and Technology Center for Disaster Reduction (NCDR).
| Slope Degrees (°) | Soil Depth (m) |
|---|
| <20 | 1.5 |
| 20–30 | 3.5 |
| 30–40 | 4.5 |
| 40–50 | 2.5 |
| >50 | 1.0 |
3.2.2. Groundwater Depth and Flow Direction
Most of the surface soil in mountainous areas is colluvial. Precipitation infiltrates the soil and raises the groundwater level. Unweathered bedrock under the surface soil is less permeable, such that infiltrating rainfall gradually accumulates at the junction between rock and soil [
60,
61,
62]. As a result, the initial depth of the groundwater in this study is the same as the depth of the soil.
The TRIGRS model also has a runoff algorithm function. The flow direction analysis tool in the ArcGIS (Eris, London, UK) platform was employed to input the DTM layer for conversion to surface flow data in the study region.
3.2.3. Soil Parameters
For the initial settings with regard to cohesiveness (
C), we used the friction angle (Ø), unit weight (
), permeability coefficient (
k), diffusion coefficient (
d), and infiltration coefficient (
iz), in the assessment project: Database for upstream watersheds of flood-prone areas effect of hydrogeology on slope stability (2/3) result report by the CGS as a reference [
16]. Based on the distribution of the soil property parameters in the study region (
Figure 4), the mean for each zone was adopted as the initial setting, which then underwent calibration in order to obtain a parameter combination in line with the actual physical properties.
Figure 4.
(a) Distribution of geological parameter C in Gaoping River catchment; (b) Distribution of geological parameter Ø in Gaoping River catchment; (c) Distribution of geological parameter γt in Gaoping River catchment; (d) Distribution of geological parameters k in Gaoping River catchment; (e) Distribution of geological parameters d in Gaoping River catchment; (f) Distribution of geological parameters iz in Gaoping River catchment (Central Geological Survey, 2009)
3.3. Calibration of Rainfall Scenario Data
The Quantitative Precipitation Estimation and Segregation Using Multiple Sensor (QPESUMS) system was used to process rainfall data in this study. This was imported into the QPE grid of the TWD97 coordinate system to determine the spatial distribution of rainfall.
The QPESUMS system enabled the capture of hourly rainfall data during Typhoon Morakot for application to zones with and without a history of disaster in the catchment of the Gaoping River. The aim was to simulate variations in rainfall in the study region during Typhoon Morakot.
3.4. Rainfall Data Used to Assess Applicability of Rainfall Thresholds
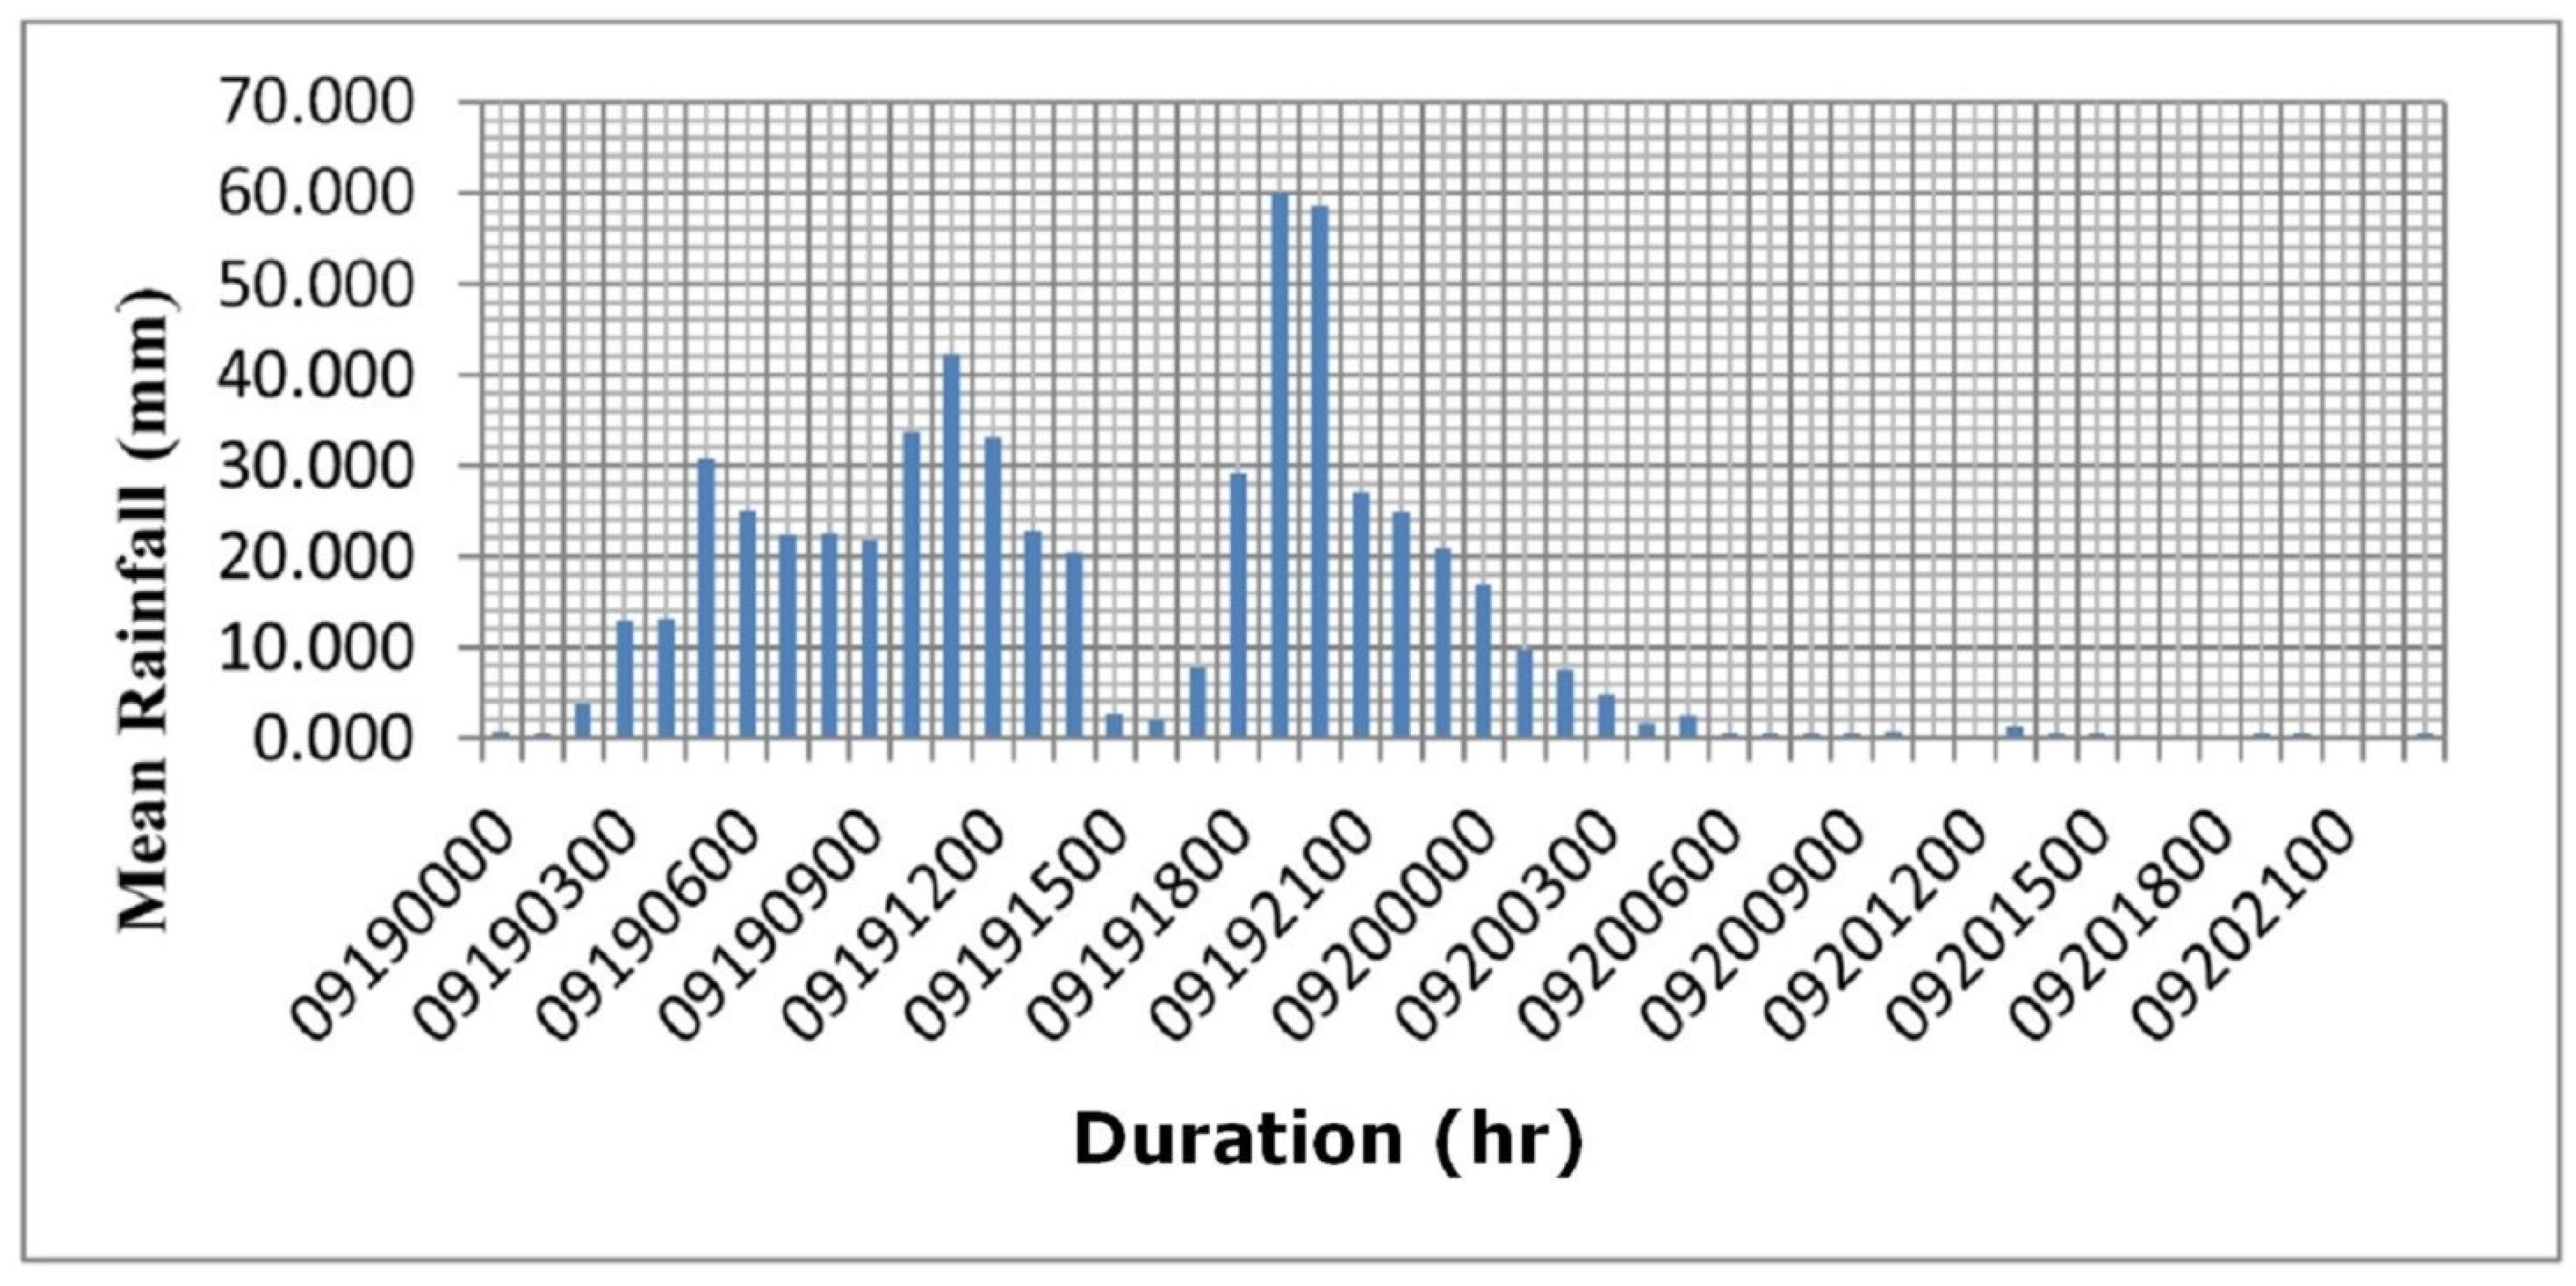
To assess the applicability of the rainfall thresholds established for early warning systems, rainfall data obtained during Typhoon Fanapi in 2010 was selected as a case scenario. During this typhoon, Liugui District was the only zone to suffer landslide disasters and was therefore selected for the assessment of the FS and rainfall thresholds established in this study. The distribution of rainfall in the QPESUMS system was also used in the simulation based on the mean rainfall of all the grids in Liugui District during the typhoon.
Figure 5 presents the results of rainfall statistics.
Figure 5.
Rainfall statistics of No. 05 Liugui District (during Typhoon Fanapi scenario).
Figure 5.
Rainfall statistics of No. 05 Liugui District (during Typhoon Fanapi scenario).
4. Analysis and Evaluation of Landslide Area
4.1. Model Calibration
To calibrate the parameters used in this study, a comparison was conducted using data obtained at the times when the actual disasters took place. Small adjustments were made to the geological parameters to ensure that the minimum FS in the study region at the times of the actual landslides was less than 1.0. The principles on which calibrations were performed were those established by the CGS [
16].
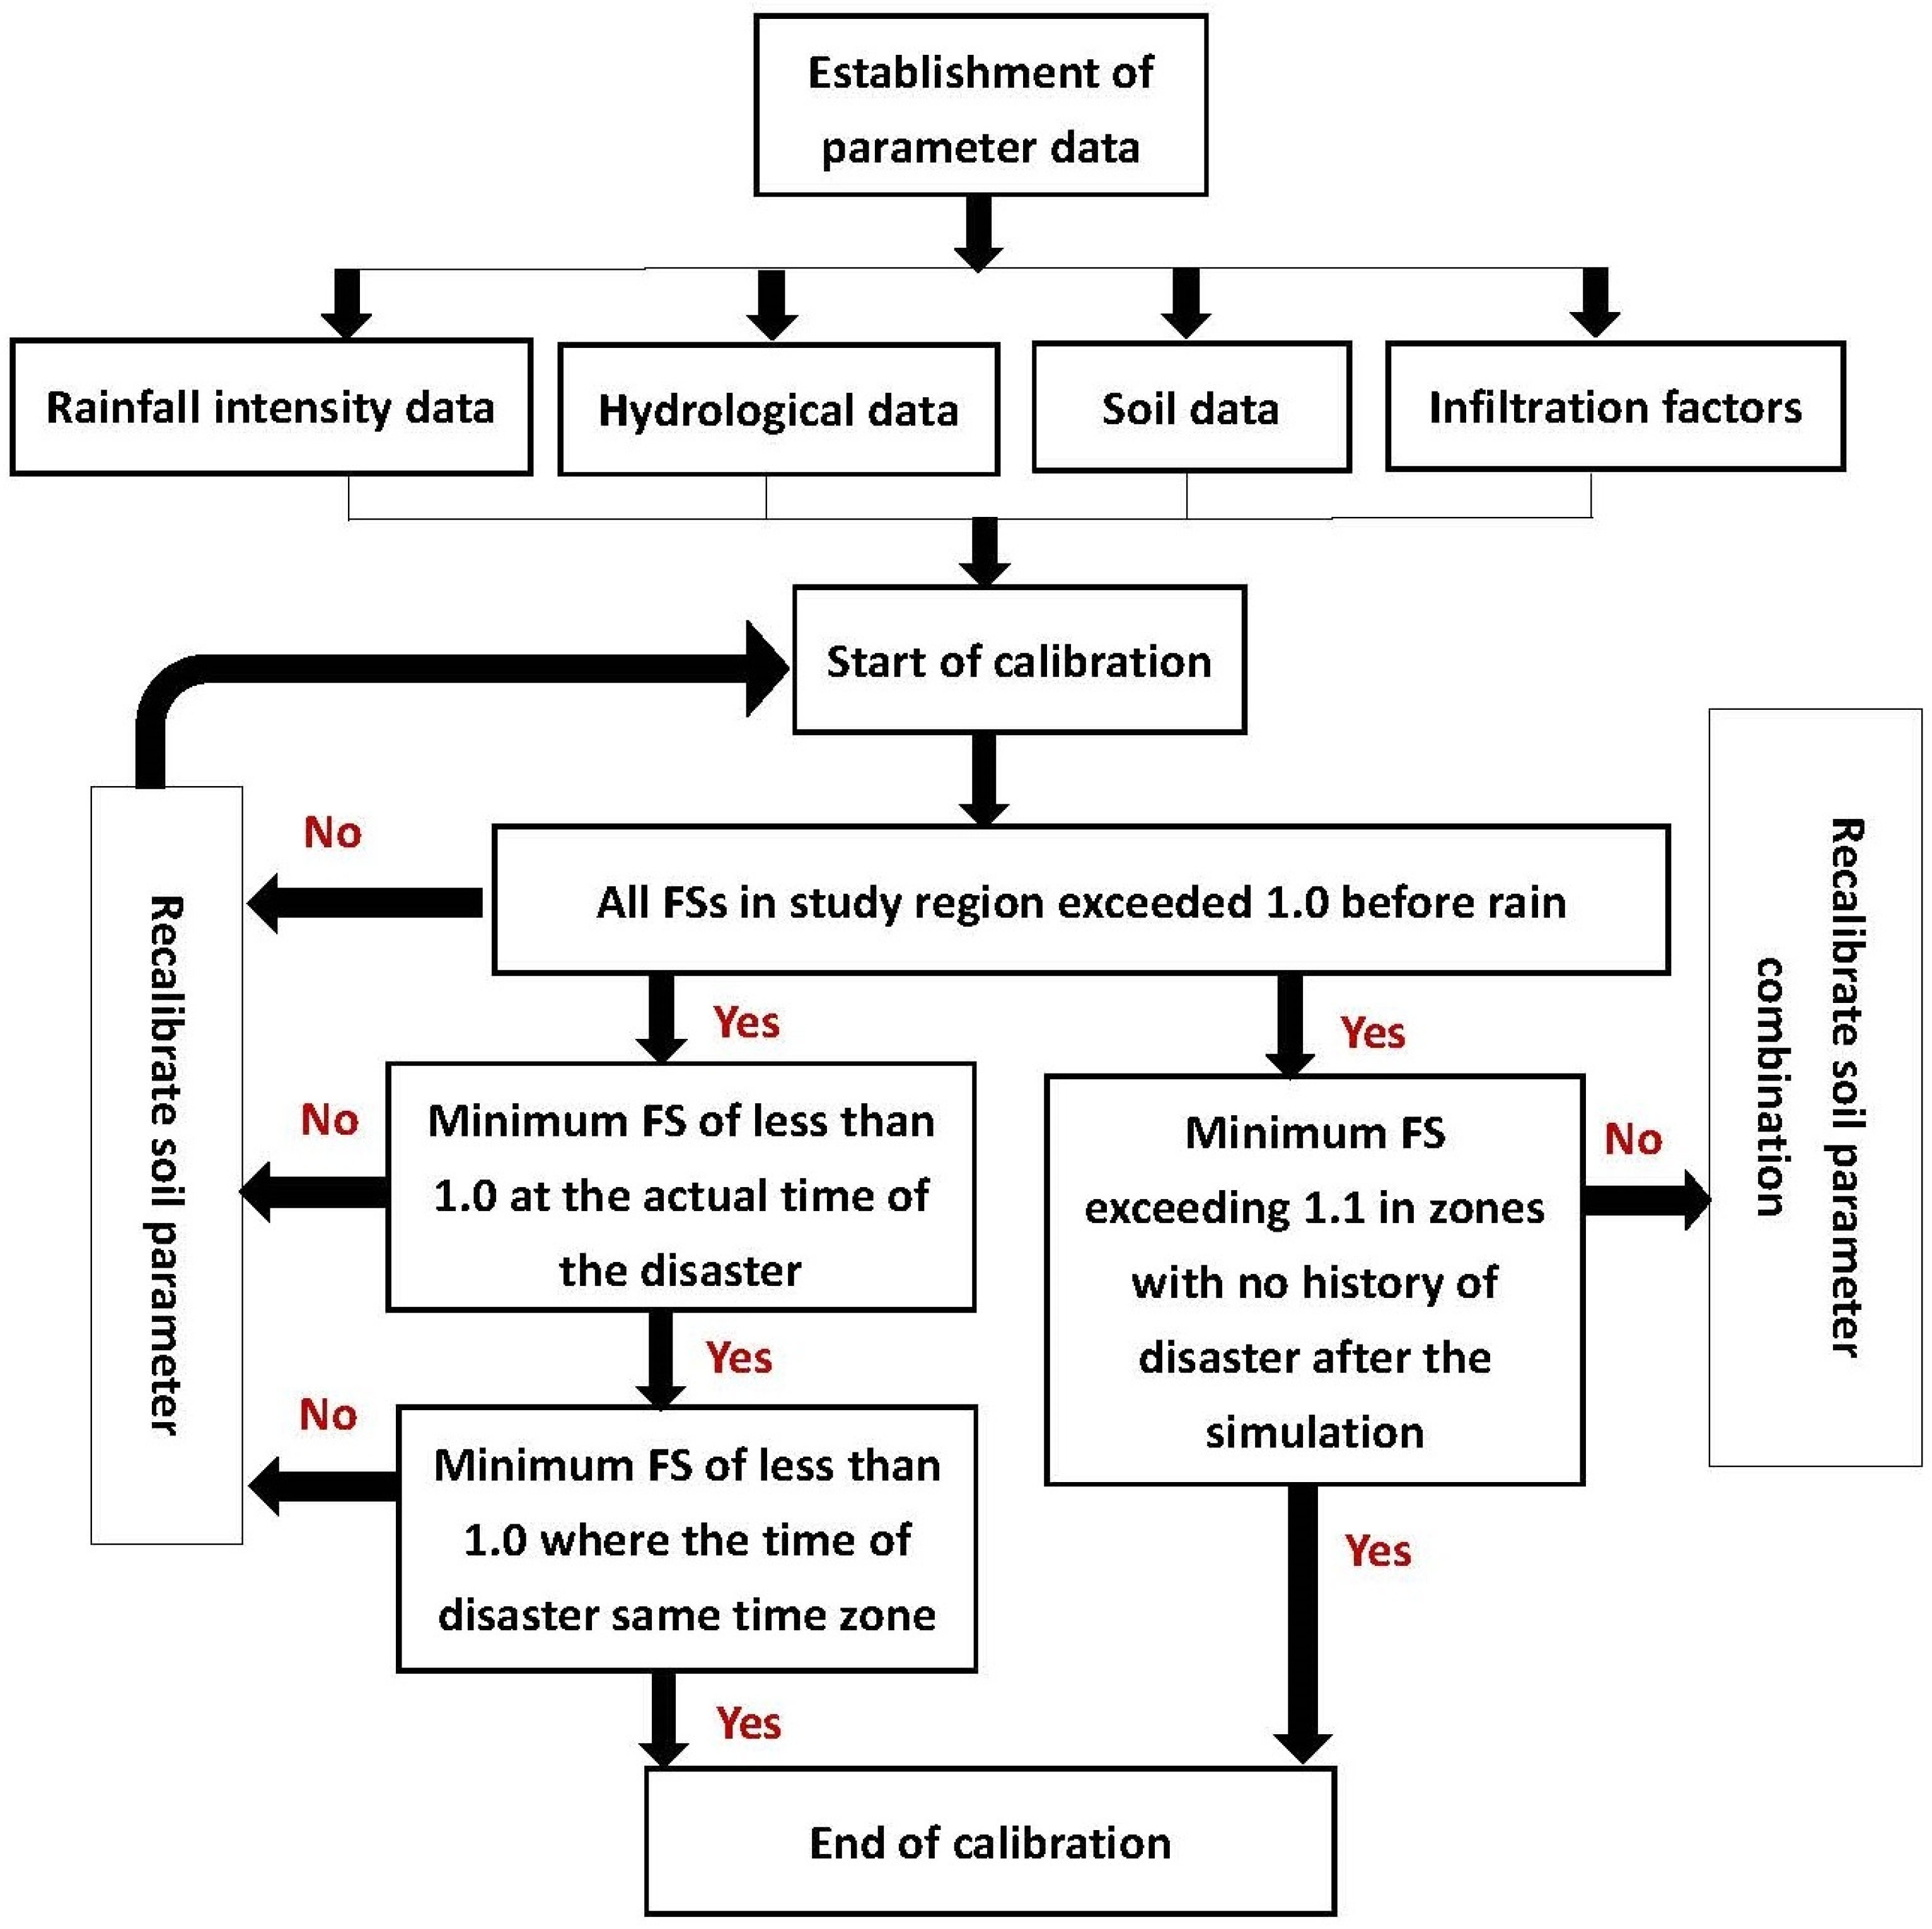
Figure 6 exhibits the calibration procedure. The geological parameters in the various study zones were calibrated according to these principles, to ensure that the combinations of mechanical parameters were as close as possible to those of the actual soil conditions.
The FS criteria of the various models are as follows.
The results prior to rainfall-induced landslides should be in line with actual conditions; i.e., none of the FSs should less than 1.0.
The actual times of the historical disasters served as the primary basis for comparison in inverse calibration. The models must reflect actual disasters, and the overall FS should be less than 1.0 at the time of the disaster.
The times listed in disaster reports should be the same as the results obtained in the simulations; i.e., the minimum overall FS during the time at which the disasters occurred should also be less than 1.0.
Compared with actual historical landslides, the Building Technical Regulations [
63] and the Soil and Water Conservation Manual [
64] suggest that the FS of areas without a history of disaster should exceed 1.1 under extreme rainfall conditions; therefore, 1.1 was set as the FS minimum following simulations of study zones without a history of disaster.
Figure 6.
Parameter calibration procedure used in the Transient Rainfall Infiltration and Grid-based Regional Slope-Stability (TRIGRS) model.
Figure 6.
Parameter calibration procedure used in the Transient Rainfall Infiltration and Grid-based Regional Slope-Stability (TRIGRS) model.
The calibration of geological parameters used sensitivity analysis conducted in previous research [
65] as a reference. The Architecture and Building Research Institute of the Ministry of the Interior [
66] performed sensitivity analysis on the parameters of a shallow landslide model, in which it was established that the effective cohesiveness of the soil has the greatest impact on variations in FS with the progress of rainfall infiltration. Thus, it was necessary to focus on the cohesiveness of the soil in the study region with all other parameters as auxiliary.
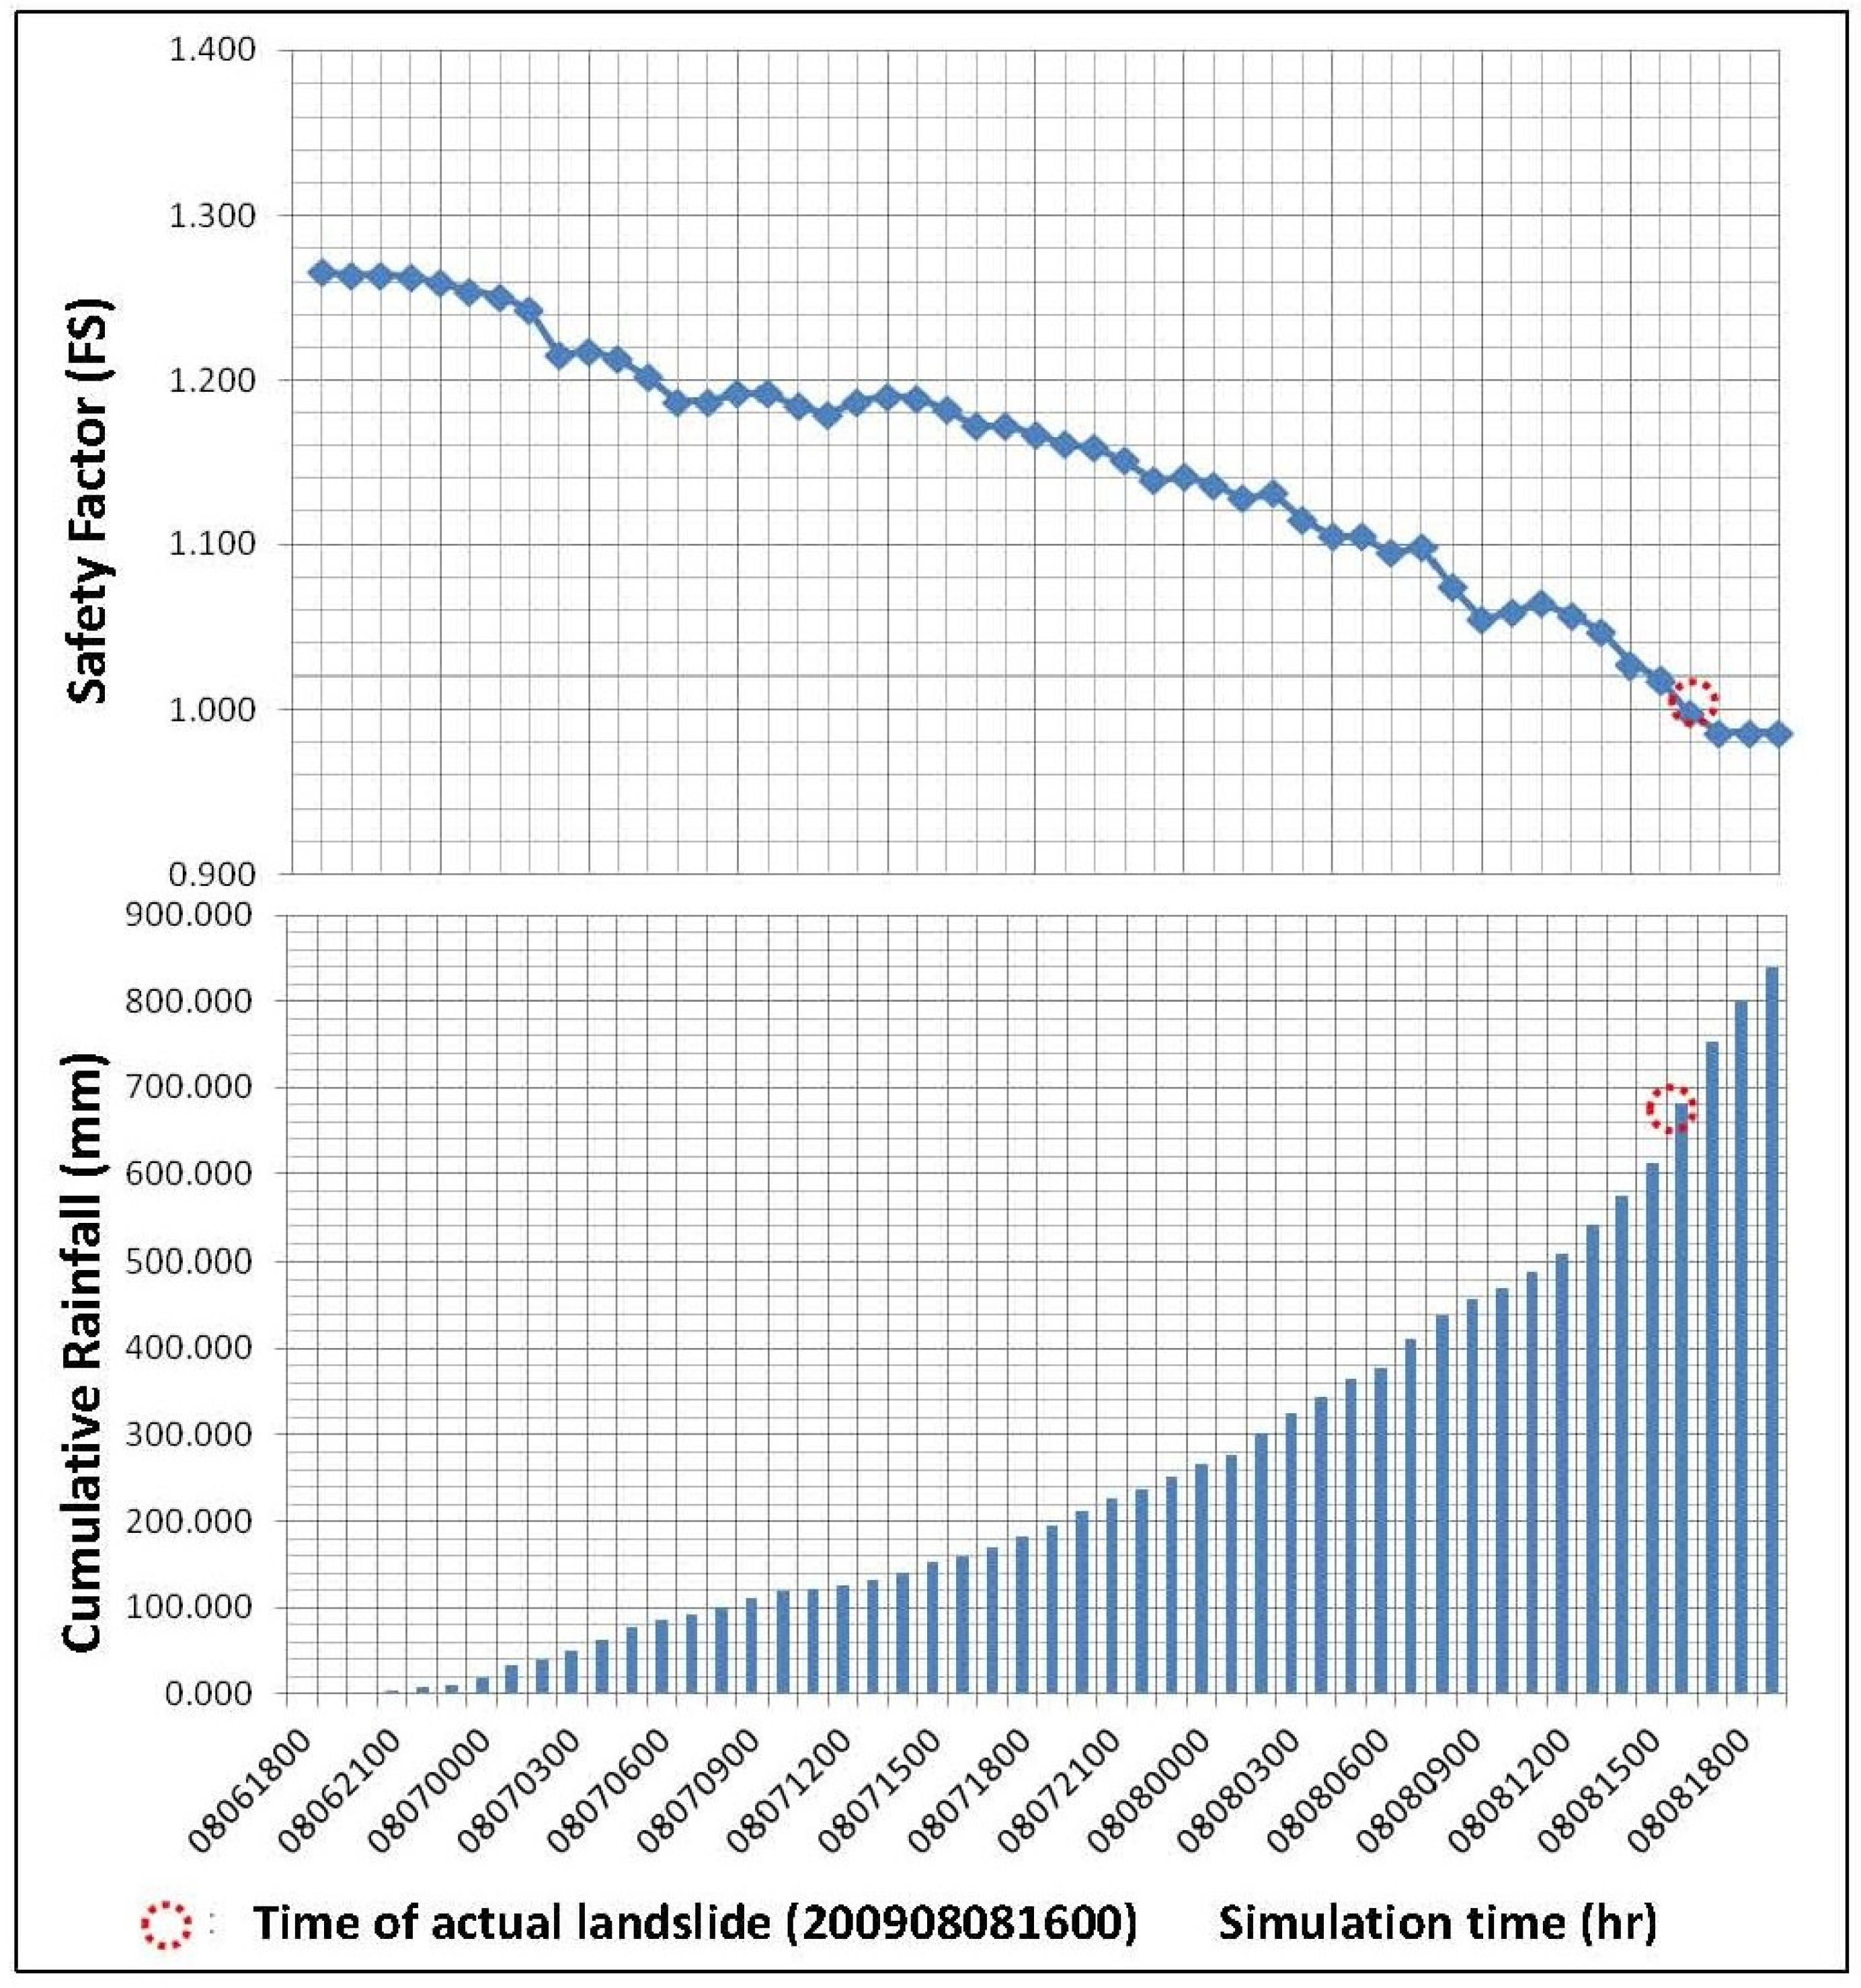
Figure 7 presents the calibration results for Study Zone No. 02 (Namaxia District) obtained using the aforementioned calibration process and scenario. The use of the FS graph after calibration made it possible to determine whether the parameter combinations established for the study zones are in accordance with the onsite geological parameters during Typhoon Morakot, as listed in
Table 3.
The relationship between cumulative rainfall and FS over time was used to establish FS thresholds for landslide warnings in the study region.
Figure 7.
Variations in the factor of safety (FS) in Study Zone No. 02 (Namaxia District) following calibration.
Figure 7.
Variations in the factor of safety (FS) in Study Zone No. 02 (Namaxia District) following calibration.
Table 3.
Parameters adopted for Study Zone No. 02 (Namaxia District).
Table 3.
Parameters adopted for Study Zone No. 02 (Namaxia District).
| Parameters | Unit | Range |
|---|
| Gradient | (°) | 0–70 |
| Depth of soil (Z) | m | 1–4.5 |
| Effective cohesion (C) | kPa | 30,500 |
| Effective friction angle () | (°) | 31 |
| Soil unit weight () | | 25,000 |
| Saturated hydraulic conductivity (Ksat) | m | 3.0 × 10⁻⁵ |
| Hydraulic diffusivity (diffuse) | | 1.0× 10⁻² |
| Initial infiltration rate (iz) | m | 5.0× 10⁻⁹ |
| Initial groundwater level (d) | m | 1–4.5 |
4.2. FS Thresholds for Landslide Warnings
The amount of time that it takes for various FS levels to drop to 1.0 was considered in establishing FS thresholds for landslide warnings. However, the FS data simulated by the TRIGRS model is hourly and therefore nonlinear. In the observation of FS variations in the zones with a history of disaster, three FS thresholds were tested: 1.1, 1.12, and 1.15.
Table 4 displays the time it takes for the FSs in the study zones to drop to various FS levels in the simulation with Typhoon Morakot.
Table 5 shows the amount of time between various FS levels and the time that landslides may occur (when the FS drops below 1.0) in zones with a history of disaster.
Table 4.
Simulation time between various factor of safety (FS) levels and thresholds for zones with a history of disaster.
Table 4.
Simulation time between various factor of safety (FS) levels and thresholds for zones with a history of disaster.
| No. | District | Morakot Typhoon Simulation time FS dropped to 1.0Time (h) | Morakot Typhoon Simulation time FS dropped to 1.1 Time (h) | Morakot Typhoon Simulation time FS dropped to 1.12 Time (h) | Morakot Typhoon Simulation time FS dropped to 1.15 Time (h) |
|---|
| 2 | Namaxia District | 47 | 37 | 32 | 28 |
| 3 | Taoyuan District | 42 | 31 | 29 | 16 |
| 4 | Jiaxian District | 47 | 36 | 32 | 25 |
| 5 | Liugui District | 36 | 31 | 28 | 22 |
| 6 | Maolin District | 55 | 32 | 26 | 23 |
Table 5.
Simulation time between various FS variations for zones with a history of disaster.
Table 5.
Simulation time between various FS variations for zones with a history of disaster.
| No. | District | Morakot Typhoon Simulation time FS dropped from 1.1 to 1.0 Time (h) | Morakot Typhoon Simulation time FS dropped from 1.12 to 1.0 Time (h) | Morakot Typhoon Simulation time FS dropped from 1.15 to 1.0 Time (h) |
|---|
| 2 | Namaxia District | 10 | 15 | 19 |
| 3 | Taoyuan District | 11 | 13 | 26 |
| 4 | Jiaxian District | 11 | 15 | 22 |
| 5 | Liugui District | 5 | 8 | 14 |
| 6 | Maolin District | 23 | 29 | 32 |
For the FS thresholds, a response time of 12 h was set for red alerts and 24 h for yellow alerts. Based on the model results, the FS thresholds of 1.12 and 1.15 were respectively determined for red and yellow alerts in the catchment of the Gaoping River.
4.3 .Cumulative Rainfall Thresholds for Landslide Warnings
Simulations using rainfall patterns were based on those in the Gaoping area for the assessment of rainfall thresholds for landslides. Using the TRIGRS model, 48-h simulations were performed on the zones with a history of disaster with changes in the FSs observed over time. The amounts of cumulative rainfall corresponding to the FS thresholds for red and yellow alerts were regarded as the rainfall thresholds used for landslide warnings.
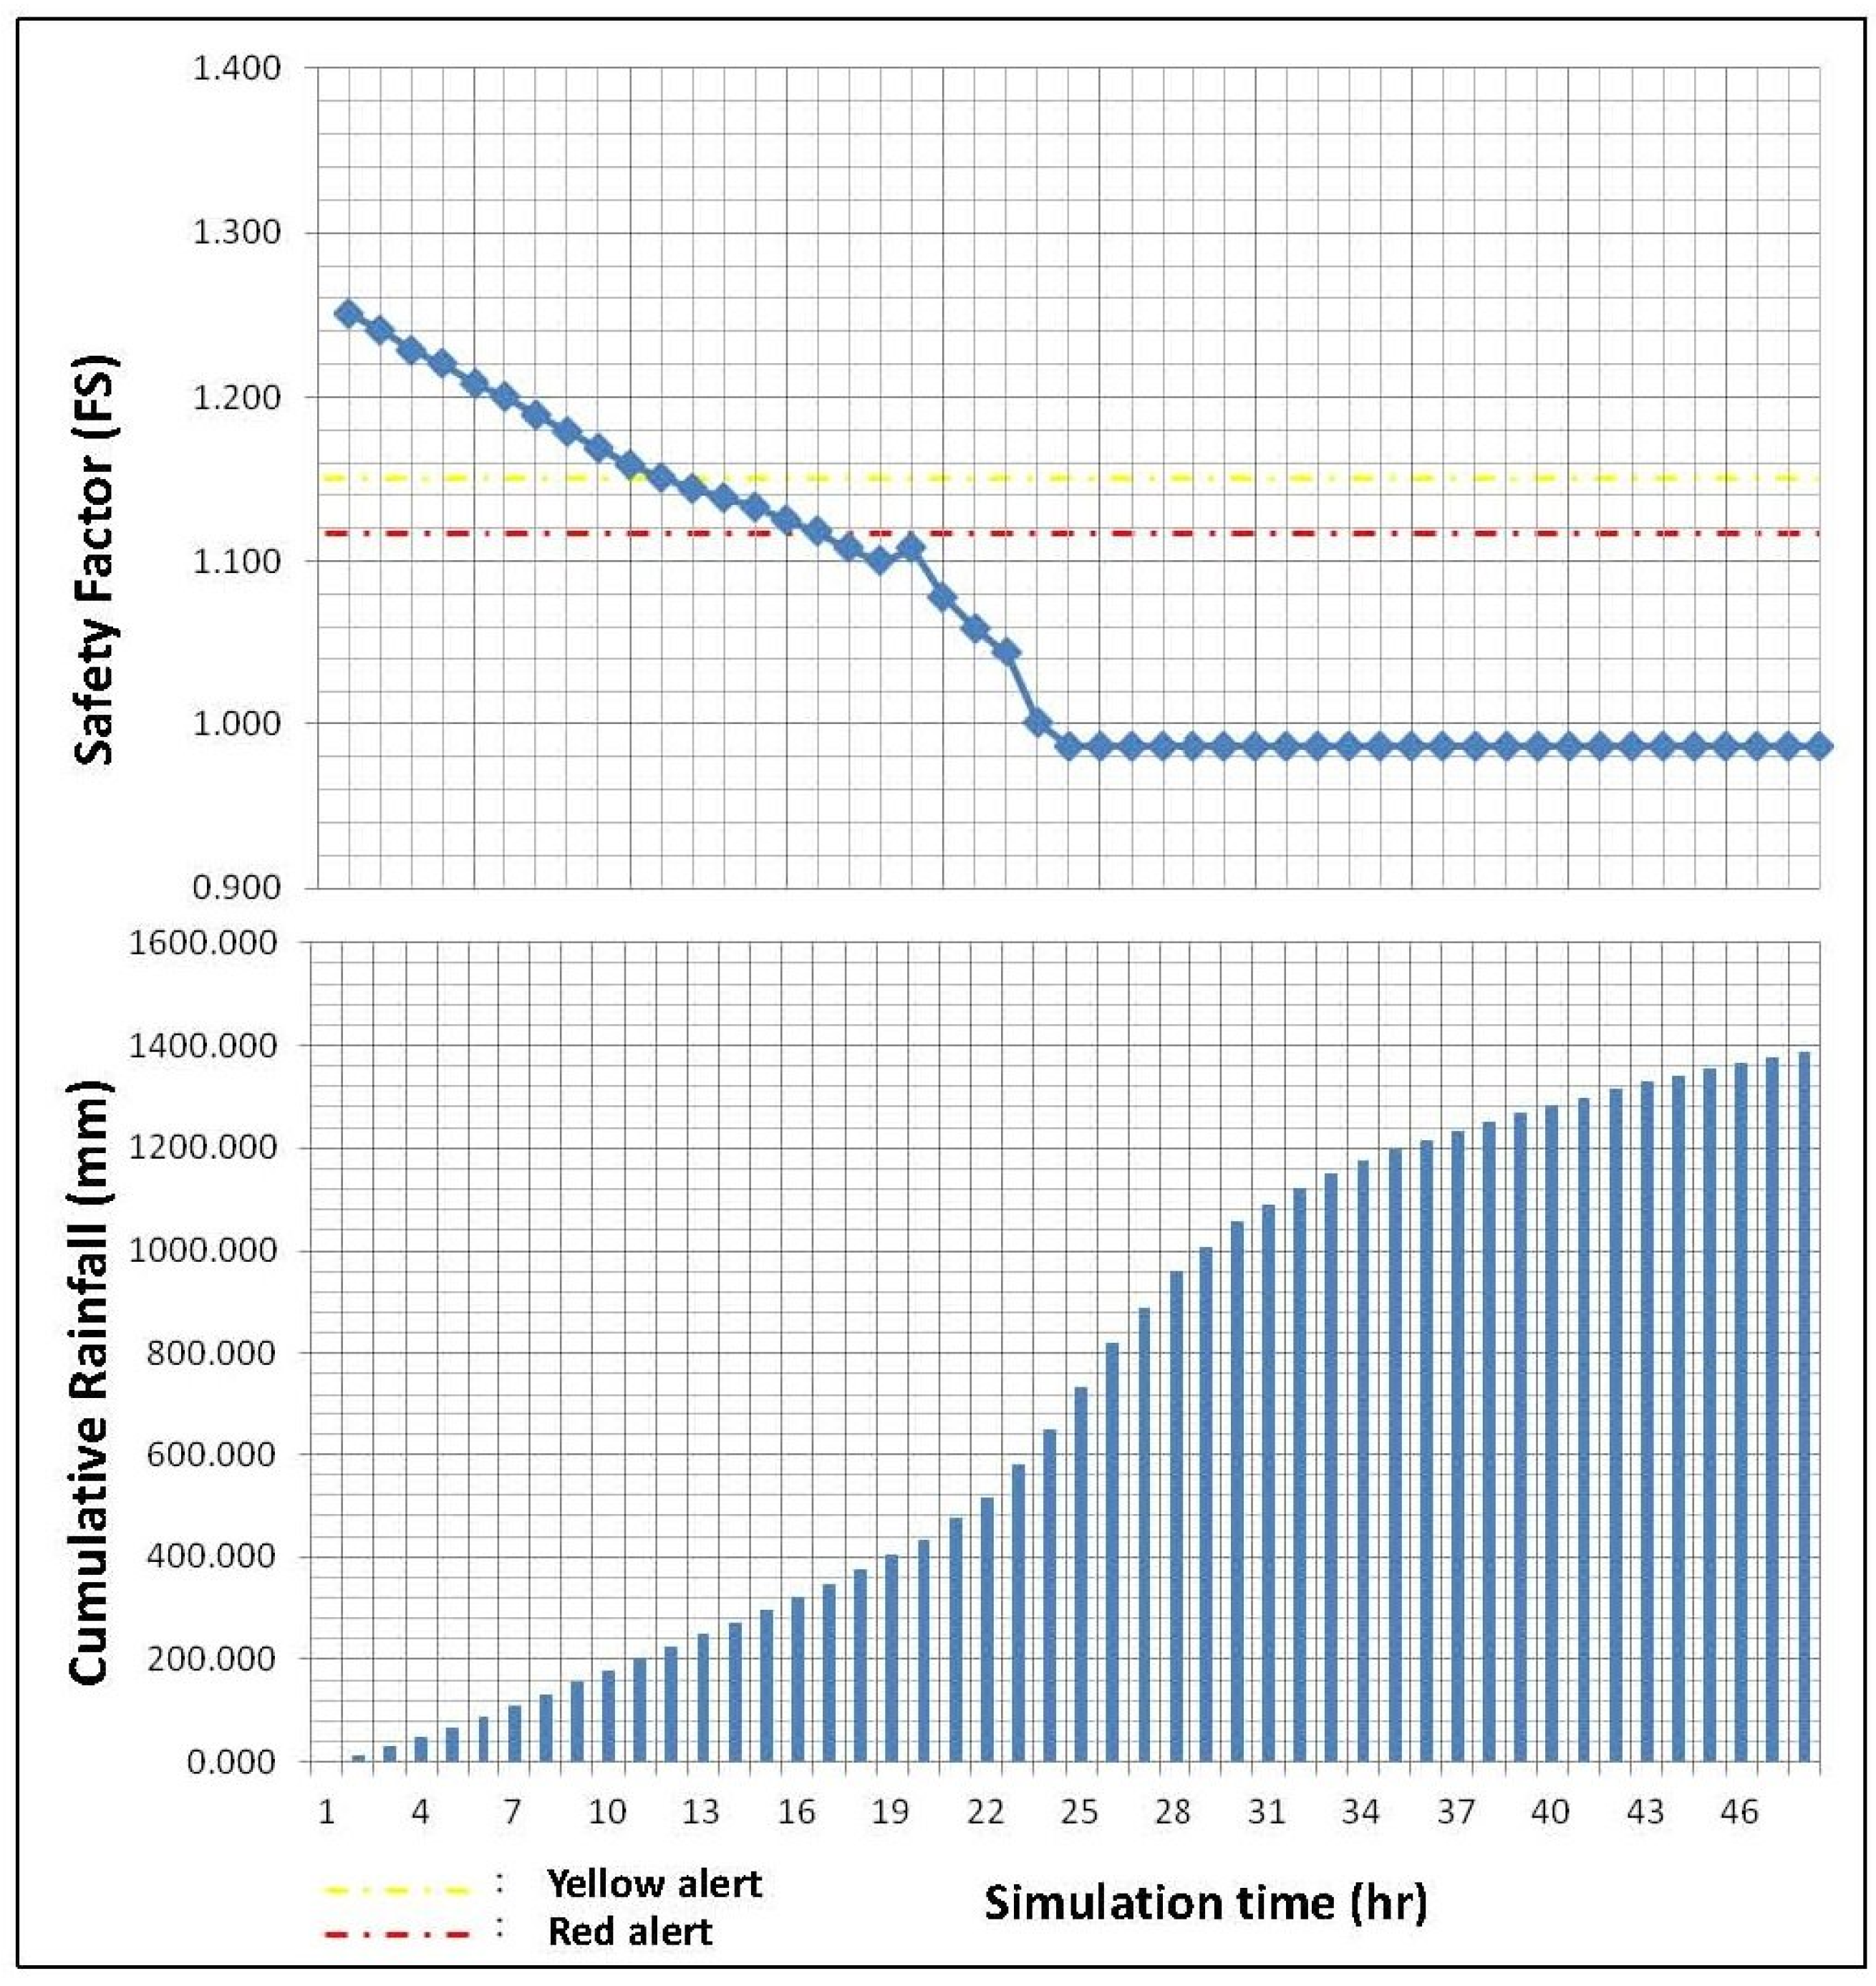
The TRIGRS model was executed using Study Zones No. 02 through 06, which have a disaster history of landslides. The FS variations and the amount of cumulative rainfall corresponding to the FS thresholds were used to assess the rainfall thresholds. The simulation scenario in this study covered a period of 48 h in which 700 mm of rain fell within a 24-h period. Study Zone No. 02 is a representative example in which the FS and cumulative rainfall graphs are displayed in
Figure 8.
Figure 8.
Variations in FS for Study Zone No. 02 Namaxia District (in proposed rainfall pattern scenario).
Figure 8.
Variations in FS for Study Zone No. 02 Namaxia District (in proposed rainfall pattern scenario).
Hourly changes in the FS from rainfall patterns in the catchment of the Gaoping River indicate changes in the minimum FS for each zone. The cumulative rainfall is marked at the point where the thresholds for the yellow and red alerts are reached indicating the rainfall thresholds for each zone in the rainfall pattern simulations. Our analysis results show that with the same rainfall pattern, Study Zone No. 02 Namaxia District was the first to reach the FS threshold for the yellow alert.
After determining the amount of time it takes for the FSs of the study zones to decline to the FS threshold under the designed rainfall patterns, the corresponding cumulative rainfalls associated with the rainfall patterns were used to calculate the rainfall thresholds for red and yellow alerts. Using the results in
Table 6, the zones in the catchment of the Gaoping River requiring particular caution during typhoon rainfall events, were identified. Furthermore, when the cumulative rainfall reached these warning thresholds, alerts would have to be issued and necessary measures taken.
No actual cases were available for a comparison of zones with no history of disaster. Thus, to set rainfall thresholds in these areas, the method used by the SWCB was used as a reference for rainfall (
i.e., using ranges of 0–100 mm, 101–200 mm,
etc.). The Maolin District was used as a reference because it has a history of disaster and the highest yellow alert threshold. The rainfall thresholds for yellow and red alerts were raised by 100 mm, the results of which are listed in
Table 7.
Table 6.
Cumulative rainfall thresholds for yellow and red alerts in zones with a history of disaster.
Table 6.
Cumulative rainfall thresholds for yellow and red alerts in zones with a history of disaster.
| No. | District | Design Rainfall Pattern Red Alerts FS = 1.12 Cumulative Rainfall (mm) | Design Rainfall Pattern Yellow Alerts FS = 1.15 Cumulative Rainfall (mm) |
|---|
| 2 | Namaxia District | 308 | 239 |
| 3 | Taoyuan District | 594 | 487 |
| 4 | Jiaxian District | 447 | 308 |
| 5 | Liugui District | 417 | 333 |
| 6 | Maolin District | 661 | 594 |
Table 7.
Cumulative rainfall thresholds for yellow and red alerts in zones without a history of disaster.
Table 7.
Cumulative rainfall thresholds for yellow and red alerts in zones without a history of disaster.
| No. | District | Design Rainfall Pattern Red Alerts FS = 1.12 Cumulative Rainfall (mm) | Design Rainfall Pattern Yellow Alerts FS = 1.15 Cumulative Rainfall (mm) |
|---|
| 1 | Other District | 900 | 800 |
| 7 | Shanlin District | 800 | 700 |
| 8 | Neimen District | 800 | 700 |
| 9 | Meinong District | 800 | 700 |
| 10 | Sandimen Township | 800 | 700 |
| 11 | Wutai Township | 800 | 700 |
The zones without a history of disaster were assigned higher rainfall thresholds than were those with a history of disaster. It is recommended that the collection of landslide cases be continued to provide more precise rainfall thresholds for future simulations.
4.4. Evaluation of Thresholds for Early Warnings
Rainfall data from Typhoon Fanapi were also used to conduct simulations on Liugui District, an area that has suffered a relatively high number of disasters in the Gaoping River catchment. The applicability of the thresholds was then evaluated as it pertains to typhoon events in order to determine whether they provide sufficient time for response units and the public to take appropriate action.
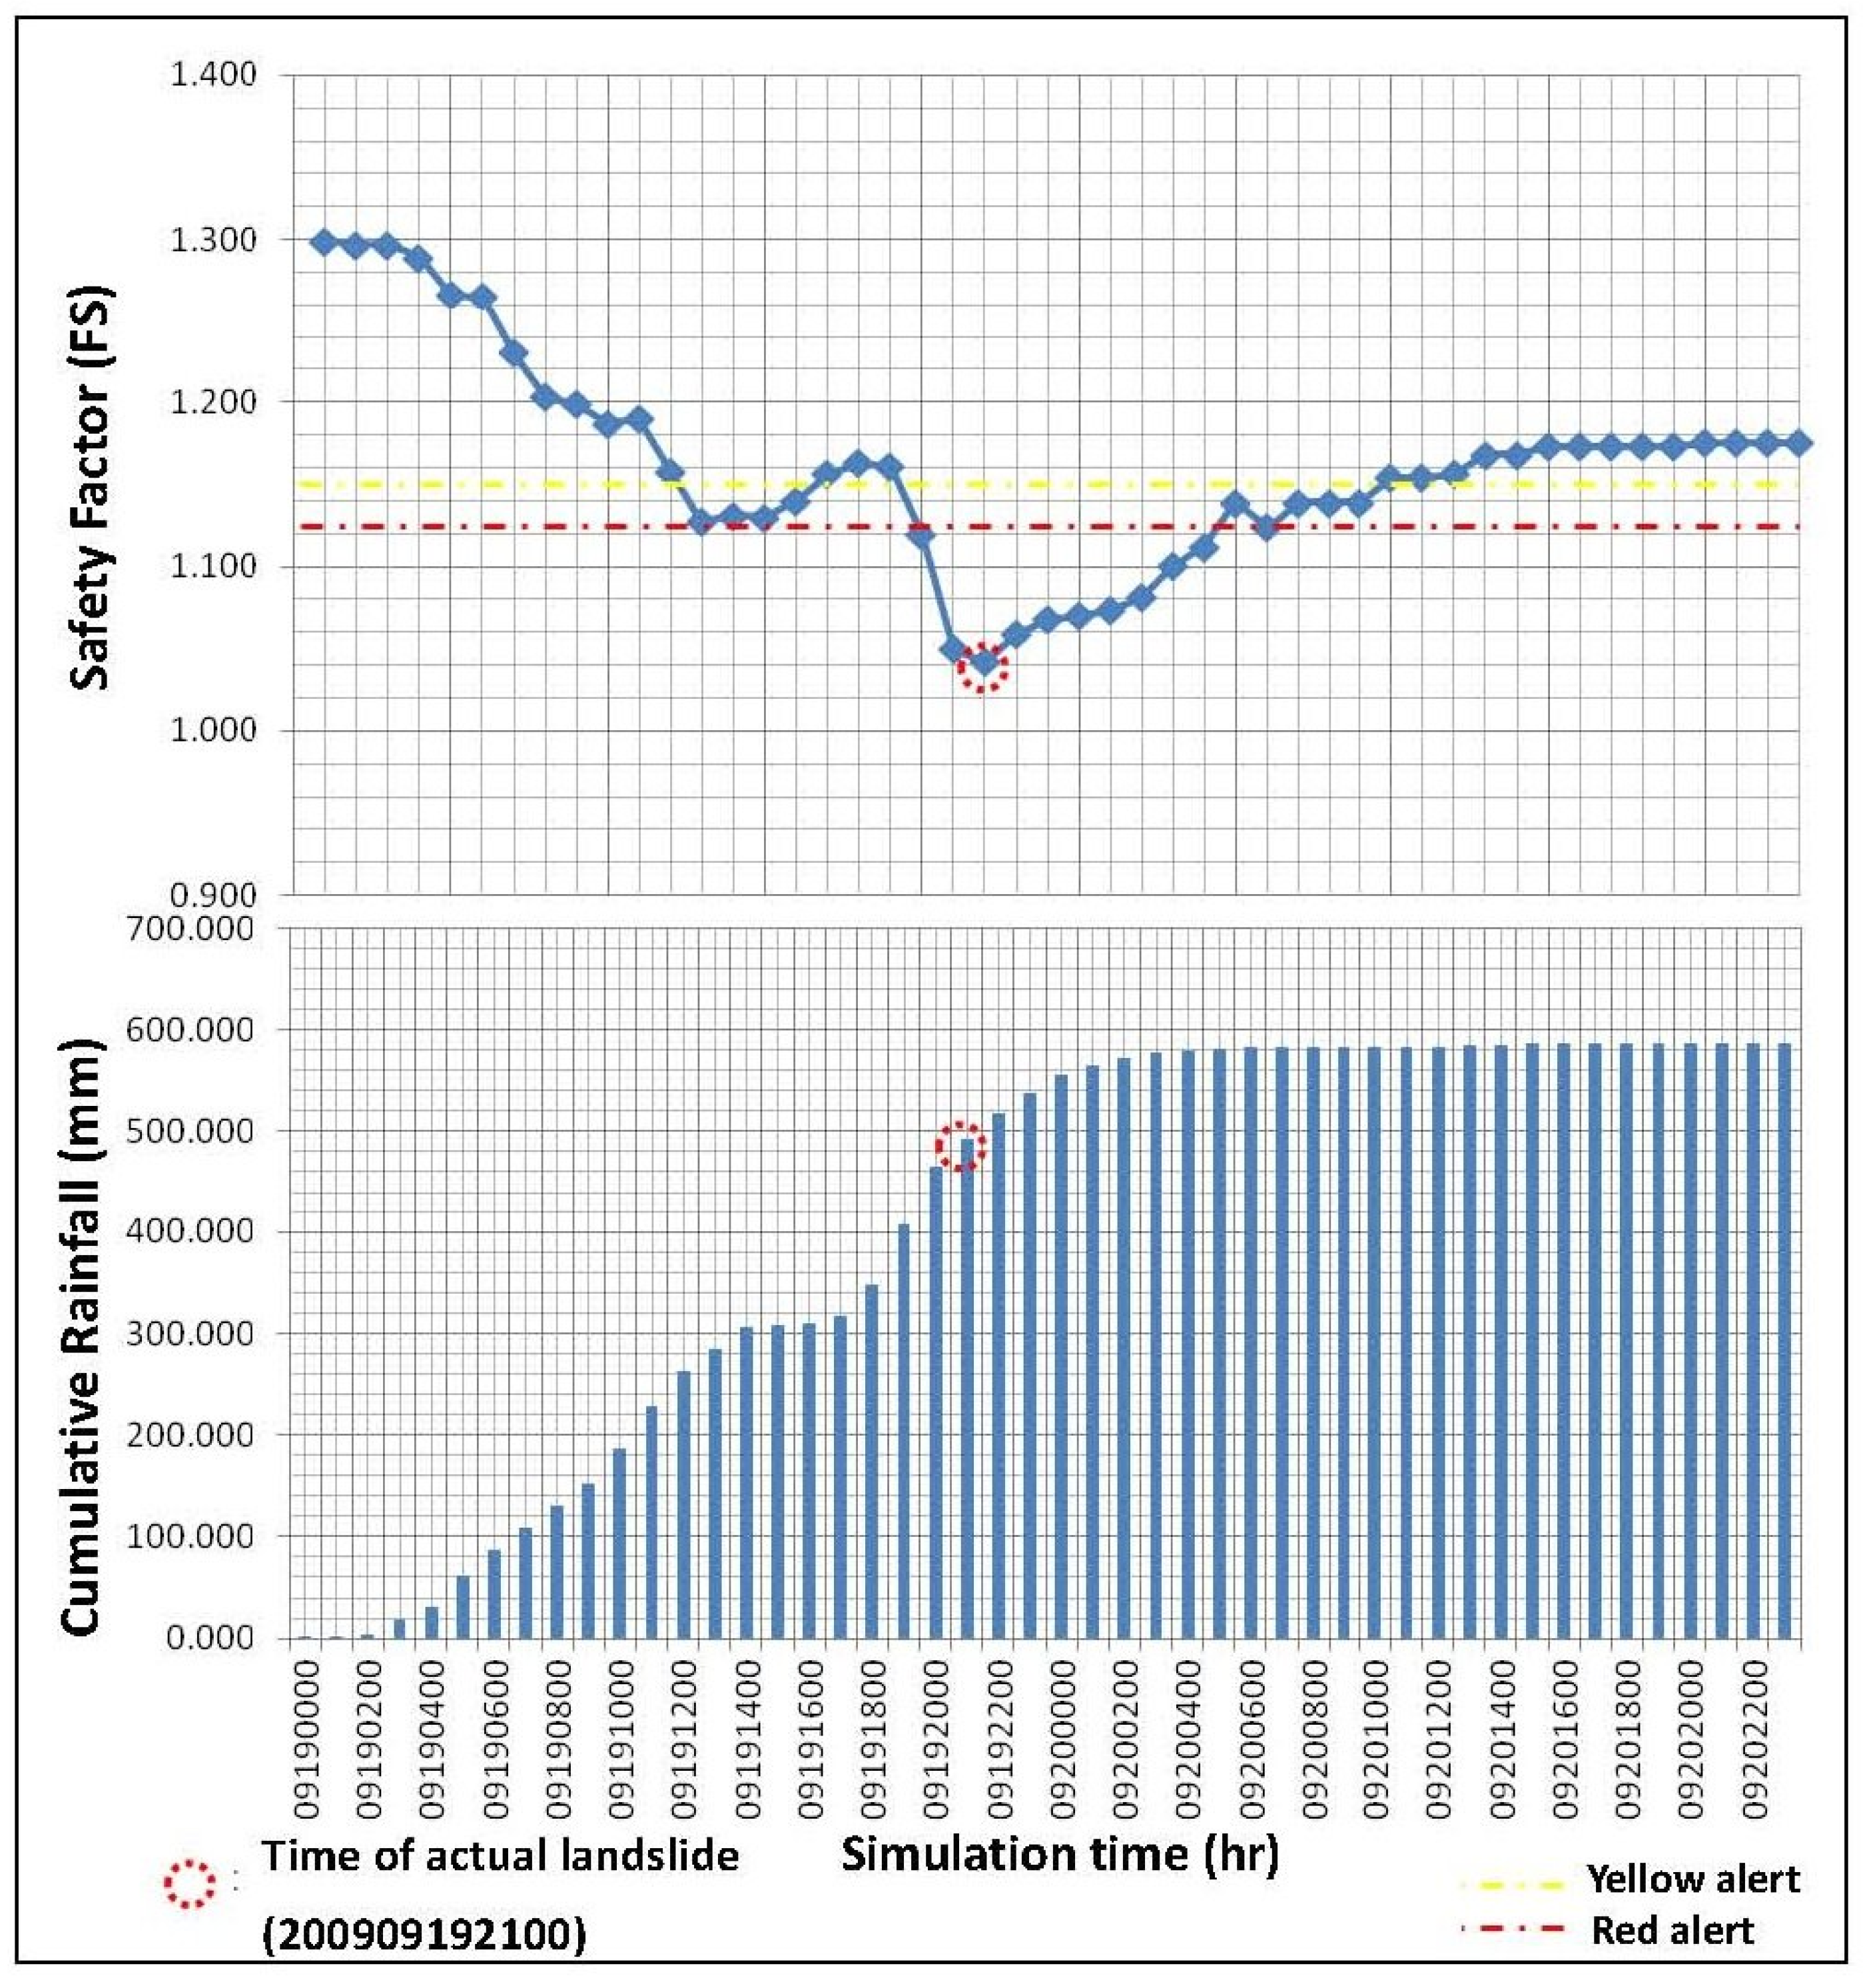
After selecting a suitable disaster scenario for evaluation, the TRIGRS model was again applied to Study Zone No. 05 (Liugui District) to observe changes in the FS during the simulation. The aim was to determine whether the thresholds for yellow and red alerts (FS at 1.12 and 1.15) provide sufficient response time to implement disaster prevention measures.
Figure 9 displays the changes in the minimum FS and the cumulative rainfall in Liugui District during the simulation.
In the Typhoon Fanapi scenario, the cumulative rainfall thresholds established using the statistical methods adopted by the SWCB and the NCDR for slope disasters in villages and towns respectively gave 7 h and 11 h for evacuation after the red alerts were issued. In contrast, the threshold established using the deterministic approach in this study provided 9 h of response time, which fell between the figures given by the SWCB and the NCDR. This provides an important reference for disaster prevention during floods and typhoons.
Figure 9.
Variations in FS for No. 05 Liugui District (during Typhoon Fanapi scenario).
Figure 9.
Variations in FS for No. 05 Liugui District (during Typhoon Fanapi scenario).
The primary difference between the rainfall thresholds established using statistical methods and those established using the deterministic approach adopted is the fact that the latter considers the actual physical properties of the soil in the study zones. The proposed model provides the spatial distribution of the FSs over a wide area, which helps to reveal sites where the soil is less stable and landslides are more likely to occur.
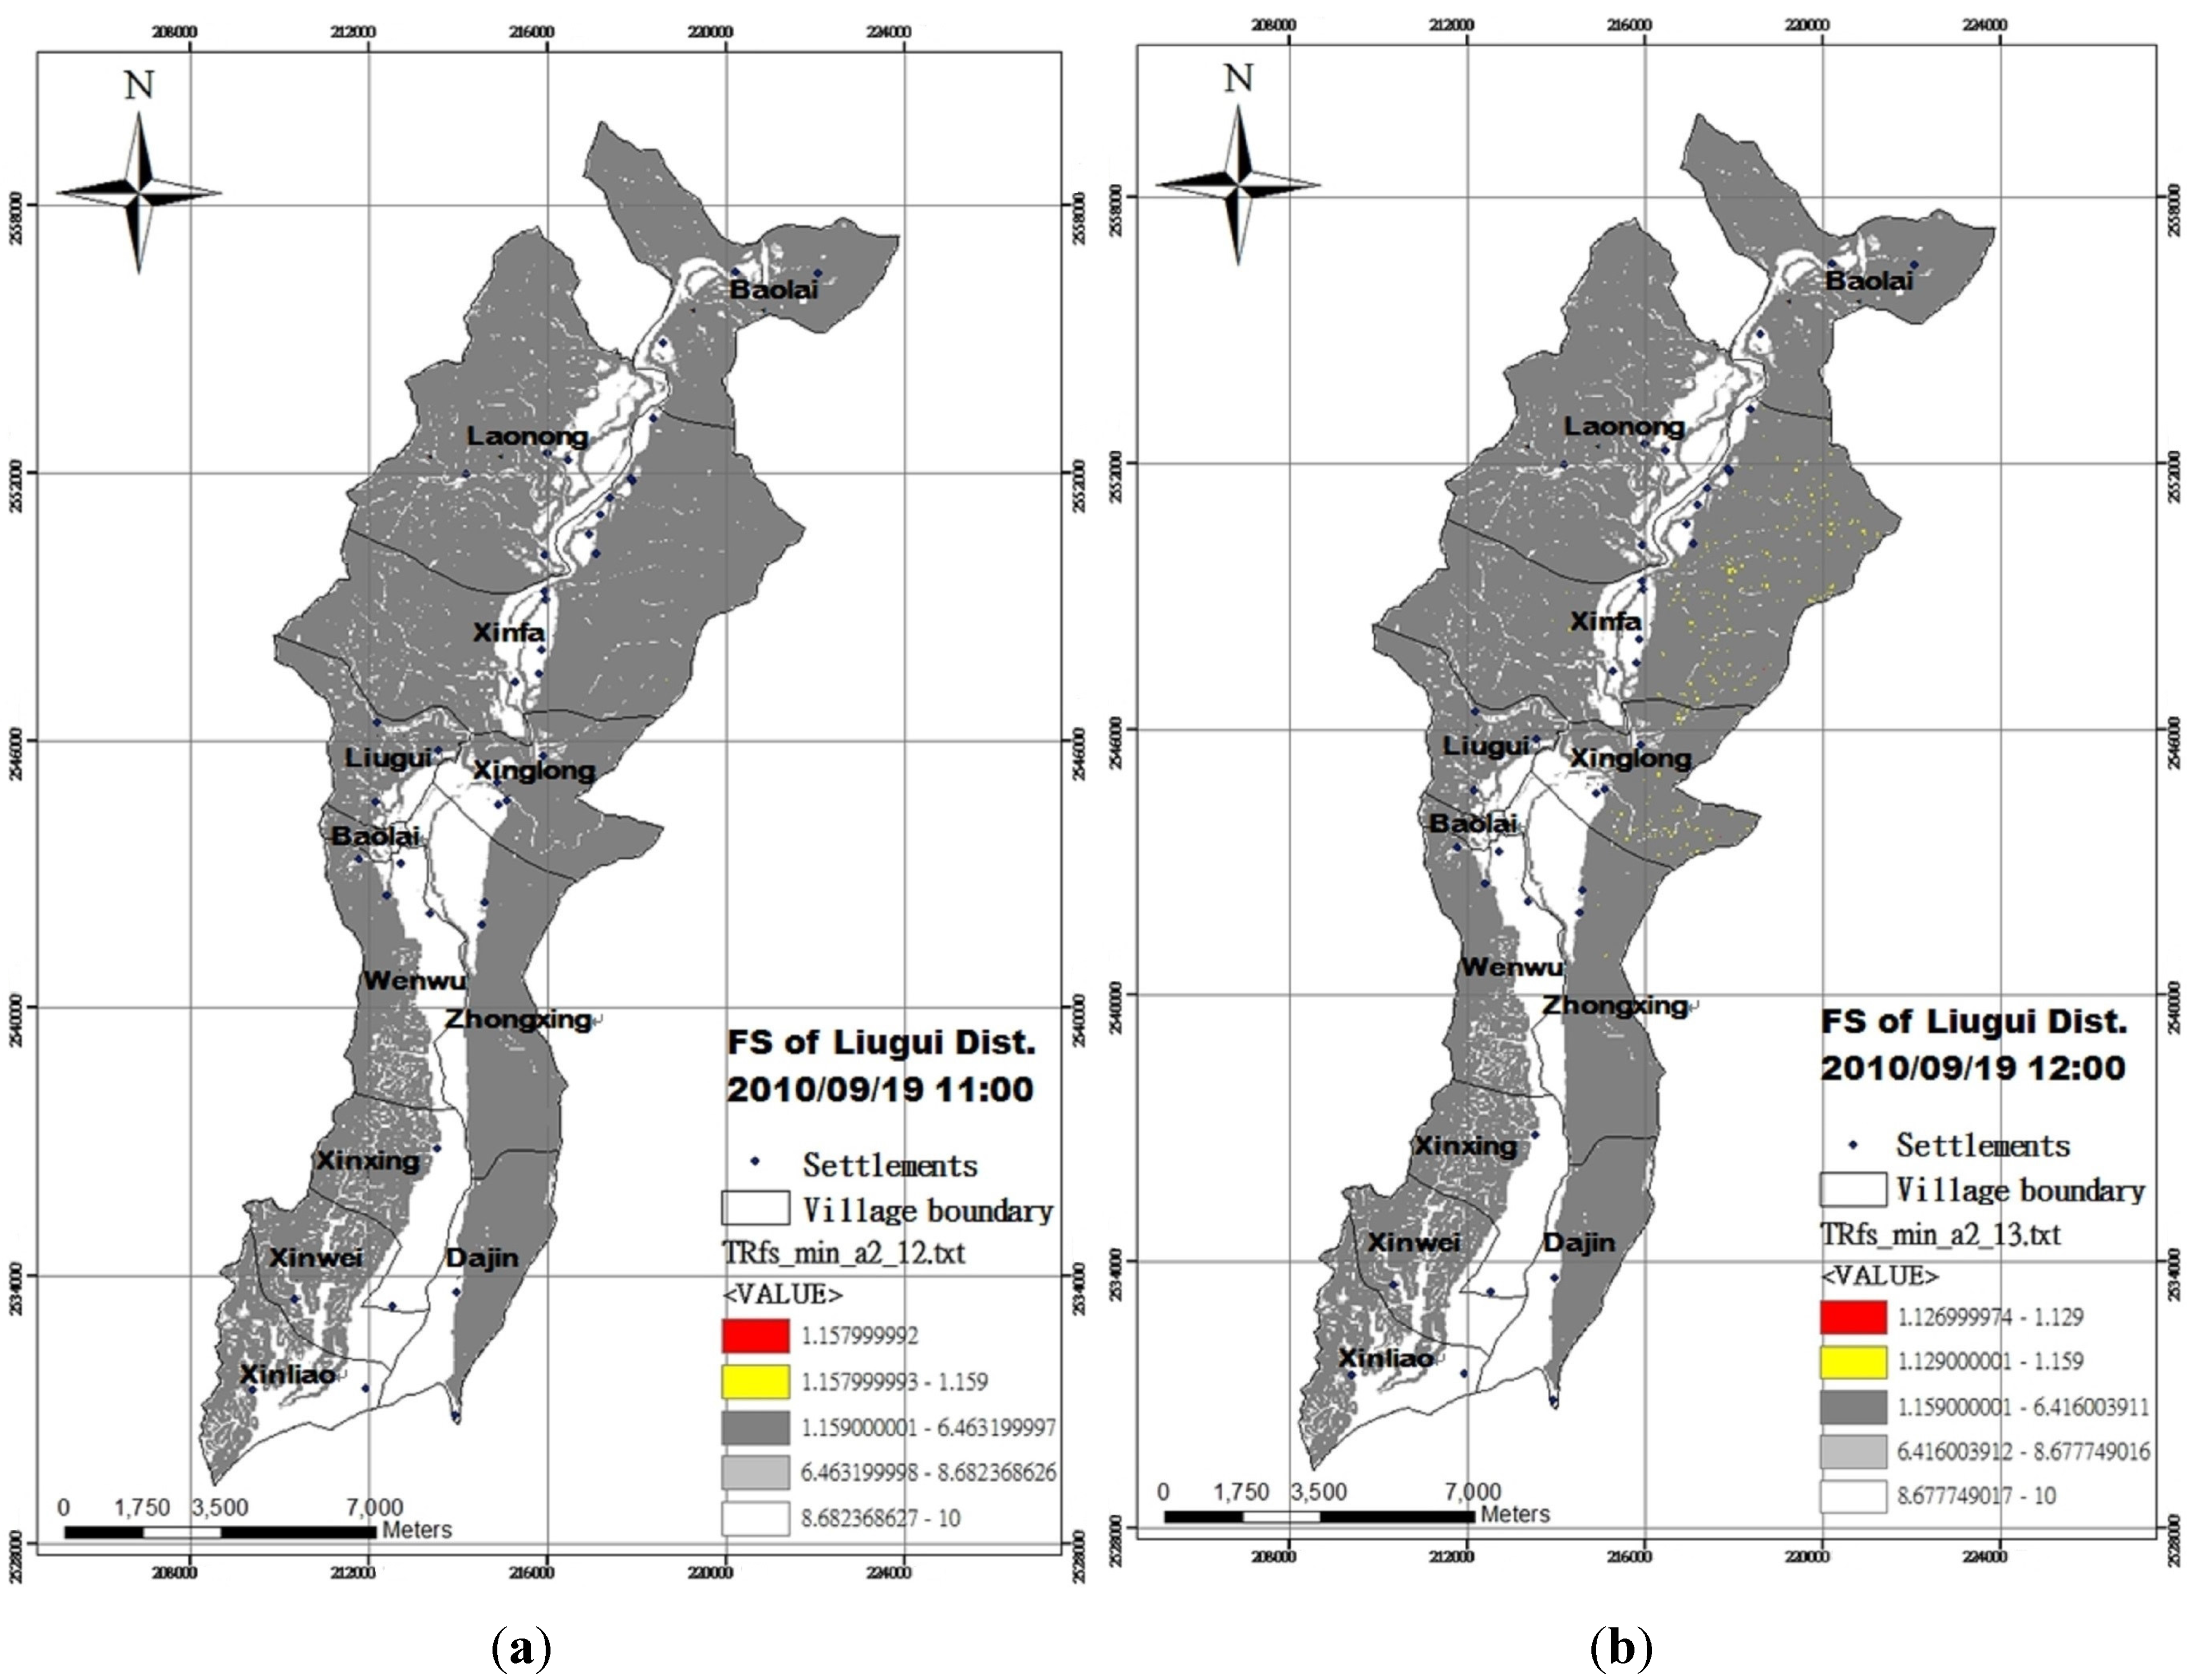
While assessing the applicability of the threshold values, the duration between the issuance of the yellow alert and the time of the actual landslide in Liugui District (19 September) was 11 h, from (11:00 to 21:00). Maps of the various villages and human settlements in the Liugui District were combined to obtain the FS distributions for later comparison and explanation.
Figure 10a through
Figure 10d illustrate the distributions at the critical times of 11:00, 12:00, 20:00, and 21:00, which serve as reference for the times, locations, and scale of evacuation.
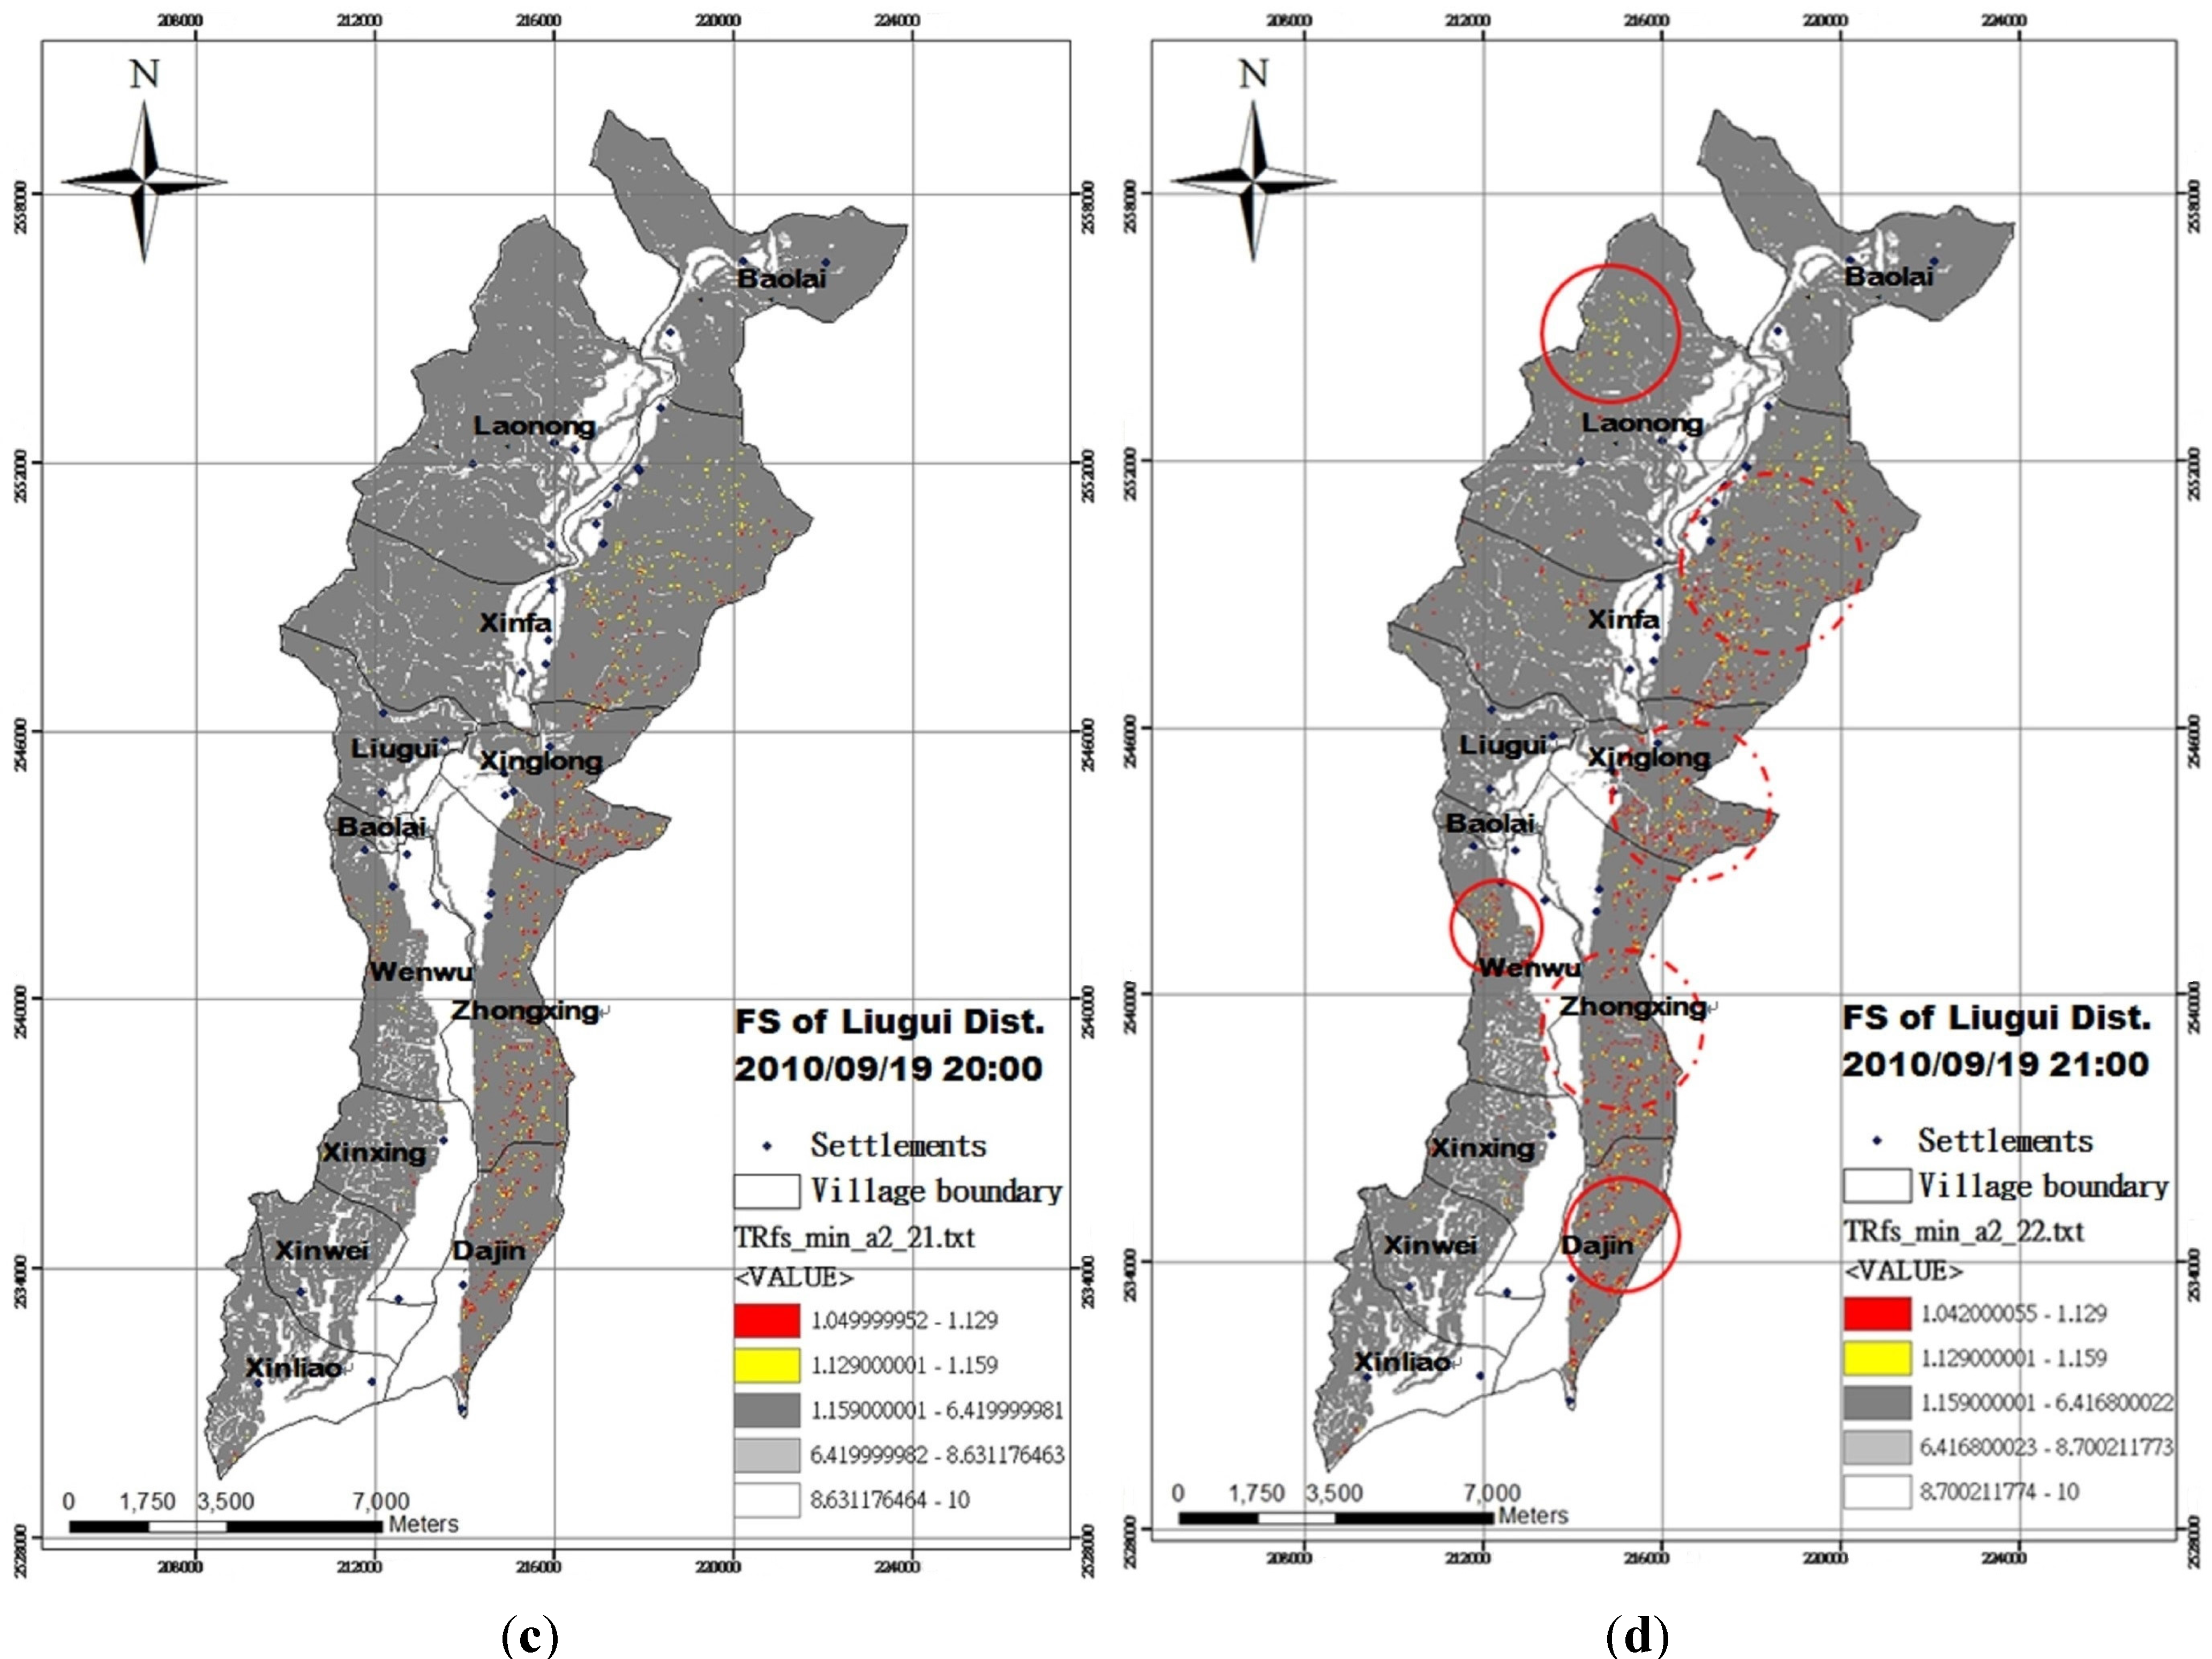
Unstable areas were identified in the evaluation scenario with Typhoon Fanapi. As shown in
Figure 10d, these include the northwestern side of Laonong Village, the eastern side of Xinfa Village, the eastern side of Xinglong Village, the western side of Wenwu Village, the eastern side of Zhongxing village, and the eastern side of Dajin Village, marked with red bold and dashed lines. By comparing the locations of these sites to the locations of human settlements, 17 communities that should be considered in disaster prevention were identified. Using the current rainfall thresholds based on statistical methods, warnings can only be issued to entire areas with towns or villages, due to the fact that the location of unstable sites cannot be determined precisely. Thus, when an alert is issued, it cannot be confirmed which areas are in need of immediate evacuation, thereby draining disaster prevention resources and imposing a heavier burden on the police and fire departments. The method proposed in this study, in which FS thresholds are established for landslide warnings, can significantly reduce the range of evacuation and increase precision in the use of resources and distribution of manpower. For example, Liugui District contains a total of 42 communities. The model used in this study revealed that evacuation would be necessary in only 17 of these, thereby saving resources that would otherwise have been wasted in evacuating the other 25 communities.
According to the SWCB [
67], five landslide incidents took place during Typhoon Fanapi in Liugui District: one in Laonong Village, one in Wenwu Village, and three in Dajin Village, all of which were among the unstable sites identified by the model presented in this study (marked in bold red lines in
Figure 10d). This demonstrates the considerable precision of the proposed method in determining unstable locations and communities requiring evacuation for disaster prevention during floods and typhoons.
Figure 10.
(a) Unstable sites in region of study; (b) Unstable sites in region of study; (c) Unstable sites in region of study; (d) Unstable sites in region of study (Time: 2010/09/19 21:00).
Figure 10.
(a) Unstable sites in region of study; (b) Unstable sites in region of study; (c) Unstable sites in region of study; (d) Unstable sites in region of study (Time: 2010/09/19 21:00).


