1. Introduction
The flocculation process, a series of aggregation and disaggregation (so called breakup) processes, is one of the most important characteristics of suspended cohesive sediment such as mud and organic matter. Through the flocculation process, the size and density of cohesive sediment continuously vary, resulting in variation of settling velocity and particle response time. Because the settling velocity and particle response time significantly affect the advection and diffusion process of suspended sediment, an improved understanding of the flocculation process is paramount for cohesive sediment transport. Therefore, the flocculation process has been intensively studied. The flocculation process is mainly due to eletro- or biological-chemical attraction of fine sediment (e.g., [
1]). When suspended particles collide with each other, there is a chance of aggregation by attraction. Collisions of suspended sediment are caused by Brownian motion, differential settling, and turbulent shear [
2,
3,
4]. It has been concluded in many studies that turbulent shear is the dominant mechanism of suspended sediment collisions (e.g., [
5,
6]). Moreover, turbulent shear is considered as the main mechanism of floc breakup (e.g., [
1,
7,
8]). Many laboratory studies on the effects of turbulent shear have been conducted utilizing a mixing tank and Couette viscometer in order to control the intensity of turbulent shear (e.g., [
9,
10,
11,
12]). From these studies, it is apparent that the flocculation process of aggregation (mainly due to particle collision) and breakup is significantly governed by turbulent shear.
With the aim of quantitatively modeling the flocculation process, many flocculation models have been proposed. Generally, flocculation models can be classified into two groups at present; a population balance equations model (PBE) and a floc growth model (FGM). A PBE, often called a size class flocculation model, is based on discrete size classes, and typically calculates the change of floc numbers in each size class (e.g., [
13,
14,
15]). A PBE has the advantages of considering many mechanisms of flocculation and calculating a size distribution of flocs. However, a PBE is too numerically expensive to be combined with numerical sediment transport models [
16] and demands many empirical parameters, increasing uncertainties. Moreover, a discrete PBE approach is limited in terms of ensuring the mass conservation of flocs in a closed system, although many schemes have been proposed to overcome this weakness (e.g., [
17,
18]). A FGM, often called a Lagrangian flocculation model, is a differential equation usually composed of two terms, an aggregation term and a breakup term, representing the increase in floc size due to aggregation and the decrease due to breakup, respectively. A FGM is simple enough to be combined with numerical sediment transport models. Furthermore, a FGM ensures the mass conservation of cohesive sediment in a closed system because it calculates the average size of flocs. Based on the collisional frequency equation of Levich [
19] and dimensional analysis, Winterwerp [
8] proposes a semi-empirical FGM under the assumption that the fractal dimension of flocs is constant. However, many studies show that the fractal dimension of natural flocs is variable (e.g., [
20,
21]). Based on Levich [
19] and Khelifa and Hill [
20], Son and Hsu [
7] improved Winterwerp’s FGM [
8] by adopting an empirical equation with a variable fractal dimension. However, neither Son and Hsu [
7] nor Winterwerp [
8] appropriately address the temporal evolution of floc size, although both calculate the equilibrium floc size under constant turbulence intensity conditions. Son and Hsu [
1] further theoretically and mathematically derive an equation for the yield strength of flocs, which depends on the floc size and fractal dimension. The equation is similar to an empirical equation from Sonntag and Russel [
22] when one empirical parameter,
r, is set to be about 0.7 (see [
1] for more details). By incorporating this equation with a FGM from Son and Hsu [
7], Son and Hsu [
1] propose a new FGM using a variable fractal dimension and yield strength. The model from Son and Hsu [
1] has been validated with laboratory experiments by Spice
et al. [
23] and Burban
et al. [
24]. From the simulation results, it is clearly established that a new FGM from Son and Hsu [
1] has the capability to replicate the temporal evolution of floc size as well as the equilibrium floc size. In addition, from comparison with results calculated by models developed by Son and Hsu [
7] and Winterwerp [
8], it is also concluded that both the variable fractal dimension and the variable yield strength of flocs are critical to modeling the flocculation process. Son and Hsu [
25] develop a sediment transport model for cohesive sediment and incorporate it into FGMs from Winterwerp [
8], Son and Hsu [
7], and Son and Hsu [
1]. Through validation of models with field data measured in the Ems/Dollard estuary [
26], it is shown that a sediment transport model combined with Son and Hsu’s model [
1] calculates the characteristics observed in the Ems/Dollard estuary. Son and Hsu’s model [
1] is used in Son and Lee [
27] again in order to understand the role of flocculation under oscillatory flow representing short waves. It is found in Son and Lee [
27] that the flux of sediment under fixed short wave conditions has opposite directions depending on the flocculation process. To the best knowledge of the authors, the model from Son and Hsu [
1] is one of few flocculation models with results that are in good agreement with field data when combined with a high-resolution sediment transport model which quantitatively calculates interactions between turbulence and floc dynamics.
As mentioned above, a FGM is numerically efficient and ensures mass conservation. However, compared to PBE, a FGM is disadvantaged in the sense that it does not have the capability to calculate size distribution of flocs. This is because a FGM calculates the average size of flocs using a deterministic equation. In order to simulate sediment transport, Man and Tsai [
28] propose the stochastic advection-diffusion equation based on the Langevin equation, solving the equation using numerical schemes for stochastic partial differential equations [
29,
30,
31]. In simulation results, a stochastic model showed the capability to calculate the range and variation of sediment suspension [
28]. Maggi [
32] proposes a FGM incorporated with stochastic approach based on Winterwerp’s FGM [
8]. As mentioned in the previous paragraph, Winterwerp’s FGM [
8] assumes that the fractal dimension is constant. To overcome this weak point, Maggi [
32] adopts the concept of a variable fractal dimension. However, when the key equation for the temporal change rate of primary particles within a floc is derived, the fractal dimension is assumed to be constant again (see Equations (3) and (4) in [
32]). In addition, the FGM of Maggi [
33] also assumes the yield strength of flocs to be constant, whereas Son and Hsu [
1] showed that the temporal evolution of floc size is reasonably replicated when a variable yield strength of flocs is assumed.
This study aims to improve the existing FGM developed by Son and Hsu [
1] to predict both temporal evolution of average size and size distribution of flocs by adopting a stochastic approach to flocculation modeling. A brief description of Son and Hsu’s FGM [
1] is given in
Section 2.1. Based on this FGM, a new stochastic FGM is proposed in
Section 2.2. The developed model is validated with data obtained from laboratory experiments in
Section 3. Finally, the conclusions of this study are drawn in
Section 4.
3. Results and Discussion
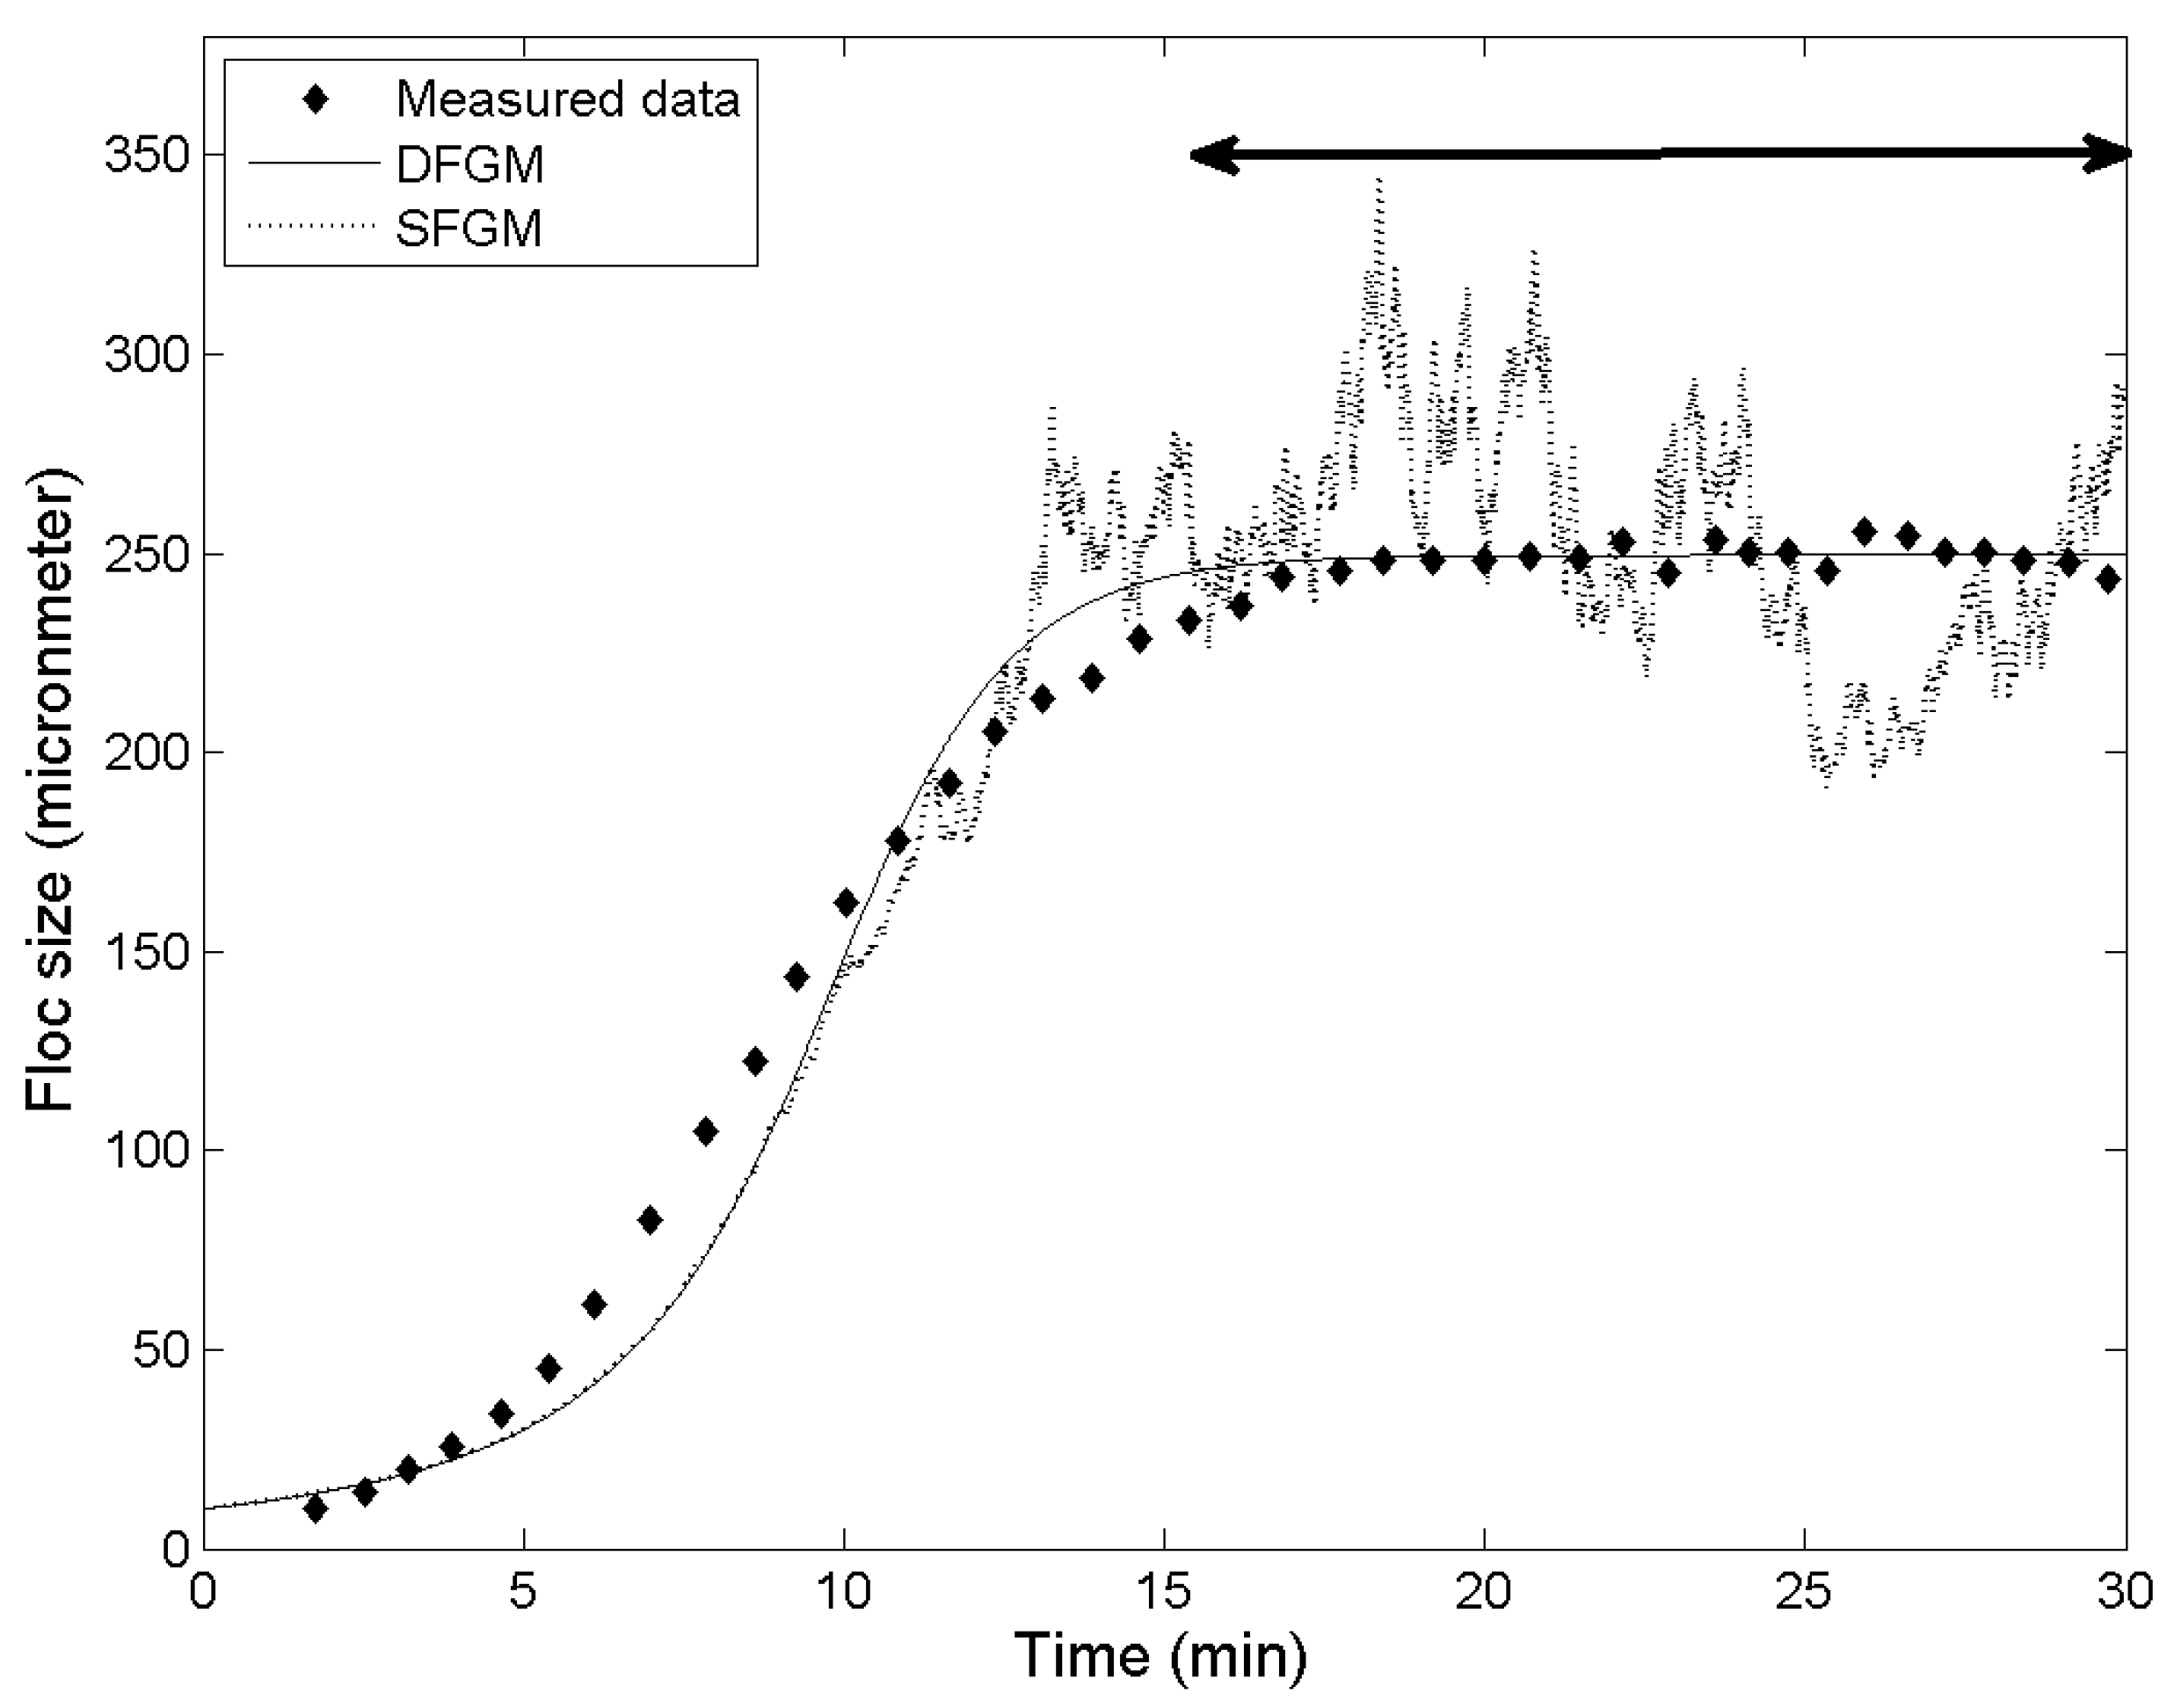
During each case of the experiment, 30 numerical simulations were conducted. This study focuses on the distribution of floc size in the equilibrium state. Therefore, the values of floc size at the last 1000 time steps (2061 total) are analyzed under the assumption that the flocculation process approaches a dynamic equilibrium state prior to 1061 time steps (see
Figure 1). The stochastic FGM of this study is validated with 3 laboratory experiments by [
9,
23,
24]. Following Spicer
et al. [
23], polystyrene particles were mixed in a stirred tank with an impeller in order to measure the size distribution of aggregates with volumetric and mass concentrations (
and
c) of
and 0.0147 kg/m
3, respectively. The average value of
G produced by the impeller is 50 s
−1. The size and density of polystyrene particles (
c and
) of the experiment are 0.87 μm and 1050 kg/m
3, respectively. In Biggs and Lant [
9], the size distribution of activated sludge is reported under the experimental condition of
G = 19.4 s
−1 and
= 0.05. Under the assumption that
is 2650 kg/m
3 and the density of sludge is 1300 kg/m
3, the mass concentration is calculated to be 24.19 kg/m
3. The activated sludge is mixed in a baffled batch vessel using a flat six-blade impeller. Burban
et al. [
24] also report the results of laboratory experiments with Detroit River sediment.
c and
G of the experiment are 0.8 kg/m
3 and 200 s
−1, respectively.
d and
of Detroit River sediment are assumed to be 4 μm and 2650 kg/m
3 due to absence of further information. The detailed conditions of experiments are summarized in
Table 1. The calibrated values of empirical coefficients are shown in
Table 2.
Figure 1.
Example of numerical simulation and analysis data. Dots represent the experimental result of Spicer
et al. [
23]. Solid and dotted lines are the stochastic FGM (SFGM) of this study and the deterministic FGM (DFGM), respectively.
Figure 1.
Example of numerical simulation and analysis data. Dots represent the experimental result of Spicer
et al. [
23]. Solid and dotted lines are the stochastic FGM (SFGM) of this study and the deterministic FGM (DFGM), respectively.
Table 1.
Experimental conditions.
Table 1.
Experimental conditions.
| Experiment | | c (kg/m3) |
(kg/m3) | d (μm) | G (s−1) |
|---|
| Spicer et al., (1998) | | 0.0147 | 1050 | 0.87 | 50.0 |
| Biggs and Lant (2000) | 0.05 | 24.19 (Assumed) | 2650 (Assumed) | 4.00 (Assumed) | 19.4 |
| Burban et al., (1989) | N.A. | 0.05 | 2650 (Assumed) | 4.00 (Assumed) | 200.0 |
Table 2.
Calibrated coefficients of stochastic FGM.
Table 2.
Calibrated coefficients of stochastic FGM.
| Experiment | | | | B1 |
|---|
| Spicer et al., (1998) | 6.74 | | | |
| Biggs and Lant (2000) | 0.02 | | | |
| Burban et al., (1989) | 0.30 | | | |
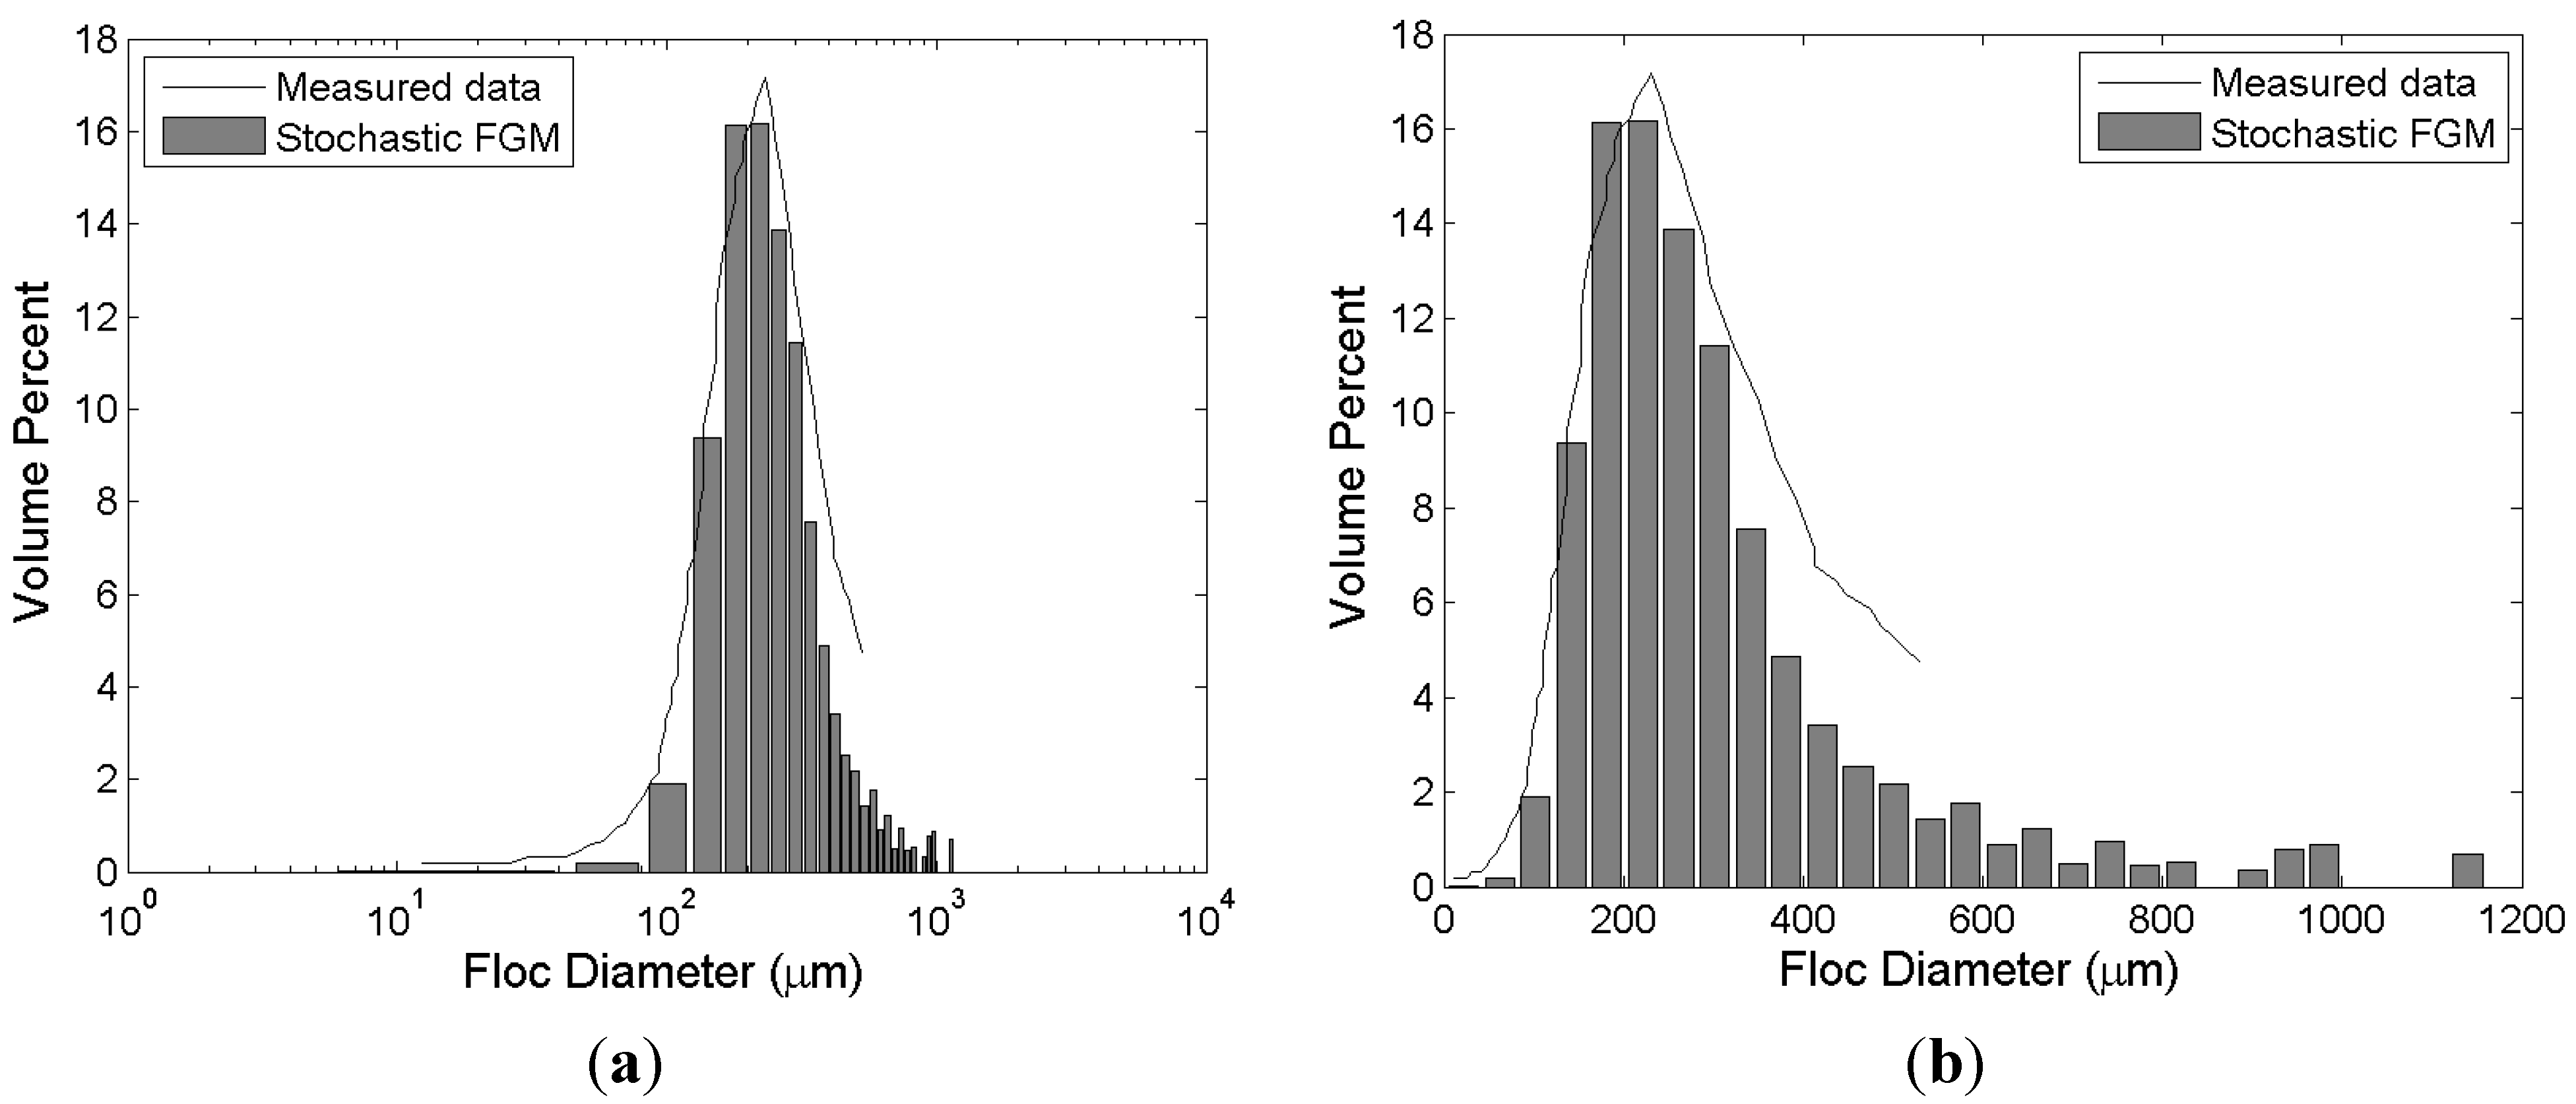
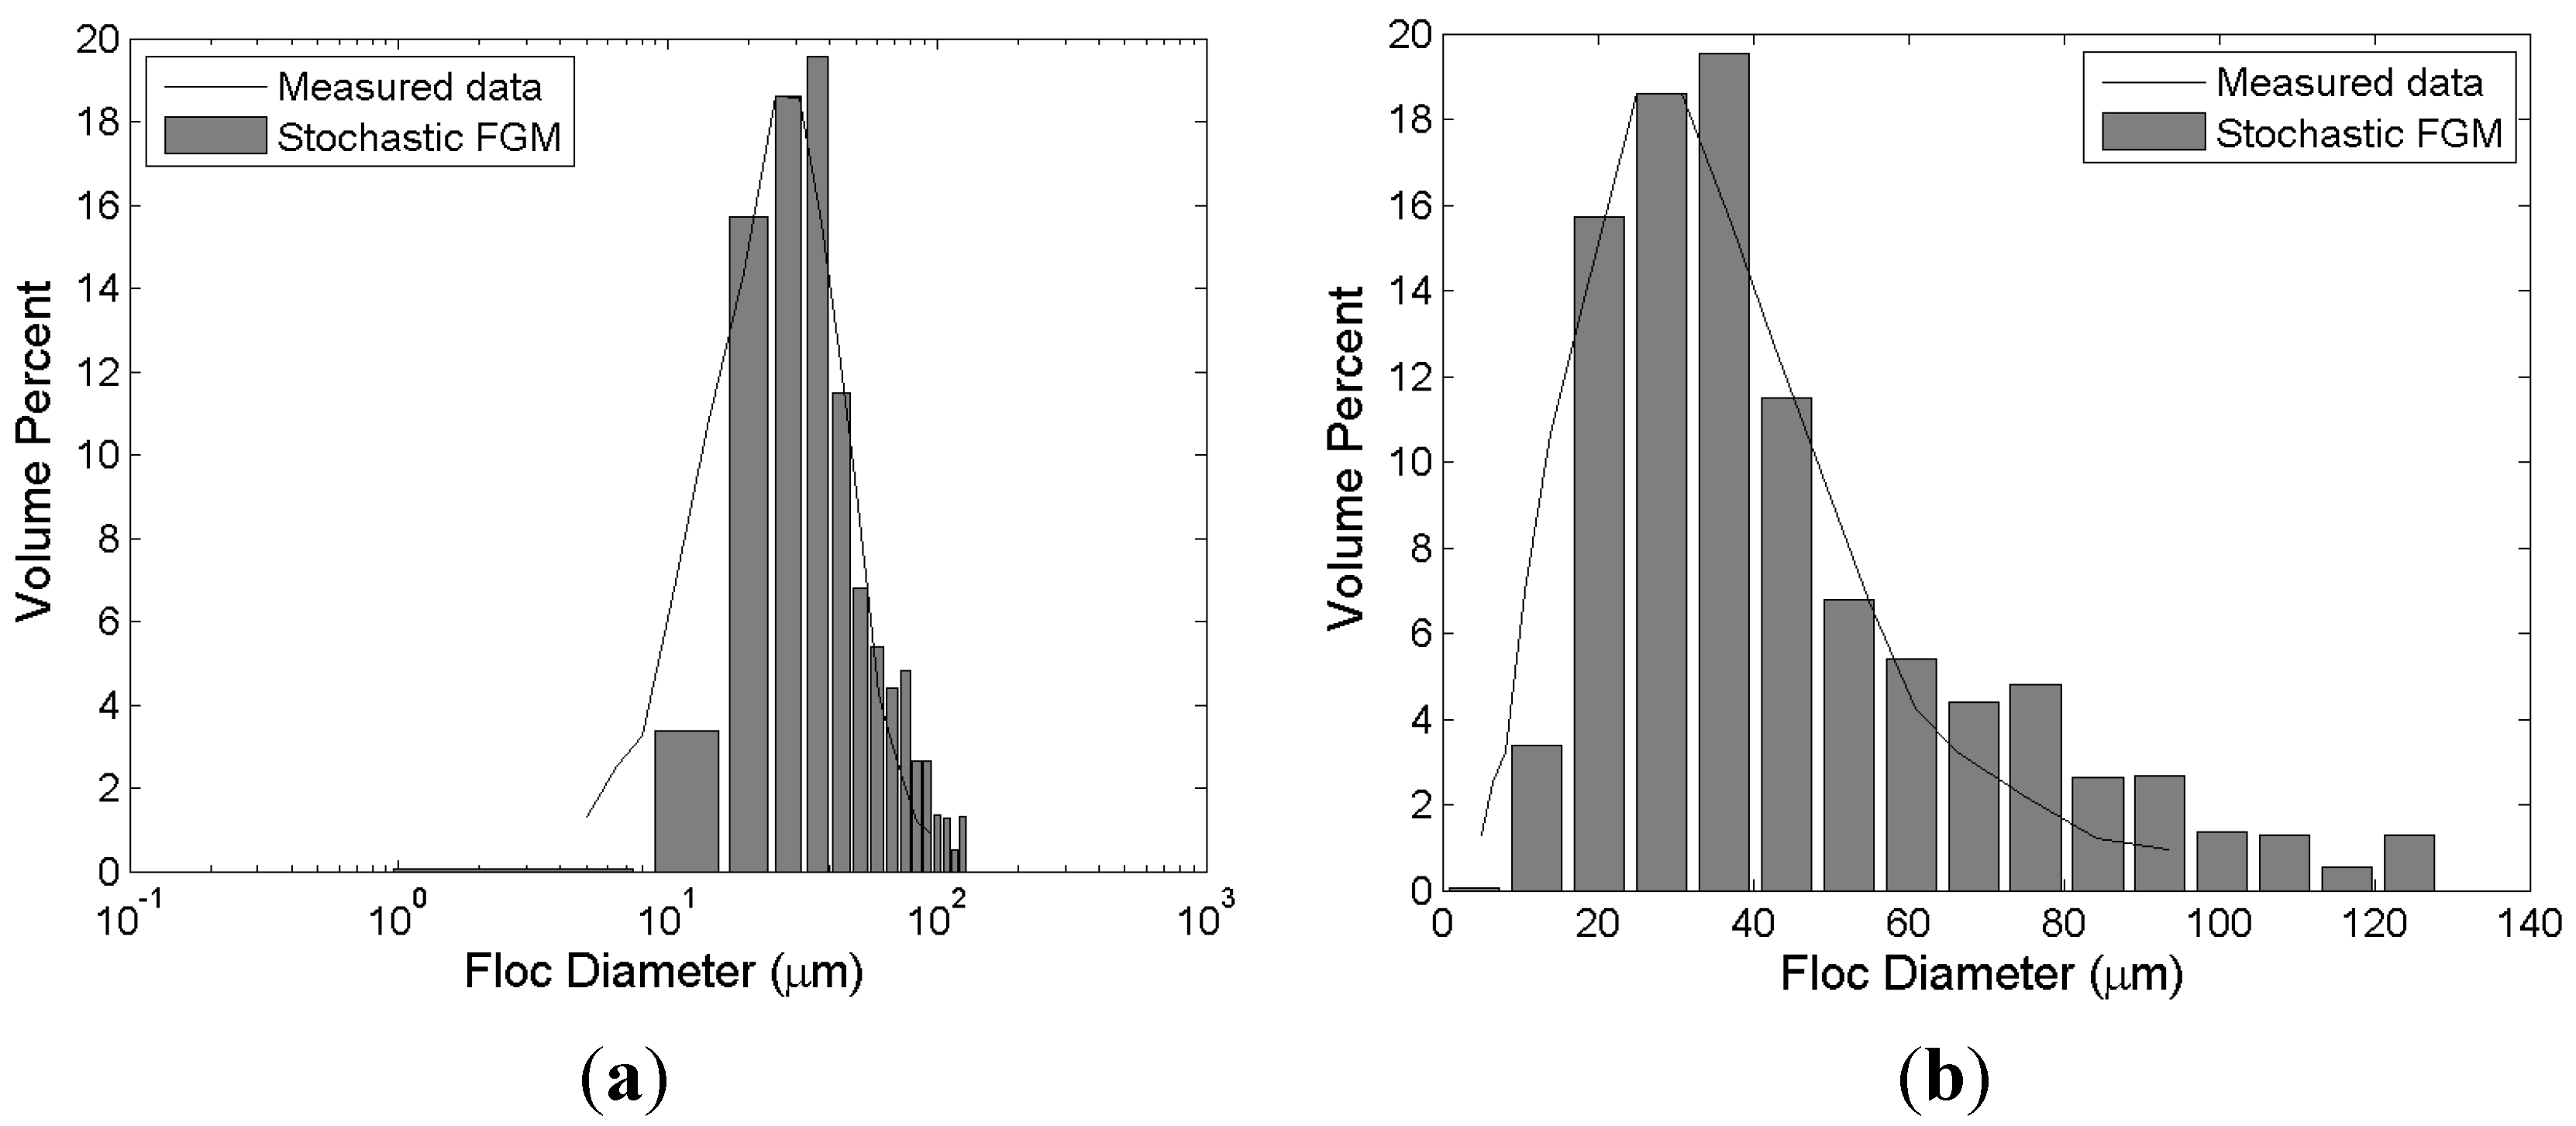
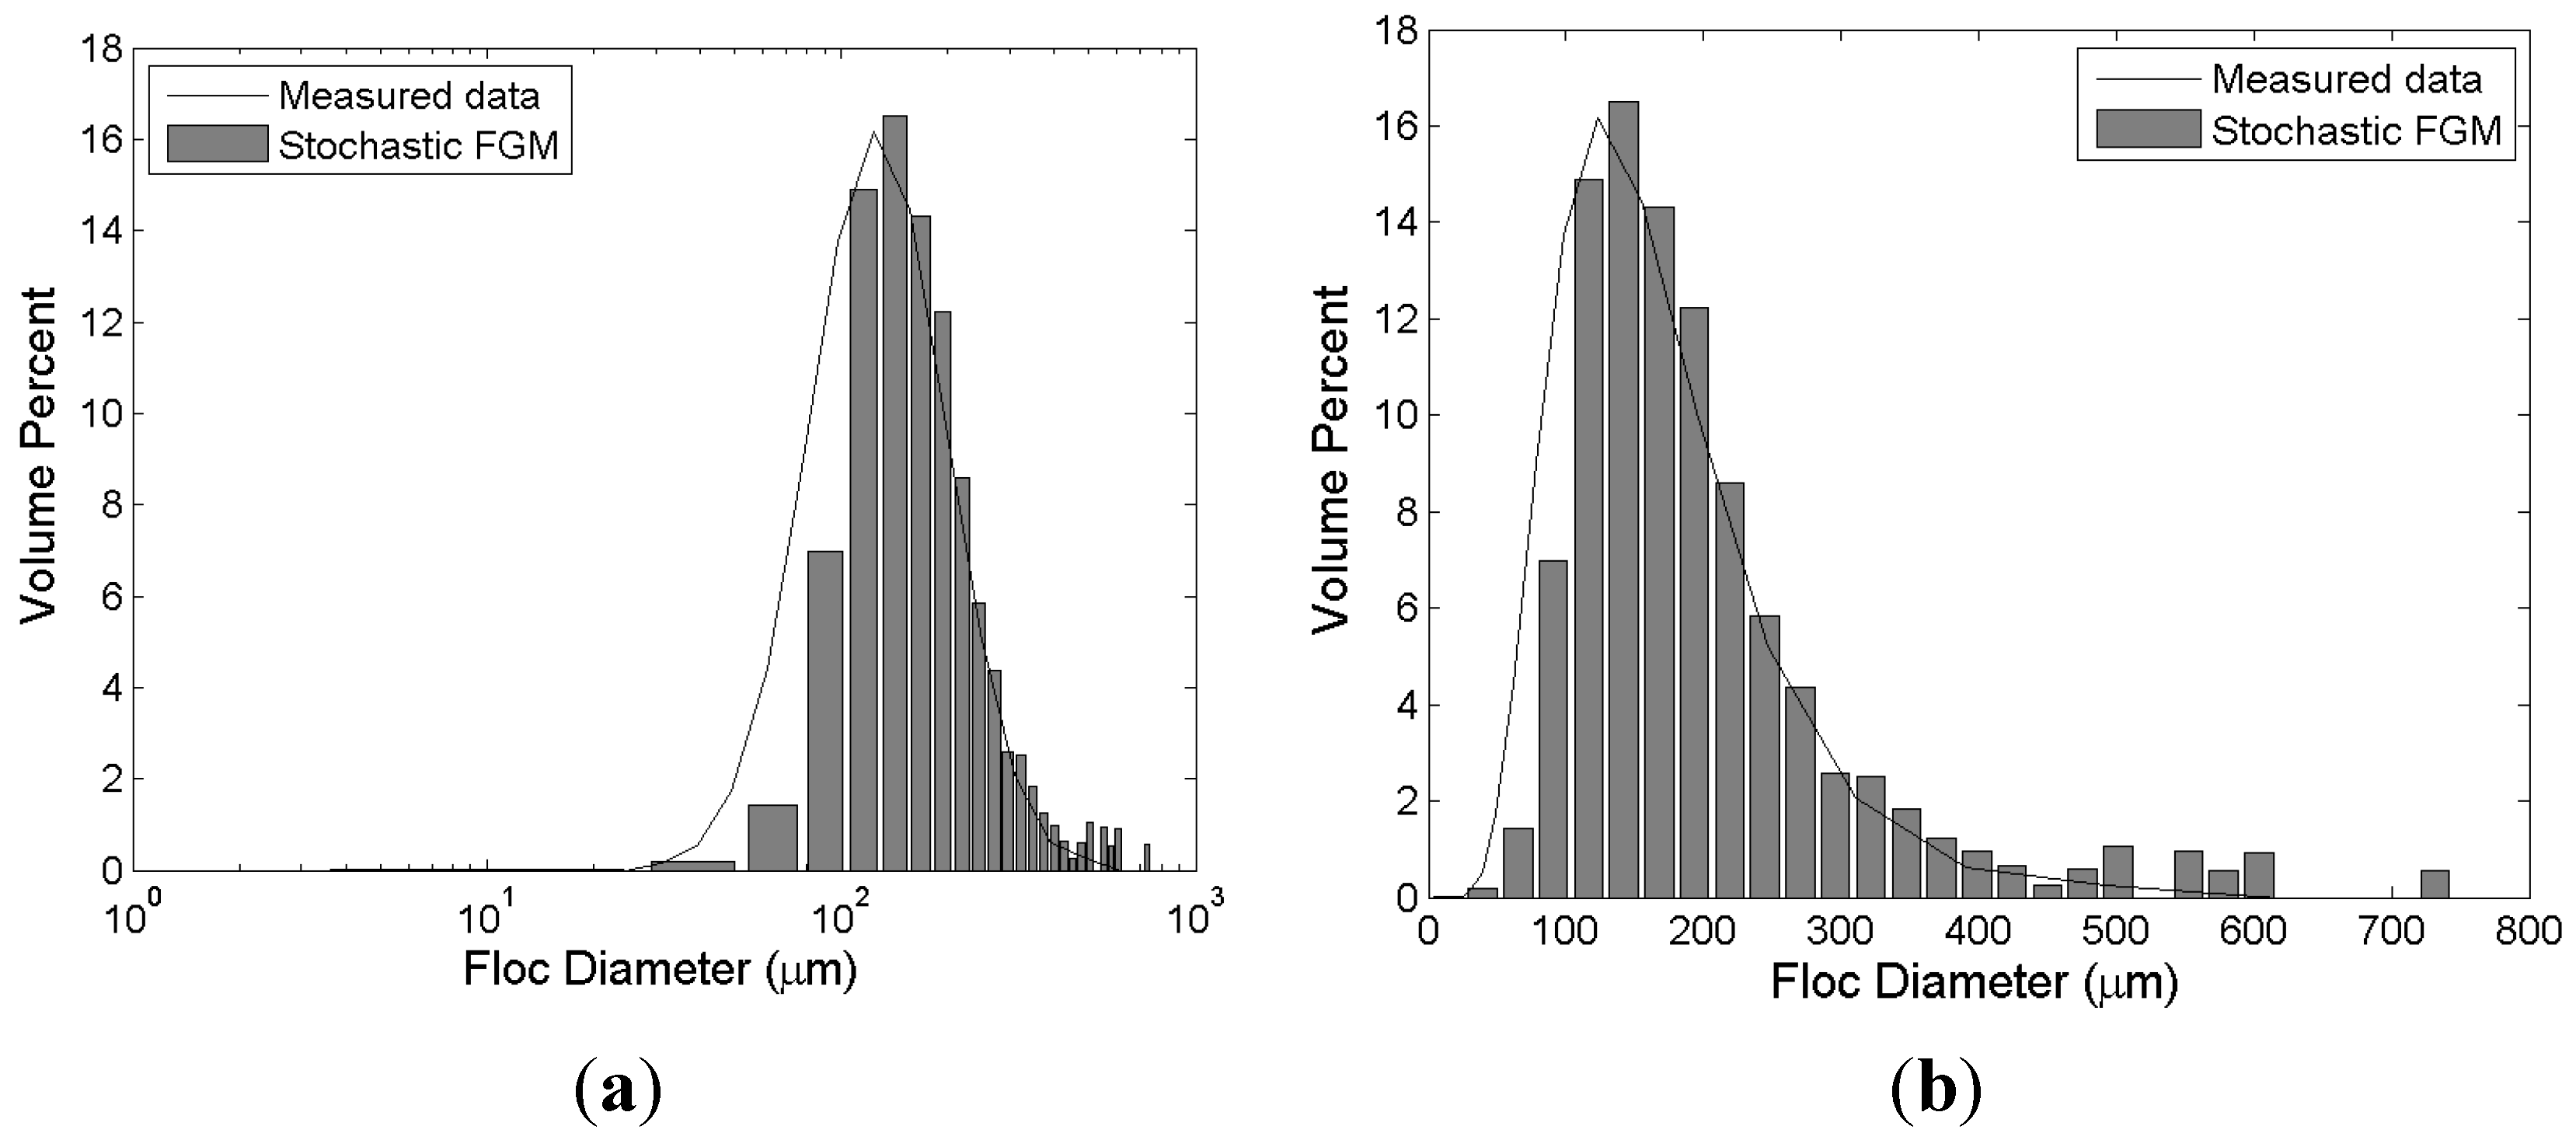
Figure 2 shows the simulation results of the stochastic FGM. The experiment from Spicer
et al. [
23] was carried out under the dilute condition (
c = 0.0147 kg/m
3). The intensity of turbulent shear is not low (
G = 50 s
−1). However, the mean size of flocs is about 200 μm. Therefore, it is clear that the polystyrene particles are easily aggregated. Under this assumption, the coefficient determining the aggregation efficiency has a relatively high value (
). In terms of the mean size of flocs, the simulation results are in satisfactory agreement with experimental results. The mean size is determined by calibrating
and
. That is, the model has the capability to calculate mean size of flocs reasonably well. It is shown in
Figure 2 that the calculated size distribution is positively skewed slightly more than the measured result. The log-normal distribution function has only 2 parameters, the mean and variance. Therefore, the skewness and kurtosis of log-normal distribution is indirectly determined by the values of mean and variance. Three- or four-parameter distribution functions such as generalized extreme value distribution and Wakeby distribution have the capability to determine the skewness or kurtosis by calibrating additional parameters. However, more empirical and site-specific parameters need to be calibrated when a 3- or 4-parameter distribution function is incorporated into FGM.
Figure 2.
Simulation results of stochastic FGM and experimental results of Spicer
et al. [
23]. The bars and the solid lines represent the experimental and simulation results, respectively. (
a) semi-log axis; (
b) normal (Cartesian) axis.
Figure 2.
Simulation results of stochastic FGM and experimental results of Spicer
et al. [
23]. The bars and the solid lines represent the experimental and simulation results, respectively. (
a) semi-log axis; (
b) normal (Cartesian) axis.
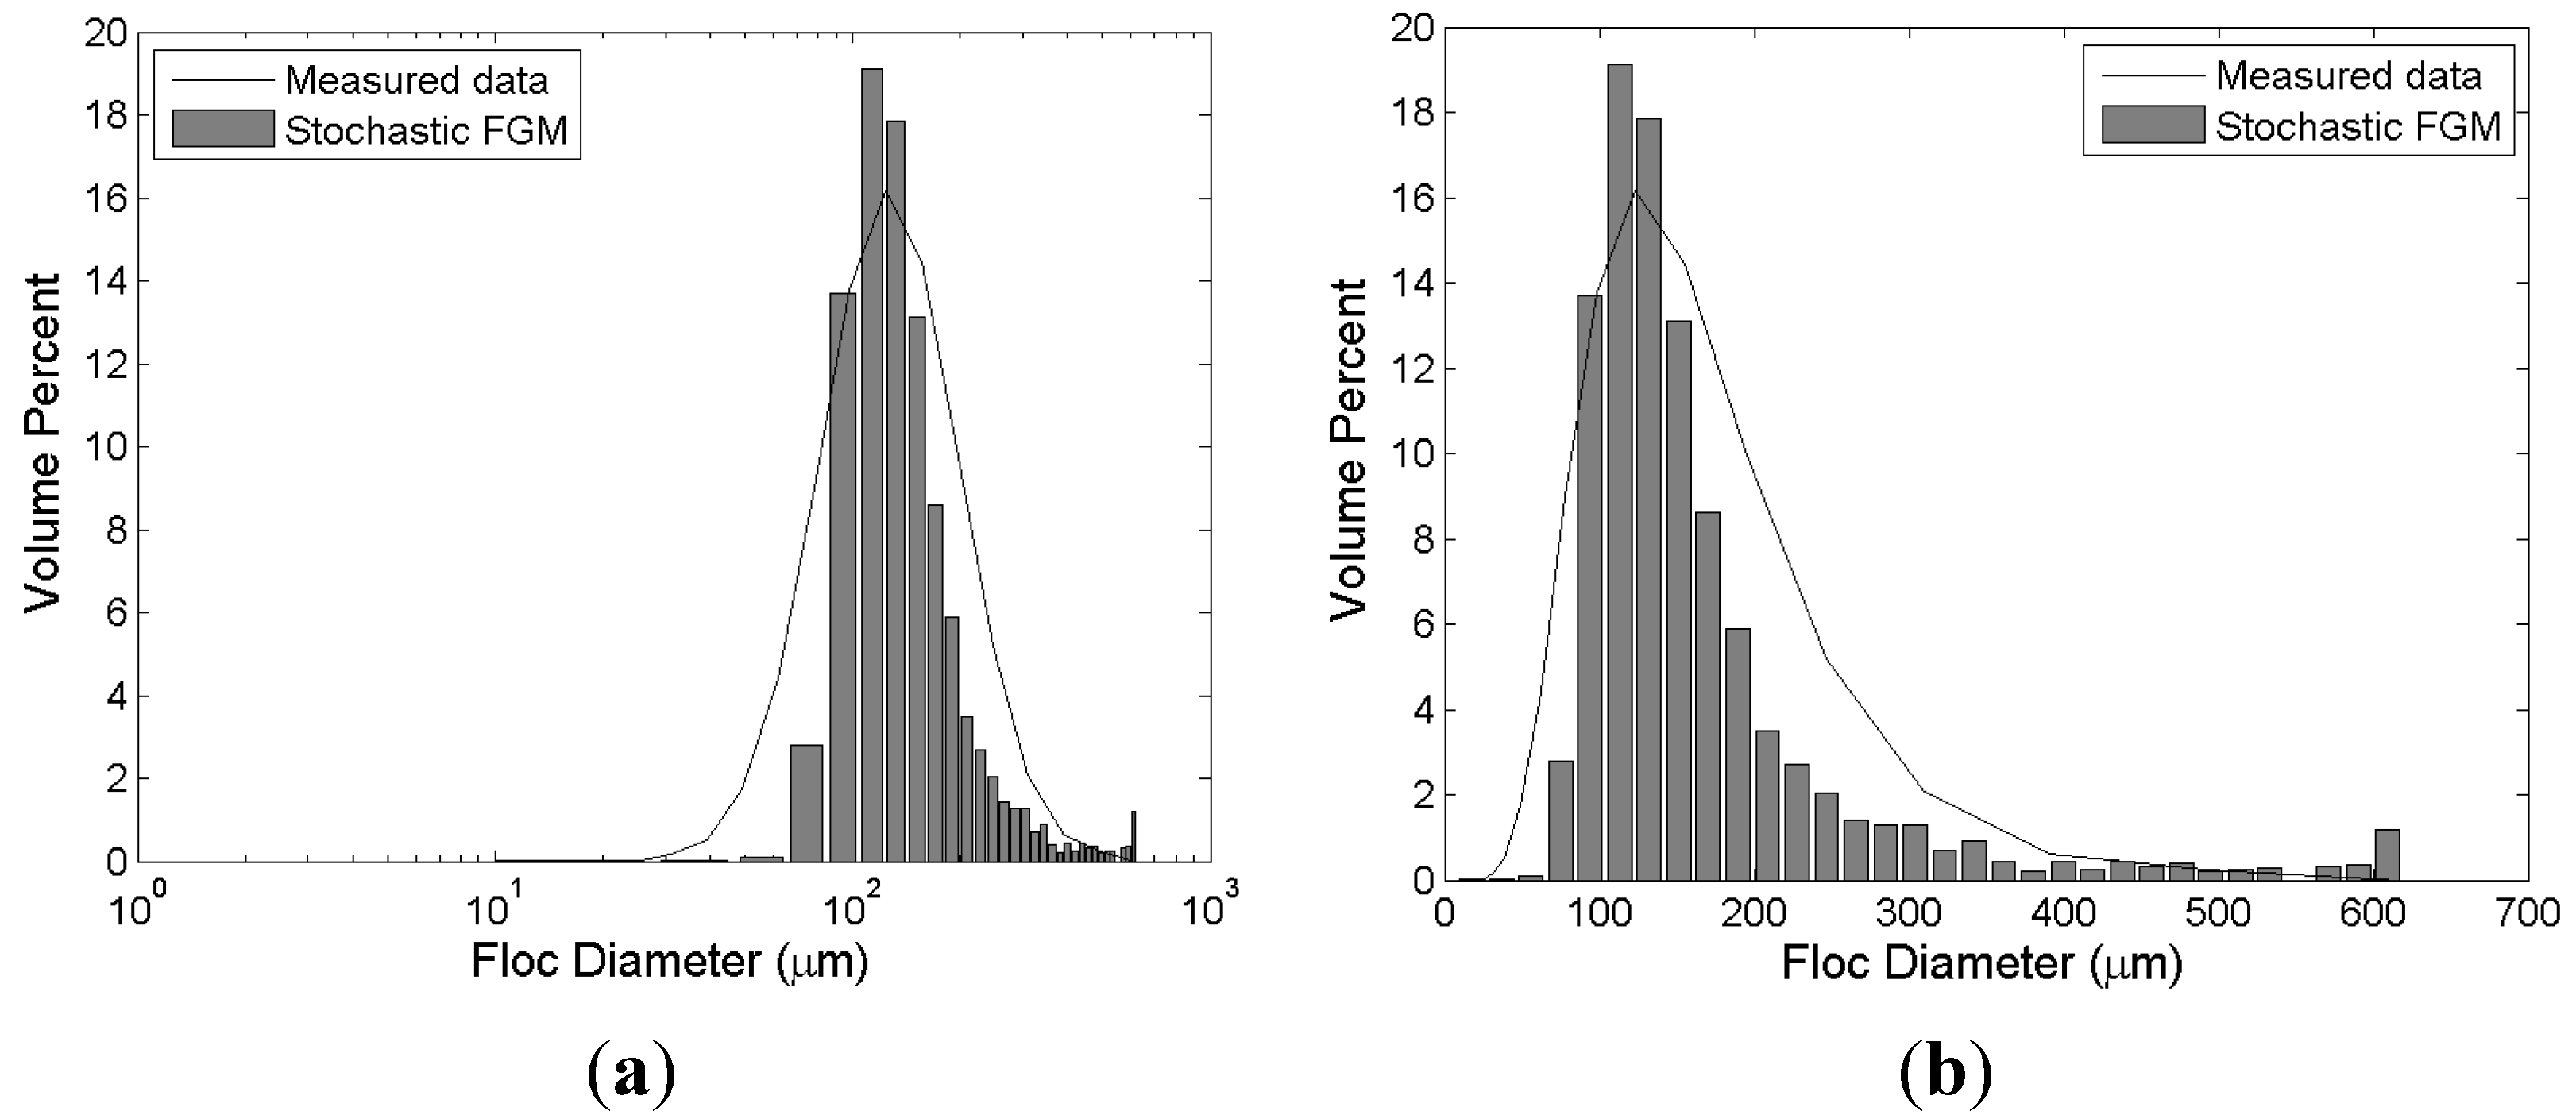
Figure 3 represents the results of stochastic simulation and measured data from Biggs and Lant [
9]. Their experiment was conducted under conditions with very high concentration (
c = 24.19 kg/m
3). The intensity of turbulence is relatively low (
G = 19.4 s
−1). Under these conditions, the mean size of flocs is not large (about 120 μm). Therefore, it is deduced that the aggregation process of activated sludge used for the experiment has a low efficiency resulting in a low value for the aggregation efficiency parameter (
). The simulation result is in a good agreement with laboratory measurements. Both the mean size and the distribution are reasonably replicated by the proposed stochastic FGM. The sudden increase of volume fraction around floc size 700 μm is due to the random property of stochastic simulation.
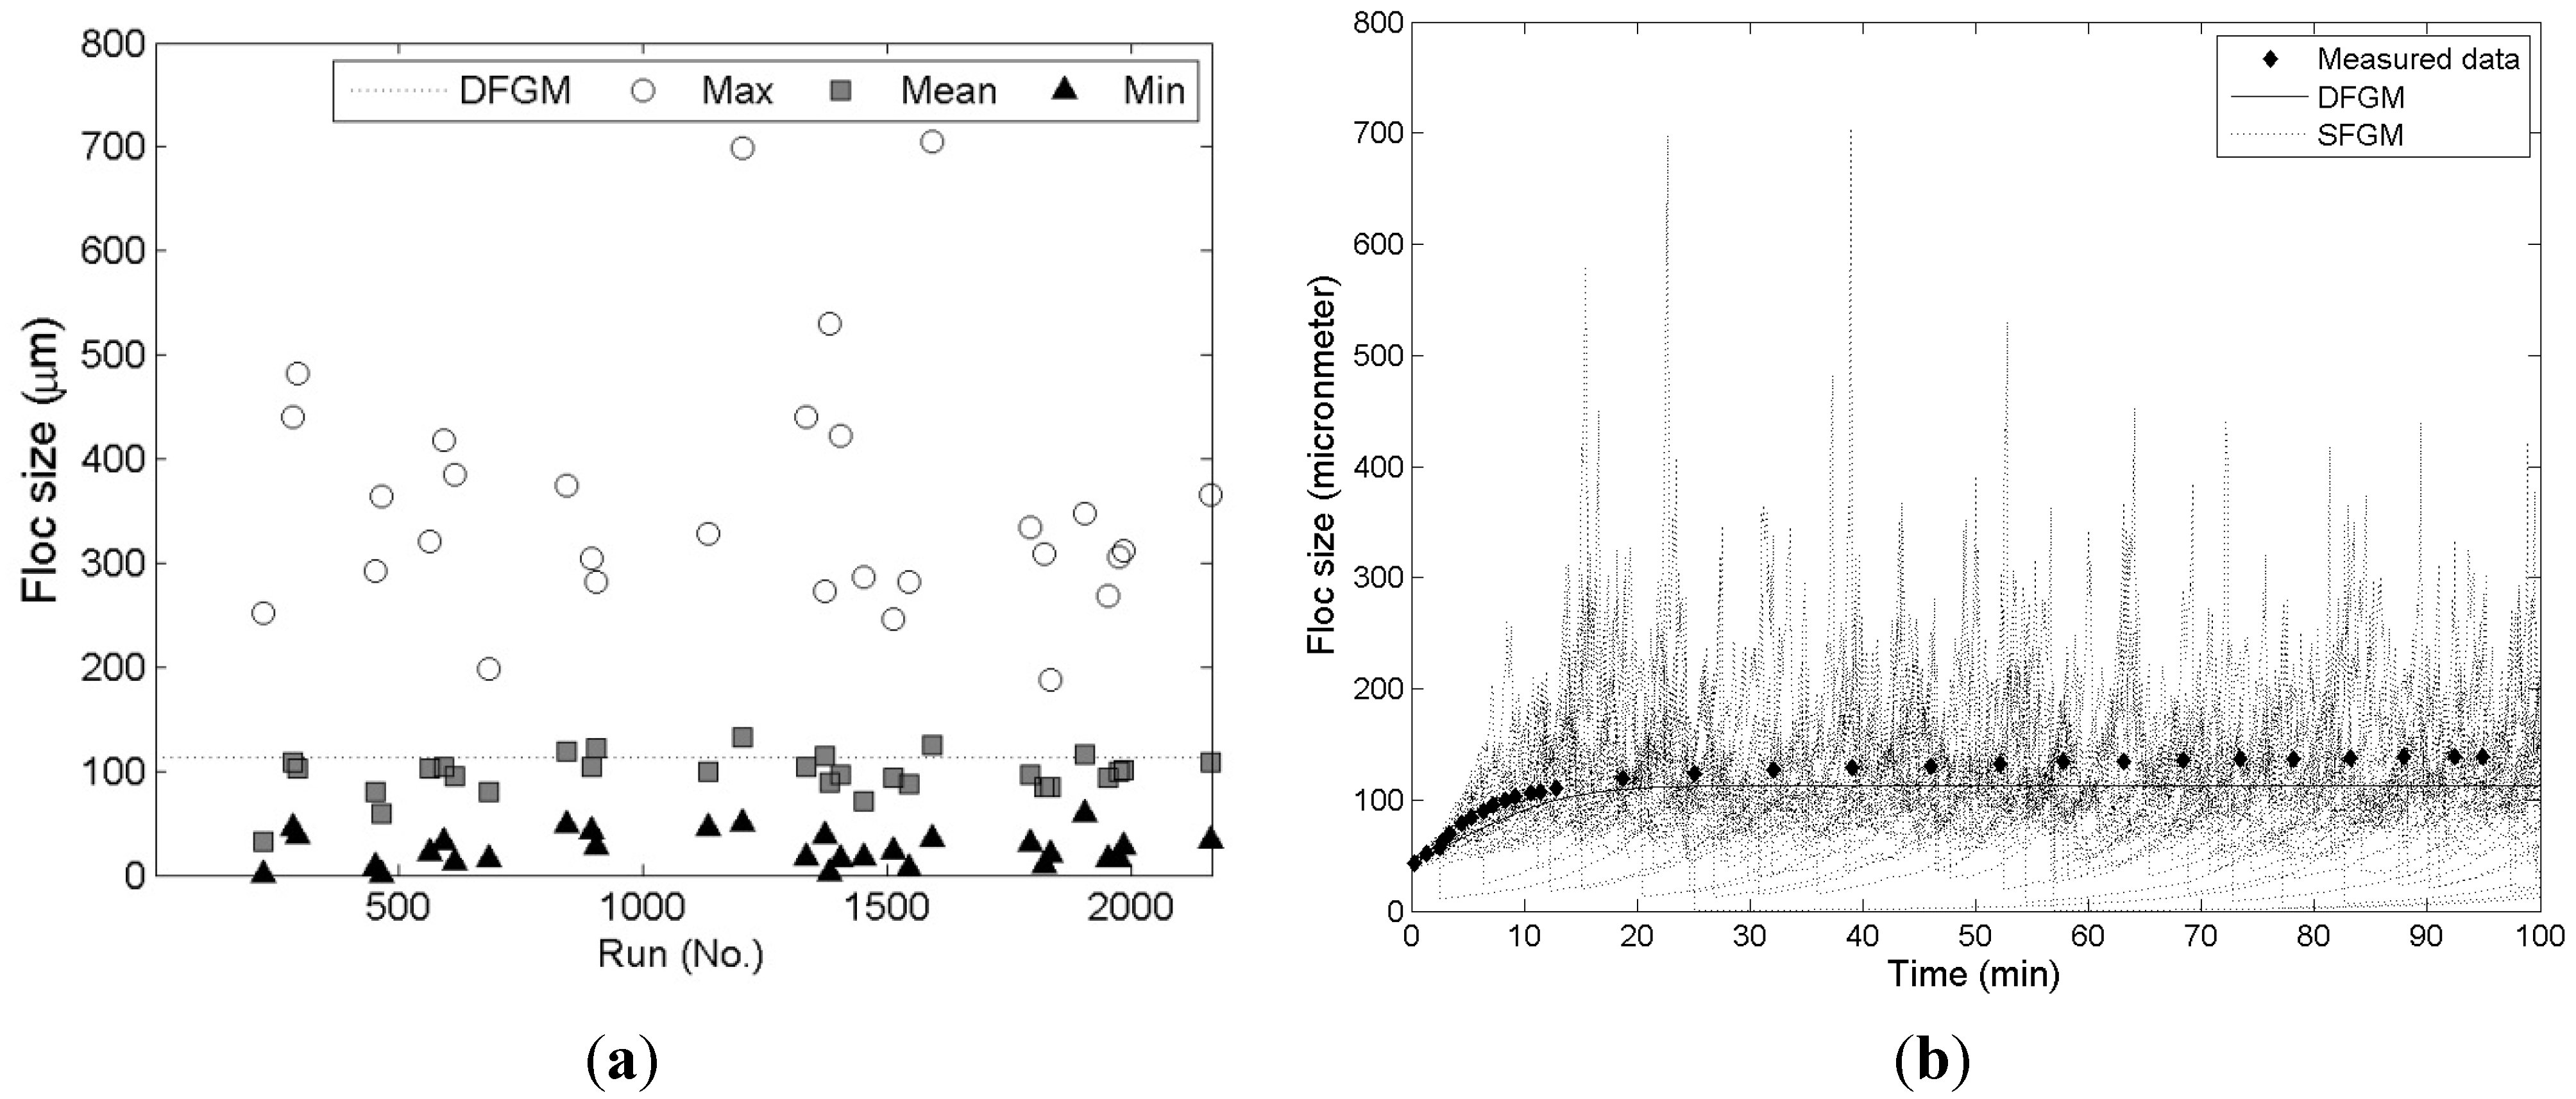
Figure 4a shows the mean, maximum, and minimum floc sizes of 30 simulation cases. The dotted line is the equilibrium floc size calculated by the deterministic Son and Hsu FGM [
1].
Figure 4b shows the temporal evolution of mean floc size measured by Biggs and Lant [
9], a simulation result of deterministic FGM ([
1]), and one case of simulation by stochastic FGM. As mentioned in the first paragraph of this section, the last 1000 values of floc size for each stochastic simulation are analyzed in this study. Therefore, the size distribution of this study is determined using 30,000 values for floc size.
Figure 4 shows that a stochastic FGM calculates the floc size very randomly after the temporal evolution of floc size approaches the equilibrium state (around 15 min in
Figure 4b). The maximum floc size among the values in the last 1000 time steps has a wide range (200 μm to 700 μm). Furthermore, the minimum floc size is also in the range of 10 μm to 50 μm whereas the mean values are between 70 and 120 μm in most cases.
Figure 3.
Simulation results of stochastic FGM and experimental results of Biggs and Lant [
9]. The bars and the solid lines represent the experimental and simulation results, respectively. (
a) semi-log axis; (
b) normal (Cartesian) axis.
Figure 3.
Simulation results of stochastic FGM and experimental results of Biggs and Lant [
9]. The bars and the solid lines represent the experimental and simulation results, respectively. (
a) semi-log axis; (
b) normal (Cartesian) axis.
Burban
et al. [
24] measured the size distribution of Detroit River sediments with a high dissipation parameter (
G = 200 s
−1) and a moderate mass concentration condition (
c = 0.8 kg/m
3). Due to the high turbulence intensity, a high breakup efficiency is expected. Thus, the mean of
is calibrated to be relatively high (μ
l = 3.95 × 10
−5) compared to the two previous cases ([
9,
23]). Turbulent shear plays two conflicting and simultaneous roles in the flocculation process. The first one is to increase the chance of particle collisions resulting in floc aggregation. Turbulence is the most important mechanism of aggregation ([
6,
33,
50,
51]). The second role is disaggregation of flocs. Based on laboratory experiments, Tsai and Hwang [
38] insist that a floc usually disaggregates into two roughly equal-sized daughter flocs. From this finding, it is deduced that the main mechanism of breakup is turbulent shear rather than particle collision.
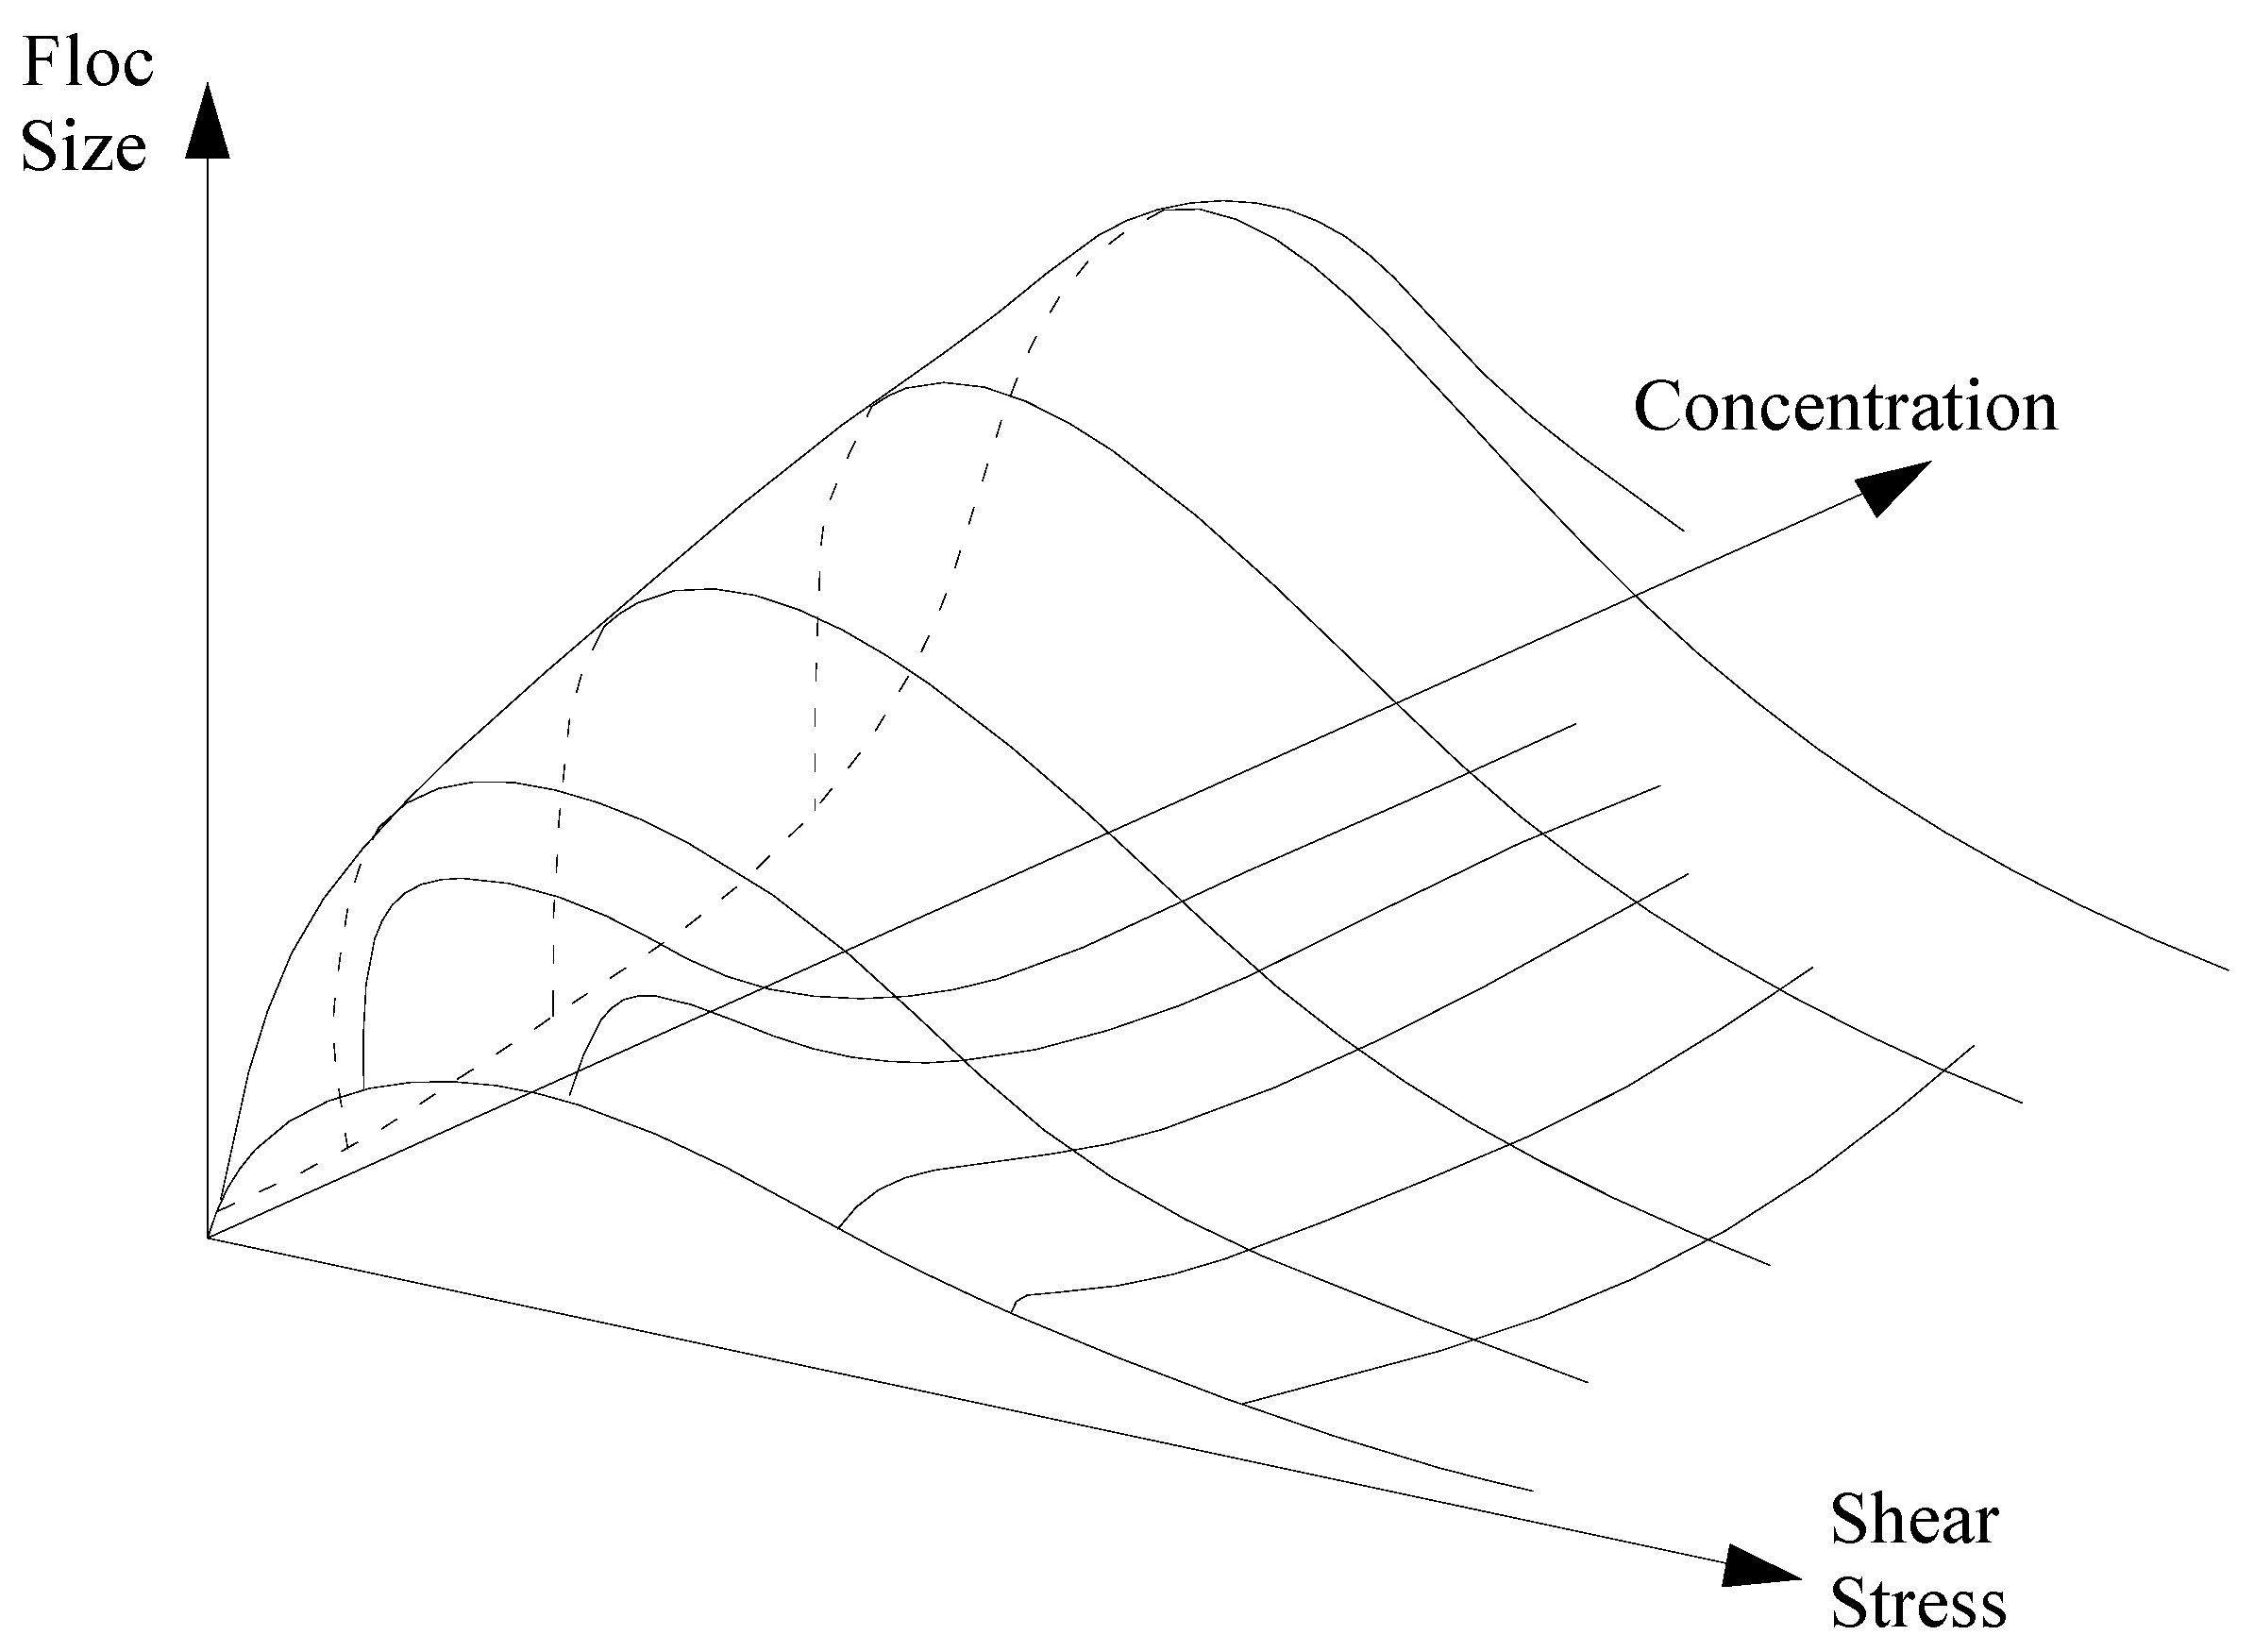
Figure 5 shows the effects of concentration and turbulent shear on mean floc size.
Figure 5 shows that the high turbulent shear enhances the breakup process compared to aggregation process causing reduction of floc size ([
2]). Therefore, the mean floc size of Burban
et al. [
24] is relatively small (about 20 μm) resulting in a high value for
.
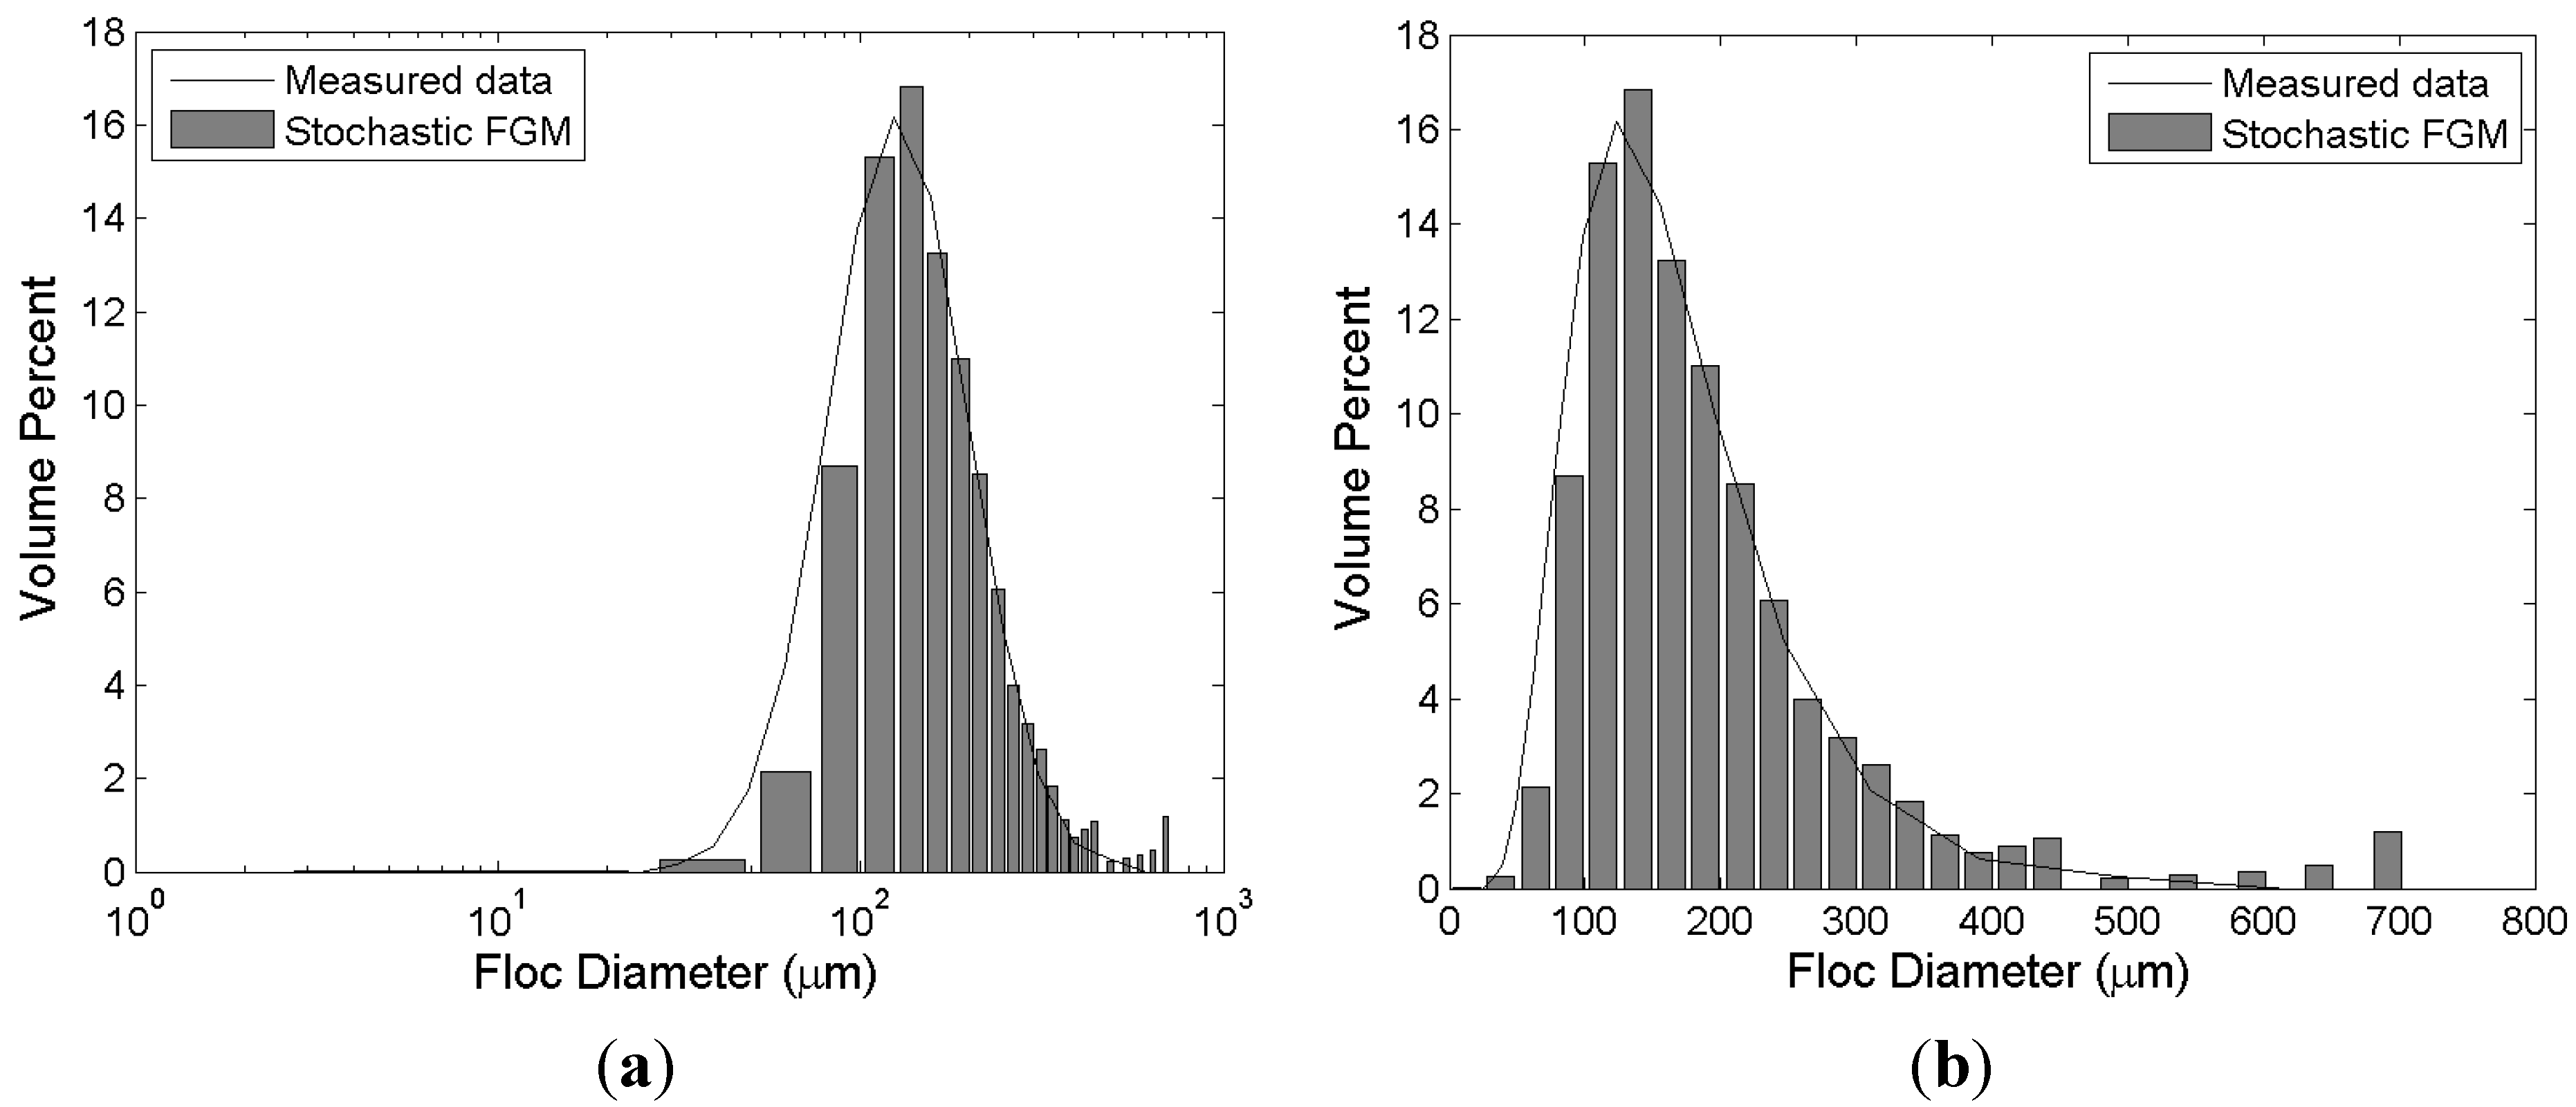
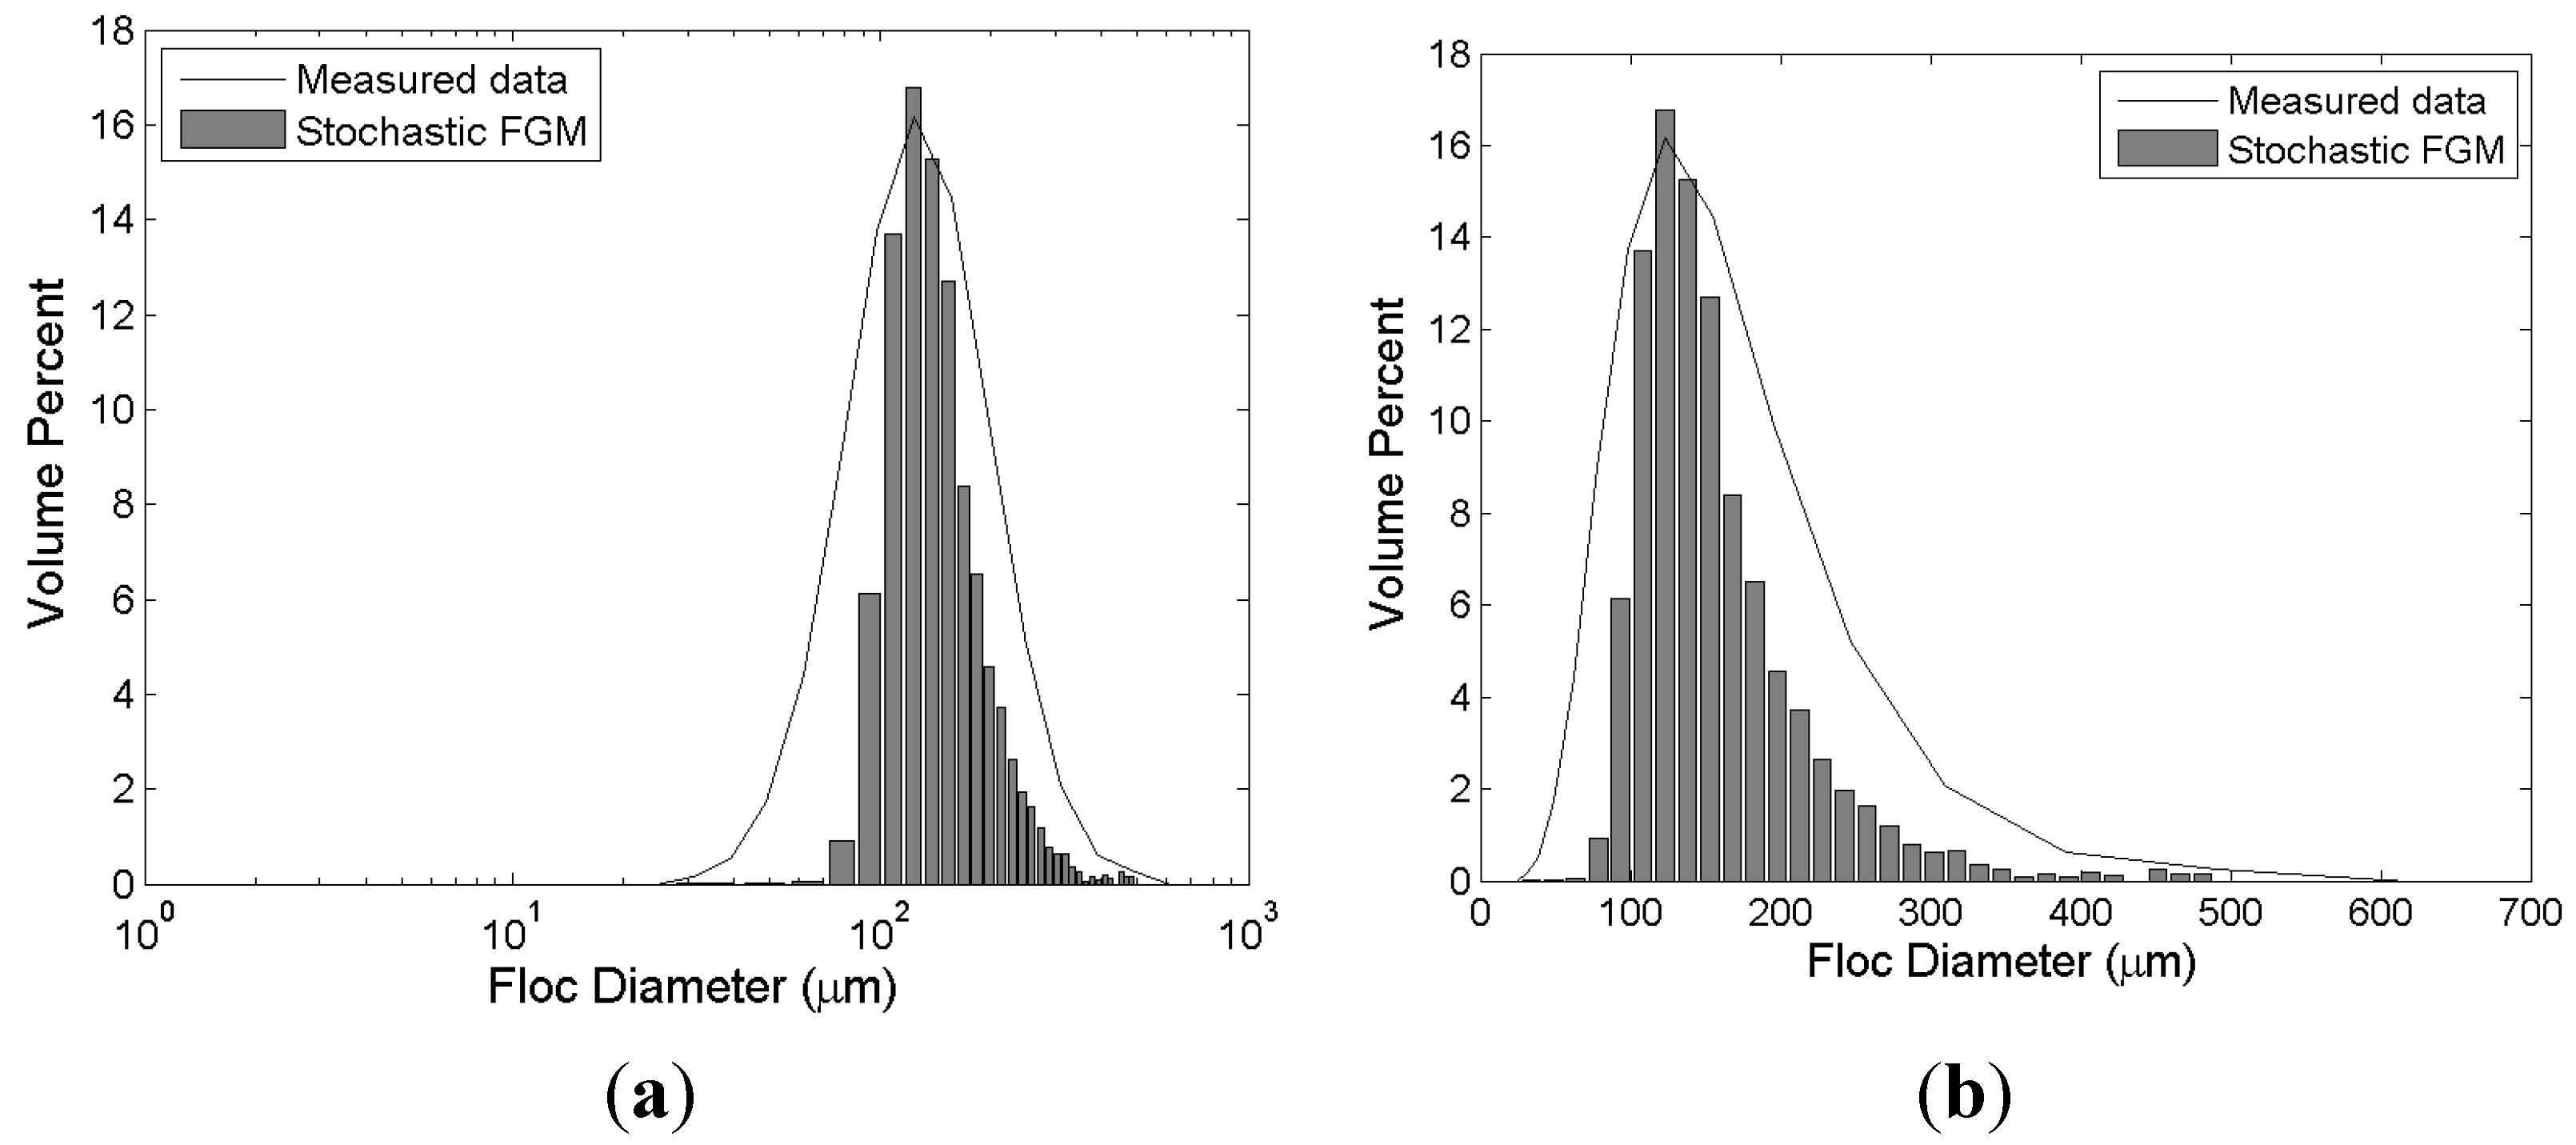
Figure 6 shows the results of numerical simulation by stochastic FGM and measurements from Burban
et al. [
24]. The volume fraction near the mean value is slightly overestimated by the stochastic FGM. However, the overall shape of the distribution is in good agreement with measurement results. The volume fraction slightly increases around floc size 80 μm due to the random nature of the stochastic model. A stochastic model is usually based on a random number generation technique (pseudorandom number generator in this study). Therefore, perturbations due to randomness are inevitable.
Figure 4.
The random calculation of stochastic FGM. The dotted line of (a) shows the simulation results of deterministic FGM (DFGM). The circle, square, and triangle symbols represent the maximum, mean, and minimum values of each simulation, respectively; the solid and dotted lines of (b) are the results of deterministic FGM (DFGM) and stochastic FGM (SFGM), respectively; (a) mean, maximum, and minimum floc size (b) temporal evolution of floc size.
Figure 5.
Conceptual diagram representing effect of turbulent shear on mean floc size.
Figure 5.
Conceptual diagram representing effect of turbulent shear on mean floc size.
Figure 6.
Simulation results of stochastic FGM and experimental results of Burban
et al. [
24]. The bars and the solid lines represent the experimental and simulation results, respectively. (
a) semi-log axis; (
b) normal (Cartesian) axis.
Figure 6.
Simulation results of stochastic FGM and experimental results of Burban
et al. [
24]. The bars and the solid lines represent the experimental and simulation results, respectively. (
a) semi-log axis; (
b) normal (Cartesian) axis.
Three more probability distributions have been tested. The results of stochastic FGM using a normal distribution are drawn in
Figure 7. The results are compared with Biggs and Lant [
9]. A normal distribution has two parameters: mean and variance. The values of mean and variance of normal distribution are calibrated to be 2.620 × 10
−5.0 and 5.623 × 10
−5.0, respectively.
Figure 8 shows the result of stochastic FGM using a Pearson type 3 distribution (Gamma distribution). A Pearson type 3 distribution needs 2 parameters: shape parameter (
kp) and scale parameter (θ). The mean and variance of Pearson type 3 distributions are indirectly determined by
kpθ and
kpθ
2, respectively. Therefore, it is not simple to calibrate a stochastic FGM. The determined values of
kp and θ for the simulation are 4.780 × 10
−1.0 and, 5.248 × 10
−5.0, respectively. Compared to results of the log-normal distribution (
Figure 3), FGMs using a normal distribution and a Pearson type 3 distribution overestimate the mean floc size, whereas the overall shape of size distribution is underestimated.
Figure 9 represents the results calculated by stochastic FGM using a generalized extreme value (GEV) distribution. A GEV distribution has 3 parameters: mean, variance, and shape parameter (
). In this study, the mean, variance, and
of the GEV distribution are set to be 1.147 × 10
−5.0, 1.0 × 10
−5.0 and 0.5, respectively. In the case of the GEV distribution, the floc size larger than the mean value is overestimated. Although a GEV distribution has one more degree of freedom (
) compared to log-normal distribution, no significant advantage is found.
4. Conclusions
This paper presents a stochastic FGM to calculate the size distribution of flocs. A stochastic approach is applied to the breakup process under the assumption that the aggregation process is significantly affected by properties of the sediment and carrier flow. For the stochastic approach, the parameter related to the breakup efficiency (
) is empirically assumed to have a log-normal distribution. From many previous studies under low organic content conditions (e.g., [
15,
35,
36,
37]), it is known that the size distribution of flocs is similar to a log-normal distribution. The capacity and limitations of the developed stochastic models are validated with three experimental results from Spicer
et al. [
23], Biggs and Lant [
9], and Burban
et al. [
24]. These three experiments have different experimental conditions such as sediment property, turbulence intensity, and concentration.
Figure 7.
Simulation result of stochastic FGM using a normal distribution (compared to the experimental results of Biggs and Lant [
9]). The bars and the solid lines represent the experimental and simulation results, respectively. (
a) semi-log axis; (
b) normal axis.
Figure 7.
Simulation result of stochastic FGM using a normal distribution (compared to the experimental results of Biggs and Lant [
9]). The bars and the solid lines represent the experimental and simulation results, respectively. (
a) semi-log axis; (
b) normal axis.
Figure 8.
Simulation result of stochastic FGM using a Pearson type 3 distribution (compared to the experimental results of Biggs and Lant [
9]). The bars and the solid lines represent the experimental and simulation results, respectively. (
a) semi-log axis; (
b) normal (Cartesian) axis.
Figure 8.
Simulation result of stochastic FGM using a Pearson type 3 distribution (compared to the experimental results of Biggs and Lant [
9]). The bars and the solid lines represent the experimental and simulation results, respectively. (
a) semi-log axis; (
b) normal (Cartesian) axis.
As examined in
Section 3, a stochastic FGM using a log-normal distribution has the capability to replicate the size distribution of flocs to a reasonable extent. Three different probability distributions such as normal, Pearson type 3, and GEV distributions are also tested in this study. Among them, an FGM using a log-normal distribution has the advantage of accuracy and simplicity. When a normal distribution is applied, a stochastic FGM underestimates the distribution of flocs larger than 200 μm, although the variance and mode are calculated in conformity. This finding shows that the positive skewness of
is needed to calculate large flocs reasonably well. The positive skewness of
decreases the breakup possibility for relatively large flocs. Flocs become less dense and more fragile as the size of floc increases. As a result, large flocs have higher possibility of breakup. A stochastic FGM using a Pearson type 3 distribution shows a mean-concentrated distribution of floc size. The skewness of a Pearson type 3 distribution is inversely proportional to the shape parameter (
) whereas the variance is proportional to the shape parameter (
). Therefore, the variance decreases resulting in the mean-concentrated distribution when the skewness is increased. The result of a GEV distribution is in good agreement with measurement results. Compared to a log-normal distribution, a GEV distribution has one more degree of freedom as mentioned in
Section 3. Thus, the calibration of a GEV distribution is not found to be complicated relative to a log-normal distribution.
Figure 9.
Simulation result of stochastic FGM using a generalized extreme value distribution (compared to the experimental results of Biggs and Lant [
9]). The bars and the solid lines represent the experimental and simulation results, respectively. (
a) semi-log axis; (
b) normal (Cartesian) axis.
Figure 9.
Simulation result of stochastic FGM using a generalized extreme value distribution (compared to the experimental results of Biggs and Lant [
9]). The bars and the solid lines represent the experimental and simulation results, respectively. (
a) semi-log axis; (
b) normal (Cartesian) axis.
An FGM has an advantage in the sense that it ensures mass conservation in a closed system and can be easily incorporated into the numerical sediment transport model. The previous FGMs, such as those used by Son and Hsu [
7] and Winterwerp [
8], calculate the average size of flocs (representative floc size). Therefore, the sediment transport model considering the flocculation process also assumes the suspension of mono-sized sediment (e.g., [
25]). When a stochastic FGM discussed in this study is incorporated with the sediment transport model, it has the capability to calculate the size distributions of suspended cohesive sediments (flocs) as well as the temporal and spatial variation of floc concentration. Hence, future incorporation of these results (
i.e., stochastic FGMs) to sediment transport models will greatly improve resolution and uncertainty, furthering our knowledge of cohesive sediment transport processes.
In this study, the mean of
(
in Equation (3)) is assumed to be constant following the previous studies (e.g., [
1,
7,
8]).
is a parameter representing the probability of floc breakup. As the size of floc increases, the probability of breakup is also expected to increase because the yield stress of floc usually depends on floc size. Therefore, it is necessary to study the effect of floc size evolution through the flocculation process on calibration of
in the future. It is also notable that the time step size may affect the calculation of floc size distribution. In this study, the time step for the numerical calculation is automatically determined by the Dormand-Prince method. In order to examine the effect of the time step, it is necessary to calculate the stochastic FGM with different fixed time step values.
