
Aquifer Recharge Estimation through Atmospheric Chloride Mass Balance at Las Cañadas Caldera, Tenerife, Canary Islands, Spain

Abstract
:1. Introduction

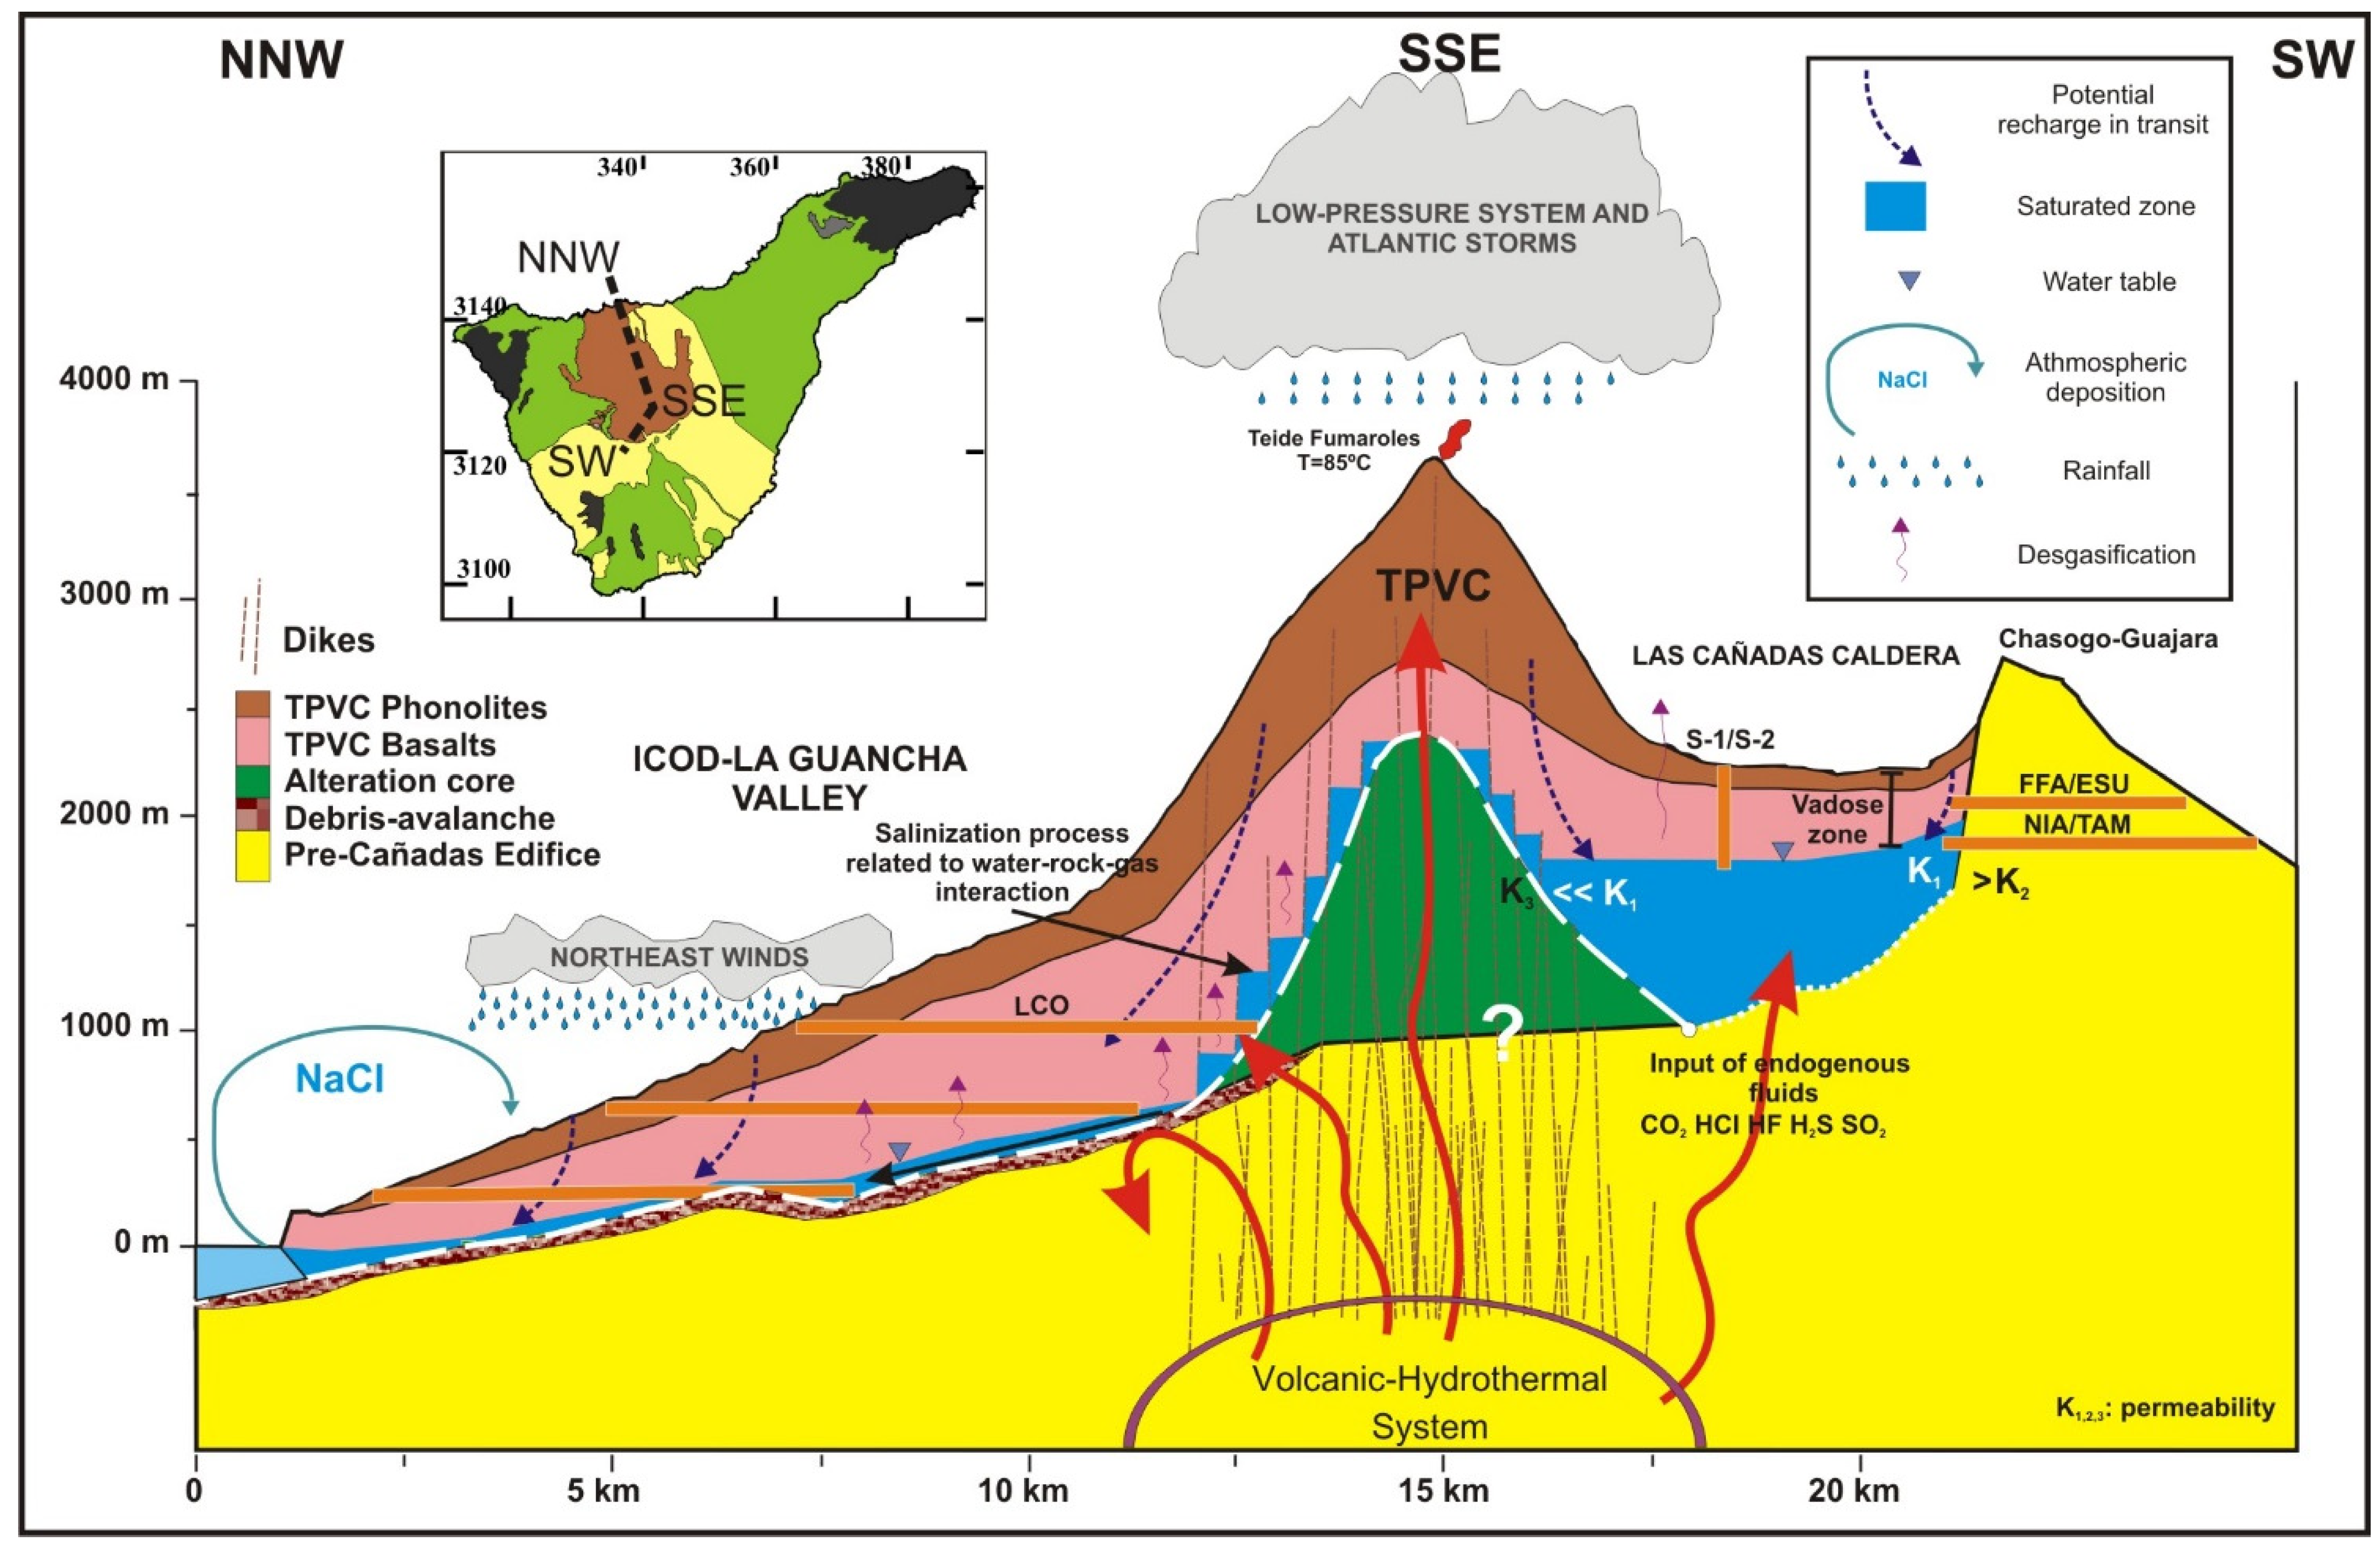
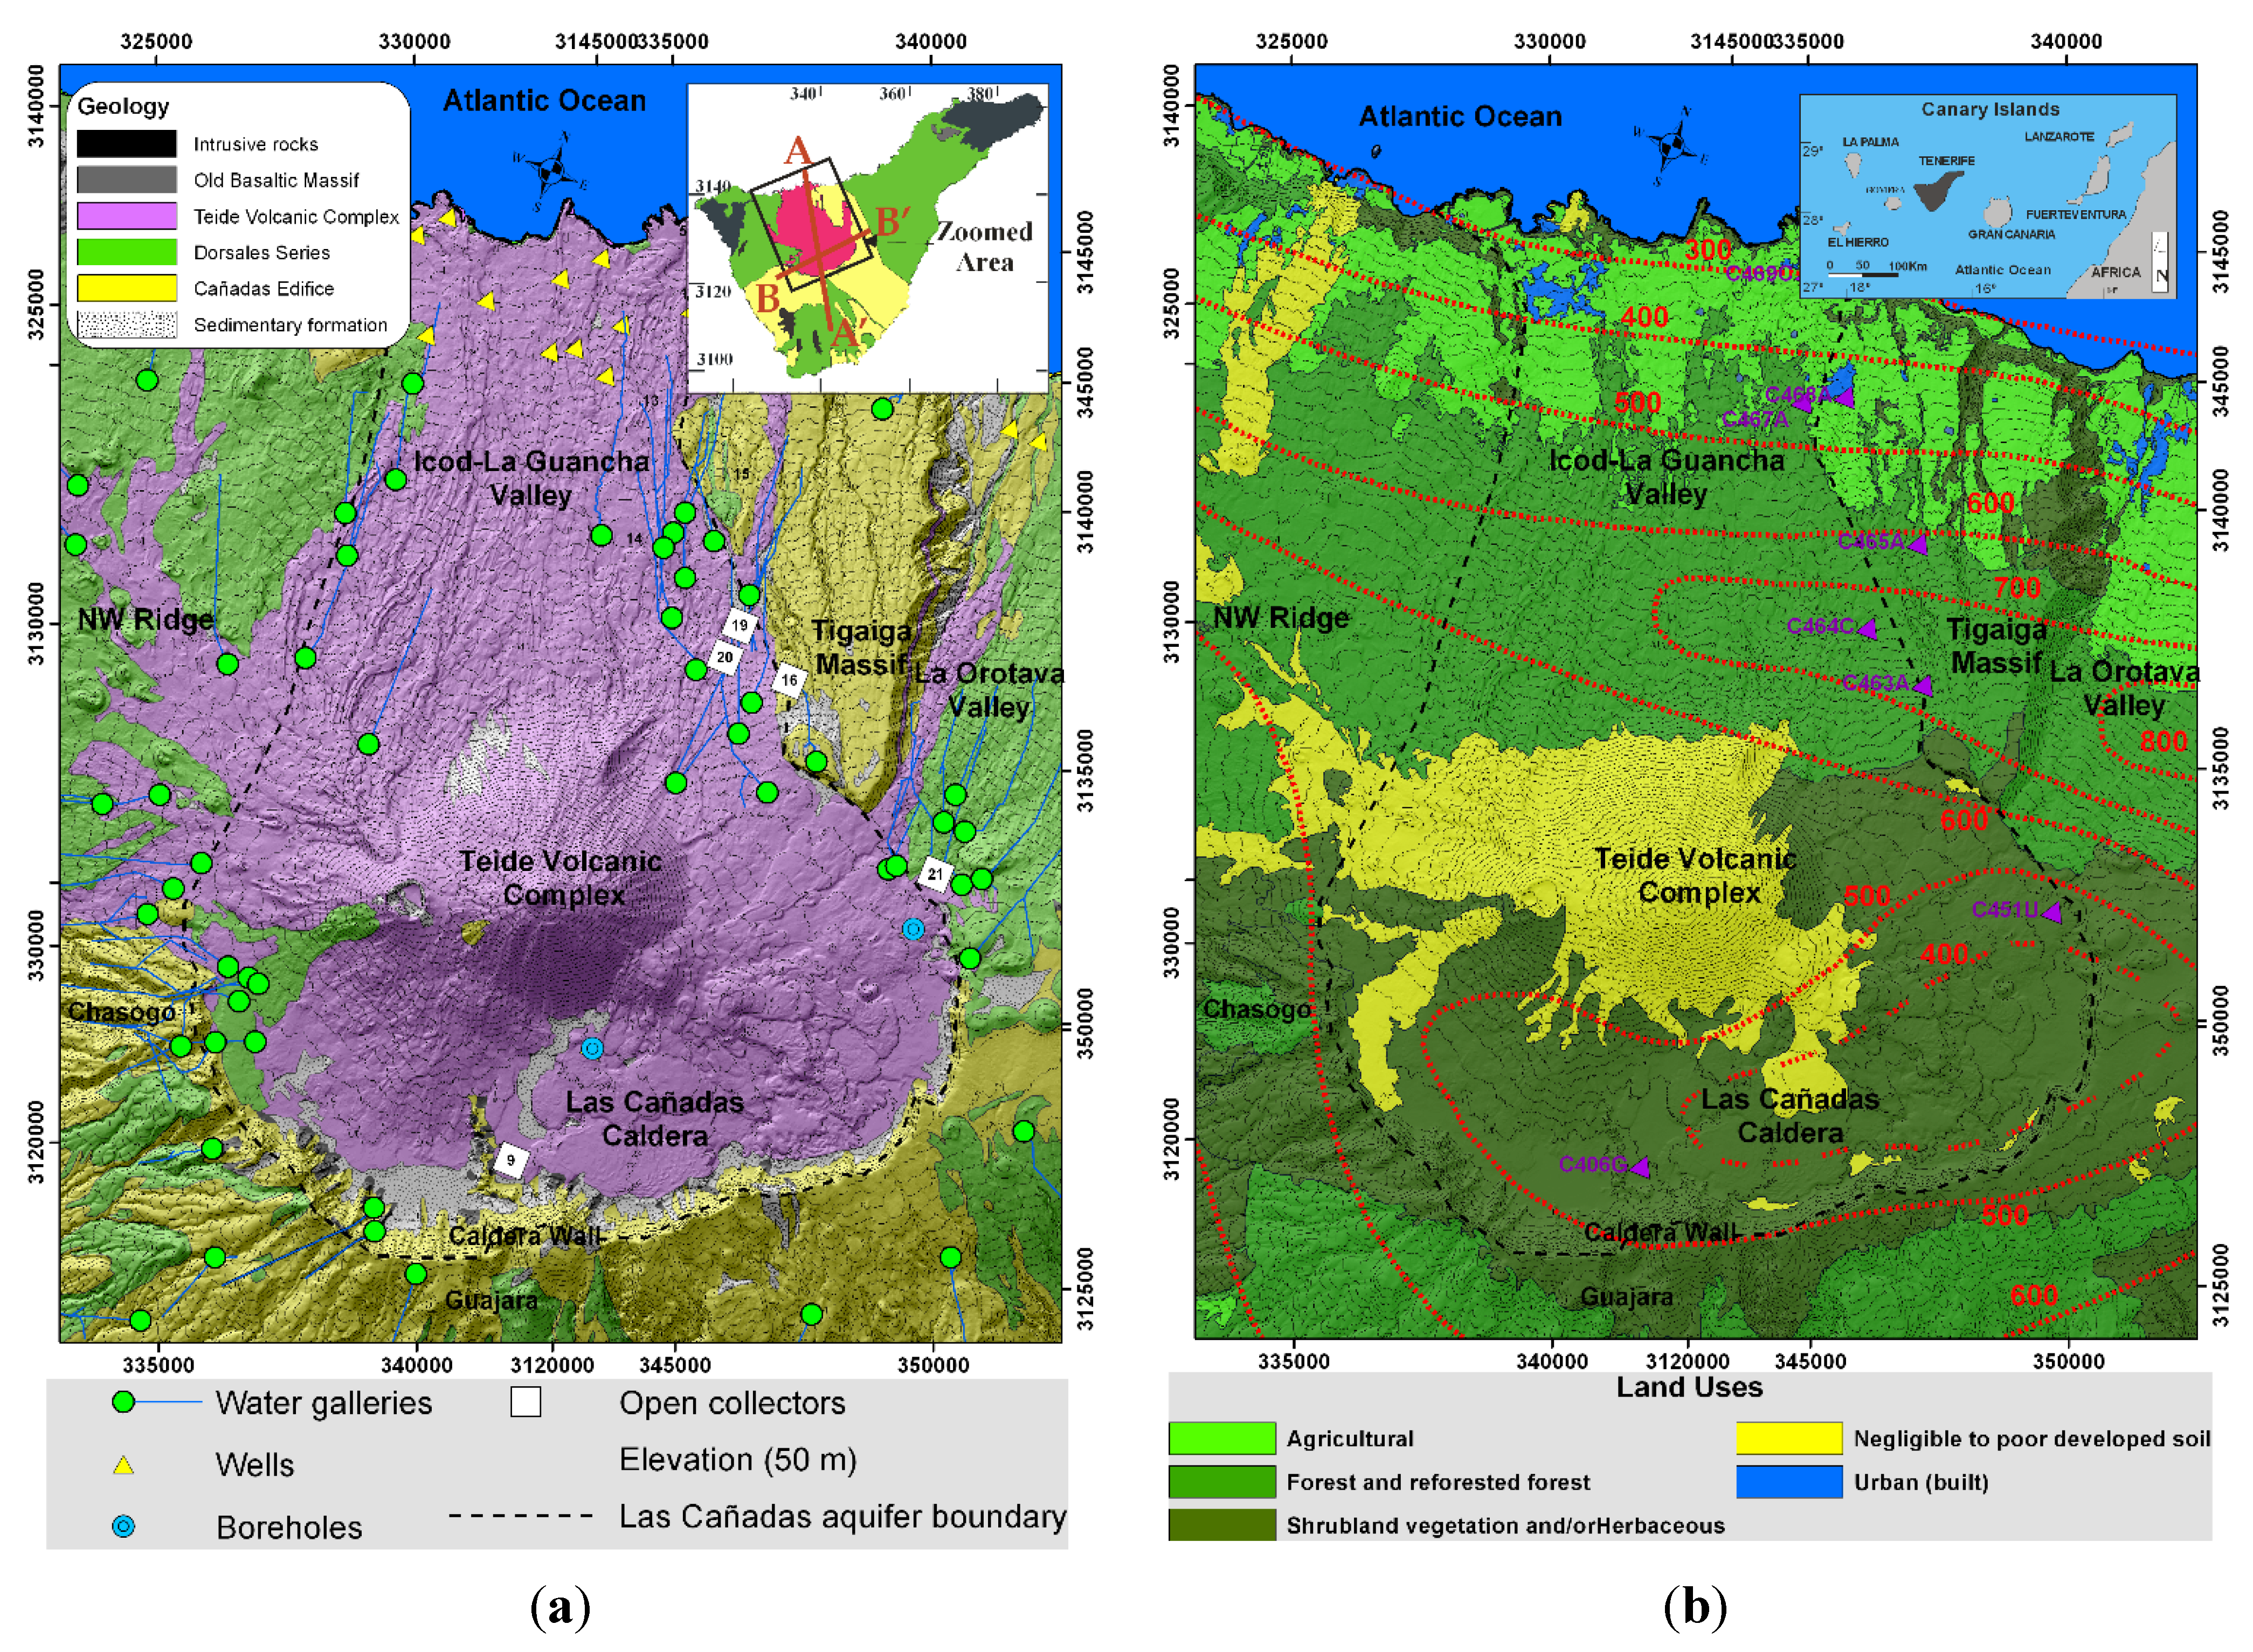
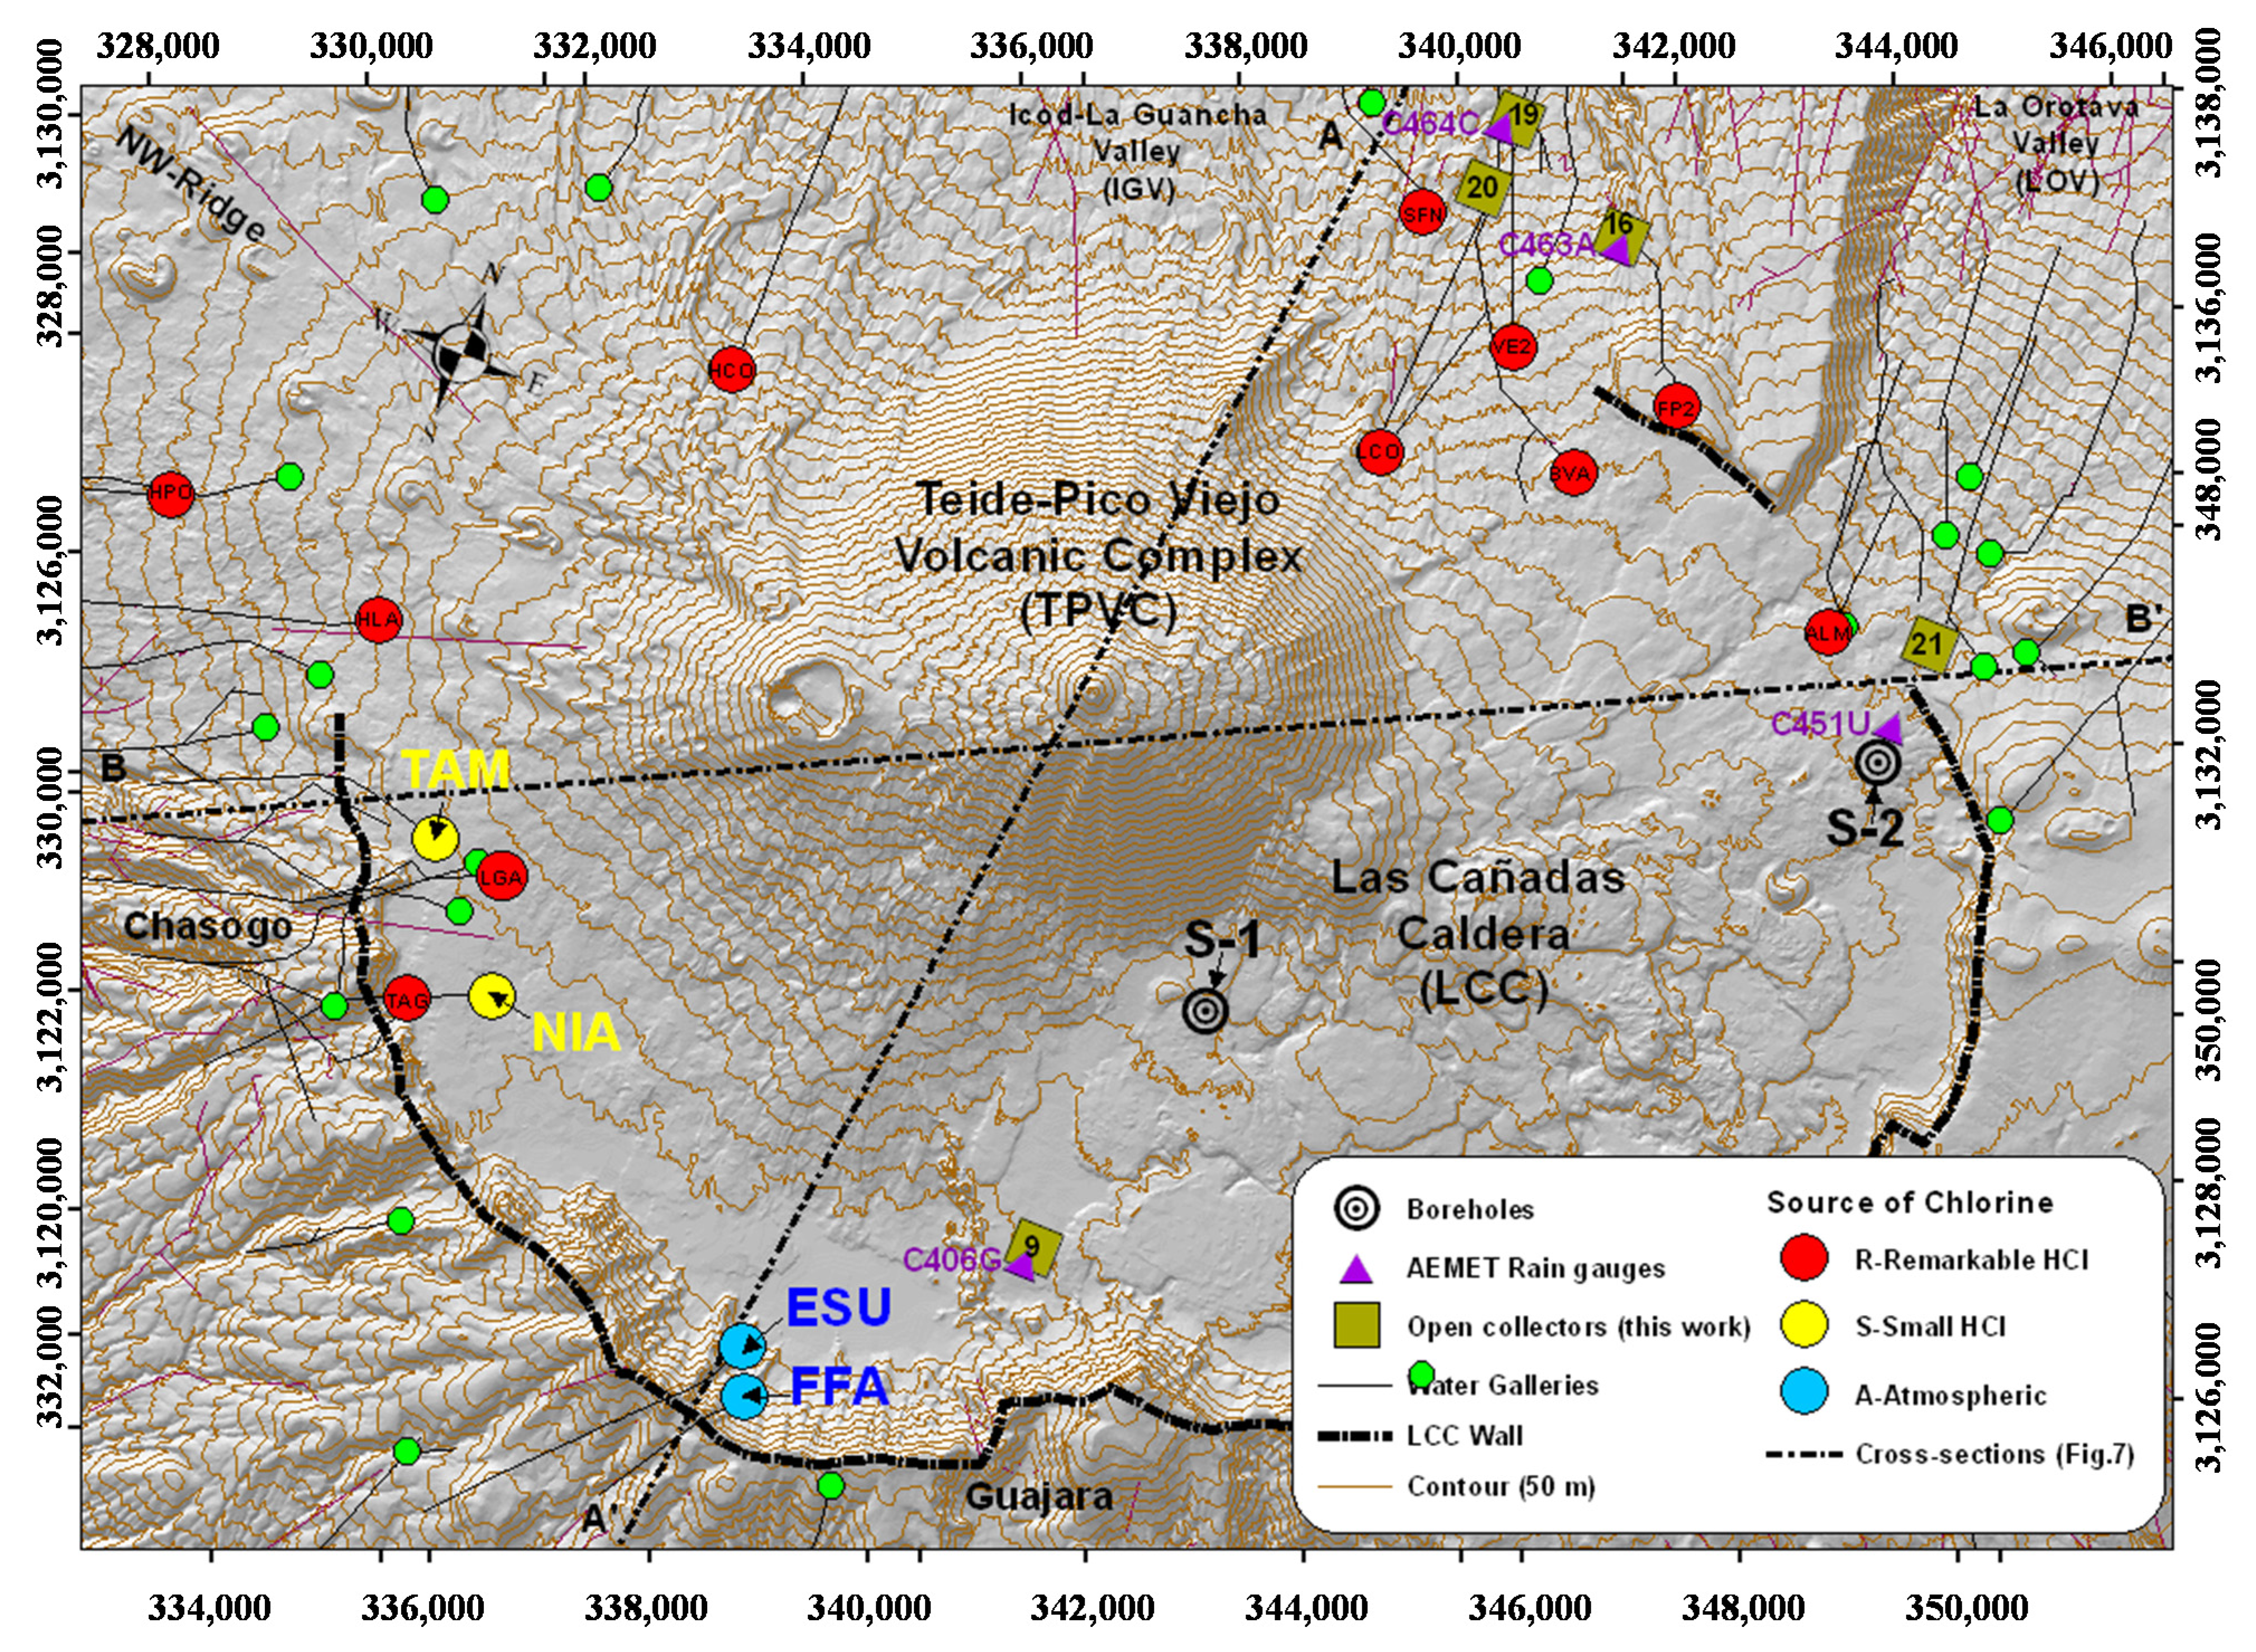
2. Study Area
3. Methods and Interpretative Basis
3.1. Atmospheric Chloride Mass Balance (CMB) Method
3.2. The Chloride Mass Balance (CMB) Method Application in the Study Area
4. Results
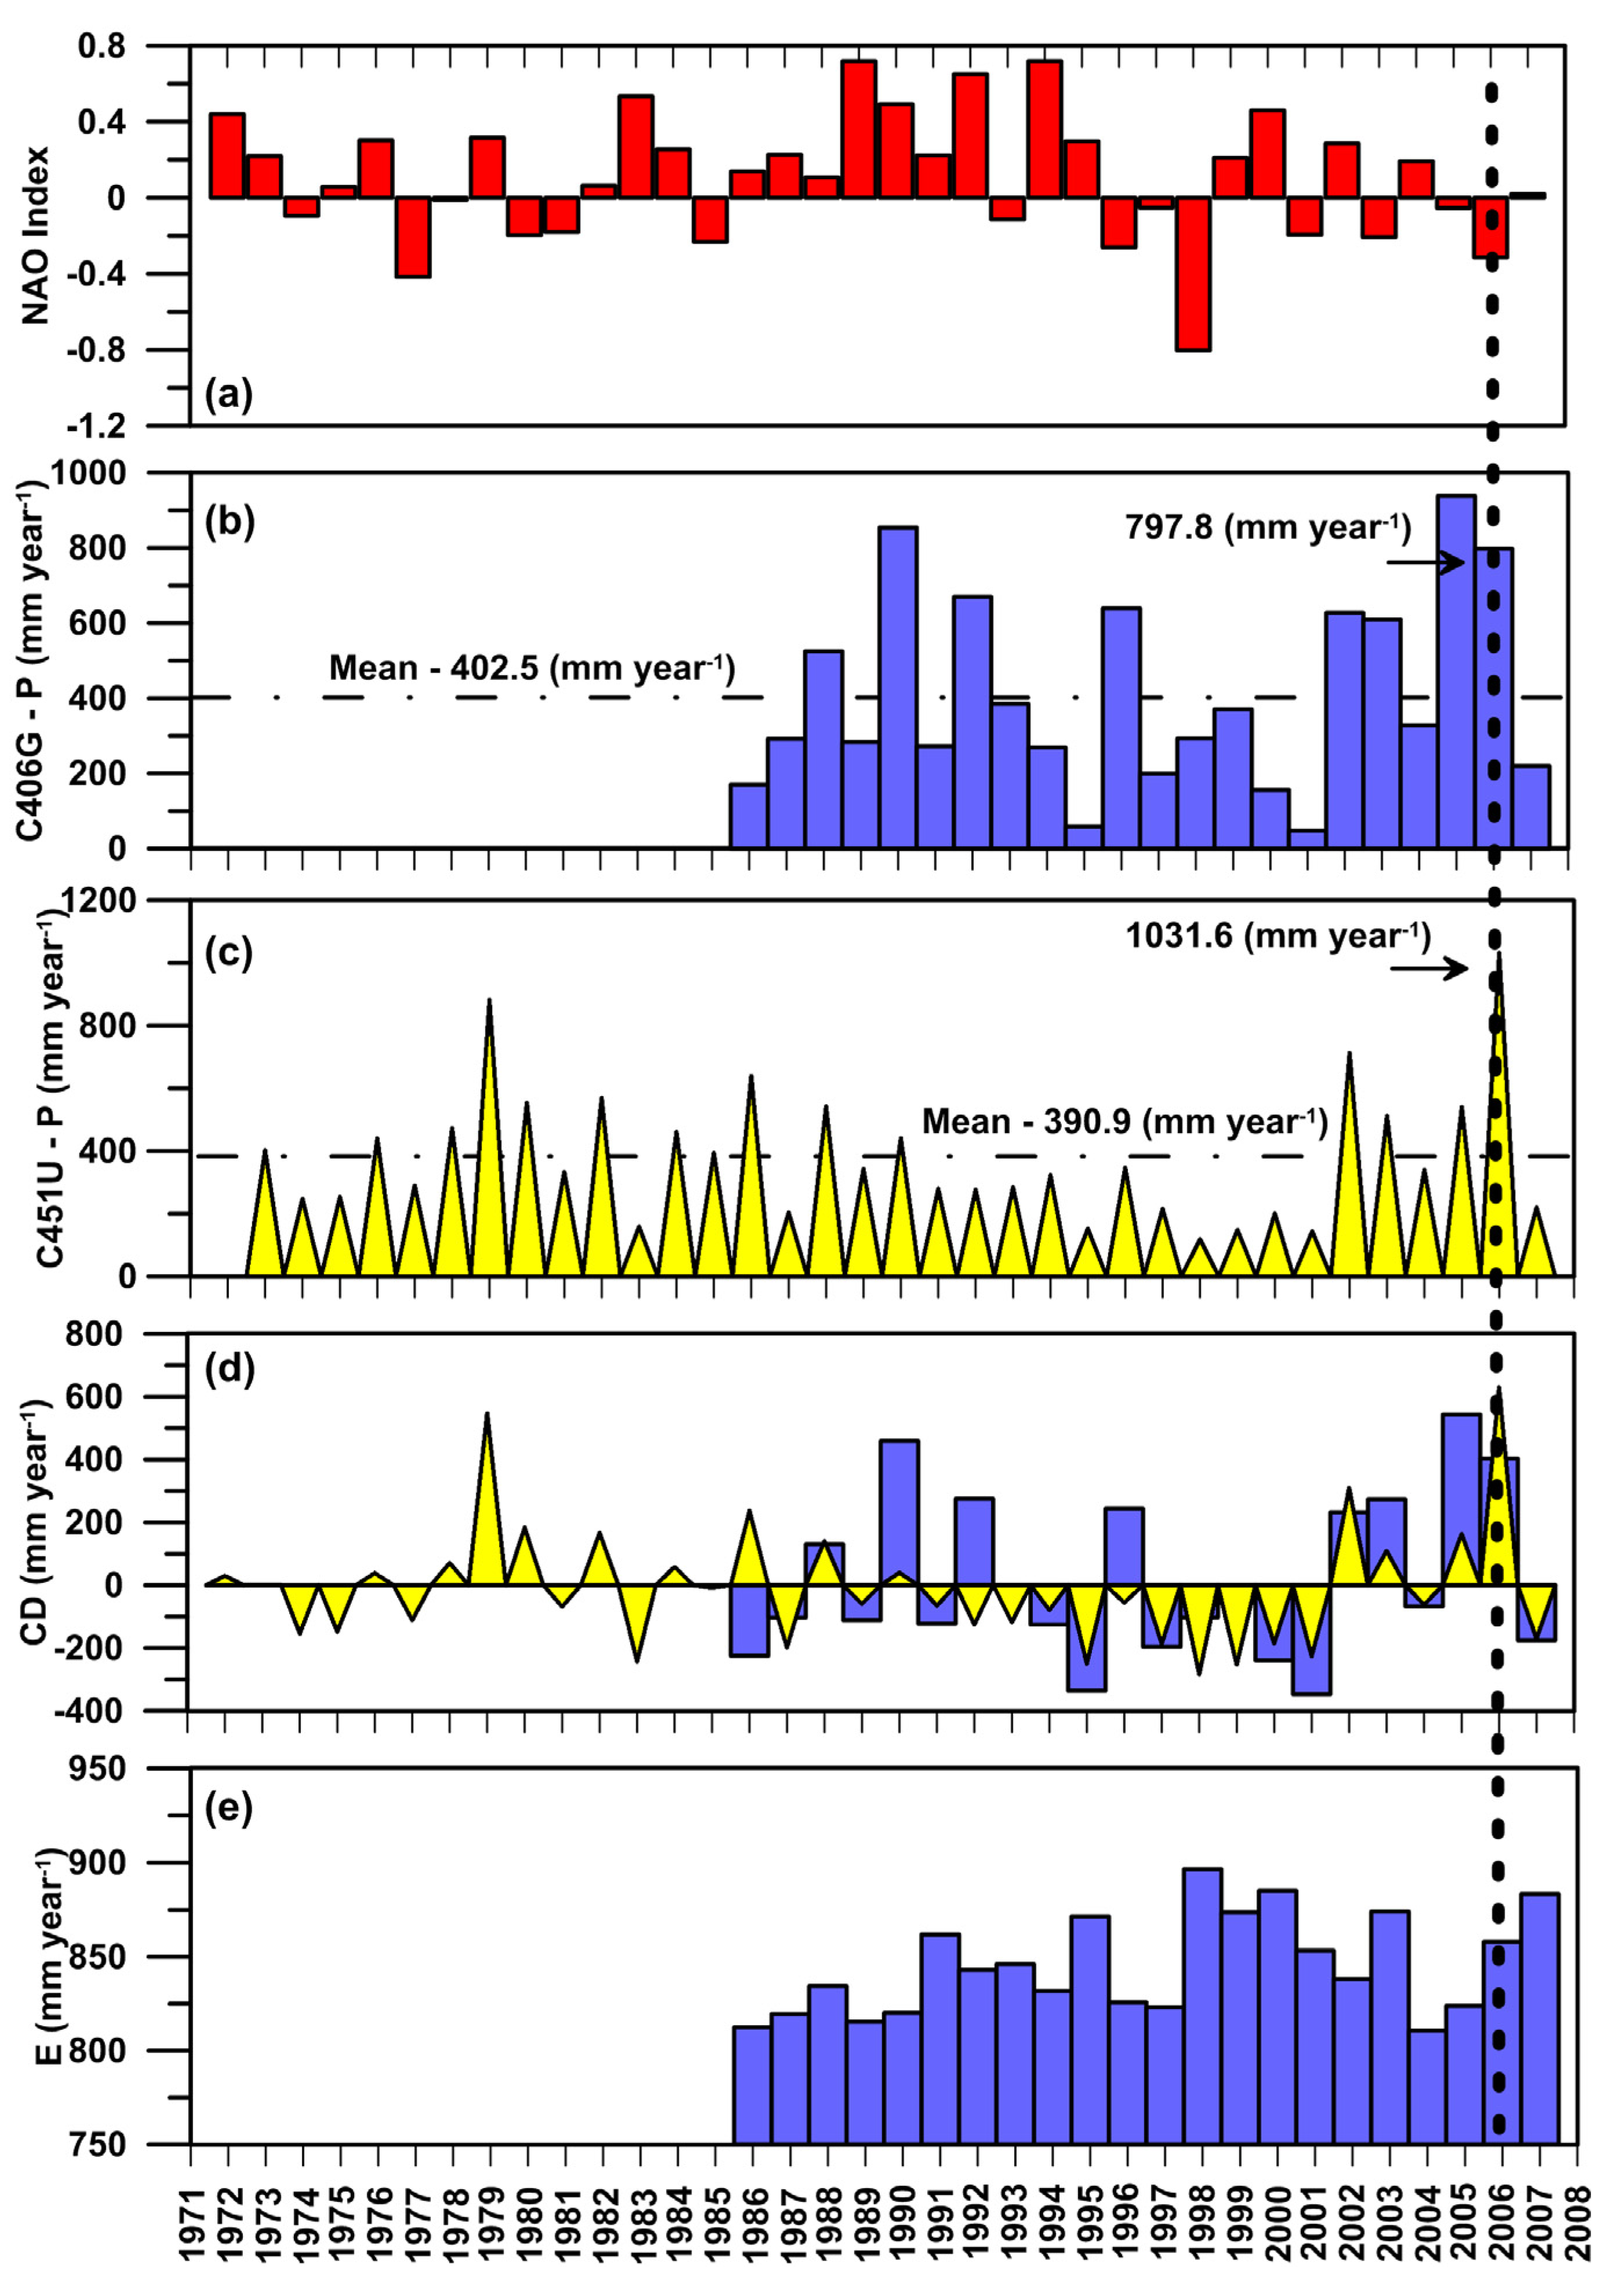
4.1. Hydrological Regime of the Study Area
4.2. Atmospheric Chloride Bulk Deposition

4.3. Average Chloride Concentration in Recharge Water


| Station | Coordinates | Elevation m a.s.l. | Sampling Period | n days | P mm | P′ mm | Cl mg L−1 | Br mg·L−1 | Cl/Br | AM g·m−2 | AC g m−2·year−1 | ||
|---|---|---|---|---|---|---|---|---|---|---|---|---|---|
| From | To | ||||||||||||
| 9 | −16.3735 | 28.1328 | 2149 | 28 September 2005 | 17 October 2006 | 384 | 729.2 | 653.3 | 5.62 | 0.16 | 145 | 3.67 | 3.90 |
| 16 | −16.3640 | 28.1940 | 1711 | 28 September 2005 | 04 October 2006 | 369 | 636.0 | 590.0 | 5.50 | 0.02 | 890 | 3.25 | 3.46 |
| 19 | −16.3731 | 28.2010 | 1316 | 22 September 2005 | 04 October 2006 | 377 | 552.9 | 552.6 | 5.91 | 0.04 | 300 | 3.28 | 3.19 |
| 20 | −16.3632 | 28.1937 | 1475 | 22 September 2005 | 04 October 2006 | 377 | 676.9 | 673.9 | 3.50 | 0.03 | 726 | 2.34 | 2.28 |
| 21 | −16.3359 | 28.1817 | 2059 | 28 September 2005 | 17 October 2006 | 383 | 680.9 | 636.7 | 5.18 | 0.01 | 368 | 3.30 | 3.36 |
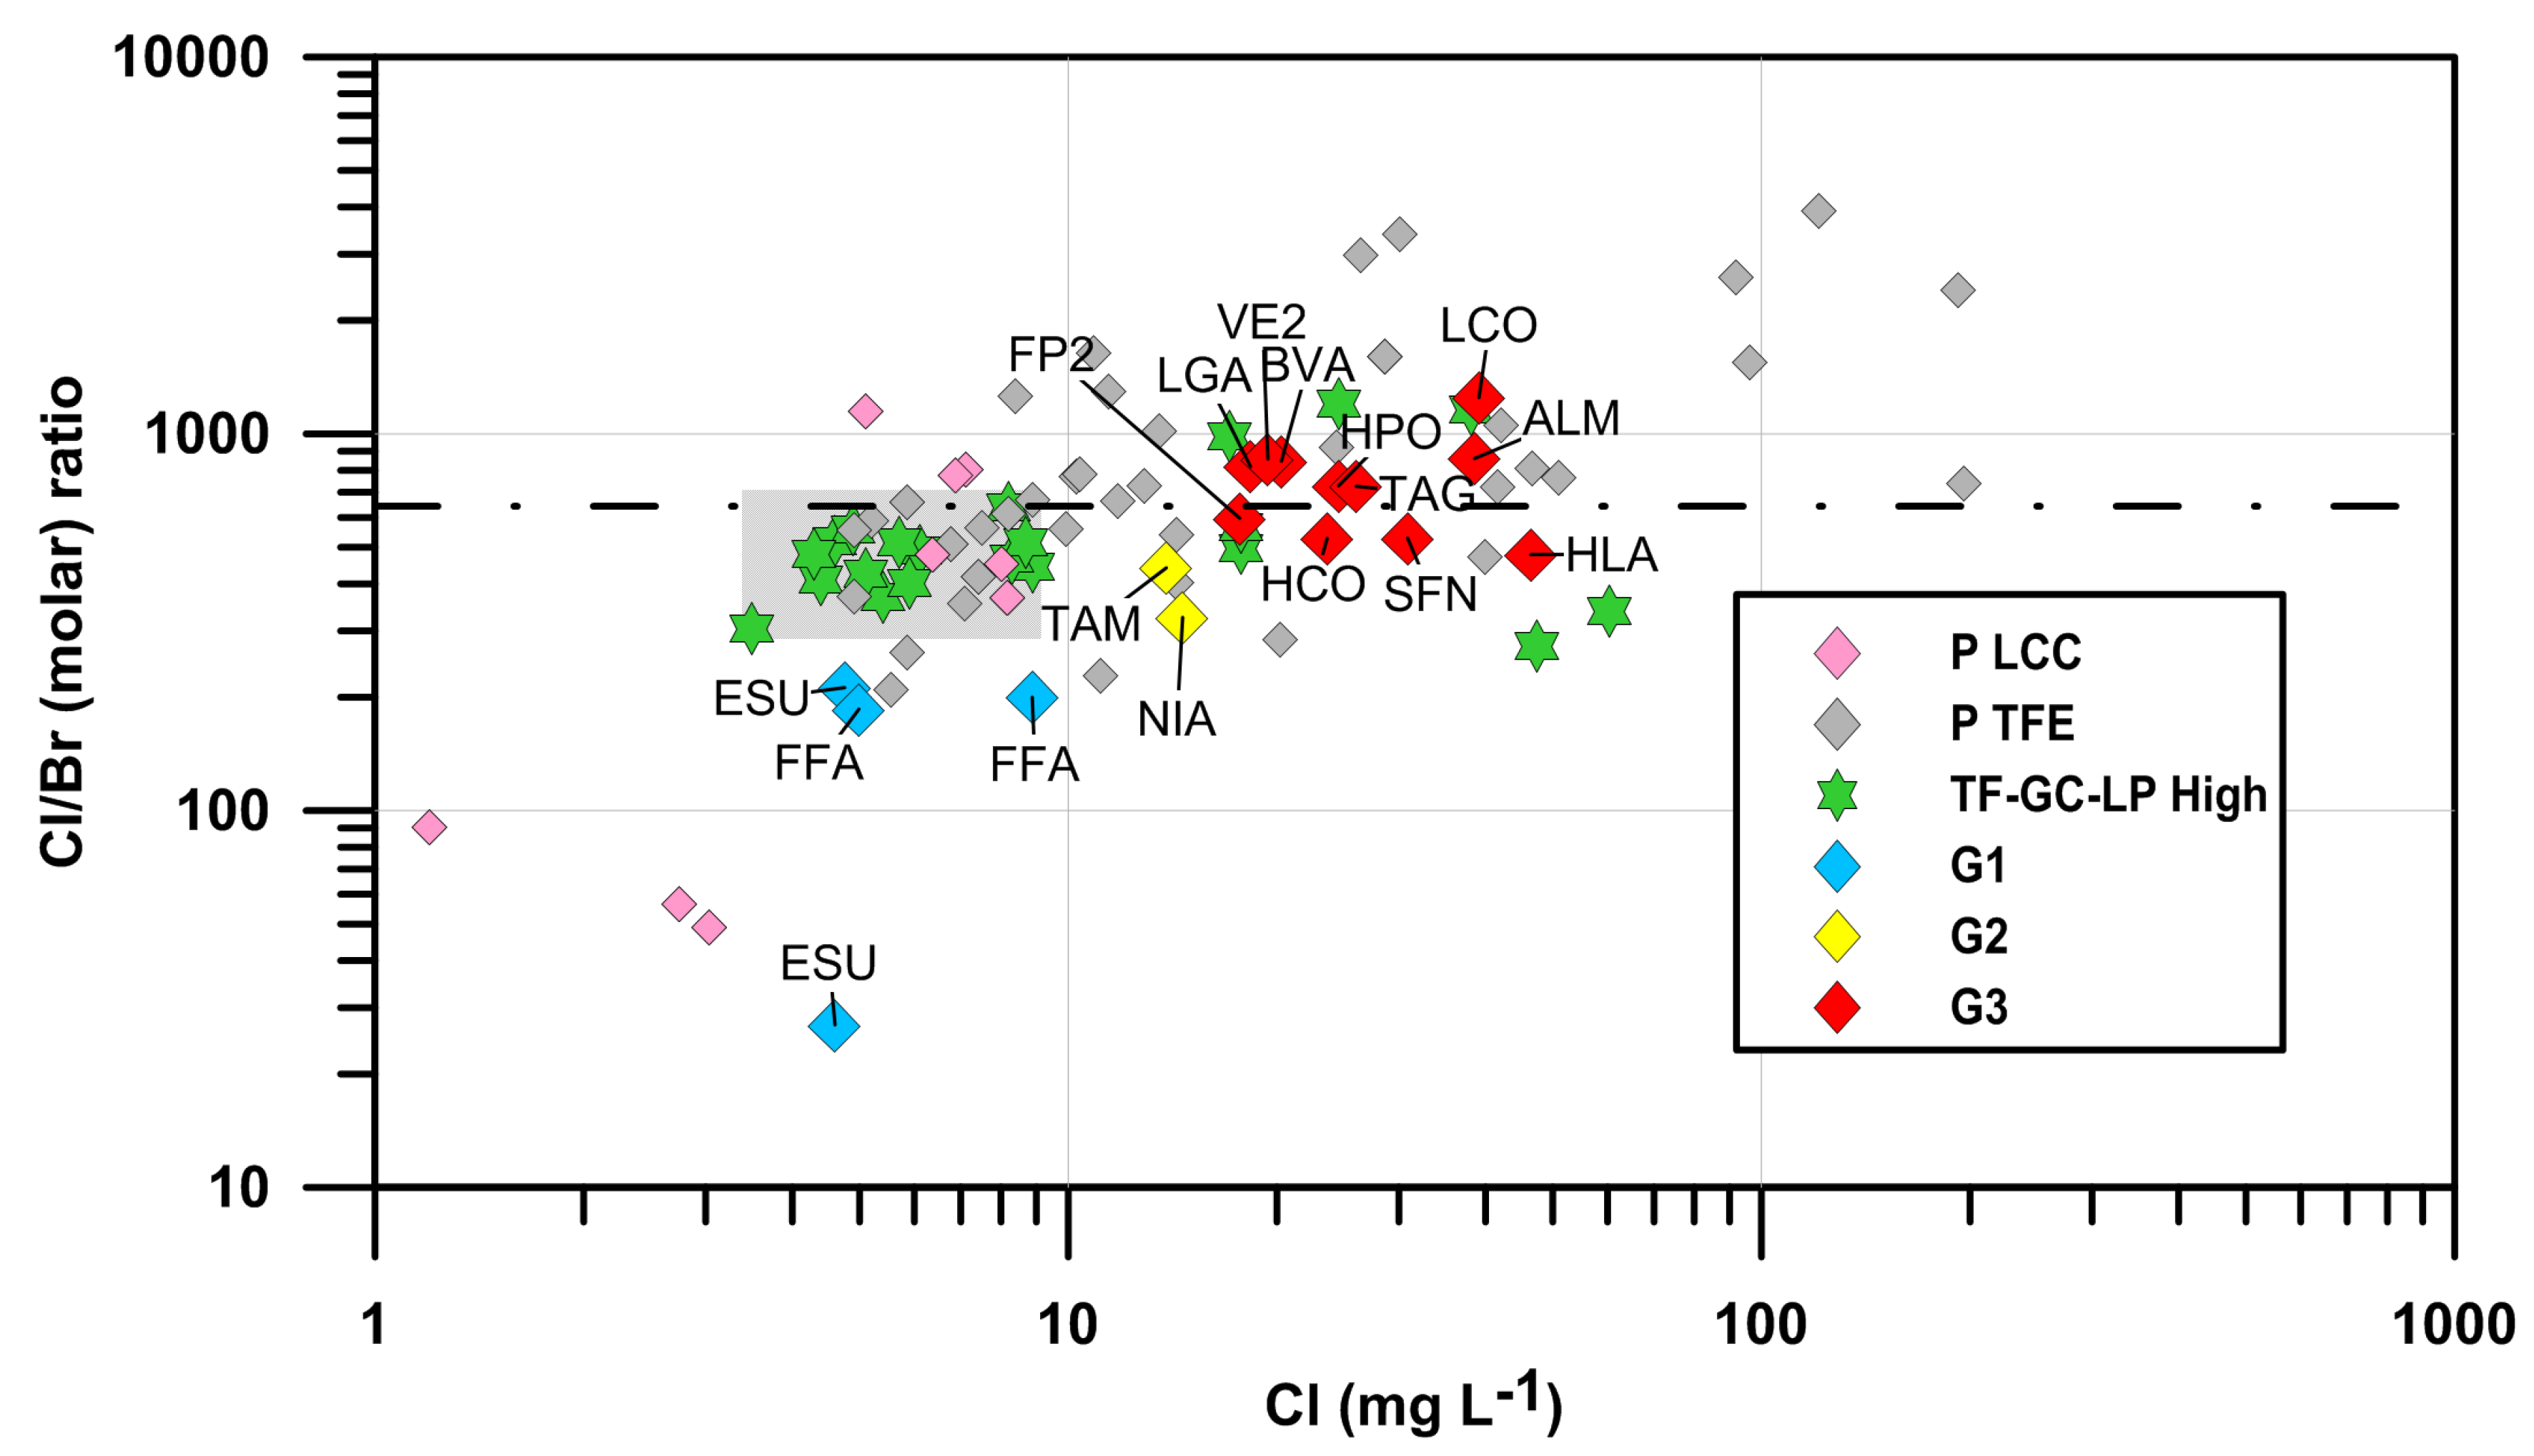
| Groups | n | Flow (L·s−1) | Cl | Cl/Br | Br | Recharge Area Elevation (m a.s.l.) | Outlet Discharge Elevation (m a.s.l.) | Source of Data | Source of Chloride | ||||||
|---|---|---|---|---|---|---|---|---|---|---|---|---|---|---|---|
| M | ±1σ | CV | M | ±1σ | CV | M | ±1σ | CV | |||||||
| 1-Recharge | 9 | 0.1–29.3 | 7.73 | 4.58 | 0.59 | 144 | 87 | 0.61 | 0.04 | 0.16 | 0.25 | 2074–2184 | 1895–2040 | [1,2] | A |
| 2-Shallow | 16 | 2.0–47.0 | 20.95 | 11.20 | 0.53 | 338 | 144 | 0.43 | 0.09 | 0.01 | 0.11 | 2077–2133 | 1525–1779 | [1,2] | S |
| 3-Deep | 11 | 4.0–237.2 | 25.55 | 11.20 | 0.44 | 740 | 207 | 0.28 | 0.08 | 0.03 | 0.38 | 1533–2115 | 790–1780 | [1] | R |
4.4. Recharge Evaluation

5. Discussion
6. Conclusions

Acknowledgments
Author Contributions
Conflicts of Interest
References and Notes
- Falkland, A.; Custodio, E. Guide on the Hydrology of Small Islands; Studies and Reports in Hydrology, UNESCO: Paris, France, 1991; Volume 49, pp. 51–130. [Google Scholar]
- Braojos, J.J.; Farrujia, I.; Fernández, J.D. Los recursos hídricos en Tenerife frente al cambio climático. In Proceedings of the III Congreso de Ingeniería Civil, Territorio y Medio Ambiente, Zaragoza, Spain, 25–27 October 2006; p. 16.
- Custodio, E.; Cabrera, M.C. The Canary Islands. In Water, Agriculture Environment Spain, Can We Square the Circle? de Stefano, L., Llamas, M.R., Eds.; CRC Press: Boca Raton, FL, USA, 2013; pp. 281–290. [Google Scholar]
- Join, J.L.; Folio, J.L.; Robineau, B. Aquifers and groundwater within active shield volcanoes. Evolution of conceptual models in the Piton de la Fournaise volcano. J. Volcanol. Geotherm. Res. 2005, 147, 187–201. [Google Scholar] [CrossRef]
- Herrera, C.; Custodio, E. Conceptual hydrogeological model of volcanic Easter Island (Chile) after chemical and isotopic surveys. Hydrogeol. J. 2008, 16, 1329–1348. [Google Scholar] [CrossRef]
- Herrera, C.; Custodio, E. Groundwater flow in a relatively old oceanic volcanic island: The Betancuria area, Fuerteventura Island, Canary Islands, Spain. Sci. Total Environ. 2014, 496, 531–550. [Google Scholar] [CrossRef] [PubMed]
- Milly, P.C.D.; Eagleson, P.S. Effects of spatial variability on annual average water balance. Water Resour. Res. 1987, 23, 2135–2143. [Google Scholar] [CrossRef]
- Scanlon, B.R. Uncertainties in estimating water fluxes and residence times using environmental tracers in an arid unsaturated zone. Water Resour. Res. 2000, 36, 395–409. [Google Scholar] [CrossRef]
- Alcalá, F.J.; Custodio, E. Natural uncertainty of spatial average aquifer recharge through atmospheric chloride mass balance in continental Spain. J. Hydrol. 2015, 524, 642–661. [Google Scholar] [CrossRef]
- Contreras, S.; Boer, M.; Alcalá, F.J.; Domingo, F.; García, M.; Pulido-Bosch, A.; Puigdefábregas, J. An ecohydrological modelling approach for assessing long-term recharge rates in semiarid karstic landscapes. J. Hydrol. 2008, 351, 42–57. [Google Scholar] [CrossRef]
- Hugman, R.; Stigter, T.Y.; Monteiro, J.P.; Nunes, L.M. Influence of aquifer properties and the spatial and temporal distribution of recharge and abstraction on sustainable yields in semi-arid regions. Hydrol. Process. 2012, 26, 2791–2801. [Google Scholar] [CrossRef]
- España, S.; Alcalá, F.J.; Vallejos, A.; Pulido-Bosch, A. A GIS tool for modelling annual diffuse infiltration on a plot scale. Comput. Geosci. 2013, 54, 318–325. [Google Scholar] [CrossRef]
- Scanlon, B.R.; Keese, K.E.; Flint, A.L.; Flint, L.E.; Gaye, C.B.; Edmunds, W.M.; Simmers, I. Global synthesis of groundwater recharge in semiarid and arid regions. Hydrol. Process. 2006, 20, 3335–3370. [Google Scholar] [CrossRef]
- Alcalá, F.J.; Cantón, Y.; Contreras, S.; Were, A.; Serrano-Ortiz, P.; Puigdefábregas, J.; Solé-Benet, A.; Custodio, E.; Domingo, F. Diffuse and concentrated recharge evaluation using physical and tracer techniques: Results from a semiarid carbonate massif aquifer in southeastern Spain. Environ. Earth Sci. 2011, 63, 541–557. [Google Scholar] [CrossRef]
- Coes, A.L.; Spruill, T.B.; Thomasson, M.J. Multiple-method estimation of recharge rates at diverse locations in the North Caroline Coastal Plains, USA. Hydrog. J. 2007, 15, 773–788. [Google Scholar] [CrossRef]
- Andreu, J.M.; Alcalá, F.J.; Vallejos, Á.; Pulido-Bosch, A. Recharge to aquifers in SE Spain: Different approaches and new challenges. J. Arid Environ. 2011, 75, 1262–1270. [Google Scholar] [CrossRef]
- Custodio, E.; Llamas, M.R.; Samper, J. Aquifers Recharge Evaluation in Water Planning; IAH-Spanish Chapter and ITGE: Madrid, Spain, 1997; p. 455. [Google Scholar]
- Alcalá, F.J.; Custodio, E. Atmospheric chloride deposition in continental Spain. Hydrol. Process. 2008, 22, 3636–3650. [Google Scholar] [CrossRef]
- Maréchal, J.C.; Varma, M.R.R.; Riotte, J.; Vouillamoz, J.M.; Kumar, M.S.M.; Ruiz, L.; Sekhar, M.; Braun, J.J. Indirect and direct recharges in a tropical forested watershed: Mule Hole, India. J. Hydrol. 2009, 364, 272–284. [Google Scholar] [CrossRef]
- Custodio, E. Estimation of aquifer recharge by means of atmospheric chloride deposition balance in the soil. Contrib. Sci. 2010, 6, 81–97. [Google Scholar]
- Alcalá, F.J.; Custodio, E. Using the Cl/Br ratio as a tracer to identify the origin of salinity in aquifers in Spain and Portugal. J. Hydrol. 2008, 359, 189–207. [Google Scholar] [CrossRef]
- Custodio, E.; Herrera, C. Utilización de la relación Cl/Br como trazador hidrogeoquímico en hidrología subterránea. Boletín Geológico y Minero 2000, 111, 49–68. [Google Scholar]
- Cruz-Fuentes, T.; Cabrera, M.C.; Heredia, J.; Custodio, E. Groundwater salinity and hydrochemical processes in the volcano-sedimentary aquifer of La Aldea, Gran Canaria, Canary Islands, Spain. Sci. Total Environ. 2014, 484, 154–166. [Google Scholar] [CrossRef] [PubMed]
- Carracedo, J.C.; Rodríguez Badiola, E.; Guillou, H.; Paterne, M.; Scaillet, S.; Pérez Torrado, F.J.; Paris, R.; Fra-Paleo, U.; Hansen, A. Eruptive and structural history of Teide Volcano and rift zones of Tenerife, Canary Islands. Geol. Soc. Am. 2007, 119, 1027–1051. [Google Scholar] [CrossRef]
- Garcia Herrera, R.; Gallego, D.; Hernández, E. Influence of the North Atlantic Oscillation on the Canary Islands Precipitation. J. Clim. 2001, 14, 3889–3904. [Google Scholar] [CrossRef]
- Bustos, J.J.; Delgado, F.S. Climatología del Parque Nacional de Las Cañadas del Teide; Sección de Estudios y Desarrollo del C.M.T.; de Canarias Occidental, Instituto Nacional de Meteorología: Canarias, Spain, 2000. [Google Scholar]
- Water Planning of Tenerife Island (PHI). DECRETO 319/1996,de 23 de diciembre; Boletín Oficial de Canarias: Canarias, Spain, 1977. [Google Scholar]
- Fernández, E.; Tejedor, M.L.; Hernández, J. Andosoles Canarios (VII). An. Edafol. Agrobiol. 1975, 24, 359–369. [Google Scholar]
- Fernández, E.; Tejedor, M.L.; Hernández, J. Andosoles Canarios (IX). An. Edafol. Agrobiol. 1975, 24, 383–394. [Google Scholar]
- Farrujia, I.; Braojos, J.J.; Fernández, J.D. Evolución cuantitativa del sistema acuífero de Tenerife. In Proceedings of the III Congreso de Ingeniería Civil, Territorio y Medio Ambiente, Zaragoza, Spain, 25–27 October 2006; p. 12.
- Márquez, A.; López, I.; Herrera, R.; Martín-González, F.; Izquierdo, T.; Carreño, F. Spreading and potential instability of Teide volcano, Tenerife, Canary Islands. Geophys. Res. Lett. 2008, 35, 1–5. [Google Scholar] [CrossRef]
- Villasante-Marcos, V.; Finizola, A.; Abella, R.; Barde-Cabusson, S.; Blanco, M.J.; Brenes, B.; Cabrera, V.; Casas, B.; de Agustín, P.; Di Gangi, F.; et al. Hydrothermal system of Central Tenerife Volcanic Complex, Canary Islands (Spain), inferred from self-potential measurements. J. Volcanol. Geotherm. Res. 2014, 272, 59–77. [Google Scholar] [CrossRef]
- Marrero, R. Modelo Hidrogeoquímico del Acuífero de Las Cañadas del Teide (Tenerife, Islas Canarias). Doctoral Thesis, Universidad Politécnica de Cataluña, Barcelona, Spain, 2010. [Google Scholar]
- Navarro, J.M.; Coello, J. Depressions originated by landslide processes in Tenerife. In Proceedings of the ESF Meeting on Canarian Volcanism, Lanzarote, Spain, 30 November–3 December 1989; pp. 150–152.
- Ablay, G.J.; Hürlimann, M. Evolution of the north flank of Tenerife by recurrent giant landslides. J. Volcanol. Geotherm. Res. 2000, 103, 135–169. [Google Scholar] [CrossRef]
- Custodio, E. Groundwater in volcanic hard rocks. In Groundwater in Fractured Rocks; Krásný, J., Sharp, J.M., Jr., Eds.; Selected Papers (Prague Conference), No. 9; IAH-AIH, Taylor & Francis: London, UK, 2007; pp. 95–108. [Google Scholar]
- Ingebritsen, S.E.; Scholl, M.A. The Hydrogeology of Kilauea volcano. Geothermics 1993, 22, 255–270. [Google Scholar] [CrossRef]
- Cabrera, M.C.; Custodio, E. Groundwater flow in a volcanic–sedimentary coastal aquifer: Telde area, Gran Canaria, Canary Islands, Spain. Hydrogeol. J. 2004, 12, 305–320. [Google Scholar] [CrossRef]
- Pérez, N.M.; Sturchio, N.C.; Williams, S.N.; Carracedo, J.C.; Coello, J. Geochemical characteristics of the volcanic-hydrothermal gases in Teide, Timanfaya, Taburiente, and Teneguía volcanoes, Canary Islands, Spain. In Proceedings of the III Congreso Geológico España and VIII Congreso Latinoamericano de Geologia, Salamanca, Spain, 12–16 January 1992; pp. 463–467.
- Soler, V.; Castro-Almazán, J.A.; Viñas, R.T.; Eff-Darwich, A.; Sánchez-Moral, S.; Hillaire-Marcel, C.; Farrujia, I.; Coello, J. High CO2 levels in boreholes at El Teide Volcano Complex (Tenerife, Canary Islands): Implications for volcanic activity monitoring. Pure Appl. Geophys. 2004, 161, 1519–1532. [Google Scholar] [CrossRef]
- Melián, G.V.; Tassi, F.; Pérez, N.M.; Hernández, P.; Sortino, F.; Vaselli, O.; Padrón, E.; Nolasco, D.; Barrancos, J.; Padilla, G.; et al. A magmatic source for fumaroles and diffuse degassing from the summit crater of Teide Volcano (Tenerife, Canary Islands): A geochemical evidence for the 2004–2005 seismic–volcanic crisis. Bull. Volcanol. 2012, 74, 1465–1483. [Google Scholar] [CrossRef]
- Albert-Beltran, J.F.; Araña, V.; Diez, J.L.; Valentin, A. Physical-chemical conditions of the Teide volcanic system (Tenerife, Canary Islands). J. Volcanol. Geotherm. Res. 1990, 43, 321–332. [Google Scholar] [CrossRef]
- Valentin, A.; Albert-Beltrán, J.F.; Diez, J.L. Geochemical and geothermal constraints on magma bodies associated with historic activity, Tenerife (Canary Islands). J. Volcanol. Geotherm. Res. 1990, 44, 251–264. [Google Scholar] [CrossRef]
- Marrero, R.; López, D.L.; Hernández, P.A.; Pérez, N.M. Carbon dioxide discharged through the Las Cañadas Aquifer, Tenerife, Canary Islands. Pure Appl. Geophys. 2008, 165, 147–172. [Google Scholar] [CrossRef]
- Farrujia, I.; Braojos, J.J.; Fernández, J. Ejecución de dos sondeos profundos en Las Cañadas del Teide. In Proceedings of the VII Simposio de Hidrogeología, Murcia, Spain, 28 May–1 June 2001; pp. 661–672.
- Healy, R.W.; Cook, P.G. Using groundwater levels to estimate recharge. Hydrogeol. J. 2002, 10, 91–109. [Google Scholar] [CrossRef]
- Hagedorn, B.; El-Kadi, A.I.; Mair, A.; Whittier, R.B.; Ha, K. Estimating recharge in fractured aquifers of a temperate humid to semiarid volcanic island (Jeju, Korea) from water table fluctuations, and Cl, CFC-12 and 3H chemistry. J. Hydrol. 2011, 409, 650–662. [Google Scholar] [CrossRef]
- Mair, A.; Hagedorn, B.; Tillery, S.; El-Kadi, A.I.; Westenbroek, S.M.; Ha, K.; Koh, G.-W. Temporal and spatial variability of groundwater recharge on Jeju Island, Korea. J. Hydrol. 2013, 501, 213–226. [Google Scholar] [CrossRef]
- Lerner, D.N.; Issar, A.S.; Simmers, I. Groundwater Recharge: A Guide to Understanding and Estimating Natural Recharge; IAH International Contributions to Hydrogeology: Heise, Hannover, 1990; p. 345. [Google Scholar]
- Alcalá, F.J.; Custodio, E. Spatial average aquifer recharge through atmospheric chloride mass balance and its uncertainty in continental Spain. Hydrol. Process. 2014, 28, 218–236. [Google Scholar] [CrossRef]
- Erickson, D.J.; Merrill, J.T.; Duce, R.A. Seasonal estimates of global atmospheric sea-salt distributions. J. Geophys. Res. 1986, 91, 1067–1072. [Google Scholar] [CrossRef]
- Edmunds, W.M.; Shand, M.P. Natural Groundwater Quality; Blackwell Publishing, Ltd.: Oxford, UK, 2009; p. 469. [Google Scholar]
- Somaratne, N. Pitfalls in application of the conventional chloride mass balance (CMB) method in karst aquifers and use of the generalized CMB method. Environ. Earth Sci. 2015, 2015. [Google Scholar] [CrossRef]
- Subyani, A.; Sen, Z. Refined chloride mass balance method and its application in Saudi Arabia. Hydrol. Process. 2006, 20, 4373–4380. [Google Scholar] [CrossRef]
- Custodio, E.; Hoppe, J.; Hoyos-Limón, A. Aportaciones al conocimiento hidrogeológico de Tenerife utilizando isótopos ambientales. In Simp. Canar. Agua 2000; Puerto de la Cruz: Tenerife, Spain, 1987; p. 25. [Google Scholar]
- Skupien, E.; Poncela, A. Trabajos realizados para la caracterización isotópica de las aguas subterráneas de Tenerife en el ámbito del proyecto AQUAMAC II para cumplimiento de la Directiva Marco de Aguas. In Proceedings of the Las aguas subterráneas en la Directiva Marco de Aguas, Santa Cruz de Tenerife, Spain, 26–27 September 2007; p. 14.
- Allen, R.G.; Pereira, L.S.; Raes, D.; Smith, M. Crop evapotranspiration: Guidelines for computing crop water requirements. In Irrigation and Drainage; Paper 56 UN-FAO: Rome, Italy, 1998; p. 465. [Google Scholar]
- Navarro, J.M. Geología e Hidrogeología del Parque Nacional del Teide; Ministerio de Agricultura, Pesca y Alimentación, Subdirección General de Espacios Naturales, Parque Nacional del Teide: Tenerife, Spain, 1995; p. 103. [Google Scholar]
- Braojos, J.J. Definición de la recarga a través del balance hídrico en las Islas Canarias occidentales. Modelación. In Proceedings of the La Evaluación de la Recarga a los Acuíferos en la Planificación Hidrológica, Las Palmas de Gran Canaria, Spain, 20–24, January 1997; Custodio, E., Llamas, M.R., Samper, J., Eds.; pp. 267–277.
- Somaratne, N.; Smettem, K.; Frizenschaf, J. Three criteria reliability analyses for groundwater recharge estimations. Environ. Earth Sci. 2014, 72, 2141–2151. [Google Scholar] [CrossRef]
- Cartwright, I.; Weaver, T.R.; Fulton, S.; Nichol, C.; Reid, M.; Cheng, X. Hydrogeochemical and isotopic constraints on the origins of dryland salinity, Murray Basin, Victoria, Australia. Appl. Geochem. 2004, 19, 1233–1254. [Google Scholar] [CrossRef]
- Delmelle, P.; Bernard, A. Geochemistry, mineralogy, and chemical modelling of the acid water lake of Kawah Ijen volcano, Indonesia. Geochim. Cosmochim. Acta 1994, 58, 2445–2460. [Google Scholar] [CrossRef]
- Bureau, H.E.; Métrich, N. An experimental study of bromine behaviour in water-saturated silicic melts. Geochim. Cosmochim. Acta 2003, 67, 1689–1697. [Google Scholar] [CrossRef]
© 2015 by the authors; licensee MDPI, Basel, Switzerland. This article is an open access article distributed under the terms and conditions of the Creative Commons Attribution license (http://creativecommons.org/licenses/by/4.0/).
Share and Cite
Marrero-Diaz, R.; Alcalá, F.J.; Pérez, N.M.; López, D.L.; Melián, G.V.; Padrón, E.; Padilla, G.D. Aquifer Recharge Estimation through Atmospheric Chloride Mass Balance at Las Cañadas Caldera, Tenerife, Canary Islands, Spain. Water 2015, 7, 2451-2471. https://doi.org/10.3390/w7052451
Marrero-Diaz R, Alcalá FJ, Pérez NM, López DL, Melián GV, Padrón E, Padilla GD. Aquifer Recharge Estimation through Atmospheric Chloride Mass Balance at Las Cañadas Caldera, Tenerife, Canary Islands, Spain. Water. 2015; 7(5):2451-2471. https://doi.org/10.3390/w7052451
Chicago/Turabian StyleMarrero-Diaz, Rayco, Francisco J. Alcalá, Nemesio M. Pérez, Dina L. López, Gladys V. Melián, Eleazar Padrón, and Germán D. Padilla. 2015. "Aquifer Recharge Estimation through Atmospheric Chloride Mass Balance at Las Cañadas Caldera, Tenerife, Canary Islands, Spain" Water 7, no. 5: 2451-2471. https://doi.org/10.3390/w7052451
APA StyleMarrero-Diaz, R., Alcalá, F. J., Pérez, N. M., López, D. L., Melián, G. V., Padrón, E., & Padilla, G. D. (2015). Aquifer Recharge Estimation through Atmospheric Chloride Mass Balance at Las Cañadas Caldera, Tenerife, Canary Islands, Spain. Water, 7(5), 2451-2471. https://doi.org/10.3390/w7052451