Article

Spatiotemporal Characteristics of Dry-Wet Abrupt Transition Based on Precipitation in Poyang Lake Basin, China

1
Key Laboratory of Watershed Geographic Sciences, Nanjing Institute of Geography and Limnology, Chinese Academy of Sciences, 73 East Beijing Road, Nanjing 210008, China
2
School of Geographical Sciences, Southwest University, 2 Tiansheng Road, Chongqing 400715, China
*
Author to whom correspondence should be addressed.
Water 2015, 7(5), 1943-1958; https://doi.org/10.3390/w7051943
Submission received: 4 January 2015 / Revised: 26 April 2015 / Accepted: 27 April 2015 / Published: 30 April 2015

Abstract

:
The dry-wet abrupt transition (DWAT) is a typical anomaly of precipitation at the subseasonal scale and may result in a severer and greater hydro-meteorological hazard. This paper identified and examined the DWAT events in terms of precipitation in Poyang Lake basin, including both from dry to wet (DTW) and from wet to dry (WTD), during the period of 1960–2010 and analyzed its characteristics of temporal and spatial distribution and intra- and inter-annual tendencies based on the Mann–Kendall (M–K) test. The results revealed that the DTW was inclined to occur in March, but WTD in July and September; the inter-annual variation of the DWAT index showed a feeble long-term increasing trend in July and a decreasing trend in September with a Z-statistic of 1.81 and −1.44, respectively, although none of these trends achieved the statistical significance level (α = 0.05); the north parts of Poyang Lake basin experienced more DWAT events during the last 50 years in which the occurrence of WTD is more frequent than that of DTW. The outcomes of the study will help mitigate and regulate the flood and drought in Poyang Lake basin, as well as in other regions.

1. Introduction

Flood and drought are the most common natural disasters recorded in the world, which have caused severe economic losses (accounted for 40% and 15% of global losses caused by natural disasters, respectively), with huge damage to the environment and the agricultural economy, and have threatened the life of people [1,2,3,4]. During the last few decades, severe flood or/and drought disasters have occurred frequently the world over. As a consequence of global warming, the resulting hydro-meteorological hazards (i.e., floods and droughts) have become increasingly serious and gained the widespread concern of the international community [5].
In China, floods and droughts are also the most frequently occurring natural disaster, because of the strong influence of the East Asian monsoon [6,7]. Two thirds of the Chinese territory and over half of the total population are affected by a variety of flood or/and drought events almost every year [1,8]. Moreover, global warming has significantly increased the variability of East Asian summer monsoon precipitation [9], which enhanced not only the risks of flood or drought disaster, but also the occurrence frequency of the drought-flood abrupt alternation (DFAA) event [10]. Practically, the DFAA, including both drought-to-flood and flood-to-drought, is a typical anomaly of precipitation at the subseasonal scale and can result in severer and greater damage than a separate flood or drought [10,11]. A DFAA disaster is usual in many regions the world over; especially in the Yangtze River basin and Huai River basin, China, the DFAA has been intensified in recent years due to climate change and speedy urbanization [12,13,14,15]. In particular, the middle and lower reaches of the Yangtze River experienced a rapid, severe DFAA disaster during spring-summer in 2011. Its serious situation of flood and drought disaster and broad stricken areas are rare in recent years and caused huge economic losses and serious damage to towns and farms.
Numerous researchers have so far investigated the changing characteristic of DFAA, as well as the factors affecting it. For example, Wu et al. [10,16] quantified the long period of abrupt transitions over the middle and lower reaches of the Yangtze River, China, during the summer through a DFAA index and investigated its correlation with large-scale atmospheric circulation characteristics. Tang et al. [17] and Zhang et al. [18] discussed the occurrence characteristics of DFAA in the north area of Huai River. Wang et al. [19] discussed the climatic characteristics of these transitions during the principal flood season and described a new criterion of DFAA based on the percentage of rainfall anomaly and further analyzed its spatio-temporal distribution characteristics. In addition, Cheng et al. [13,20] defined the intensity index of DFAA and explored the spatio-temporal distribution and intensity difference of DFAA in the Huai River basin. More recently, Zhang et al. [21] and Luo et al. [15] also emphasized the DFAA in terms of runoff when they dealt with the abnormal changes in water flows.
Usually, severe floods or/and droughts result from abnormal climate change [22], i.e., extreme precipitation and temperature. To further monitor floods and drought occurrence, it is worthwhile to investigate the variation of local dry/wet conditions [23], which has become an important prerequisite of flood/drought disaster prevention and mitigation [4]. There are many researches that have dealt with the spatiotemporal variability and long-term trends of dry and wet condition. For instance, Bordi et al. [24] analyzed the spatiotemporal variability of dry and wet periods during the last 50 years in eastern China and found that the northern part of eastern China had been experiencing dry conditions more frequently since the 1970s. The research by Zhang et al. [25] indicated that the Pearl River basin in South China has become drier during the rainy season and wetter in winter. Moreover, Zhai et al. [26] found that the occurrence frequencies of both dry and wet years for the period of 1961–2005 were lower for the southern region of China than for the northwest. Zhai et al. [26] further noted that an increasing frequency of wet years was detected in the upper and lower reaches of the Yangtze River, China.
On the other hand, the warming global climate has increased concurrent climatic extremes, such as floods, droughts and heat waves [27,28]. The increase in global temperatures substantially increases the probability that multiple extremes will occur simultaneously [29,30,31]. Recent studies have shown that worldwide, there are extensive increases in heavy precipitation and decreases in light and moderate rain due to global warming [32,33,34,35,36,37]. Increased temperature and decreased precipitation may contribute to significant changes in drought, and this has been confirmed by many researchers using modeling results and observations [36,37,38]. Trenberth et al. [39] believe that in a warming environment, both the increase in heavy precipitation events, as well as the decrease in light rain events can be expected. Based on global climate models, Gregory et al. [40] found that in a warmer climate, droughts may become longer lasting and more severe in drought-prone regions, because of enhanced evaporation. Beniston [41] assessed the changes in the exceedances of joint extremes of precipitation and temperature quantiles in Europe and found that the combination of cool/dry, cool/wet, warm/dry and warm/wet modes revealed a systematic change in the course of the 20th century, with significant declines in the frequency of occurrence of the cold modes and a sharp rise in that of the warm modes. Hao et al. [28] also investigated the joint occurrences of precipitation and temperature extremes in CRU (Climate Research Unit) and UD (University of Delaware) observations, as well as in CMIP5 (Coupled Model Intercomparison Project Phase 5) global climate simulations. He noted that the CRU and UD observations showed substantial increases in the occurrence of joint warm/dry and warm/wet combinations for the period 1978–2004 relative to 1951–1977. Diffenbaugh et al. [42] and AghaKouchak et al. [43] also argued that the global warming and the associated rise in extreme temperatures is increasing the probability of co-occurring warm-dry conditions in California.
However, Poyang Lake basin, an important national rice-producing base in the middle and lower reaches of the Yangtze River, China, has received far less attention with respect to DFAA disasters. The Poyang Lake area has suffered from frequent floods and droughts in the last few decades, which have caused huge damage to the environment and the agricultural economy [44,45]. Moreover, it has recently been shown that the frequency and severity of the floods and droughts in Poyang Lake basin have increased since 1990 [46], and this change could be attributable to the increased fluctuation of warm season rainfall [47]. Therefore, the objectives of the study are designed to: (1) identify and examine the dry-wet abrupt transitions (DWAT) in terms of precipitation in Poyang Lake basin, both from dry to wet (DTW) and from wet to dry (WTD), during the period of 1960–2010; and (2) explore the intra-annual distribution characteristics and tendencies of DWAT, as well as their spatial distribution pattern in Poyang Lake basin. By doing so, the index of DWAT for precipitation is calculated at the monthly scale, and the inter-annual variation trends are investigated based on the Mann–Kendall (M–K) test. The study is expected to serve as a useful reference and valuable information for flood and drought mitigation and regulation in Poyang Lake basin, as well as in other regions.

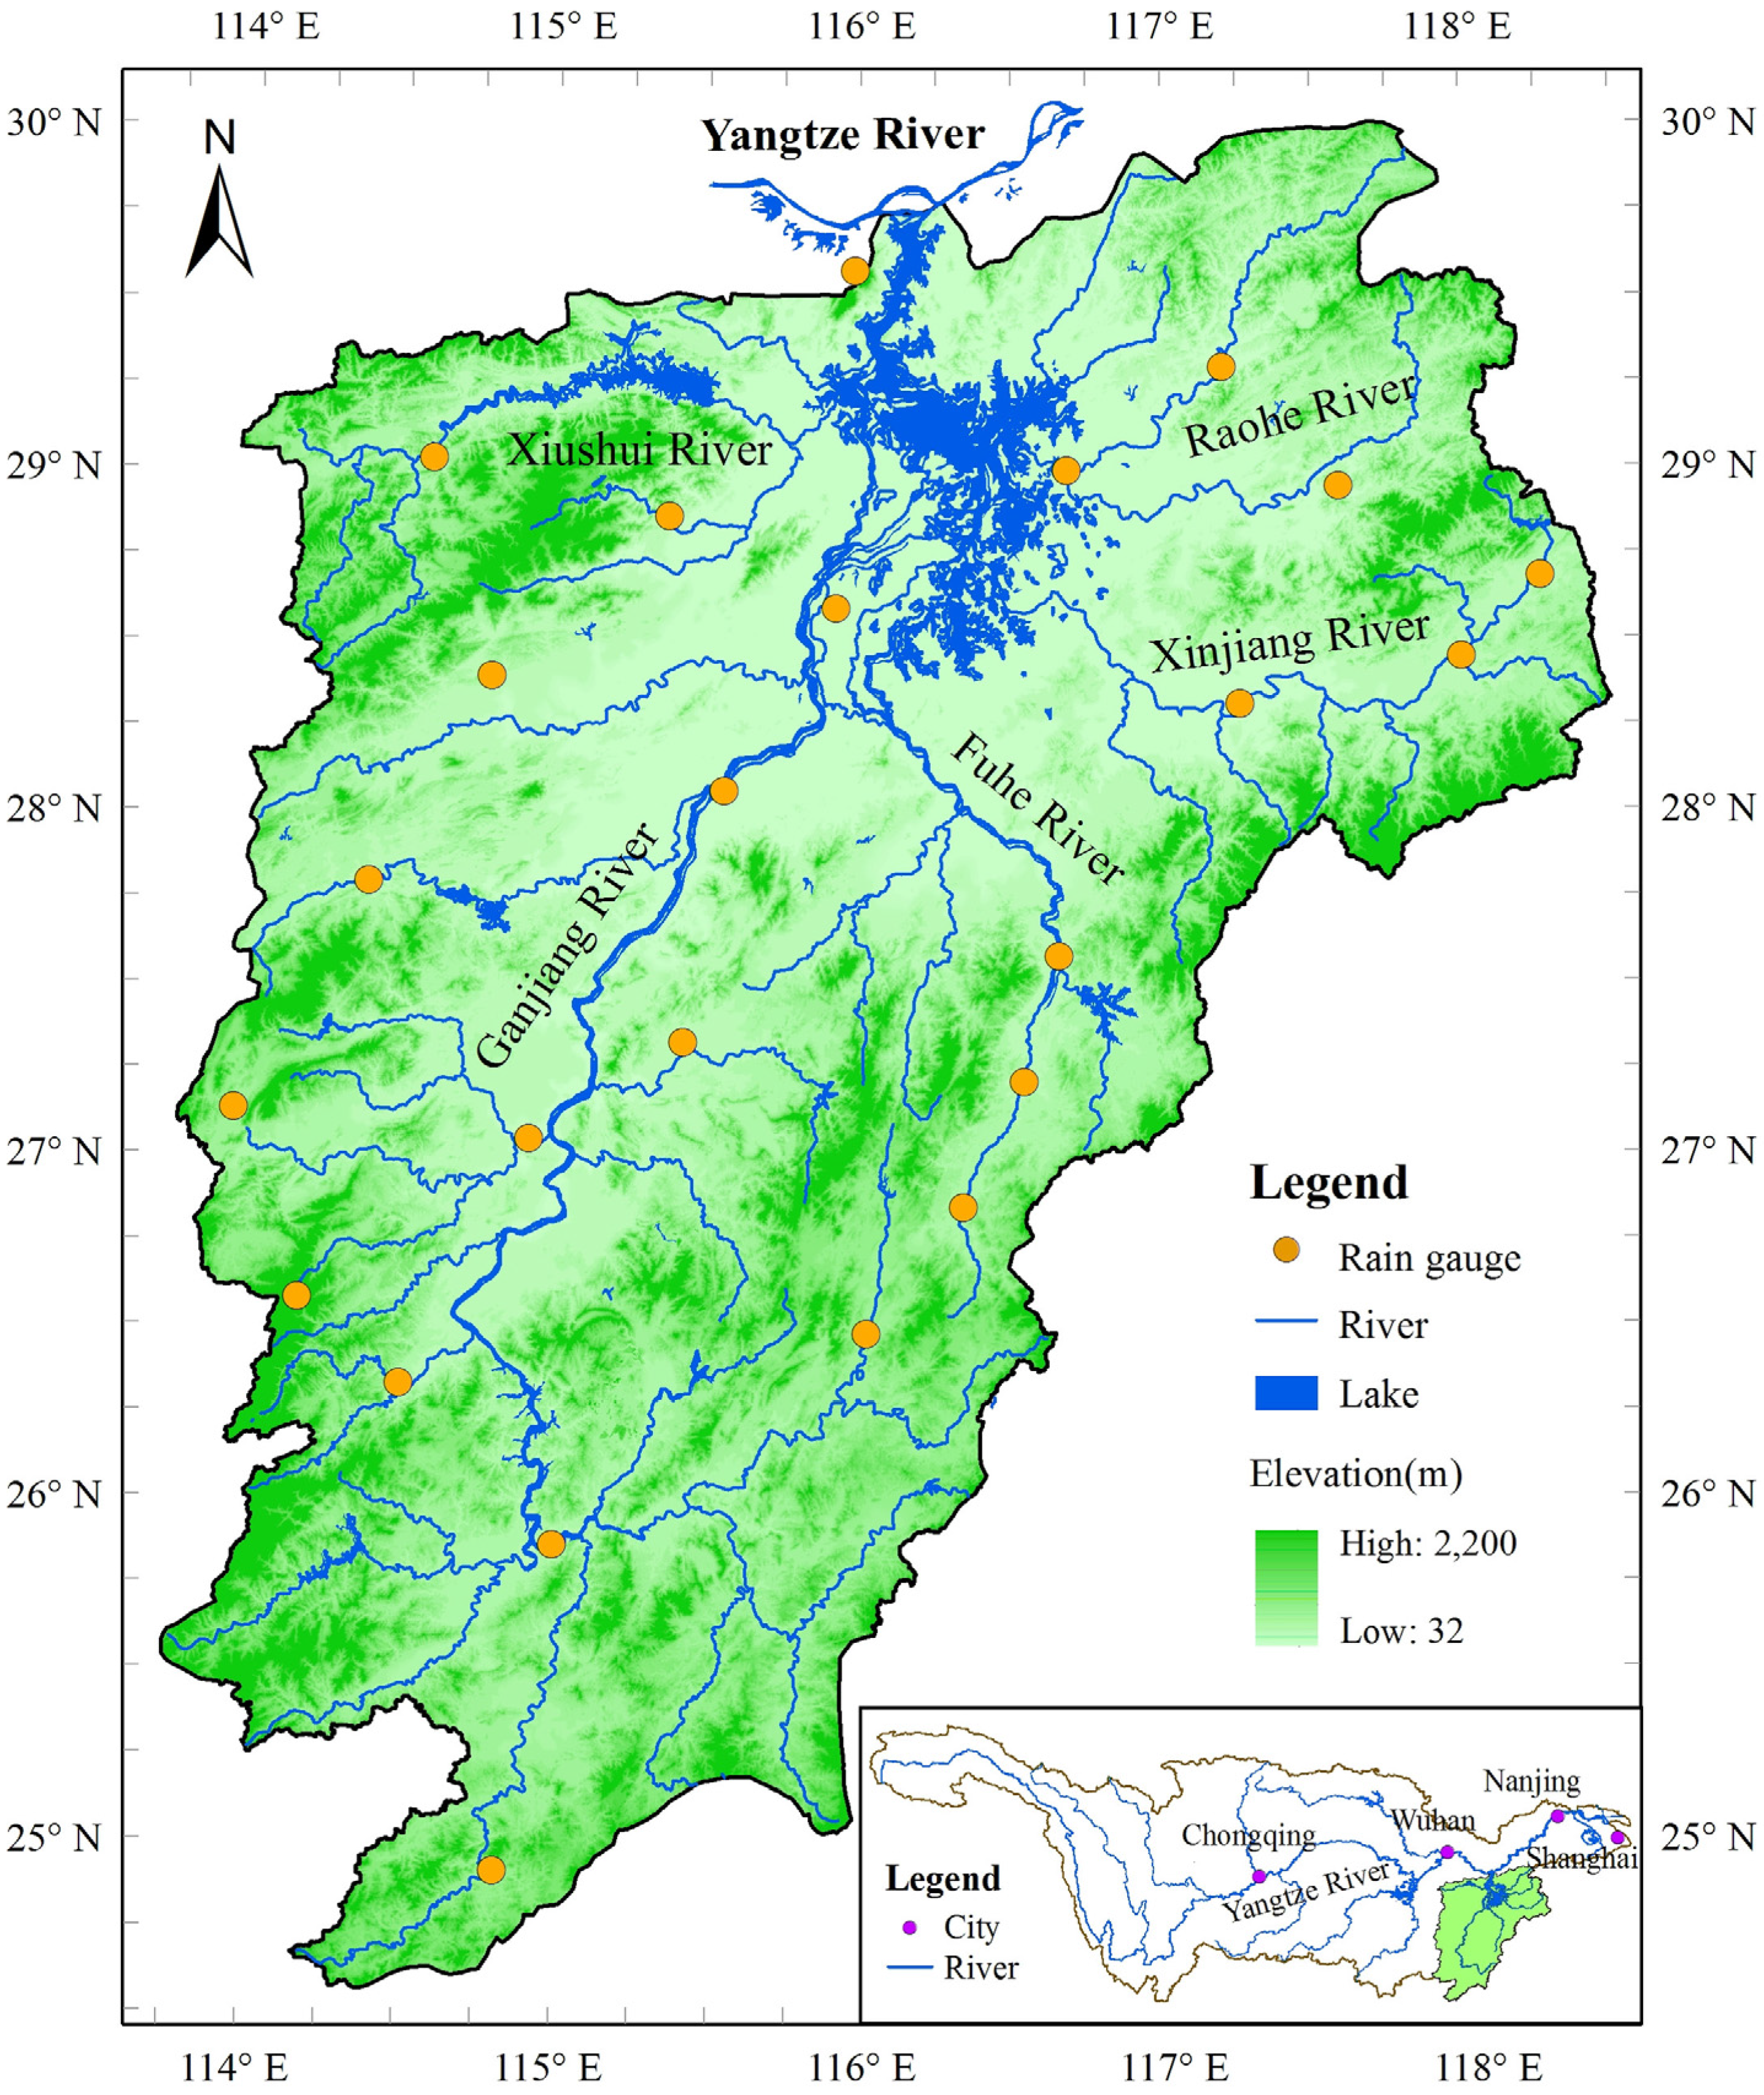
2. Study Area and Data

Poyang Lake is located in the middle and lower reaches of the Yangtze River, China (28°22'–29°45' N and 115°47'–116°45' E), which connects with the Yangtze River and receives water flows from the five rivers in Poyang Lake basin: Xiushui River, Ganjiang River, Fuhe River, Xinjiang River and Raohe River (Figure 1). Among them, the Ganjiang is the largest river in the region, extending 750 km, and contributes almost 55% of the total discharge into Poyang Lake. The headwaters of these rivers are located in the boundaries of the east, south and west of the Jiangxi Province that is surrounded by high mountains. The total drainage area of the water systems is 16.22 × 10⁴ km2, accounting for 9% of the drainage area of the Yangtze River basin. Land use in the catchment consists of forest (46%), shrub land (25%), crop land (25%) and small areas of pasture, urban centers and open water [48]. The topography in the catchment varies from highly mountainous and hilly areas (with a maximum elevation of 2,200 m above mean sea level) to alluvial plains in the lower reaches of the primary watercourses. The stream gradient decreases as these rivers flow onto the relatively flat region surrounding Poyang Lake [49].
Figure 1. Location of the study area and the distribution of stations.
Water 07 01943 g001
Poyang Lake basin has a subtropical wet climate dominated by the East Asia Monsoon. The mean annual precipitation is 1,630 mm for the period of 1960–2010, of which 55% occurs in March–June. Temperatures are highly seasonal, with June–August having an average of 27.3 °C and December–February 7.1 °C, with an annual average of 17.6 °C. Annual precipitation shows a wet season and a dry season and a short transition period in between. Precipitation increases quickly from January–June and decreases sharply in July, and after September, the dry season sets in and lasts through December, as Figure 2 shows.
Daily rain gauge data, during the period of 1960–2010 for 24 meteorological stations in the Poyang Lake basin are collected from the National Meteorological Information Center of China. The locations of these stations are shown in Figure 1. These data are used in the study to measure and examine the variation of precipitation and the characteristics of DWAT in the basin. Moreover, these data have been widely used for different studies previously [46,47,48,49,50], and the qualities have been proven to be reliable. In the study, the daily precipitation data from all of the stations are averaged to obtain the areal daily precipitation for the Poyang Lake basin, and the monthly rainfall is aggregated from the daily values.
Figure 2. Variation of monthly precipitation in different decades.
Water 07 01943 g002

3. Methods

To conveniently reflect the variation of rainfall and to explore the characteristics of the DWAT phenomenon in Poyang Lake basin, the normalization transition is needed for the original rain gauge data firstly. The normalization is done as follows:
N P i = P i P ¯ σ
where NPi are the normalized monthly precipitations; Pi are the monthly rain gauge data; P ¯ and σ are the mean and standard error of Pi, respectively; and i is the count of the months.
The DWAT phenomenon is described quantitatively in the study using a DWAT index, which is defined according to the studies by Wu et al. [11,17] and Zhang et al. [22] as follows:
D W A T I = ( N P i N P i 1 ) ( | N P i | + | N P i 1 | ) α | N P i + N P i 1 |   ( i = 2 ,   3 ,   4 ,   ,   n )
where DWATI is the index of the DWAT phenomenon; NPi and NPi−1 are the normalized monthly precipitation in the i month and the i − 1 month, respectively; α is a weight coefficient, and a value of 3.2 is suitable for the monthly scale according to the study by Zhang et al. [22]; and n is the total months.
Wu et al. [11,17] considered that the item (NPiNPi−1) represents the intensity term of DWAT, the item (|NPi| + |NPi−1|) denotes the magnitude of the dry and wet and α | N P i + N P i 1 | is the weight coefficient, which may decrease the weight of wet or dry in two consecutive months and increase the weight of DWAT events. Meanwhile, the absolute magnitude of those precipitation anomalies within 0.5 standard deviations is regarded as normal, while the anomalies over 0.5 standard deviations and under −0.5 standard deviations are defined as wet and dry, respectively. Furthermore, a positive DWATI value indicates that a DTW has occurred in that period, while a negative DWATI value shows the occurrence of WTD, and the larger absolute value means a stronger intensity of DTW or WTD. Numerous research works have shown that the DWATI is a vigorous index to describe the DWAT phenomenon quantitatively. Wu et al. [11,17] examined the validation of DWATI to represent the characteristics of the summer rainfall and found that the summers with high DWATI have more precipitation in July–August than in May–June, whereas the summers with low DWATI have more precipitation in May–June than in July–August. Wu et al. [11,17] and Zhang et al. [22] further noted that most anomalies of precipitation in May–June of high DWATI summers were under −1.0σ (anomalous droughts), but in July–August were over 1.0σ, whereas the situations for the low DWATI summers were just opposite. Moreover, Sun et al. [13] and Luo et al. [16] also used the DWATI with the different weight coefficient (α) value to investigate the DWAT in terms of runoff when they dealt with the abnormal changes in water flows. Similar results were also reached for which the DTW usually occurred in the high DWATI summers, and low DWATI summers were often related to the WTD. According to the above application, the DWATI might be regarded as a powerful quantitative index describing the summer DWAT events.
The M–K test [51,52] is also applied in this study to identify the inter-annual variation trends of DWAT events. The M–K test is a rank-based non-parametric method due to its robustness against the influence of abnormal data and especially its reliability for biased variables, and it has been widely applied for trend detecting in hydro-climatic time series (e.g., [49,53,54,55,56]).
To detect the existence of any step change points in the hydrological data Xt = (x1, x2, x3, ···, xn), the accumulative number ni of samples for which xi > xj (1 ≤ ji) should be first calculated [48,49]. The normally distributed statistic dk can be calculated as follows:
d k = i = 1 k n i   ( 2     k     n )
Under the null hypothesis of no trend, dk is asymptotically normally distributed with expected mean value E (dk) and variance Var (dk) as follows:
E ( d k ) = k ( k 1 ) 4
V a r ( d k ) = k ( k 1 ) ( 2 k + 5 ) 72
Under the above assumption, the normalized variable statistic Uf (dk) is calculated as:
U f ( d k ) = d k E ( d k ) V a r ( d k )   ( k = 1 ,   2 ,   3 ,   ,   n )
where Uf (dk) is the forward sequence, and the backward sequence UB (dk) is calculated using the same equation, but with a reversed series of data. When the null hypothesis is rejected (i.e., if any of the points in the forward sequence are outside the confidence interval), the detection of an increasing (Uf (dk) > 0) or a decreasing (Uf (dk) < 0) trend is indicated.
In addition, to examine the long-term trend of the time series data, the standardized statistics (Z) for the one-tailed test is formulated as:
Z = { ( S 1 ) / V a r ( S ) 0 ( S + 1 ) / V a r ( S ) ( S > 0 ) ( S = 0 ) ( S < 0 )
where:
S = i = 1 n 1 j = i + 1 n sgn ( x j x i )
where xi and xj are the sequential data values and n is the length of the dataset; sgn(xjxi) is a piecewise function, as:
sgn ( x j x i ) = { 1 0 1 ( x j > x i ) ( x j = x i ) ( x j < x i )
The null hypothesis of no trend is rejected if |Z| > 1.96 at the 0.05 significance level. A positive value of Z denotes an increasing trend, and a negative value corresponds to a decreasing trend. Because the presence of serial correlation can influence the identification of trends [57,58], it is necessary to do autocorrelation (serial correlation) analysis before the trend test.

4. Results and Discussion

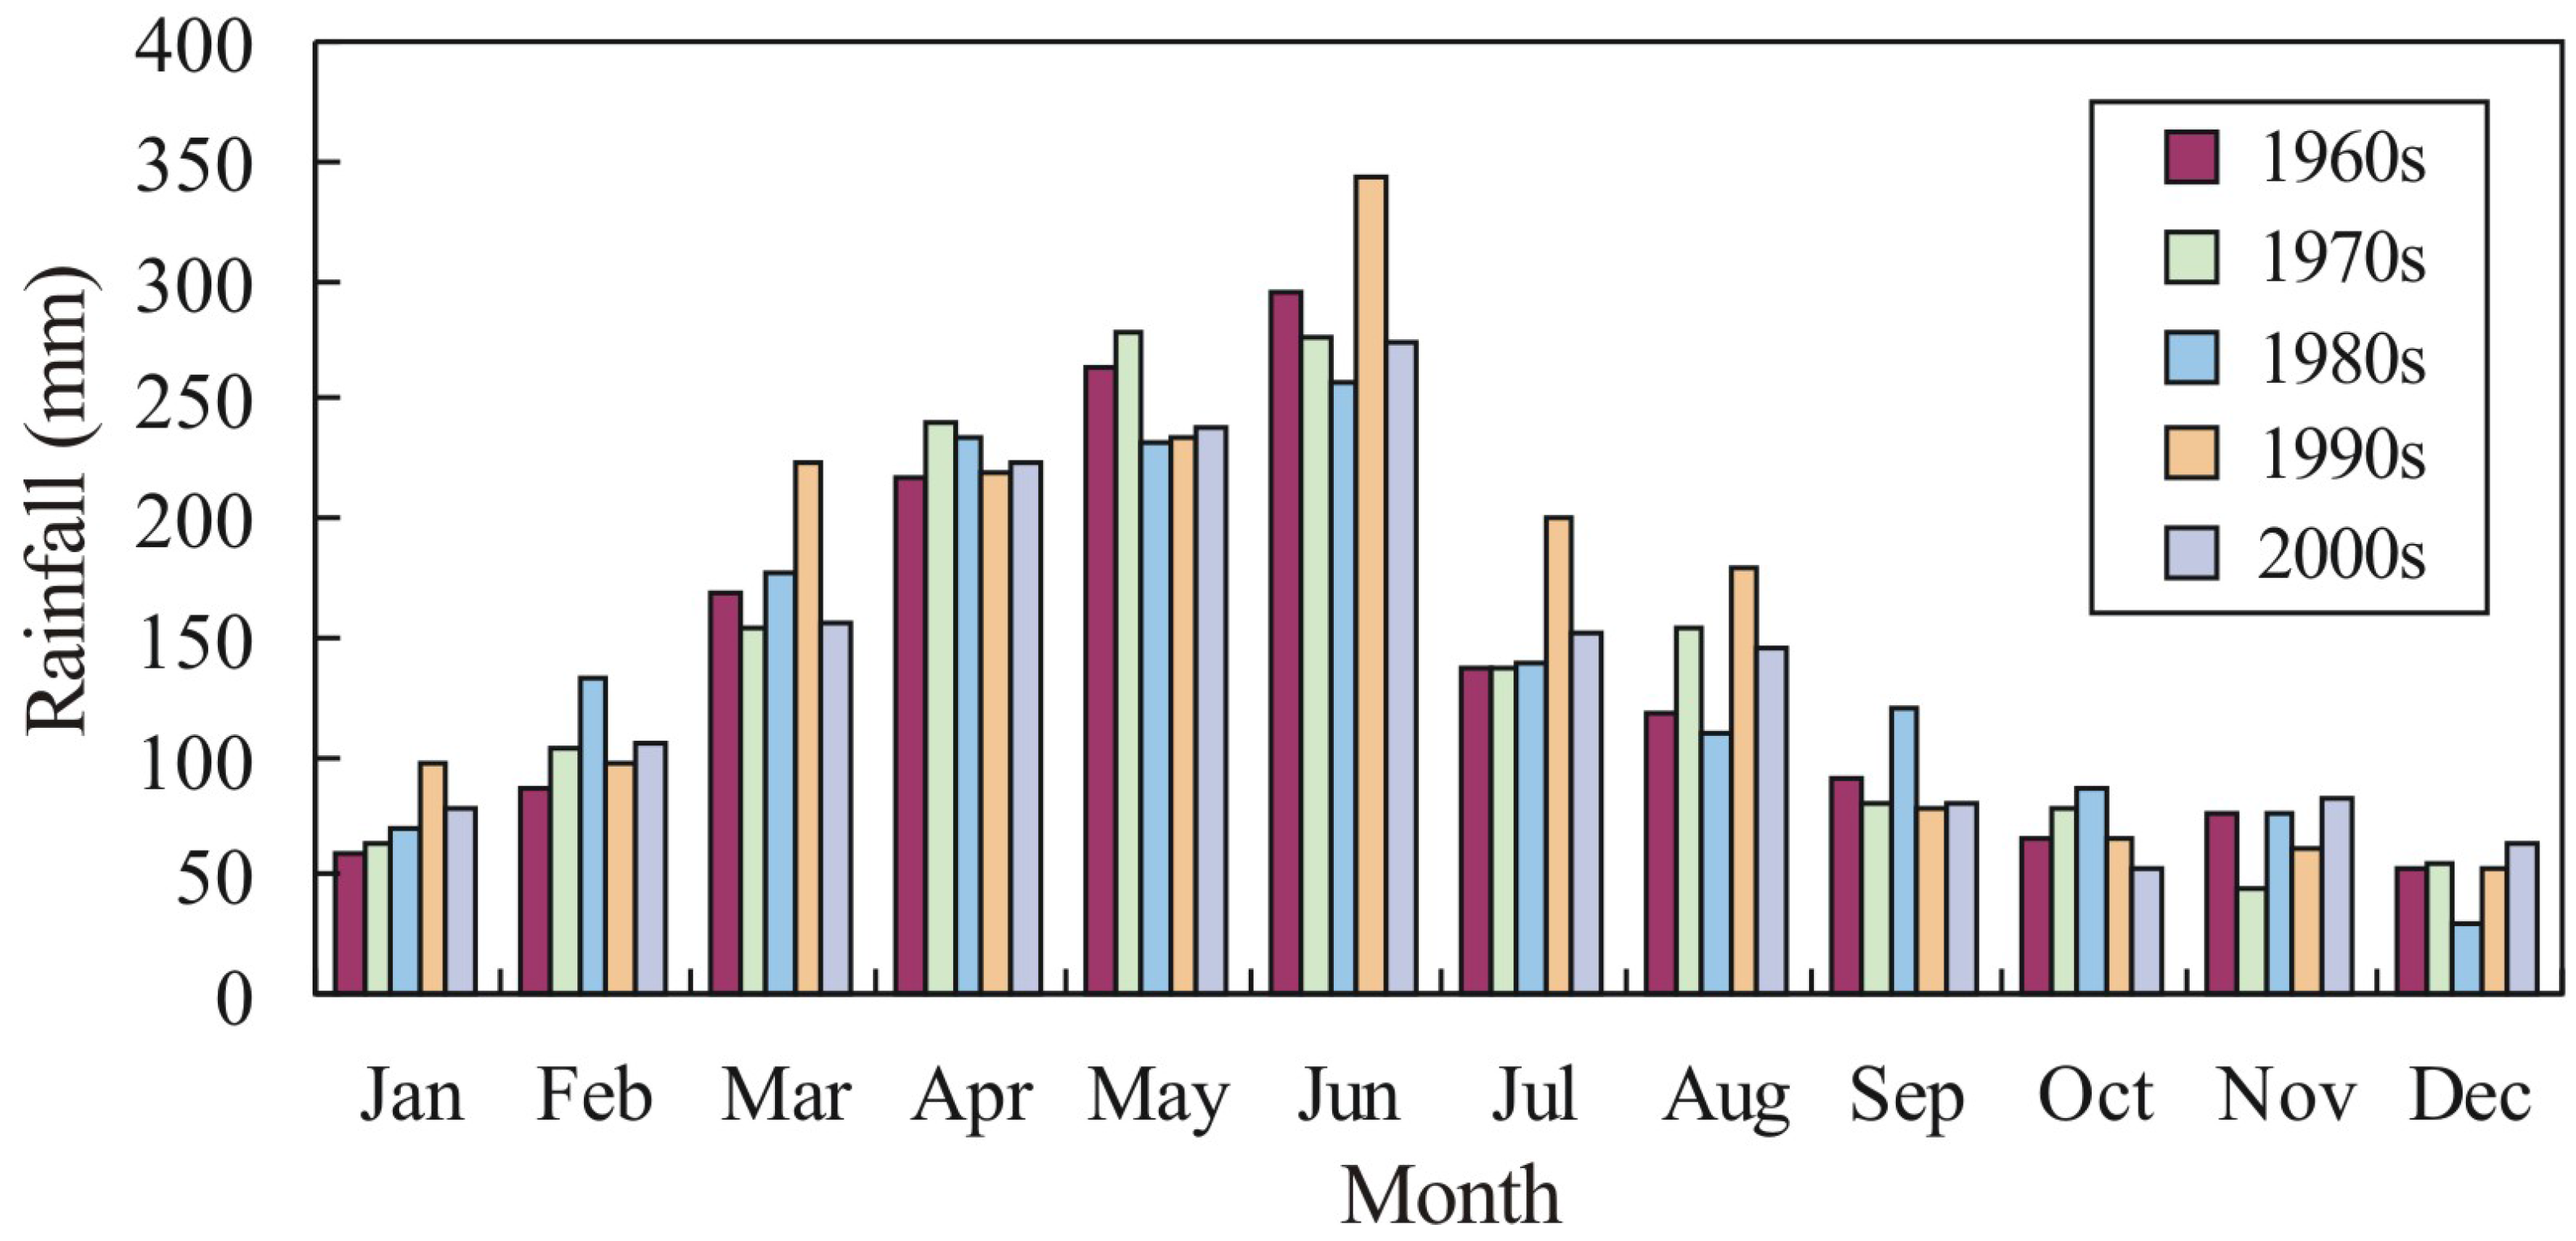
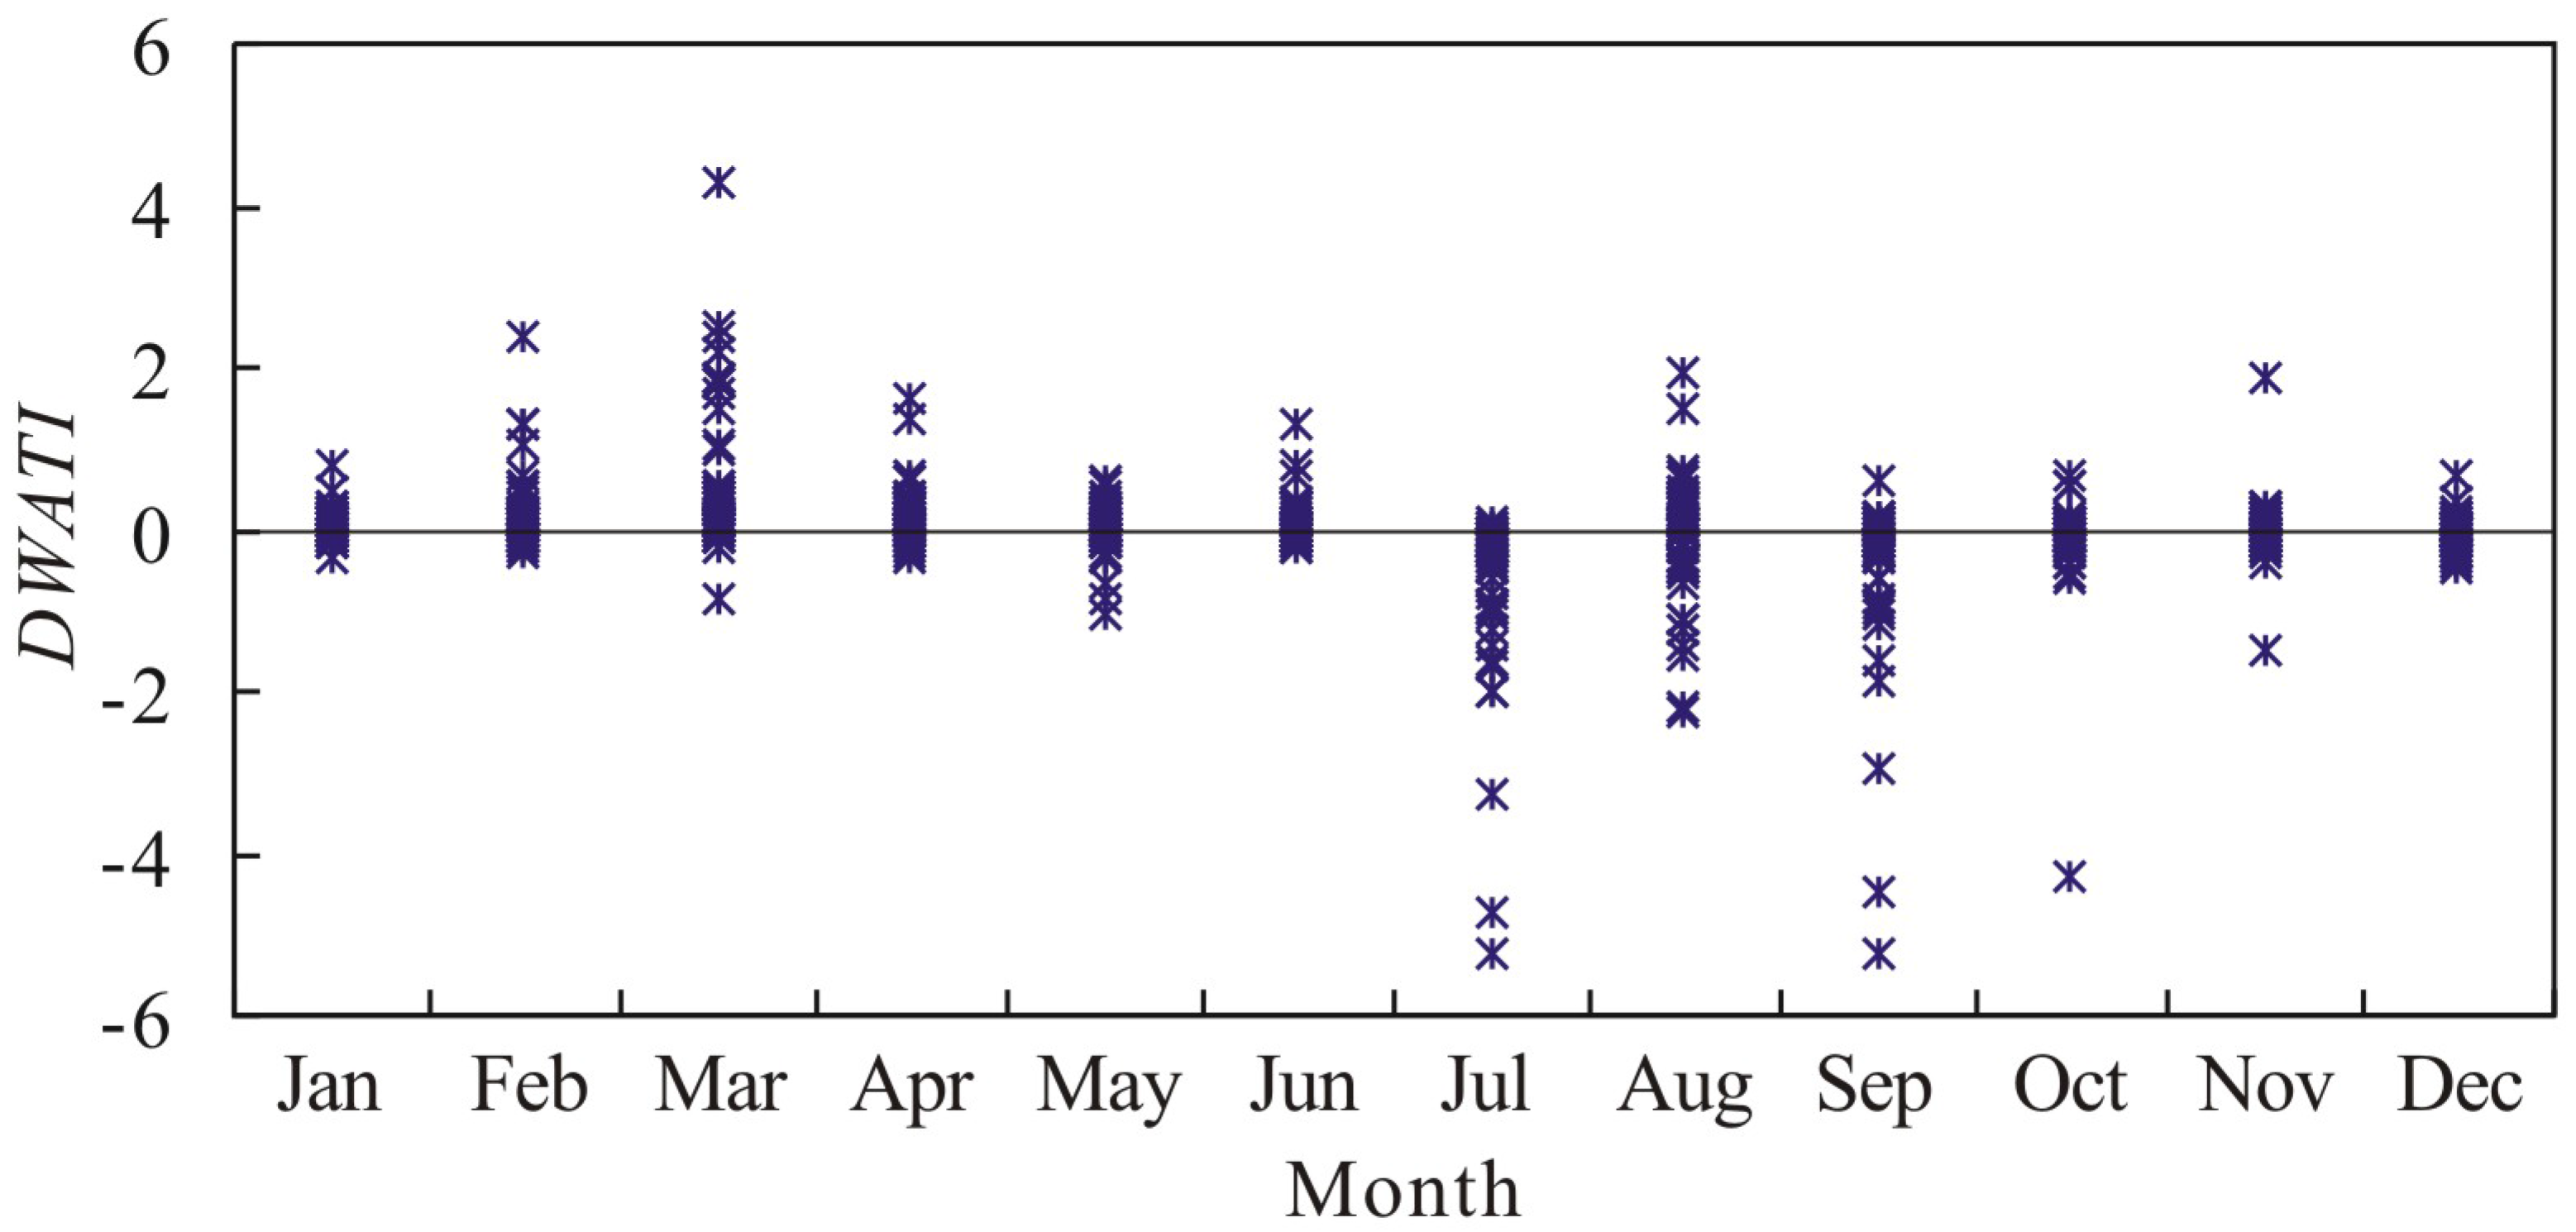
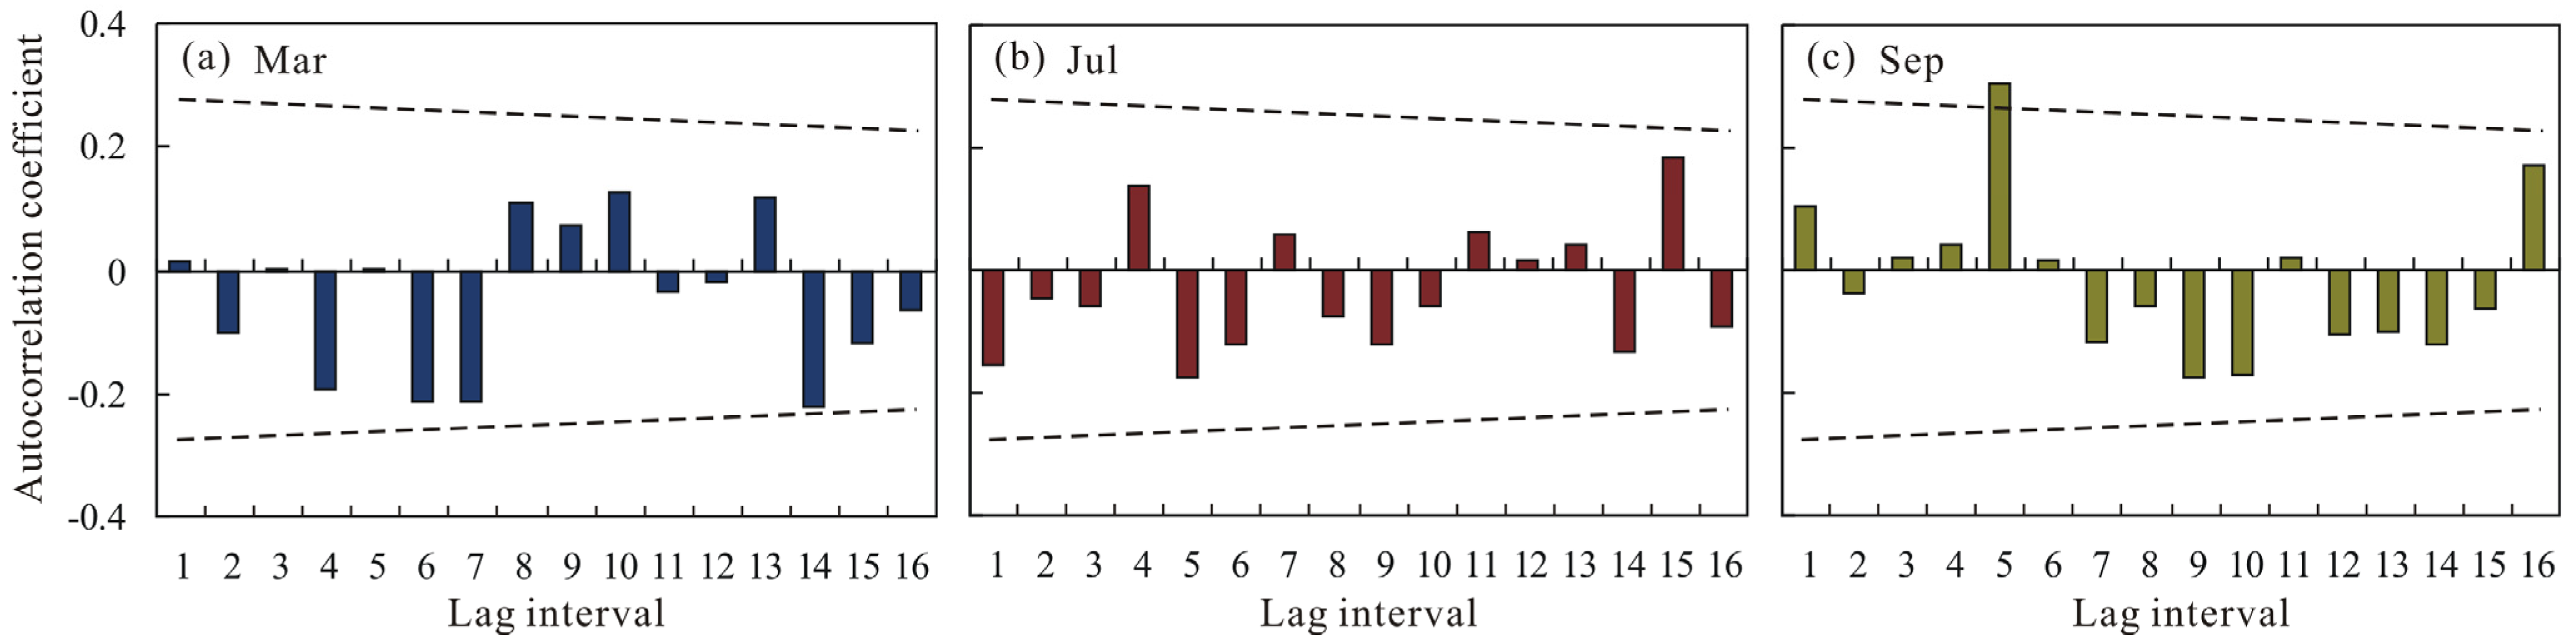
4.1. Intra-Annual Distribution of DWAT in Poyang Lake Basin
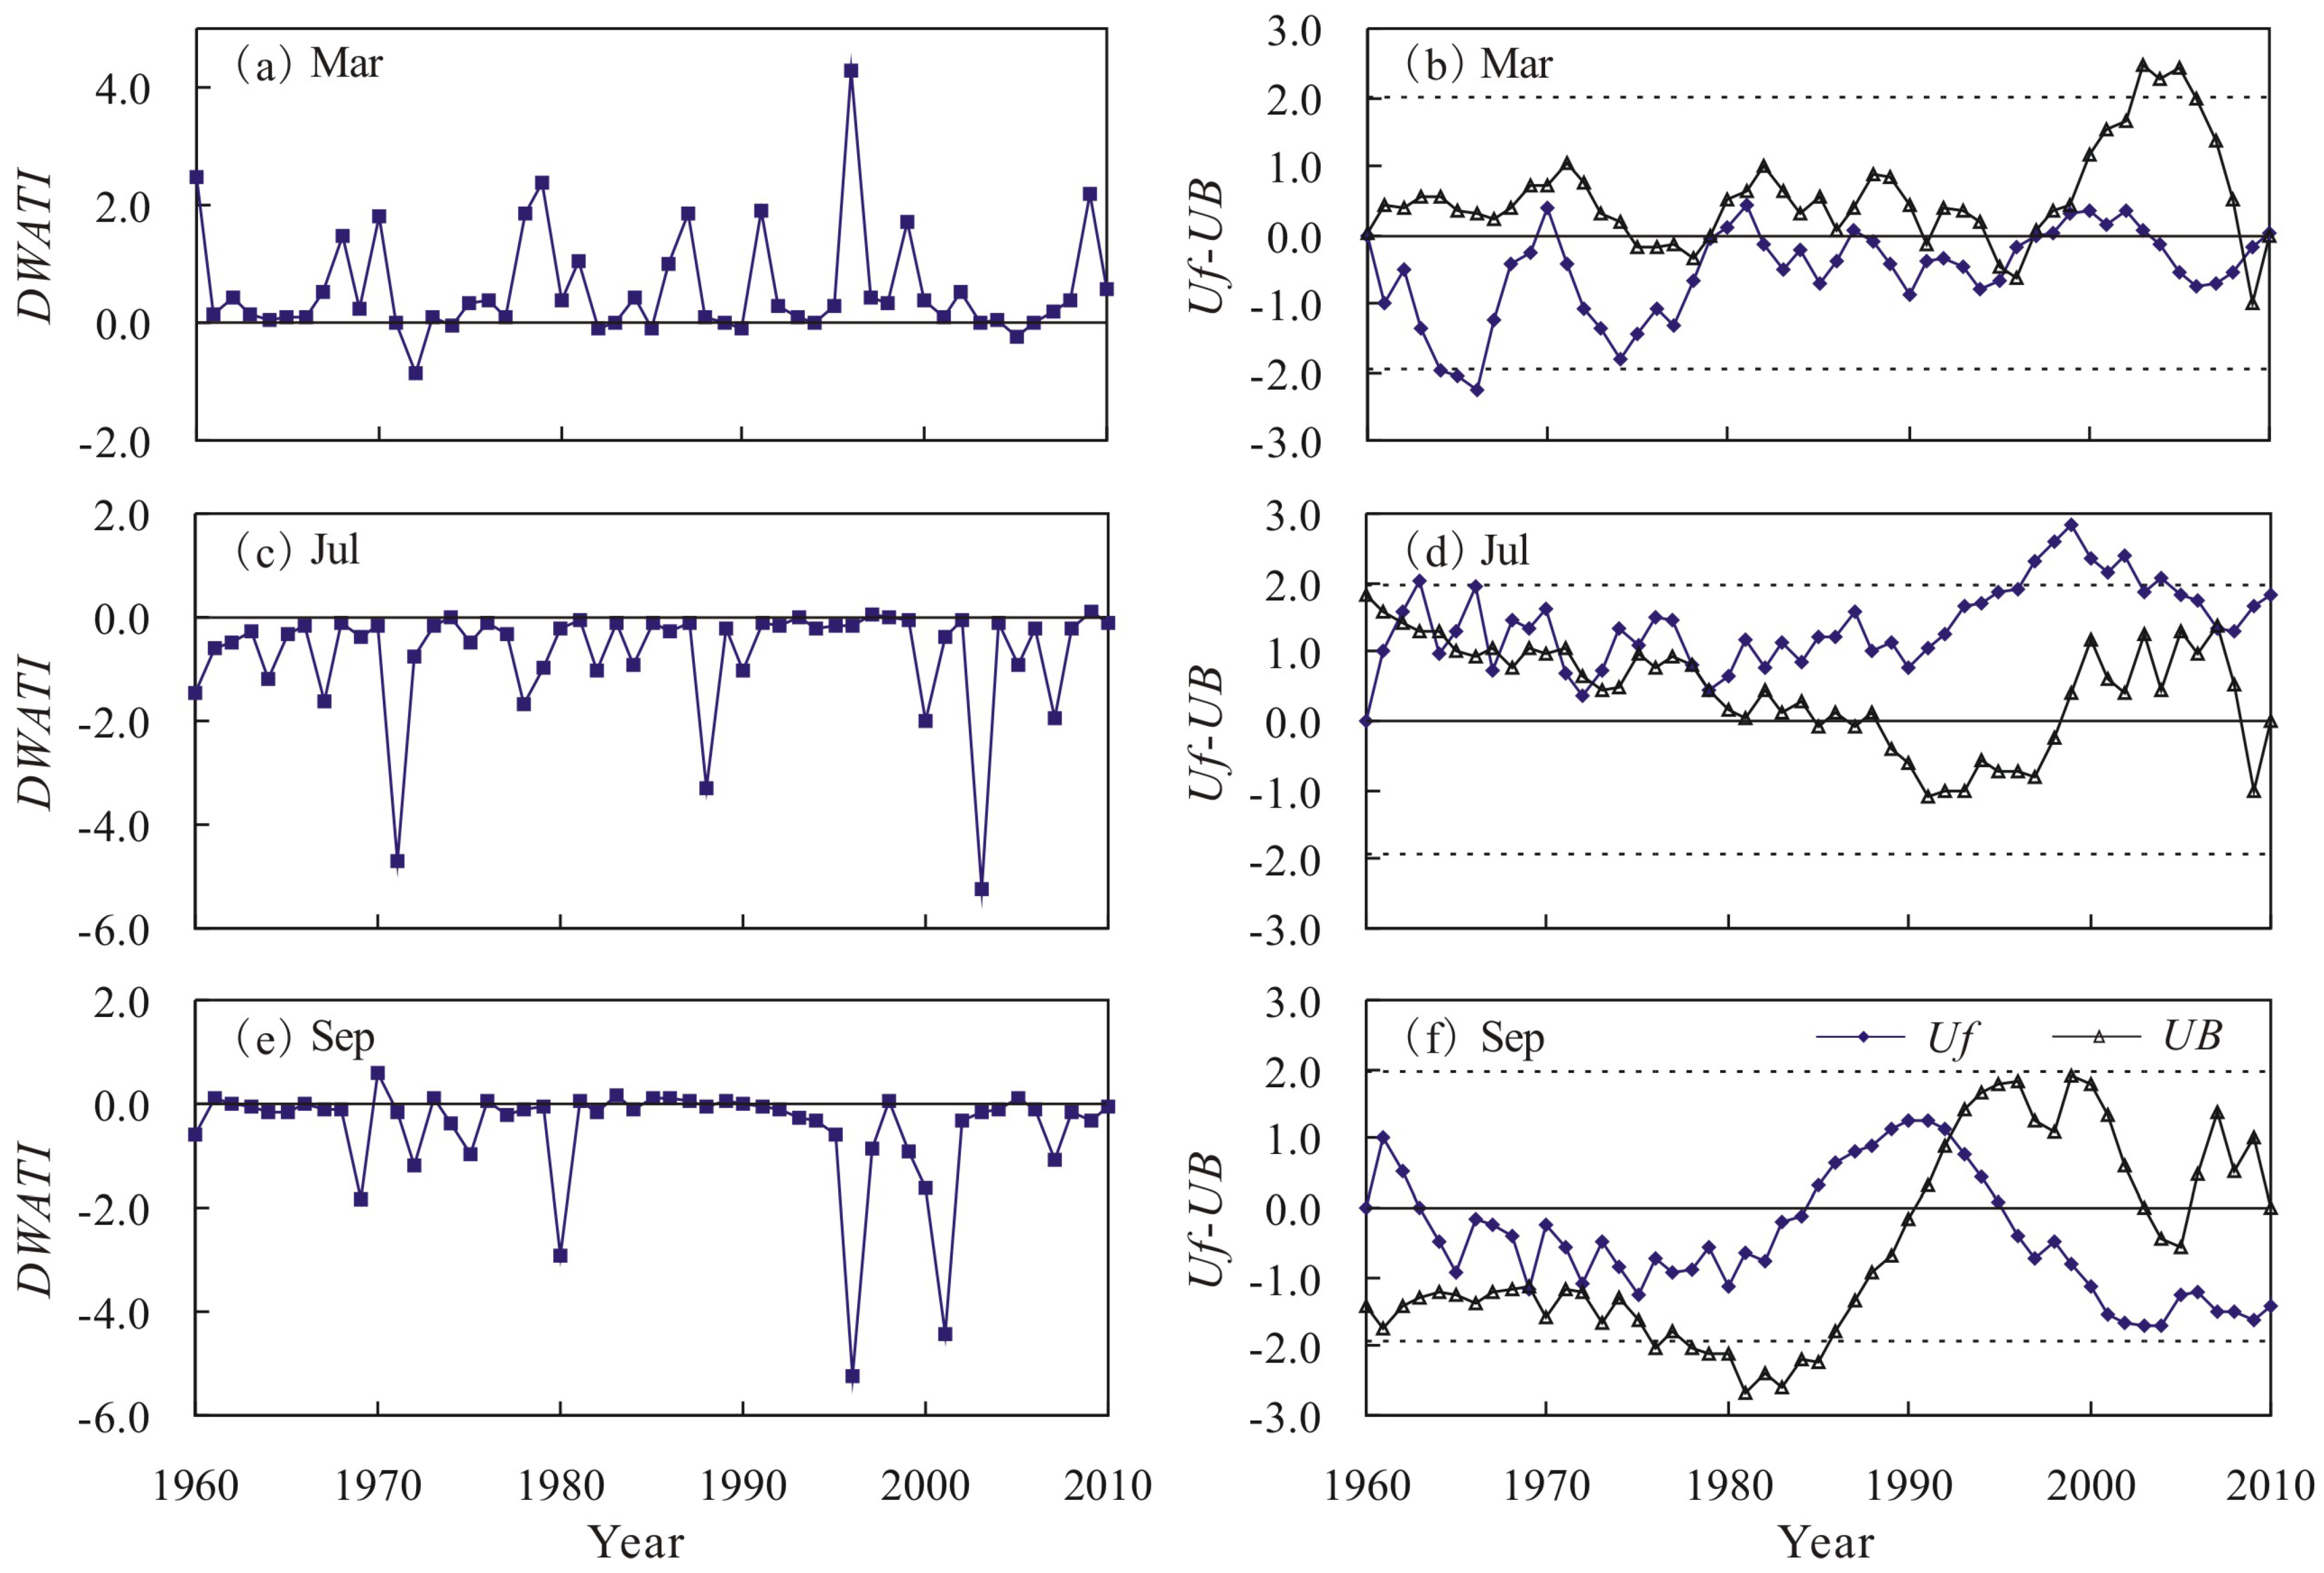
The monthly DWATI based on the areal averaged precipitation during the period of 1960–2010 is calculated, and the results are shown in Figure 3. It can be seen that the DWATI oscillates around zero during the study period. In order to verify the validity of DWATI to describe the characteristics of the DWAT phenomenon in Poyang Lake basin, the status of precipitation in the corresponding month is also examined for the chosen five highest and lowest DWATI, as Table 1 shows. It is seen that the chosen high DWATI have more precipitation in the current month, with the normalized precipitation of over 0.7, even 1.0 in some months, which shows that they all appear as the anomalous wet event, while the low precipitation, observed in the previous month, ranging from −1.07 to −0.73, indicates that the anomalous dry event has occurred. Therefore, the large DWATI correctly reflect the occurrence of DTW. On the contrary, all chosen low DWATI reflect the opposite situation that the precipitations in the current month are under −1.0σ, but over 1.0σ in the previous month (Table 1). Therefore, the low DWATI are often related to the WTD. The above analysis from Table 1 shows that the DWATI might be regarded as a vigorous index describing the DWAT phenomenon in Poyang Lake basin.
Figure 3. Variation of monthly DWATI (dry-wet abrupt transition index) during 1960–2010.
Water 07 01943 g003
Table 1. Comparison of normalized precipitation for the chosen five highest and lowest DWATI in the current month and previous month.
TypeDateDWATIPrecipitation in Current MonthPrecipitation in Previous Month
High DWATIMar. 19964.281.04−1.04
Mar. 19602.490.79−1.07
Feb.19852.380.77−1.05
Mar. 19792.360.88−0.76
Mar. 20092.170.77−0.73
Low DWATISep. 1996−5.25−1.151.20
Jul. 2003−5.23−1.151.19
Jul. 1971−4.71−1.121.09
Sep. 2001−4.45−1.281.08
Oct. 1961−4.29−1.231.06
Subsequently, the DWATI is used for statistical analysis of the intra-annual distribution of the DWAT phenomenon. In descriptive statistics, a scatter plot is a convenient way of graphically depicting groups of numerical data through their distribution. Therefore, in this study, the scatter plot is used to present the distribution characteristics of DWATI in different months, and the results are shown in Figure 4. It is seen that the positive DWATI are mainly presented in the first half of the year, especially in March; both the frequency of high DWATI and the absolute values are larger than that in other months. In contrast, it is also clear that the negative DWATI are principally shown in the second half of the year, and especially, the lowest DWATI appear in July and September. Accordingly, Figure 4 demonstrates that the DTW is inclined to occur in March, while the WTD occurs in July and September in Poyang Lake basin.
Figure 4. Scatter plot of DWATI in different months during 1960–2010.
Water 07 01943 g004

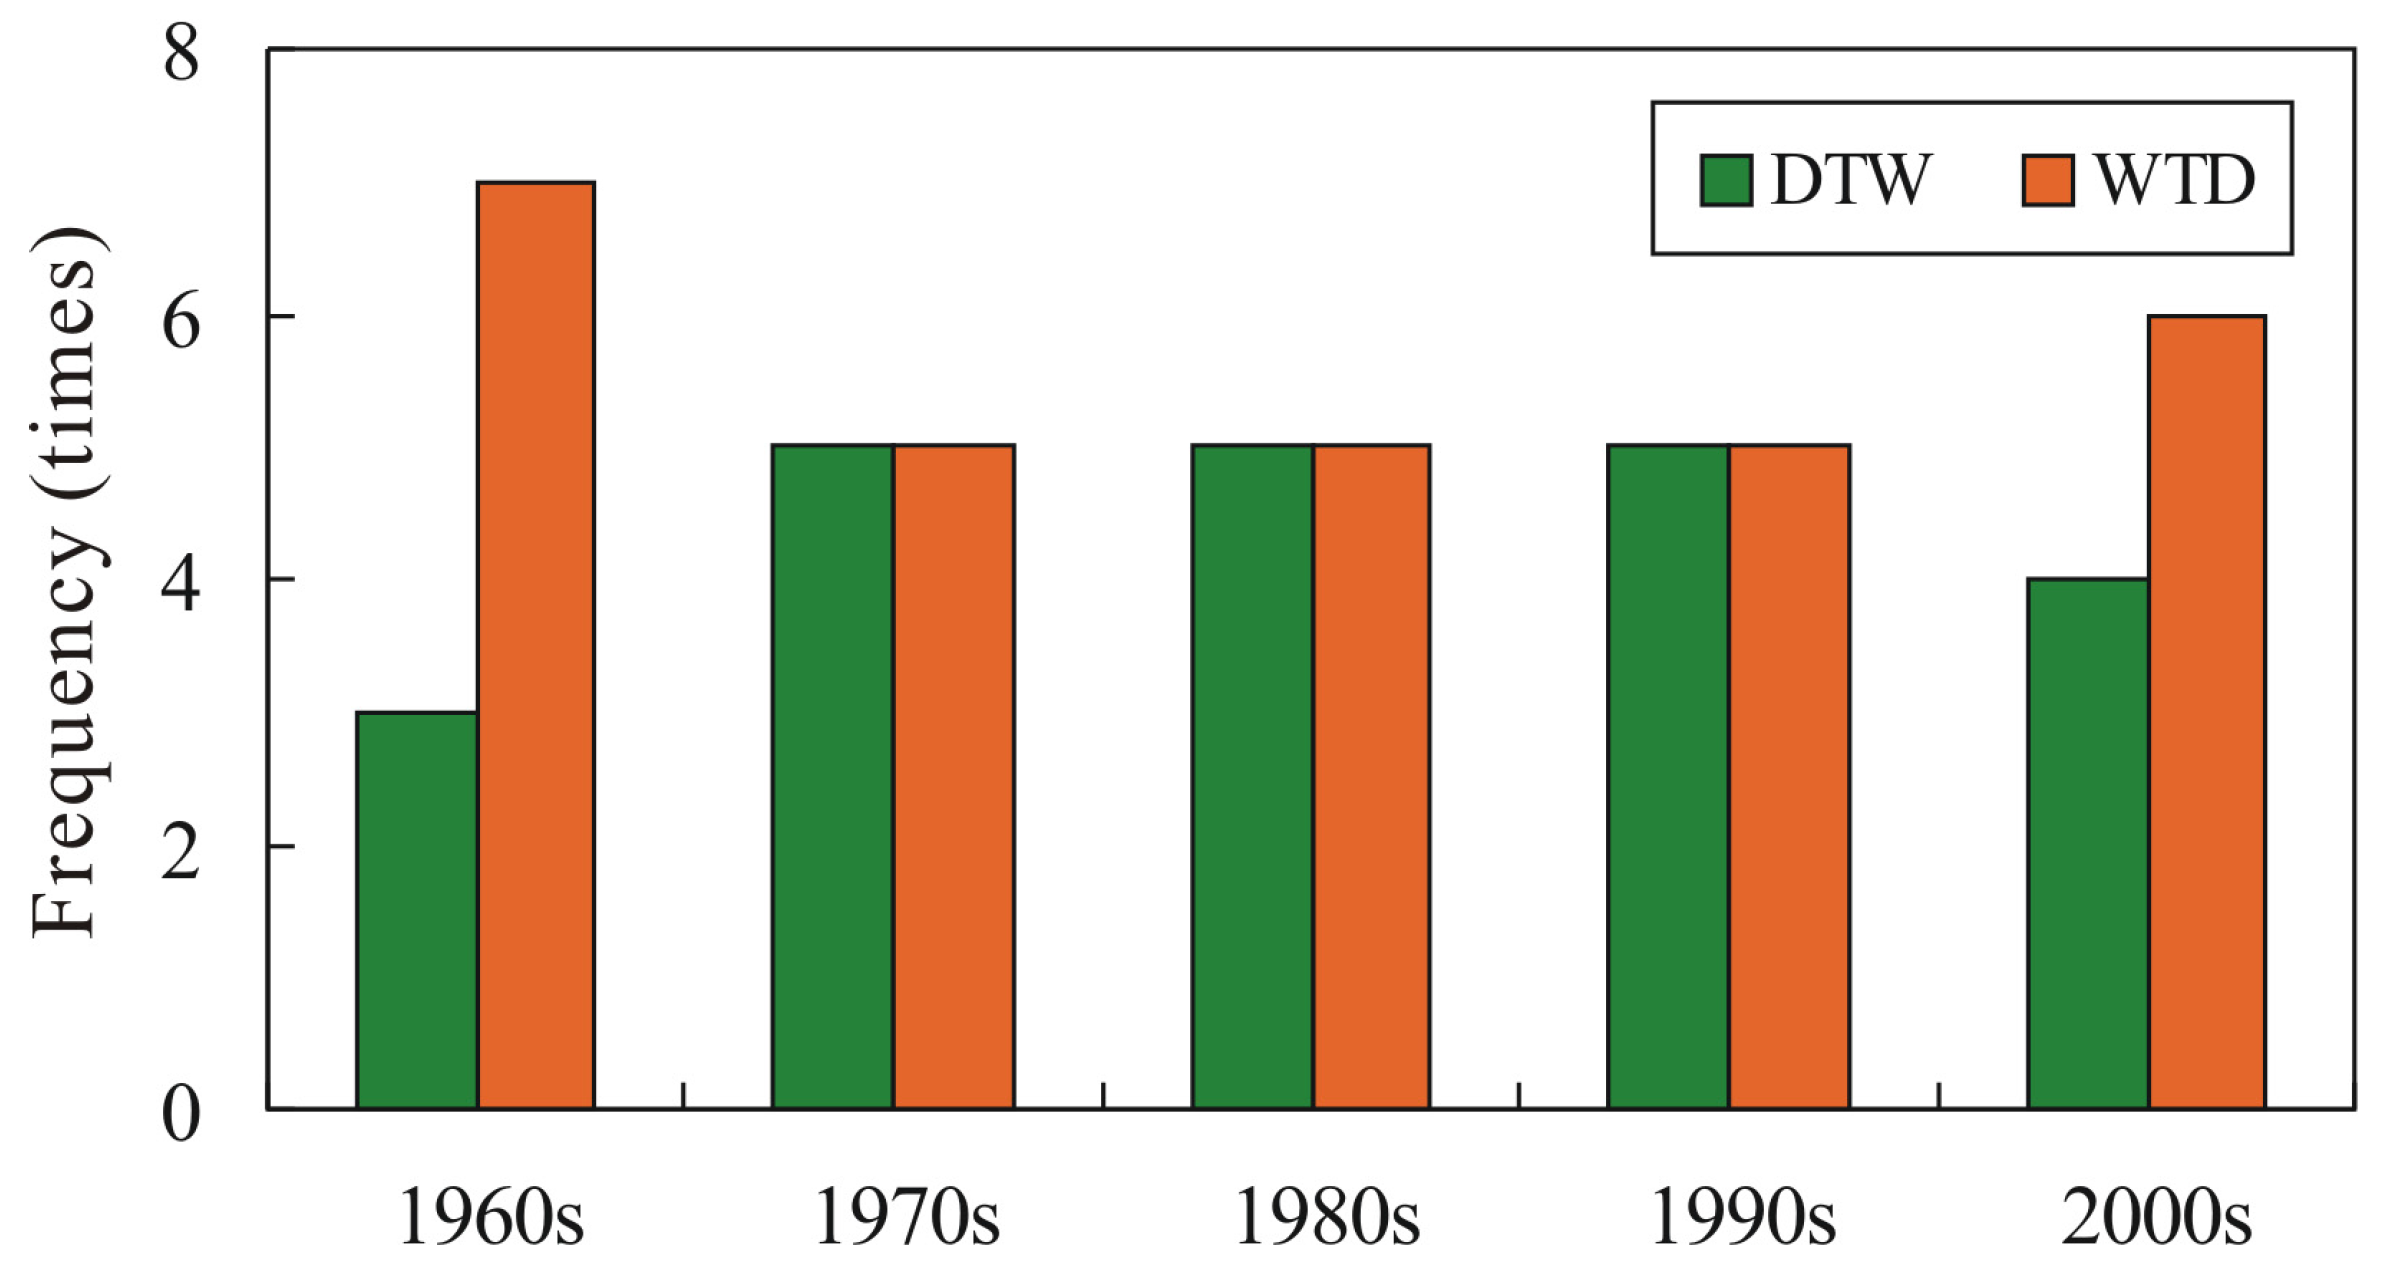
4.2. Inter-Annual Variation Characteristics of DWAT in Poyang Lake Basin

As mentioned above, the DWAT events in Poyang Lake basin mainly occur in March, July and September; thereby, the DWATI in these months during 1960–2010 are selected for the long-term trends analysis using M–K test. Firstly, the independence of these selected time series data is tested, which is the underlying assumption of the M–K test. Figure 5 shows the variation of autocorrelation coefficient of DWATI with different lag intervals in March, July and September, respectively. It is obvious that the autocorrelation coefficients are very small and do not have statistically significance in March, July and September, regardless of the lag interval. Figure 5 indicates that the selected time series data are independent and appropriate for the M–K test.
Figure 5. Autocorrelation coefficient of DWATI with different lag intervals in March (a); July (b) and September (c) (the dashed lines represent the confidence intervals at the 0.05 significance level).
Water 07 01943 g005
In Figure 6, the inter-annual variation of DWATI in March, July and September, as well as their corresponding M-K sequential tests during 1960–2010 are shown. As explained in the Methods Section, the Uf curve shows the changing trend of DWATI. The time series has a downward trend if Uf < 0 and an increasing trend if Uf > 0. If the Uf values are greater than the critical values (the two dashed lines above and below zero), then this upward or downward trend is significant at the 95% significance level. It is seen from Figure 6 that the DWATI in March oscillates principally between 0 and 2.0 during the study period, and there is no clear trend with Uf fluctuating between the two critical value lines. Although the DWATI show a long-term upward trend with the Z-statistic of 1.81 for July and a downward trend with the Z-statistic of −1.44 for September, no statistically significant trend (α = 0.05) was detected in July and September (Figure 6). Figure 6 indicates that both the DTW and WTD in Poyang Lake basin had no long-term increasing or decreasing trend at the 0.05 significance level.
Figure 6. Inter-annual variation of DWATI in March (a), July (c) and September (e) and their corresponding M–K trend tests (b,d,f,) (the horizontal dashed lines in (b,d,f,) represent the critical value of the 0.05 significance level).
Water 07 01943 g006
The variation characteristics of DWATI in Poyang Lake basin are also analyzed at the decadal scale to provide insight into the decadal variability of the DWAT phenomenon. Figure 7 shows the inter-decadal variation of the occurrence frequency of the severe DWAT events (DWATI > 1.0 or < −1.0) during the period of 1960–2010. It is seen that the DWAT events, both the DTW and WTD, are occurring with small differences in the different decades; even the number of DWATs remains changeless during long periods (i.e., 1970s, 1980s and 1990s). In addition, the frequency of DTW per 10 years is not higher than that of WTD; especially in the 1960s and 2000s, the number of WTD is four-times and two-times more than the former, respectively. This conclusion indicates that the Poyang Lake basin is more likely to experience an anomalous dry following an anomalous wet event immediately.
Figure 7. Inter-decadal variation of DWAT events in Poyang Lake basin.
Water 07 01943 g007

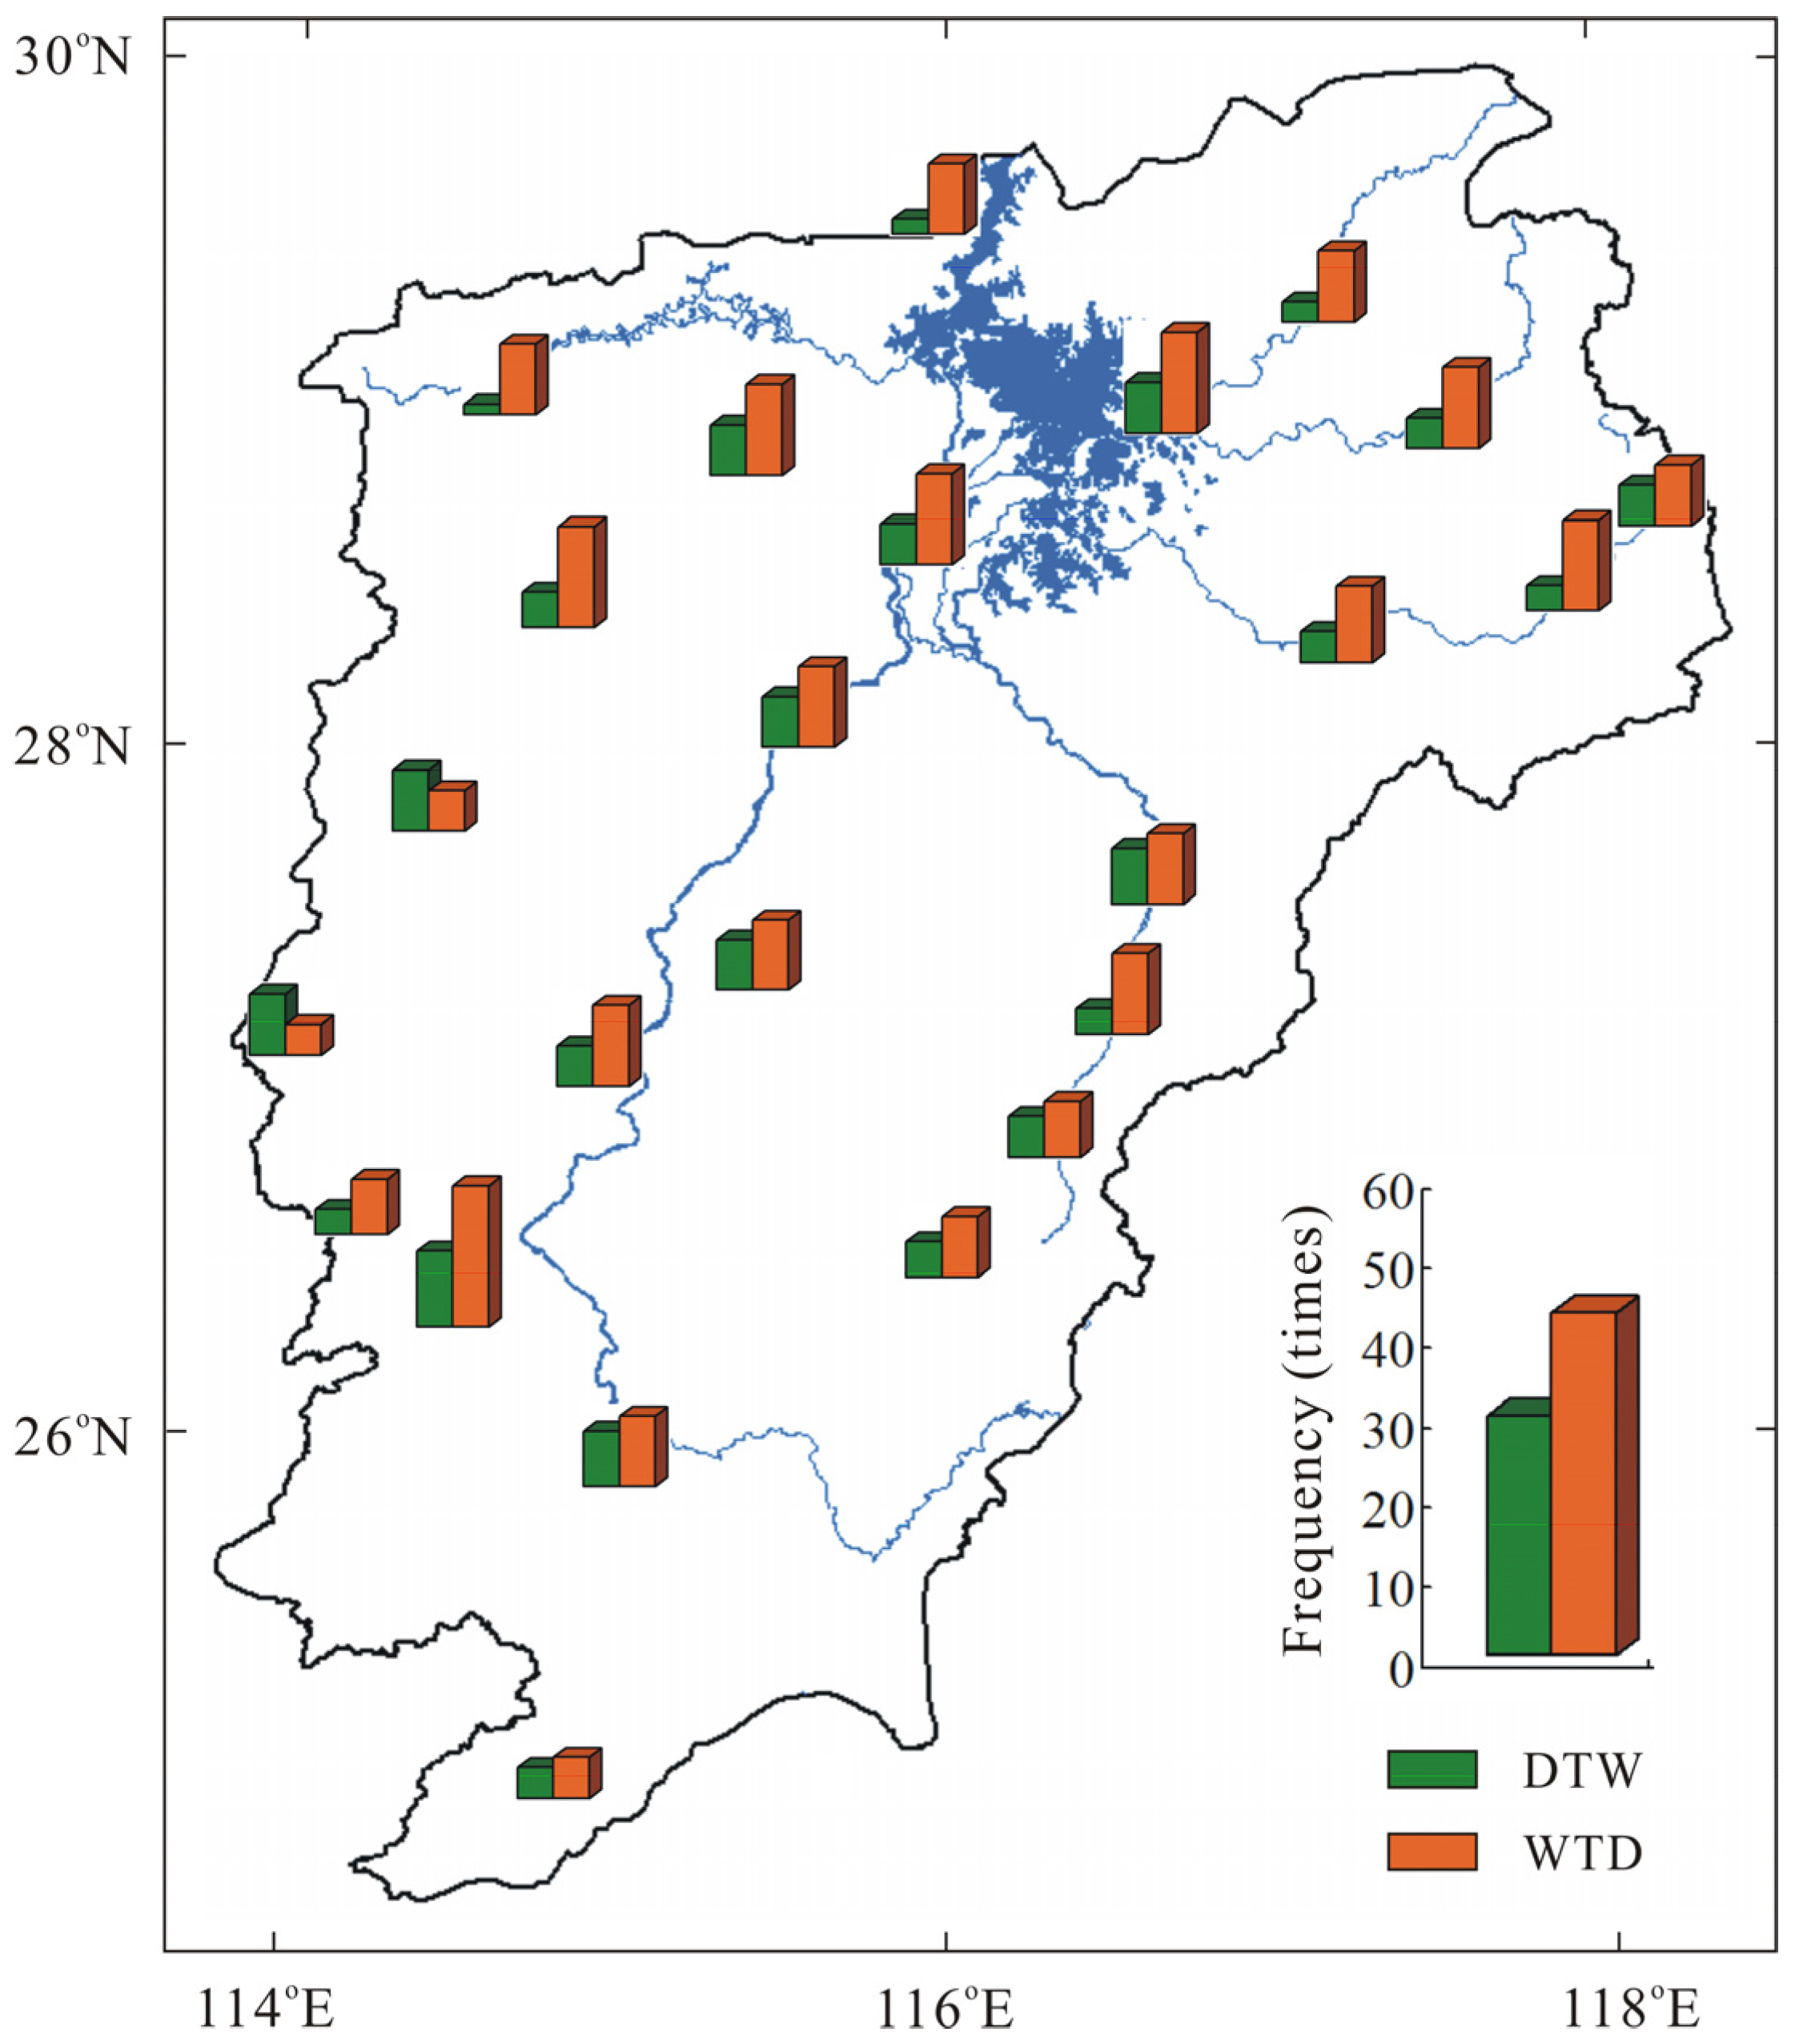
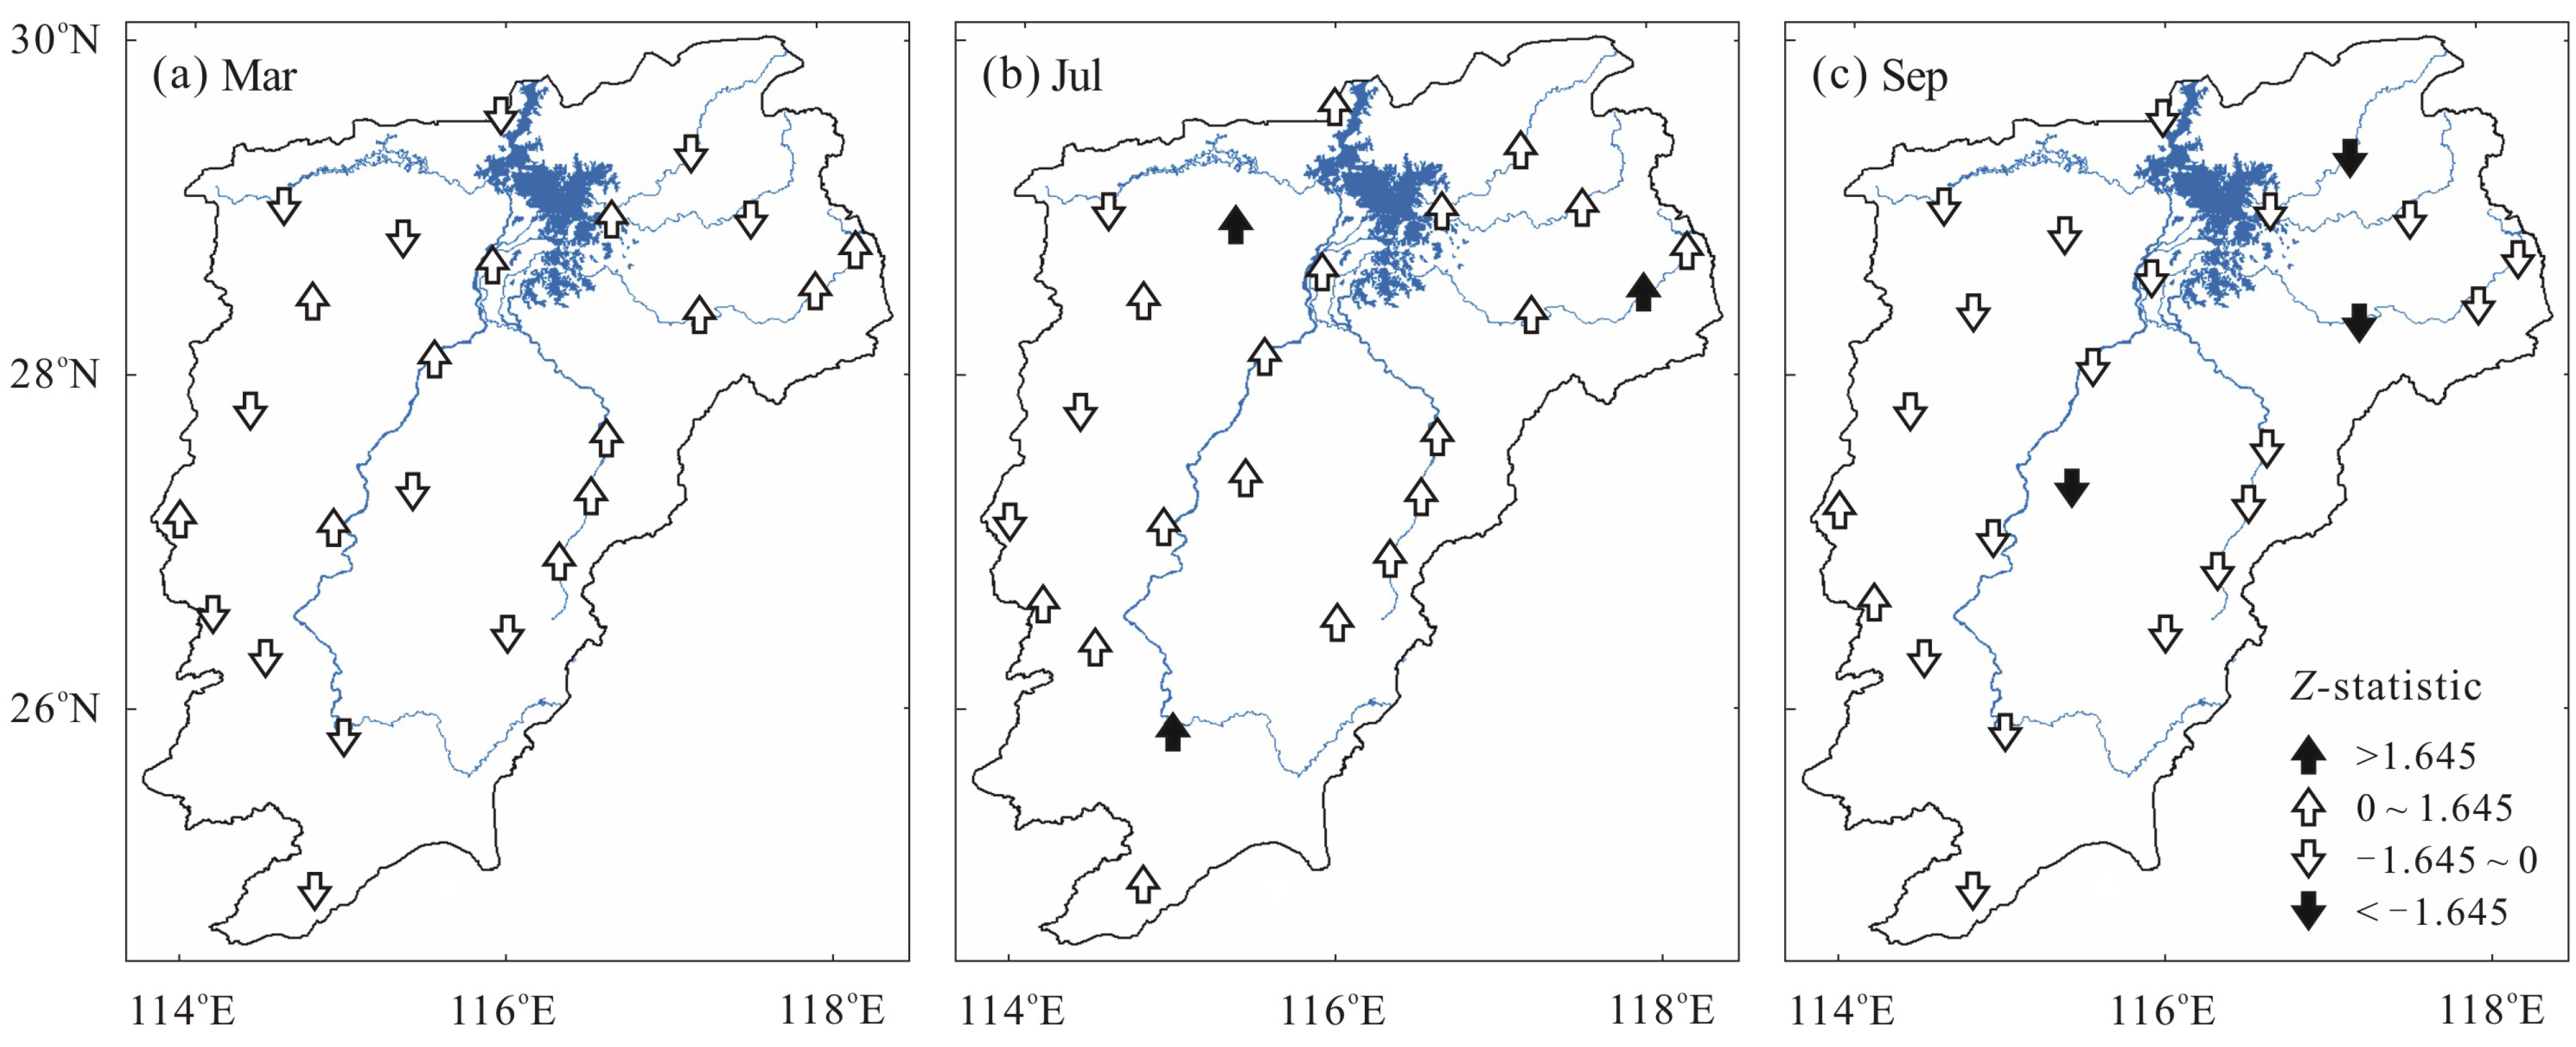
4.3. Spatial Distribution Characteristics of DWAT in Poyang Lake Basin

Subsequently, the frequencies of the severe DWAT events, both the DTW (DWATI > 1.0) and the WTD (DWATI < −1.0), for each meteorological station in the basin are investigated during 1960–2010. The spatial distribution of their occurrence frequency is shown in Figure 8. A visual inspection found that the number of WTDs is observably more than that of the DTWs at nearly all stations, and the difference of the occurrence frequency between them is larger in the north parts than in the south parts of Poyang Lake basin. It is also seen from Figure 8 that the north parts experienced more DWAT events than the south parts, regardless of DTW or WTD.
Figure 8. Spatial distribution of the occurrence frequency of DWAT events. DTW, dry to wet; WTD, wet to dry.
Water 07 01943 g008
In addition, the spatial distribution of the DWAT tendency in Poyang Lake basin is also examined with the M–K test. Figure 9 shows the long-term trend of DWATI for each meteorological station in March, July and September, respectively. It is seen from Figure 9a that increasing and decreasing trends are coexistent in the basin but none of them exceeds the significance level. Moreover the stations with a decreasing trend are mainly located in the north and south of the basin, and others with increasing trends are principally located in the middle parts. In July, the DWATI at almost all stations present increasing trends, but only three of them have significant increasing trends (α = 0.1) (Figure 9b). The opposite tendency with respect to Figure 9b is shown in 9c. In September almost all stations show a decreasing trend, and only three of them achieved the statistical significance level.
Figure 9. Spatial patterns of the long-term trends of DWATI in March (a); July (b) and September (c).
Water 07 01943 g009

5. Conclusions

This paper identified and examined the dry-wet abrupt transitions in terms of precipitation in Poyang Lake basin during the period of 1960–2010 and analyzed its intra- and inter-annual distribution characteristics and tendencies, as well as their spatial distribution pattern. The results revealed that the DWATI might be regarded as a vigorous index describing the DWAT phenomenon in Poyang Lake basin, in which the high values indicated the occurrence of DTW, and the low values were often related to the WTD. Moreover, the DTW was inclined to occur in March, but July and September for intra-annual WTD. The inter-annual variation of DWATI showed no clear trend in March due to its fluctuation in the study period. While a feeble long-term increasing trend was detected in July and a decreasing trend in September with the Z-statistic of 1.81 and −1.44, respectively, none of these trends achieved the statistical significance level. As for the spatial distribution, it is found that the north parts of Poyang Lake basin experienced more DWAT events than the south parts; meanwhile, the number of WTDs is observably more than that of DTW at nearly all stations, and the difference in the occurrence frequency between them is larger in north parts than in south parts.
It is acknowledged that, as a consequence of the increase in greenhouse gas concentrations in the atmosphere, anthropogenic global warming has accelerated the regional water circulation and caused an asymmetrical distribution of precipitation, which has very likely increased the probability of floods, droughts and heat waves, especially in China, due to the strong influence of the East Asian monsoon. Under the background of such conditions, this paper is only a preliminary attempt to explore the DWAT event quantitatively, and further studies and research are still needed. It should also be pointed out that the methods used in the study and the results gained cannot fully demonstrate the spatial and temporal distribution characteristics of DWAT events in Poyang Lake basin. However, the DWATI has its inherent advantages in depicting the distribution characteristics and tendencies of the DWAT phenomenon in terms of precipitation, and the presented study provided a new index or approach to DWAT detecting for large-scale watersheds.

Acknowledgments

This work is jointly funded by the National Basic Research Program of China (973 Program) (2012CB417003), the National Natural Science Foundation of China (41201026) and the Science Foundation of Nanjing Institute of Geography and Limnology, Chinese Academy of Sciences (NIGLAS2012135001). The authors are grateful to the anonymous reviewers and the editor who helped us to improve the quality of the original manuscript.

Author Contributions

Xianghu Li conceived of and designed the experiments and wrote the manuscript. Xuchun Ye analyzed the data and improved the manuscript.

Conflicts of Interest

The authors declare no conflict of interest.

References

  1. Nakayama, T.; Watanabe, M. Role of flood storage ability of lakes in the Changjiang River catchment. Glob. Planet Change 2008, 63, 9–22. [Google Scholar] [CrossRef]
  2. Garcia-Castellanos, D.; Estrada, F.; Jimenez-Munt, I.; Gorini, C.; Fernandez, M.; Verges, J.; de Vicente, R. Catastrophic flood of the Mediterranean after the Messinian salinity crisis. Nature 2009, 462, 778–781. [Google Scholar] [CrossRef] [PubMed]
  3. Zhang, J.; Li, N. Quantitative Methods and Applications of Risk Assessment and Management on Main Meteorological Disasters; Beijing Normal University Press: Beijing, China, 2007. (In Chinese) [Google Scholar]
  4. Nie, C.J.; Li, H.R.; Yang, L.S.; Wu, S.H.; Liu, Y.; Liao, Y.F. Spatial and temporal changes in flooding and the affecting factors in China. Nat. Hazards 2012, 61, 425–439. [Google Scholar] [CrossRef]
  5. Li, L.P.; Zhang, K.M.; Luo, T.; Fu, X.H. An analysis of the drought and flood hazard characteristics and risks during the pre-rainy season in South China. Nat. Hazards 2014, 71, 1195–1213. [Google Scholar] [CrossRef]
  6. Liu, R.Y.; Liu, N. Flood area and damage estimation in Zhejiang, China. J. Environ. Manag. 2002, 66, 1–8. [Google Scholar]
  7. Yu, F.; Chen, Z.; Ren, X.; Yang, G. Analysis of historical floods on the Yangtze River, China: Characteristics and explanations. Geomorphology 2009, 113, 210–216. [Google Scholar] [CrossRef]
  8. Wang, L.N.; Shao, Q.X.; Chen, X.H.; Li, Y.; Wang, D.G. Flood changes during the past 50 years in Wujiang River, South China. Hydrol. Process. 2012, 26, 3561–3569. [Google Scholar]
  9. Feng, L.; Zhou, T.; Wu, B.; Li, T.; Luo, J.J. Projection of future precipitation changes over China with a high-resolution global atmospheric model. Adv. Atmos. Sci. 2010, 28, 464–476. [Google Scholar]
  10. Wu, Z.W.; Li, J.P.; He, J.H.; Jiang, Z.H. Large-scale atmospheric singularities and summer long-cycle droughts-floods abrupt alternation in the middle and lower reaches of the Yangtze River. Chin. Sci. Bull. 2006, 51, 2027–2034. [Google Scholar] [CrossRef]
  11. Feng, G.L.; Yang, H.W.; Zhang, S.X.; Wang, K.; Shen, B.Z. A preliminary research on the reason of a sharp turn from drought to flood in the middle and lower reaches of the Yangtze River in late spring and early summer of 2011. Chin. J. Atmos. Sci. 2012, 36, 1009–1026. (In Chinese) [Google Scholar]
  12. Sun, P.; Liu, C.L.; Zhang, Q. Spatio-temporal variations of drought-flood abrupt alternation during main flood season in East River Basin. Pearl River 2012, 5, 29–34. (In Chinese) [Google Scholar]
  13. Cheng, Z.; Ding, X.J.; Xu, M.; Luo, L.S. Climate characters of typical droughts-floods abrupt alternation events in the middle-lower reaches of the Yangtze River. Resour. Environ. Yangtze Basin 2012, 21, 115–120. (In Chinese) [Google Scholar]
  14. Wang, S.; Tian, H.; Ding, X. Climate characteristics of precipitation and phenomenon of drought-flood abrupt alternation during main flood season in Huaihe River basin. Chin. J. Agrometeorol. 2009, 30, 31–34. (In Chinese) [Google Scholar]
  15. Luo, W.; Zhang, X.; Deng, Z.M.; Xiao, Y. Variation of the total runoff into Poyang Lake and drought-flood abrupt alternation during the past 50 years. J. Basic Sci. Eng. 2013, 21, 845–856. (In Chinese) [Google Scholar]
  16. Wu, Z.W.; He, J.H.; Li, J.P.; Jiang, Z.H. The summer drought-flood coexistence in the middle and lower reaches of the Yangtze River and analysis of its air-sea background feathers in anomalous years. Chin. J. Atmos. Sci. 2006, 30, 570–577. (In Chinese) [Google Scholar]
  17. Tang, M.; Shao, D.G.; Yao, C.L. Causes and countermeasures of sudden changing from drought to waterlogging in Huaibei Region. J. China Inst. Water Resour. Hydropower Res. 2007, 5, 26–32. (In Chinese) [Google Scholar]
  18. Zhang, Q.; Chen, Y.D.; Chen, J.Q. Flood/drought variability in the Yangtze Delta and association with the climatic changes from the Guliya ice core: A wavelet approach. Quat. Int. 2008, 189, 163–172. [Google Scholar] [CrossRef]
  19. Wang, H.Q.; Zhao, G.N.; Peng, J.; Hu, J.F. Precipitation characteristics over five major river systems of Poyang drainage areas in recent 50 years. Resour. Environ. Yangtze Basin 2009, 18, 615–619. (In Chinese) [Google Scholar]
  20. Cheng, Z.; Xu, M.; Luo, L.S.; Ding, X.J. Climate characteristics of drought-flood abrupt change events in Huaihe River basin. J. China Hydrol. 2012, 31, 73–79. (In Chinese) [Google Scholar]
  21. Zhang, S.F.; Zhang, J.C.; Min, J.J.; Zhang, Z.X.; Zhuang, J.Y.; Lin, J. Drought-flood abrupt alternation based on runoff in the Huaihe River Basin during rainy season. J. Lake Sci. 2012, 24, 679–686. (In Chinese) [Google Scholar]
  22. Nakayama, T.; Shankman, D. Impact of the Three-Gorges Dam and water transfer project on Changjiang floods. Glob. Planet Change 2013, 100, 38–50. [Google Scholar] [CrossRef]
  23. Du, J.; Fang, J.; Xu, W.; Shi, P.J. Analysis of dry/wet conditions using the standardized precipitation index and its potential usefulness for drought/flood monitoring in Hunan Province, China. Stoch. Environ. Res. Risk Assess. 2013, 27, 377–387. [Google Scholar] [CrossRef]
  24. Bordi, I.; Fraedrich, K.; Jiang, J.M.; Sutera, A. Spatio-temporal variability of dry and wet periods in eastern China. Theor. Appl. Climatol. 2004, 79, 81–91. [Google Scholar] [CrossRef]
  25. Zhang, Q.; Xu, C.Y.; Zhang, Z. Observed changes of drought/wetness episodes in the Pearl River basin, China, using the standardized precipitation index and aridity index. Theor. Appl. Climatol. 2008, 98, 89–99. [Google Scholar] [CrossRef]
  26. Zhai, J.; Su, B.; Gao, C.; Jiang, T. Spatial variation and trends in PDSI and SPI indices and their relation to streamflow in 10 large regions of China. J. Clim. 2010, 23, 649–663. [Google Scholar] [CrossRef]
  27. Leonard, M.; Westra, S.; Phatak, A.; Lambert, M.; van den Hurk, B.; McInnes, K.; Risbey, J.; Schuster, S.; Jakob, D.; Stafford-Smith, M. A compound event framework for understanding extreme impacts. WIREs Clim. Change 2014, 5, 113–128. [Google Scholar] [CrossRef]
  28. Hao, Z.; AghaKouchak, A.; Phillips, T.J. Changes in concurrent monthly precipitation and temperature extremes. Environ. Res. Lett. 2013, 8, 113–128. [Google Scholar] [CrossRef]
  29. Perkins, S.; Alexander, E.; Nairn, J.R. Increasing frequency, intensity and duration of observed global heatwaves and warm spells. Geophys. Res. Lett. 2012, 39. [Google Scholar] [CrossRef]
  30. Easterling, D.R.; Meehl, G.A.; Parmesan, C.; Changnon, S.A.; Karl, T.R.; Mearns, L.O. Climate extremes: Observations, modeling, and impacts. Science 2000, 289, 2068–2074. [Google Scholar] [CrossRef] [PubMed]
  31. Sheffield, J.; Wood, E.F. Projected changes in drought occurrence under future global warming from multi-model, multi-scenario, IPCC AR4 simulations. Clim. Dyn. 2008, 31, 79–105. [Google Scholar] [CrossRef]
  32. Liu, B.; Xu, M.; Henderson, M.; Ye, Q. Observed trends of precipitation amount, frequency, and intensity in China, 1960–2000. J. Geophys. Res. 2005, 110. [Google Scholar] [CrossRef]
  33. Goswami, B.N.; Venugopal, V.; Sengupta, D.; Madhusoodan, M.S.; Xavier, P.K. Increasing trends of extreme rain events over India in a warming environment. Science 2006, 314, 1442–1445. [Google Scholar] [CrossRef] [PubMed]
  34. Lau, K.M.; Wu, H.T. Climatology and changes in tropical oceanic rainfall characteristics inferred from Tropical Rainfall Measuring Mission (TRMM) data (1998–2009). J. Geophys. Res. 2011, 116. [Google Scholar] [CrossRef]
  35. Villarini, G.; Smith, J.A.; Vecchi, G.A. Changing frequency of heavy rainfall over the Central United States. J. Clim. 2013, 26, 351–357. [Google Scholar] [CrossRef]
  36. Shiu, C.J.; Liu, S.C.; Fu, C.; Dai, A.; Sun, Y. How much do precipitation extremes change in a warming climate. Geophys. Res. Lett. 2012, 39. [Google Scholar] [CrossRef]
  37. Liu, S.C.; Fu, C.; Shiu, C.J.; Chen, J.P.; Wu, F. Temperature dependence of global precipitation extremes. Geophys. Res. Lett. 2009, 36. [Google Scholar] [CrossRef]
  38. Sun, Y.; Solomon, S.; Dai, A.; Portmann, R.W. How often will it rain? J. Clim. 2007, 20, 4801–4818. [Google Scholar] [CrossRef]
  39. Trenberth, K.E.; Dai, A.; Rasmussen, R.M.; Parsons, D.B. The changing character of precipitation. Bull. Am. Meteorol. Soc. 2003, 84, 1205–1217. [Google Scholar] [CrossRef]
  40. Gregory, J.M.; Mitchell, J.F.; Brady, A.J. Summer drought in northern midlatitudes in a time-dependent CO2 climate experiment. J. Clim. 1997, 10, 662–686. [Google Scholar] [CrossRef]
  41. Beniston, M. Trends in joint quantiles of temperature and precipitation in Europe since 1901 and projected for 2100. Geophys. Res. Lett. 2009, 36, L07707. [Google Scholar] [CrossRef]
  42. Diffenbaugh, N.S.; Swain, D.L.; Touma, D. Anthropogenic warming has increased drought risk in California. Proc. Natl. Acad. Sci. USA 2015, 112, 3931–3936. [Google Scholar] [CrossRef] [PubMed]
  43. AghaKouchak, A.; Cheng, L.; Mazdiyasni, O.; Farahmand, A. Global warming and changes in risk of concurrent climate extremes: Insights from the 2014 California drought. Geophys. Res. Lett. 2014, 41, 8847–8852. [Google Scholar] [CrossRef]
  44. Li, X.H.; Zhang, Q.; Xu, C.Y.; Ye, X.C. The changing patterns of floods in Poyang Lake, China: Characteristics and explanations. Nat. Hazards 2015, 76, 651–666. [Google Scholar] [CrossRef]
  45. Li, X.H.; Zhang, Q. Variation of floods characteristics and their responses to climate and human activities in Poyang Lake, China. Chin. Geogr. Sci. 2015, 25, 13–25. [Google Scholar]
  46. Guo, H.; Hu, Q.; Jiang, T. Annual and seasonal streamflow responses to climate and land-cover changes in the Poyang Lake basin, China. J. Hydrol. 2008, 355, 106–122. [Google Scholar] [CrossRef]
  47. Hu, Q.; Feng, S.; Guo, H.; Chen, G.; Jiang, T. Interactions of the Yangtze river flow and hydrologic processes of the Poyang Lake, China. J. Hydrol. 2007, 347, 90–100. [Google Scholar] [CrossRef]
  48. Ye, X.C.; Li, X.H.; Liu, J.; Xu, C.Y.; Zhang, Q. Variation of reference evapotranspiration and its contributing climatic factors in the Poyang Lake catchment, China. Hydrol. Process. 2014, 28, 6151–6162. [Google Scholar] [CrossRef]
  49. Ye, X.C.; Zhang, Q.; Liu, J.; Li, X.H.; Xu, C.Y. Distinguishing the relative impacts of climate change and human activities on variation of streamflow in the Poyang Lake catchment, China. J. Hydrol. 2013, 494, 83–95. [Google Scholar] [CrossRef]
  50. Li, X.H.; Zhang, Q.; Ye, X.C. Capabilities of satellite-based precipitation to estimate the spatiotemporal variation of flood/drought class in Poyang Lake basin. Adv. Meteorol. 2013, 2013. [Google Scholar] [CrossRef]
  51. Mann, H.B. Non-parametric test against trend. Econometrica 1945, 13, 245–259. [Google Scholar] [CrossRef]
  52. Kendall, M.G. Rank Correlation Methods; Charles Griffin: London, UK, 1975. [Google Scholar]
  53. Zhao, G.J.; Hörmann, G.; Fohrer, N.; Zhang, Z.X.; Zhai, J.Q. Streamflow trends and climate variability impacts in Poyang Lake basin, China. Water Resour. Manag. 2010, 24, 689–706. [Google Scholar] [CrossRef]
  54. Novotny, E.V.; Stefan, H.G. Stream flow in Minnesota: Indicator of climate change. J. Hydrol. 2007, 334, 319–333. [Google Scholar] [CrossRef]
  55. Chen, H.; Guo, S.L.; Xu, C.Y.; Singh, V.P. Historical temporal trends of hydro-climatic variables and runoff response to climate variability and their relevance in water resource management in the Hanjiang basin. J. Hydrol. 2007, 344, 171–184. [Google Scholar] [CrossRef]
  56. Xu, Z.X.; Chen, Y.N.; Li, J.Y. Impact of climate change on water resources in the Tarim river basin. Water Resour. Manag. 2004, 18, 439–458. [Google Scholar] [CrossRef]
  57. Yue, S.; Pilon, P.; Phinney, B. Canadian streamflow trend detection: impacts of serial and cross-correlation. Hydrol. Sci. J. 2003, 48, 51–63. [Google Scholar] [CrossRef]
  58. Khaliq, M.N.; Ouarda, T.B.M.J.; Gachon, P.; Sushama, L.; St-Hilaire, A. Identification of hydrological trends in the presence of serial and cross correlations: a review of selected methods and their application to annual flow regimes of Canadian rivers. J. Hydrol. 2009, 368, 117–130. [Google Scholar] [CrossRef]

