Article

Carbon Footprint Analyses of Mainstream Wastewater Treatment Technologies under Different Sludge Treatment Scenarios in China

1
State Key Laboratory of Urban Water Resource and Environment, Harbin Institute of Technology, No. 73 Huanghe Road, Nangang District, Harbin 150090, China
2
School of Marine Science and Technology, Harbin Institute of Technology at Weihai, No. 2 Wenhua West Road, High-tech New District, Weihai 264209, China
3
School of Chemical Engineering and Technology, Harbin Institute of Technology, No. 92 West Dazhi Street, Nangang District, Harbin 150001, China
4
Department of Land Surveying and Geo-Informatics, The Hong Kong Polytechnic University, Kowloon 999077, Hong Kong
*
Authors to whom correspondence should be addressed.
Water 2015, 7(3), 918-938; https://doi.org/10.3390/w7030918
Submission received: 10 December 2014 / Revised: 7 January 2015 / Accepted: 19 February 2015 / Published: 5 March 2015

Abstract

:
With rapid urbanization and infrastructure investment, wastewater treatment plants (WWTPs) in Chinese cities are putting increased pressure on energy consumption and exacerbating greenhouse gas (GHG) emissions. A carbon footprint is provided as a tool to quantify the life cycle GHG emissions and identify opportunities to reduce climate change impacts. This study examined three mainstream wastewater treatment technologies: Anaerobic–Anoxic–Oxic (A–A–O), Sequencing Batch Reactor (SBR) and Oxygen Ditch, considering four different sludge treatment alternatives for small-to-medium-sized WWTPs. Following the life cycle approach, process design data and emission factors were used by the model to calculate the carbon footprint. Results found that direct emissions of CO2 and N2O, and indirect emissions of electricity use, are significant contributors to the carbon footprint. Although sludge anaerobic digestion and biogas recovery could significantly contribute to emission reduction, it was less beneficial for Oxygen Ditch than the other two treatment technologies due to its low sludge production. The influence of choosing “high risk” or “low risk” N2O emission factors on the carbon footprint was also investigated in this study. Oxygen Ditch was assessed as “low risk” of N2O emissions while SBR was “high risk”. The carbon footprint of A–A–O with sludge anaerobic digestion and energy recovery was more resilient to changes of N2O emission factors and control of N2O emissions, though process design parameters (i.e., effluent total nitrogen (TN) concentration, mixed-liquor recycle (MLR) rates and solids retention time (SRT)) and operation conditions (i.e., nitrite concentration) are critical for reducing carbon footprint of SBR. Analyses of carbon footprints suggested that aerobic treatment of sludge not only favors the generation of large amounts of CO2, but also the emissions of N2O, so the rationale of reducing aerobic treatment and maximizing anaerobic treatment applies to both wastewater and sludge treatment for reducing the carbon footprint, i.e., the annamox process for wastewater nutrient removal and the anaerobic digestion for sludge treatment.

1. Introduction

Environmental problems arising from urban areas have become critical issues facing human society. Globally, 50.5% of the world population was living in cities in 2010. While in China, 45.8% population dwells in urban areas and this number is expected to increase to 70% by 2050 [1]. Cities import water, energy and materials which are transformed into goods and services and ultimately returned to the environment in the form of emissions and waste. Among these urban infrastructures to facilitate public services, wastewater treatment plants (WWTPs) are recognized as a significant energy consumer and source of greenhouse gas (GHG) emissions [2,3,4], which are threatening global and regional environment and climate. Currently, there are 3513 WWTPs in China [5], and the electricity consumption for wastewater treatment is about 17.5 billion kilowatts/hour (kWh) in 2013, accounting for 0.4% of China’s total electricity consumption. With rapid development of WWTPs in Chinese cities, more energy is expected to be consumed in the future for WWTPs construction and operation. According to the national GHG inventory, WWTPs were listed as the 6th largest contributors to methane (CH4) emissions and 3rd largest sources of nitrous oxide (N2O) emissions, respectively, accounting for 72% of total CH4 emissions and 26% of total N2O emissions [6]. Meanwhile, biosolids generated from the wastewater treatment process are likely to impose potential risks, polluting underground water and soil. In China, more than 60% of WWTPs send wasted sludge for landfill after dewatering and thickening [7], leaving most valuable energy and resources in biosolids untapped, but cause GHG emissions, land occupation and potential risks of underground water pollution from landfill.
Previous studies have highlighted the trade-offs between eutrophication and global warming impact categories caused mainly by effluent discharge, sludge treatment and disposal, and electricity use [2,8]. Driven by more stringent wastewater discharge standards aimed at improving the aquatic environment by alleviating eutrophication arising from anthropogenic nutrient source, biological nutrient removal (BNR) is being increasingly applied at WWTPs. The overall trend, therefore, is toward increasing energy consumption and chemical dosage per unit of wastewater treated [9]. On the other hand, under the big backdrop of global and national actions to achieve carbon neutrality or even carbon negative development, the Chinese wastewater treatment sector will inevitably need to follow the lead to reduce GHG emissions and cut energy consumption to mitigate its climate change impact. Carbon footprint accounting thus should be adopted as a tool to measure climate change impact in developing technology roadmaps for wastewater treatment and in the decision-making process for taking precautionary measures [10]. With the development of urbanization in China, more WWTPs will be constructed and operated in small and medium cities in the near future; therefore, plants with an average flow rate of 20,000 cubic meters per day (m3/day) will be the mainstream scale of newly built WWTPs. Assessment of carbon footprints of mainstream treatment technologies to be adopted in these new plants are therefore important for decision-making on process design, operation strategies and performance evaluation to achieve carbon neutrality. Meanwhile, the management of raw sludge is also a critical problem in close relationship with wastewater treatment. The treatment and disposal of raw sludge with increasing production from wastewater treatment process not only brings about potential pollution to the environment, i.e., metals and trace pollutants contained might pollute underground water and soil, but also require energy and chemicals during the process. In previous studies on GHG accounting, most are focused on the GHG emissions from the liquor treatment [4,10,11,12,13] or sludge treatment [14,15,16] separately; less attention has been paid to quantify GHG emissions to a larger extent, with the integration of both wastewater and sludge treatment in the system boundary. The measurement of GHG emissions including both the wastewater and sludge treatment process could shed light on the water–energy–GHG nexus relationship and contribute to the GHG mitigation efforts in WWTPs with synergy effects. To meet this objective, this study aims to estimate and compare carbon footprints of mainstream liquid and sludge treatment portfolios to be considered for new WWTPs built in China, by using plant design data and following the life cycle approach. Extensive analyses and discussion of all treatment scenarios are presented to highlight the variation of carbon footprints of different treatment scenarios and factors that affect GHG emissions.

2. Materials and Methods

2.1. Definition of Carbon Footprint

Following the life cycle approach, the carbon footprint in this study was defined as direct and indirect GHG emissions caused by wastewater and sludge treatment within a defined system boundary. The accounted GHG emissions included carbon dioxide (CO2), CH4 and N2O and were all converted into carbon dioxide equivalents (CO2e) by global warming potentials (GWPs) over 100 years, namely, 1 for CO2 25 for CH4 and 298 for N2O. It is to be noted that although CO2 emissions from biological wastewater treatment is generally not considered in GHG inventory of wastewater treatment because of its biogenic origin, some studies pointed out that up to 20% of the carbon present in wastewaters can be of fossil origin [17] and fossil CO2 emissions from wastewater treatment were underestimated [18]. They were therefore taken into account when quantifying the associated impact [19] in this study.
Within the defined system boundary (as shown in Figure 1), several flows of GHG emissions were estimated and compared among different treatment scenarios. The calculation included direct GHG emissions from wastewater treatment (e.g., CO2 emissions from organic matters degradation and N2O emissions from the nitrification/de-nitrification process) and sludge treatment (e.g., CH4 and N2O emissions from anaerobic digestion), indirect GHG emissions from sludge final disposal, indirect emissions from production and transportation of construction materials, electricity use and chemicals consumption during operation, and transport of sludge. Although previous studies find that environmental impacts of construction are much less than those of operation and usually are neglected in most life cycle assessment (LCA) studies, these case-specific studies are highly dependent on materials used in different countries and regions and the lifespan of each individual case [2,11,20]. Therefore, no generalization of the impacts of construction is possible and GHG emissions from construction materials are included in this study. The function unit is defined as the treatment of wastewater in one year.
Figure 1. System boundary of this study and studied scenarios for wastewater and sludge treatment.
Water 07 00918 g001

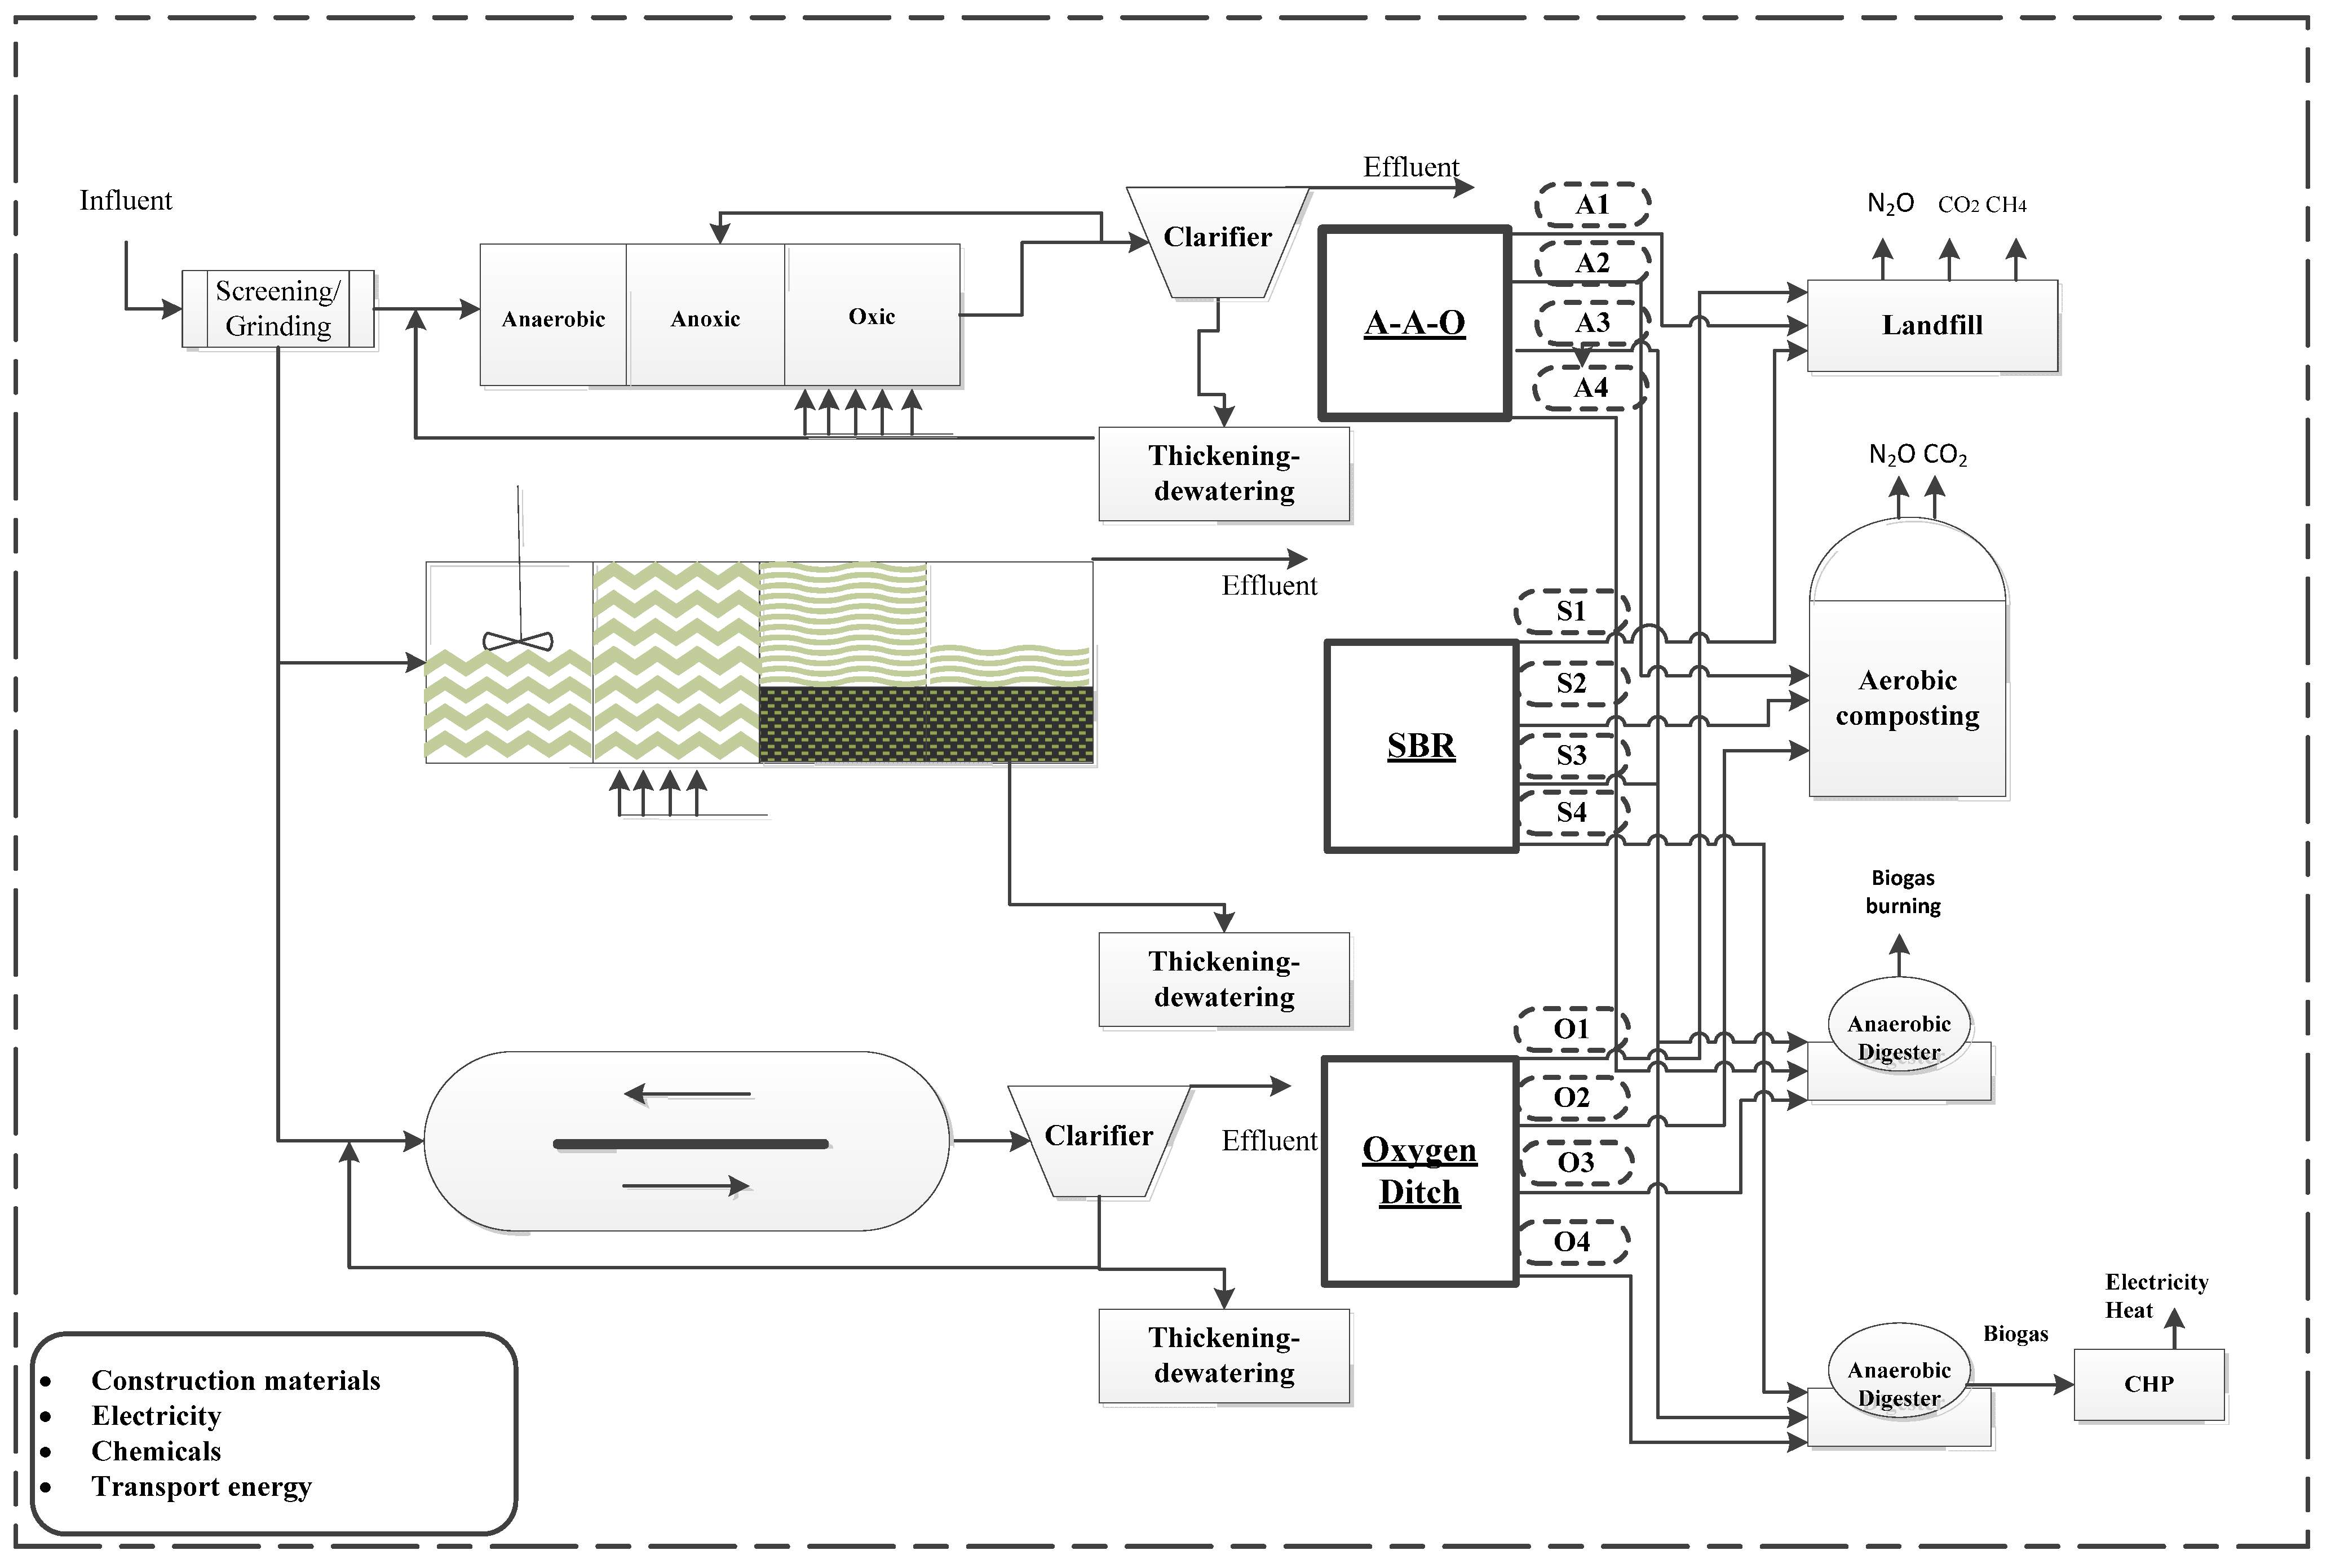
2.2. Scenarios Studied

In this study, three types of wastewater treatment technologies, Anaerobic–Anoxic–Oxic (A–A–O), Sequencing Batch Reactor (SBR) and Oxygen Ditch (OD), were selected for scenario analyses as these three processes are widely adopted in Chinese WWTPs as the best available technology (BAT) both in terms of plant numbers and treatment capacity [7]. The application of these three types of technologies with low carbon footprint in small scale WWTPs (flow rate = 20,000 m3/day) needed to be investigated in this study as sludge treatment and disposal not only concerns environmental pollution problems, but also plays a critical role in reducing the carbon footprint of the whole process. Simply put, the energy content in organic matters in the wastewater is either converted to CO2 (or CH4) or becomes wasted sludge through the biological process. Therefore, different pathways of sludge treatment and disposal could result in different levels of GHG emissions and energy utilization. In this study, anaerobic digestion and aerobic fermentation were considered for two sludge treatment alternatives, with landfill as the final sludge disposal method. Further, the utilization of biogas from anaerobic digestion was also studied to examine the contribution of energy recovery to GHG offsets. In addition to the pretreatment of biosolids, four scenarios of sludge treatment and disposal were studied: (1) Direct landfill, currently used by 63% of WWTPs in China; (2) Aerobic composting followed by land application (14% of Chinese WWTPs); (3) Anaerobic digestion with biogas combustion (for safety reasons assuming no CH4 leakage and all CH4 oxidized to CO2 during complete combustion) and biosolids sent for land application; (4) Anaerobic digestion with energy recovery by using combined heat and power (CHP) units, and the biosolids are sent for land application. In all, 12 scenarios of wastewater treatment and sludge treatment and disposal, as shown in dotted circle in Figure 1, were studied: A–A–O with sludge landfill (A1), A–A–O with sludge composting and land application (A2), A–A–O with sludge anaerobic digestion and biogas combustion (A3) and A–A–O with sludge anaerobic digestion and energy recovery via CHP (A4); and SBR with the aforementioned four pathways of sludge treatment and disposal defined as S1, S2, S3 and S4, and lastly, Oxygen Ditch with the four sludge treatment alternatives defined as O1, O2, O3 and O4. Detailed inventory data and operative parameters of different scenarios of wastewater and sludge treatment are described in Table 1.

2.3. Data and Assessment Model

In this study, three treatment alternatives were used in treating 20,000 m3/day of raw municipal wastewater, which is the mainstream treatment capacity for WWTPs built in China. Three treatment alternatives have a COD of 300–500 mg/L and a 5-day biological oxygen demand (BOD5) of 180–300 mg/L, and contain 40–48 mg N/L and 3–5 mg P/L in order to meet the Chinese discharge standard (GB18918-2002) of level 1A; Being the most stringent emissions requirements limiting the COD to less than 50 mg/L, BOD5 to less than 10 mg/L, total nitrogen (TN) to less than 8 mg N/L, NH3-N to less than 10 mg N/L, and total phosphorus (TP) to less than 0.5 mg P/L. Current national GHG inventory methods used by government for estimating GHG emissions from wastewater treatment process are recommended in the 2006 IPCC Inventory Guidelines [21], which follows a top–down approach, for which technology-specific emission factors are not taken into consideration. In this study, total GHG emissions from wastewater and sludge treatment were calculated by using the method of emissions factors, as shown in Equation (1). Parameters of process configurations were acquired from WWTPs design documents and guidelines for municipal projects. Emission factors were mostly taken from peer-reviewed literature but emission factors of electricity used in this study is adjusted based on national electricity portfolio in China [22]. Emission factors used in this study are listed in Table 2.
Table 1. Operating parameters and inventory data for the twelve wastewater and sludge treatment scenarios of this study.
Wastewater Treatment AlternativesA–A–OSBROD
Sludge Treatment and Disposal Alternatives Flow rate: 20,000 m3/day;
CODin = 480 mg/L;
CODeff = 50 mg/L;
BODin = 216 mg/L;
BODeff = 10 mg/L;
TNin = 45 mg/L;
TNeff = 15 mg/L;
SRT = 15 days;
MLR Rate = 200;
Electricity Demand = 0.305 kWh/m3;
Raw Sludge Production = 5.2 t DS/day;
PAC Demand = 138 t/year;
PAM Demand = 5.6 t/year.
Flow Rate: 20,000 m3/day;
CODin = 360 mg/L;
CODeff = 50 mg/L;
BODin = 180 mg/L;
BODeff = 10 mg/L;
TNin = 48 mg/L;
TNeff = 15 mg/L;
SRT = 15 days;
MLR rate = 150;
Electricity Demand = 0.249 kWh/m3;
Raw sludge Production = 4.3 t DS/day;
PAM demand = 4.69 t/year.
Flow Rate: 20,000 m3/day;
CODin = 500 mg/L;
CODeff = 50 mg/L;
BODin = 300 mg/L;
BODeff =10 mg/L;
TNin = 40 mg/L;
TNeff = 15 mg/L;
SRT = 15 days;
MLR Rate = 200;
Electricity Demand = 0.343 kWh/m3;
Raw Sludge Production = 3.7 t DS/day;
PAM demand = 4.04 t/year.
Direct Landfill: Direct landfill after dewatering and thickening by truck transport; Transport distance =20 km; CO2, CH4 and N2O emissions under anaerobic conditions during landfill were taken into account.A1S1O1
Aerobic composting: Static aerobic composting applied; Electricity demand= 10 kWh/t biosolids (80% water content); N2O and CO2 were taken into account.A2S2O2
Anaerobic digestion + biogas combustion: Mesophilic digester at 35 ± 2 °C; Assuming biogas, containing 65% (v/v) CH4 and 32% (v/v) CO2, was completely combusted and converted to CO2; Electricity demand for heating and mixing = 40 kWh/t biosolids (80% water content).A3: Biogas production = 1,517 m3/dayS3: Biogas production = 1,270 m3/dayO3: Biogas production = 1,094 m3/day
Anaerobic digestion + CHP: Mesophilic digester at 35 ± 2 °C; Electricity demand for heating and mixing = 40 kWh/t biosolids (80% water content); Biogas CHP unit to recover 70% energy, 30% for electricity and 40% for heat.A4: Electricity production by CHP = 2,904 kWh/day; Heat production by CHP = 13,956 MJ/day.S4: Electricity production by CHP=2,430 kWh/day; Heat production by CHP=11,681 MJ/day.O4: Electricity production by CHP = 2,094 kWh/day; Heat production by CHP = 10,064 MJ/day.
Notes: CODin = influent COD concentration; CODeff = effluent COD concentration; BODin = influent BOD concentration; BODeff = effluent BOD concentration; TNin = influent TN concentration; TNeff = effluent COD concentration; MLR = Mix-liquor recycle; DS = dry sludge.
E i , j = A D i , j × f i , j
where, E i , j Emissions of type i GHG from source j;
A D i , j , activity data of type i GHG from source j, e.g., fuel consumption, electric power consumption, materials consumption;
f i , j , emission factors of type i GHG from source j activity;
i, types of GHGs, three types of GHGs are considered in this study, CO2, N2O, CH4;
j, categories of GHG emission sources, e.g., electric power consumption, organic matters degradation from wastewater treatment.
Table 2. Emission factors for greenhouse gas (GHG) calculation used in this study.
ParametersValueUnitReference
Wastewater Treatment
CO2 from OM oxidation1.375kg CO2/kg BODremoved[23]
N2O from denitrification0.035kg N2O-N/kg Ndenitrified[24]
Sludge Treatment and Disposal
N2O from composting0.700g N2O-N/kg DS[25]
N2O from landfill8.200g N2O/kg Napplied[9]
CH4 from landfill13.400g CH4/kg sludge[20]
CO2 from landfill35.120g CO2/kg sludge[20]
N2O from biogas combustion0.004g N2O/kg CH4 burned[26]
Chemicals
Polymers (PAM) for dewatering1.500kg CO2e/kg[27]
Polyaluminium chloride (PAC)22.700g CO2e/kg[28]
Energy
Electricity0.681kg CO2e/kWh[22]
Diesel72.600kg CO2e/GJ[6]
Coal90.800kg CO2e/GJ[6]
Construction Materials
Cement0.405kg CO2e/kgEstimated
Steel2.196kg CO2e/kgEstimated
Timber0.706kg CO2e/kgEstimated
Sand0.009kg CO2e/kgEstimated
Gravel0.009kg CO2e/kgEstimated
Cast iron pipe3.096kg CO2e/kgEstimated
Steel pipe and fittings3.096kg CO2e/kgEstimated
Reinforced concrete pipe0.095kg CO2e/kgEstimated
Regarding emissions from the construction phase, material consumption was calculated based on project design documents and the Municipal Projects Investment Estimation Index [29]. GHG emission factors were determined based on the Inventory of Carbon and Energy, as presented in Table S1 in Supplementary Information [30]. Since the inventory data are estimated from the typical fuel mix of relevant UK industry, emission factors in this study were then adjusted based on the fuel mix of relevant industries in China [31,32,33,34], and details were described in Tables S2–S4 in Supplementary Information. Meanwhile, in order to guarantee the transparency of the results, validation of emission factors of construction materials was discussed in Supplementary File and emission factors from Ecoinvent database were also provided in Table S5 for validation. It was assumed that unit energy consumption for transports of construction materials is 1836 kilojoules (kJ) per ton per kilometer (km) and the average distance is 25 km [11]. The lifespan of the wastewater treatment facilities is assumed to be 20 years.
In the operational phase, indirect GHG emissions from on-site electric power and chemicals consumption were considered in this study. On-site electric power is mainly required for aeration, sludge return, mixed liquid recirculation, sludge dewatering and mixers. The amount of electric power consumption was calculated based on the working loads of major power-consuming equipment, e.g., blowers, water pumps, sludge pumps and mixers. Meanwhile, flocculants such as Polyacrylamide (PAM) are consumed in sludge thickening and dewatering at a dosing rate of 3–4 kg per metric ton of dry sludge. The details of calculating the production of dry sludge were provided in Supplementary Information. With regard to N2O emissions, as consensus on the main mechanism of N2O emission during wastewater treatment has not yet been achieved and there are many process design parameters and operation conditions closely related to N2O emission, the emission factor selected in this study was based on an average value of N2O measurement from full-scale WWTPs [24]. Risks of choosing different emissions factors of N2O are further discussed later.
In the scenario of sludge anaerobic digestion with biogas utilization for CHP, thickened sludge is sent to mesophilic digester for anaerobic digestion at a temperature of 35 ± 2 °C. Biogas from anaerobic digestion contains 65% of CH4 and 32% of CO2 [35], and then can be used in CHP Unit to generate electric power and heat via biogas turbines. Meanwhile, commercial-scale biogas CHP units can realize total energy conversion efficiency of 70%, 30% for electricity and 40% for heat, separately [20]. Thus, electricity and heat gains from CHP can be determined by biogas production (detailed information can be seen in the Supplementary Information), multiplying the assumed caloric value of biogas at 23 MJ/m3 by respective energy conversion efficiencies. It is assumed that electricity could displace purchased grid power for WWTP operation and heat could be used to maintain the proper operating temperature of the digester instead of heat from a coal-fired boiler (assuming a heat conversion efficiency of 70%).

3. Results and Discussion

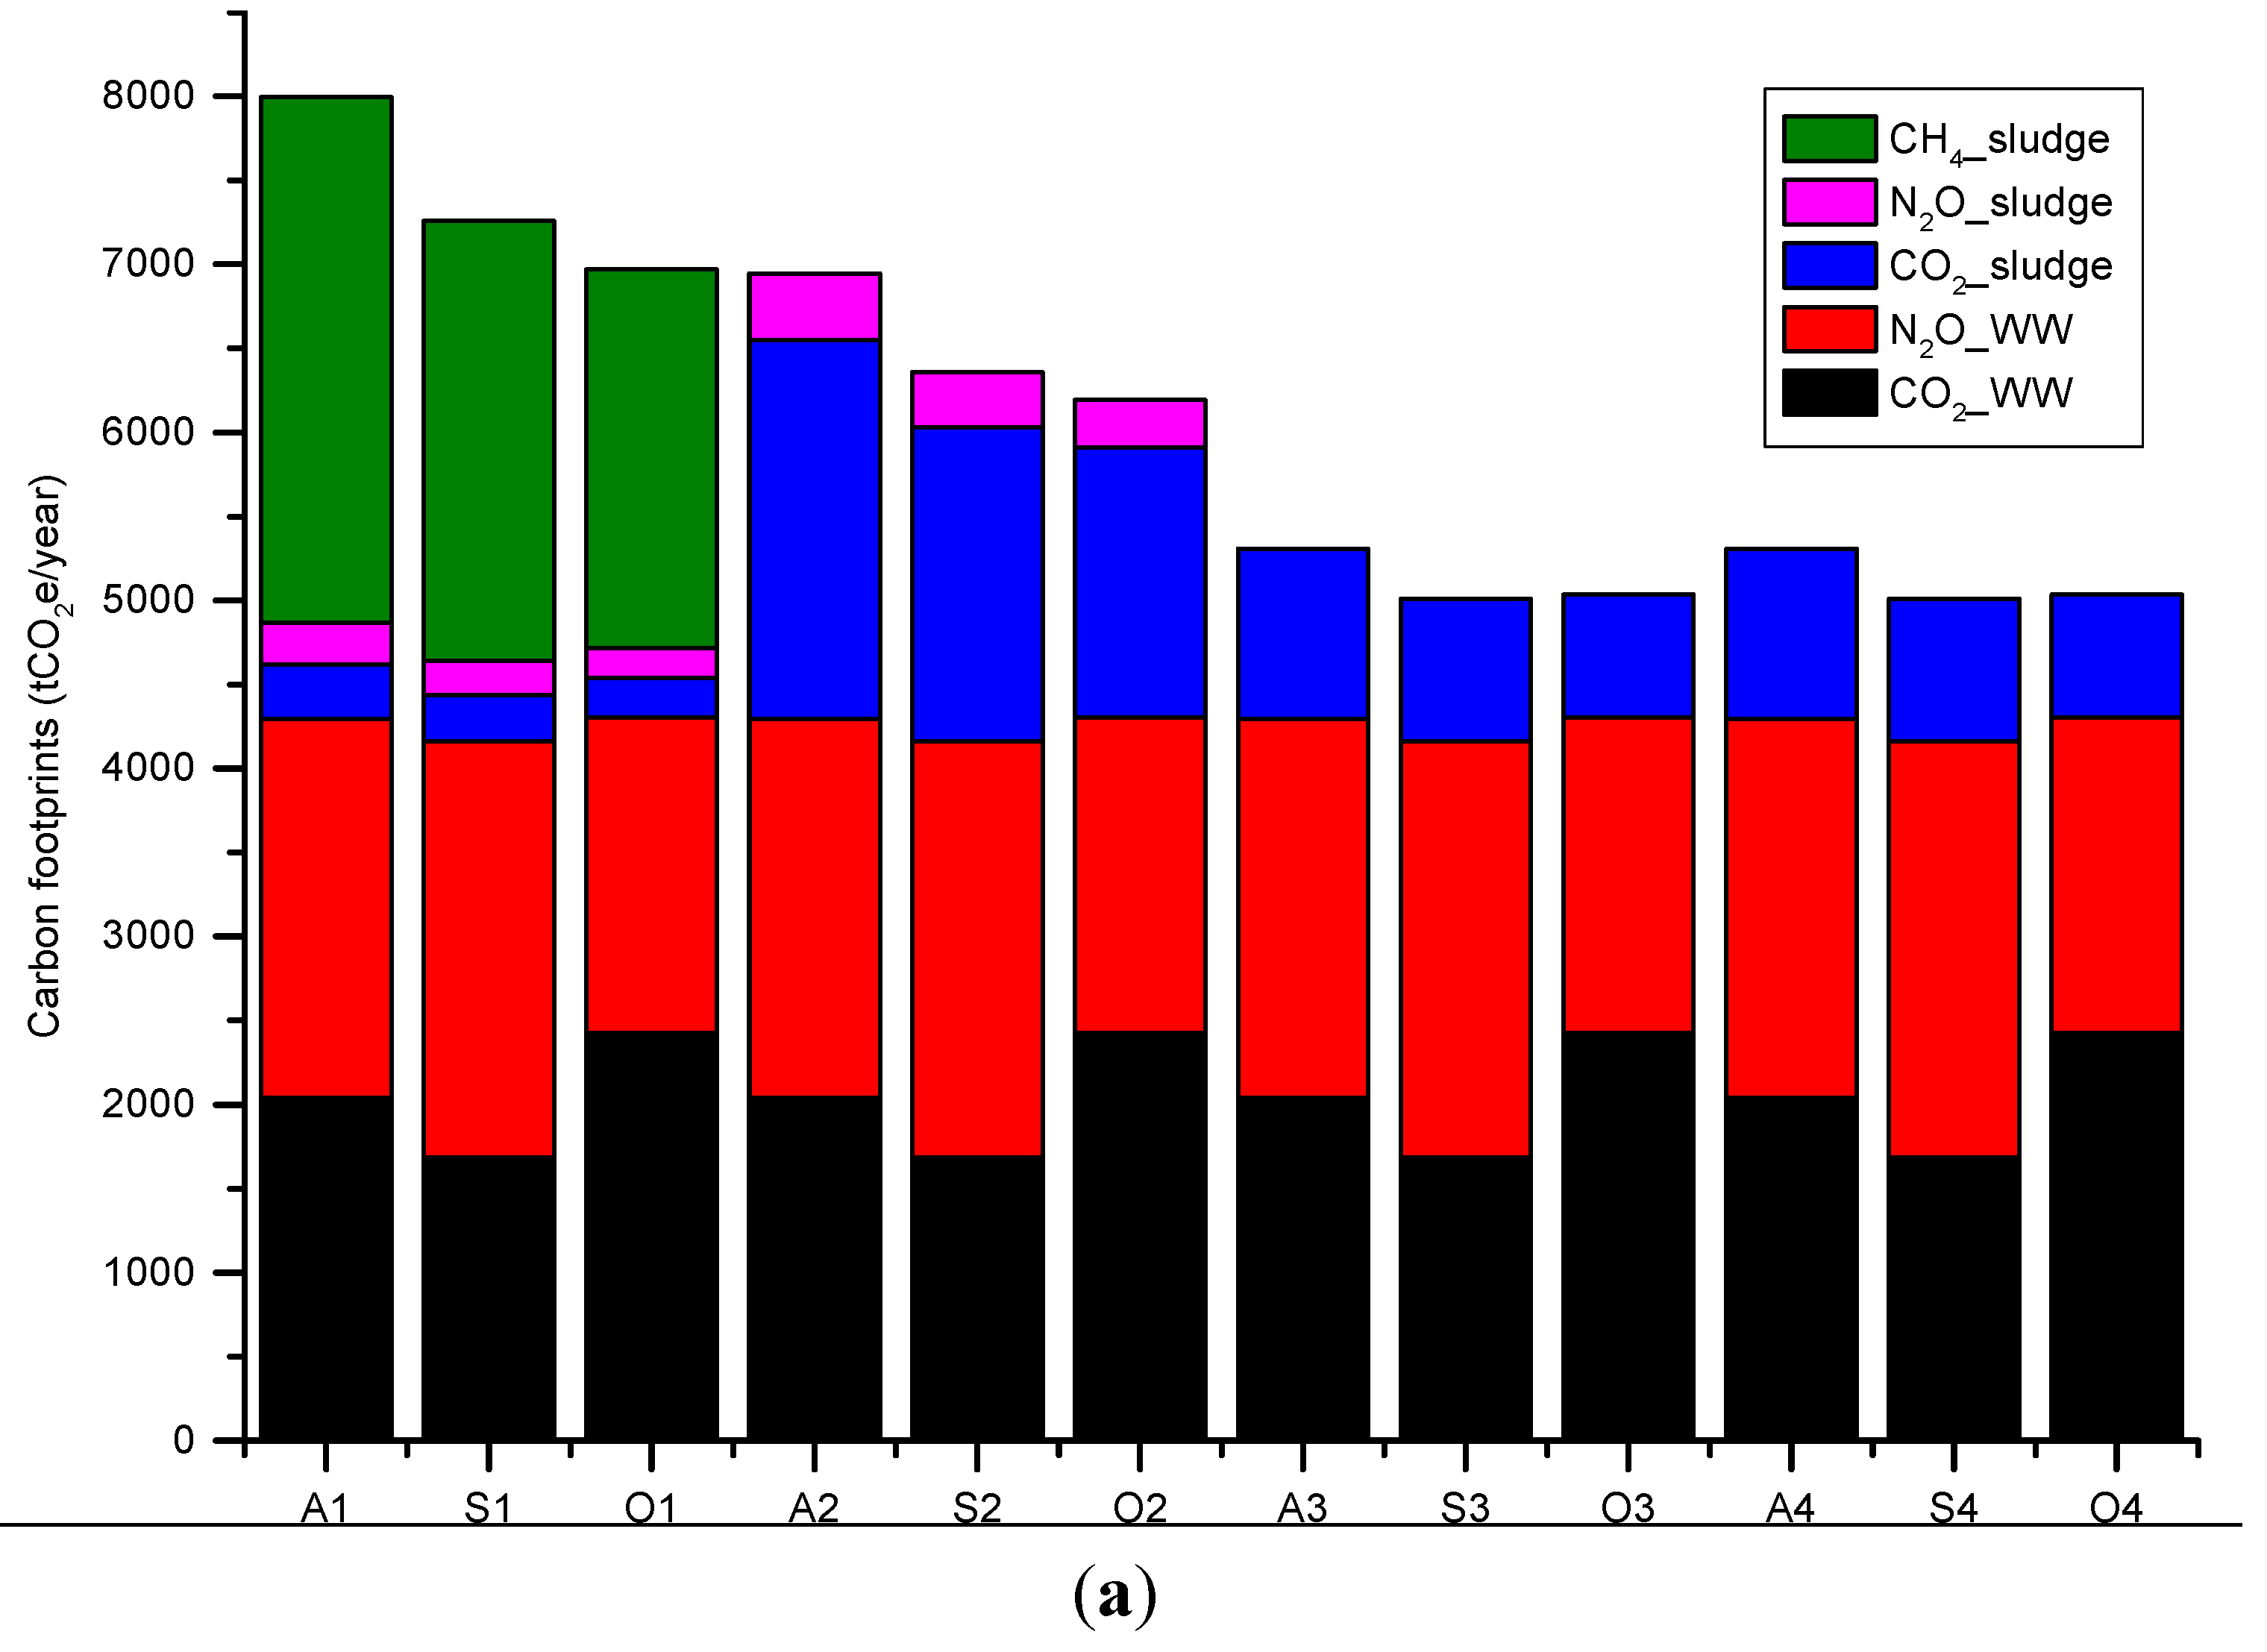
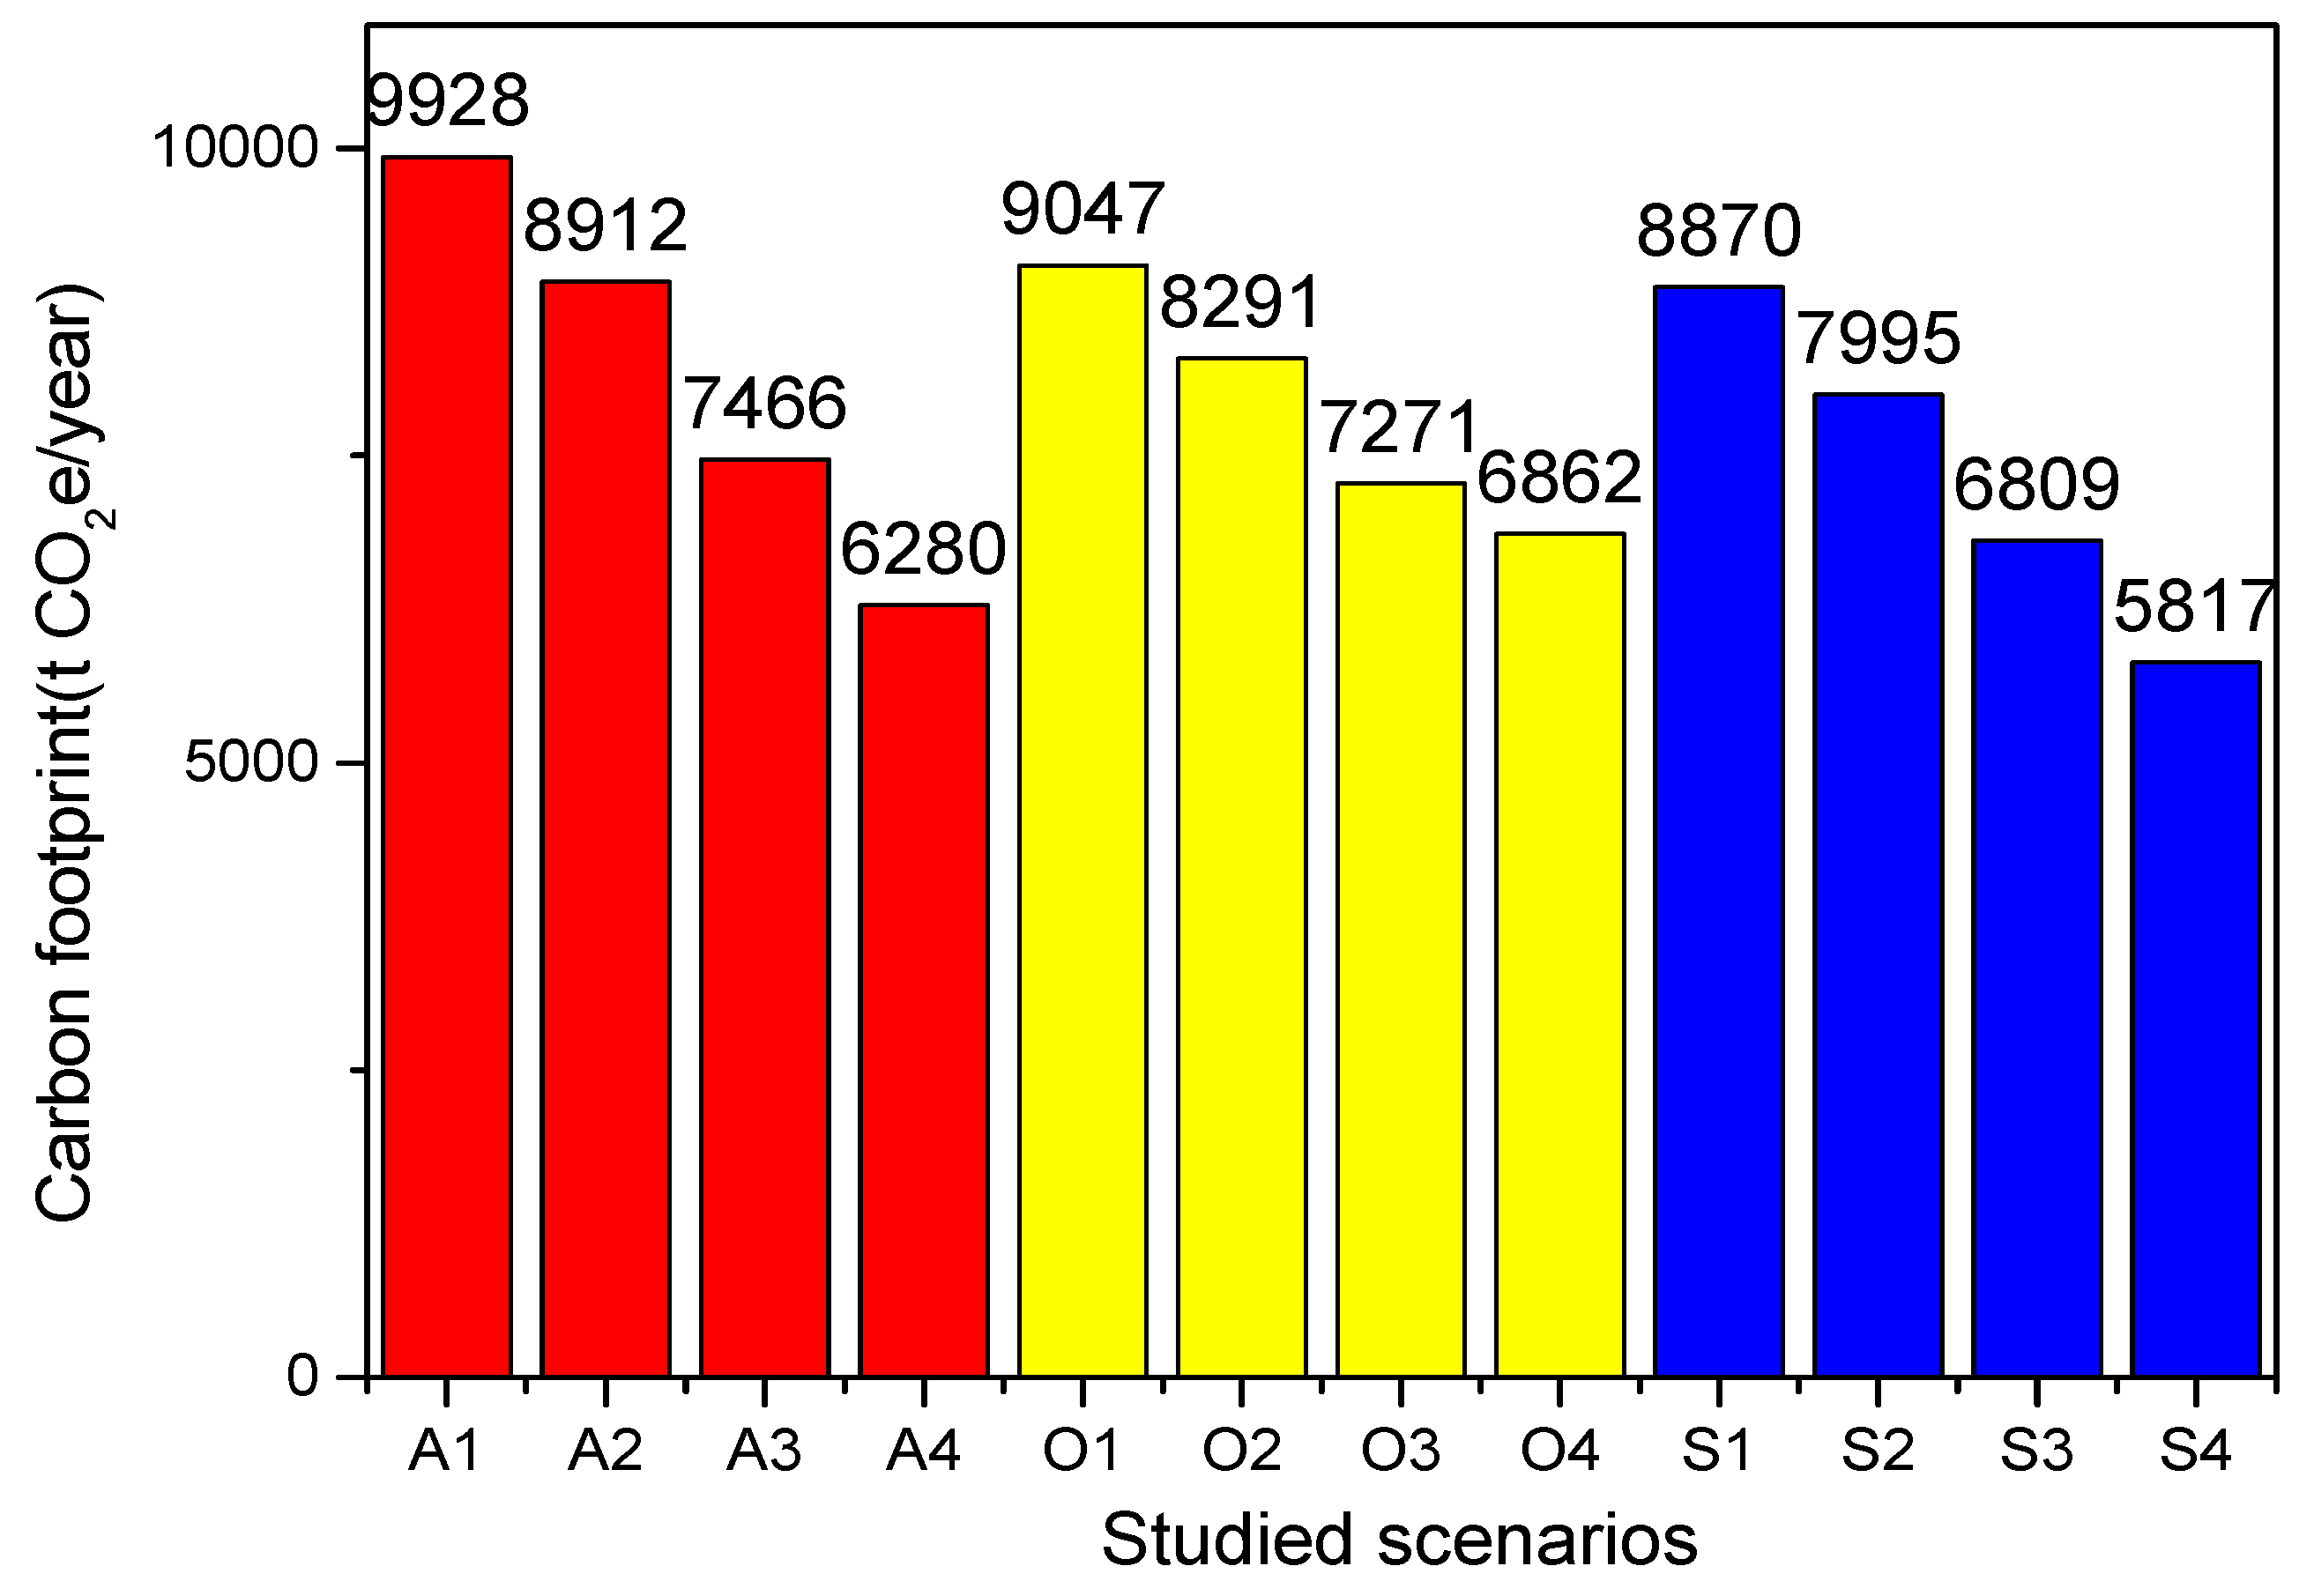
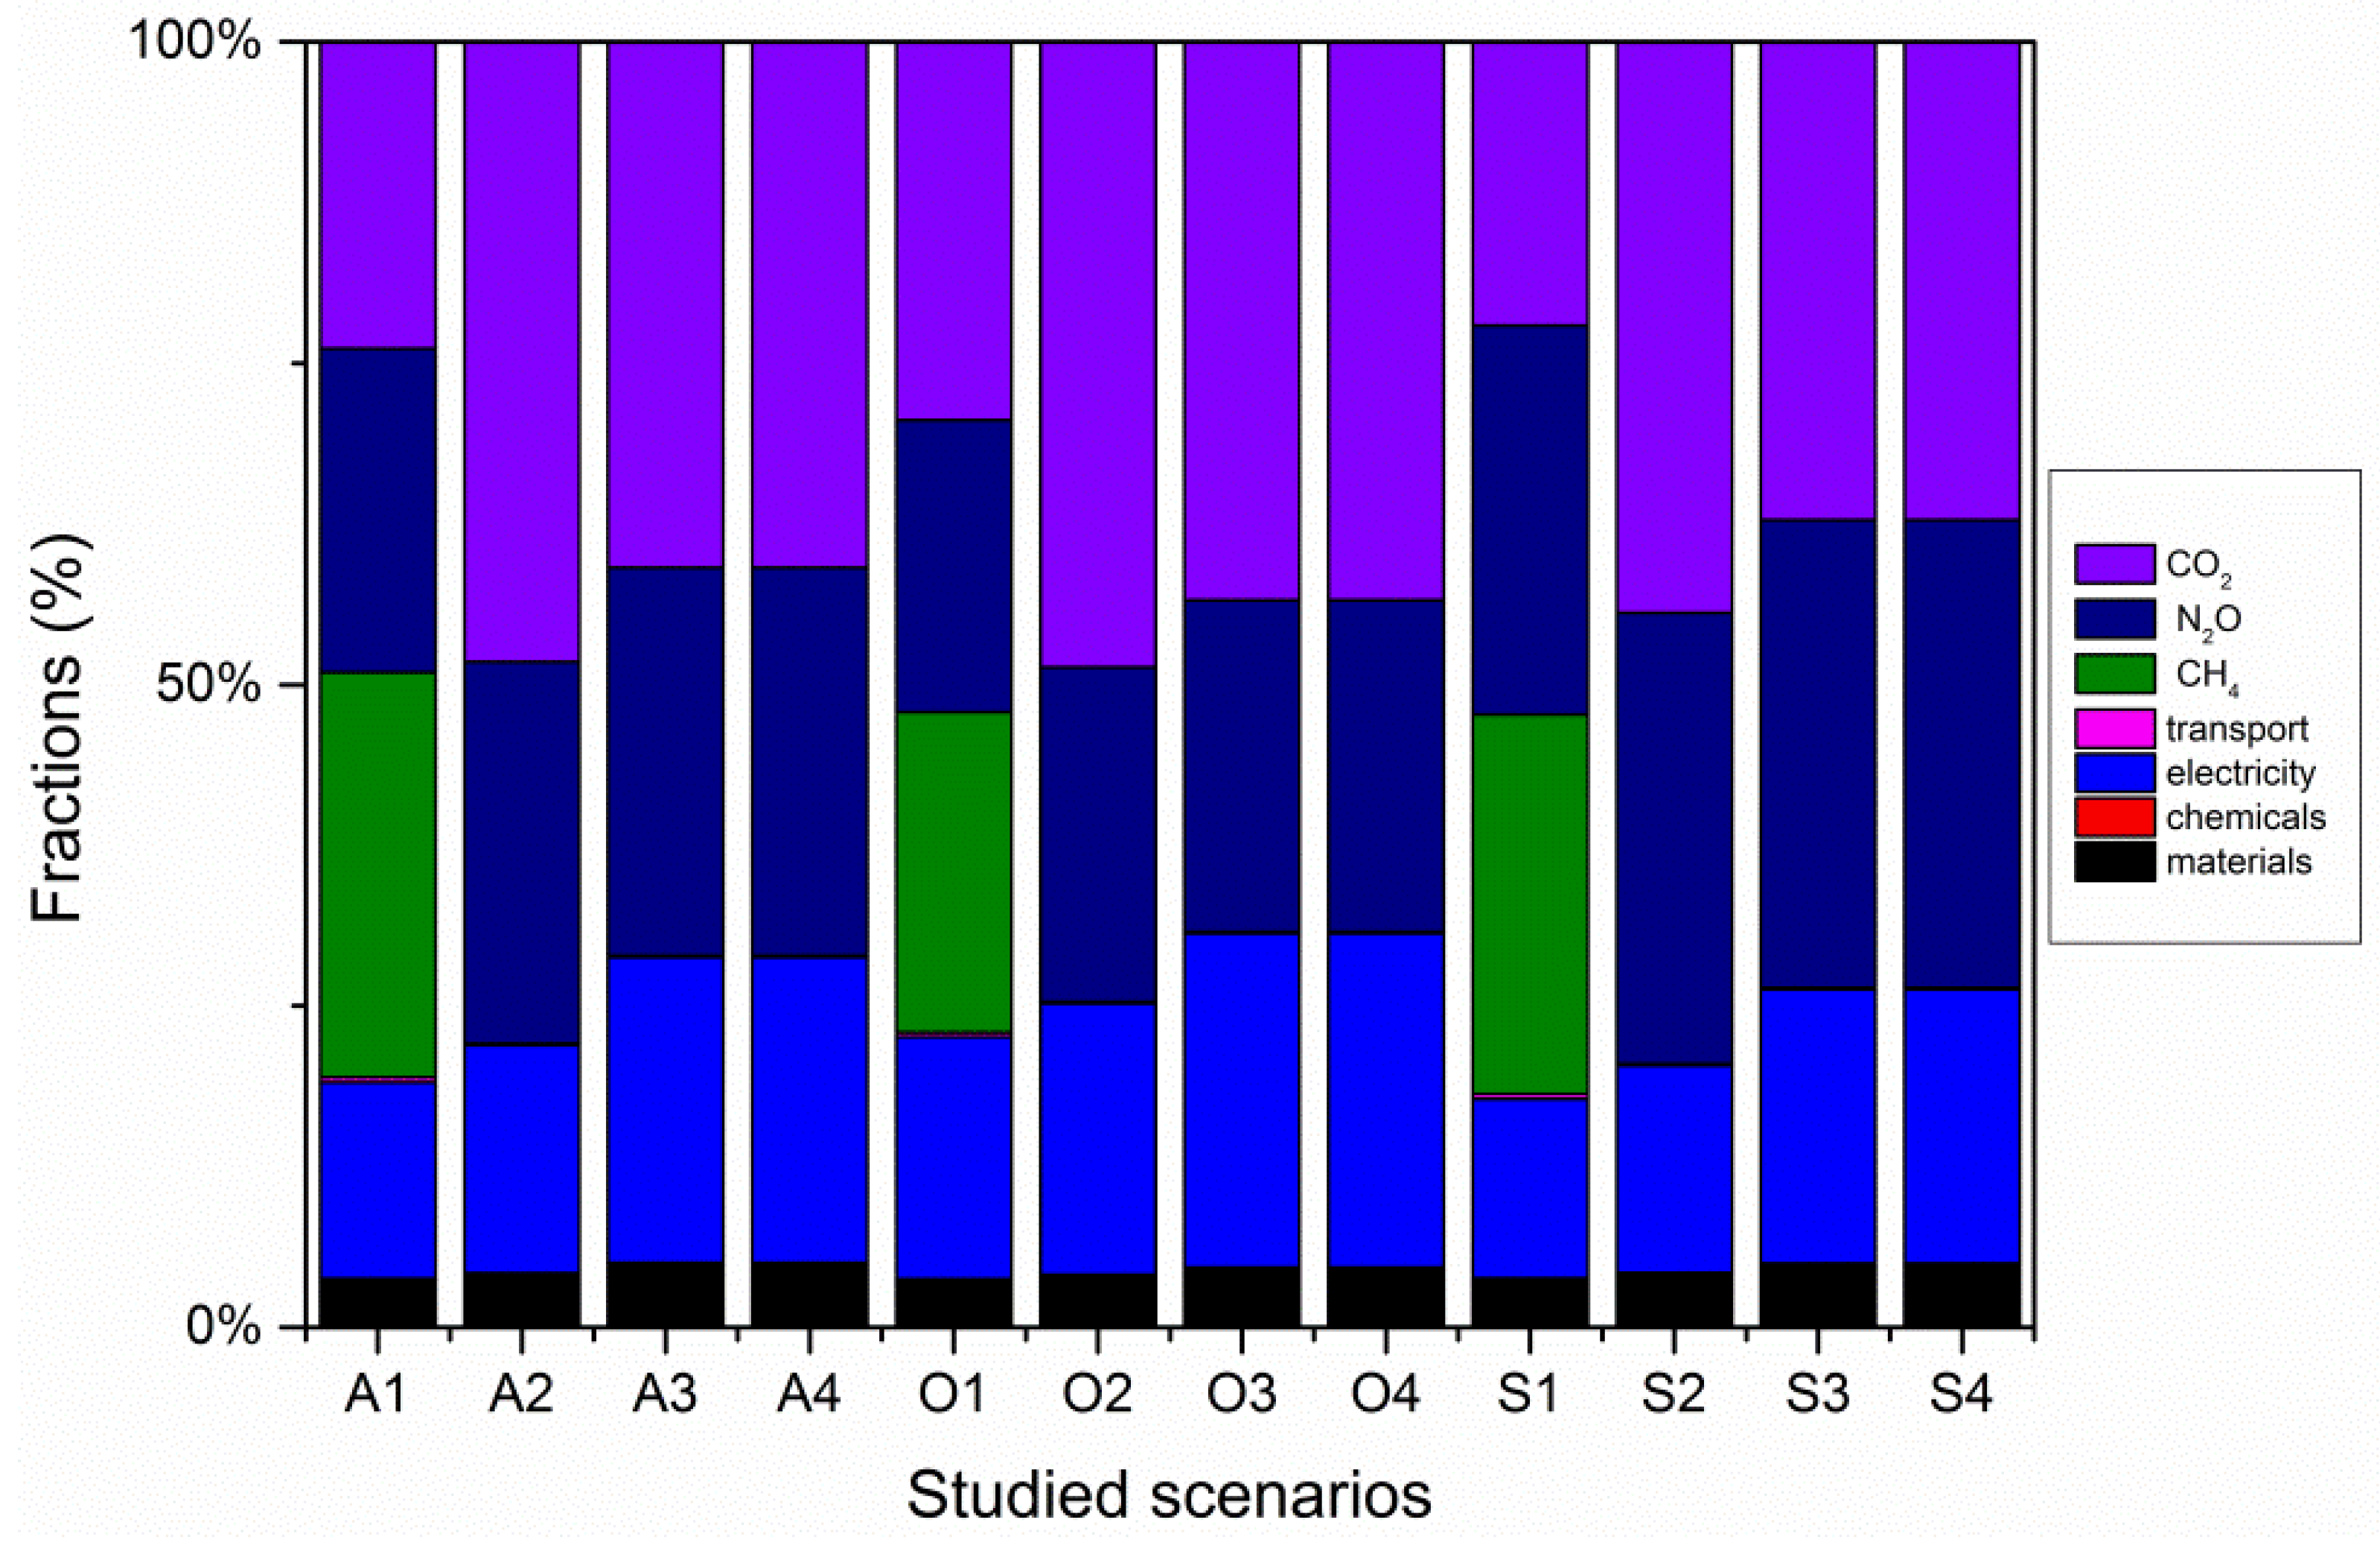
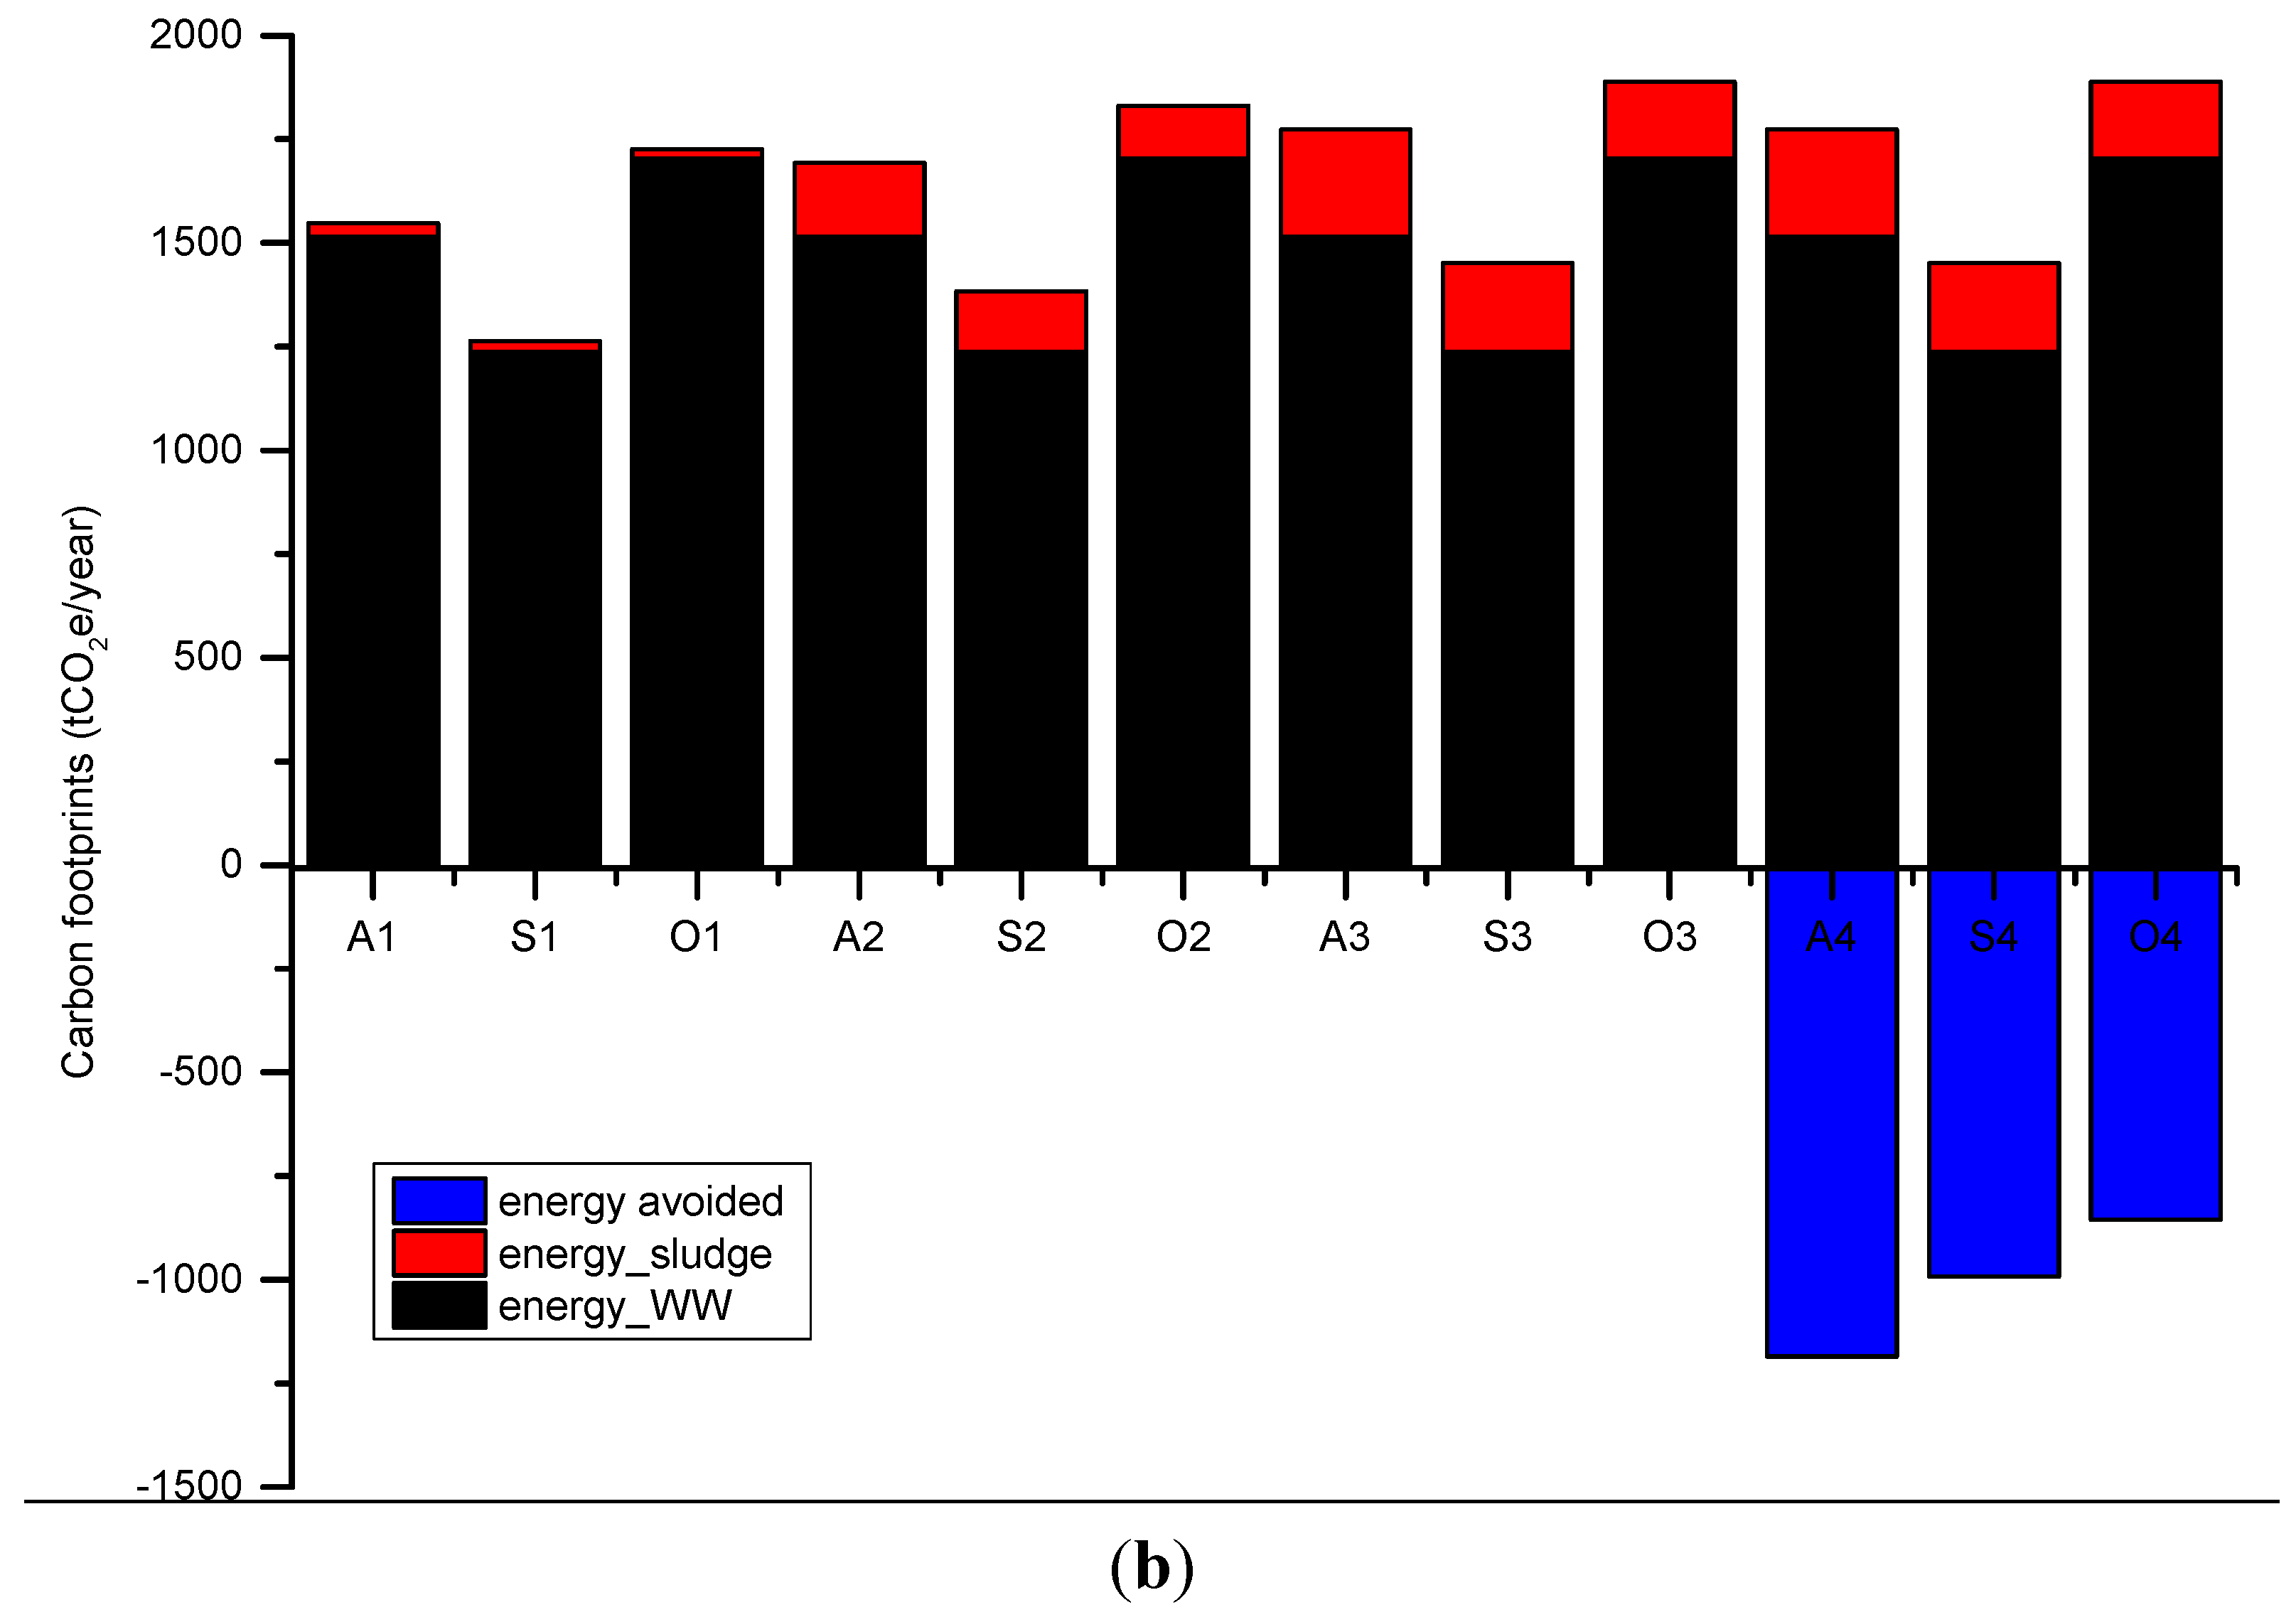
3.1. Carbon Footprint

Carbon footprints of twelve wastewater and sludge treatment alternatives at the flow rate of 20,000 m3/day ranged from 5817–9928 t CO2e per year (Table 3), with none of these treatment alternatives achieving carbon neutrality. As shown in Figure 2, SBR with sludge anaerobic digestion and energy recovery via CHP (S4) had the lowest carbon footprint (5817 t CO2e/year), while A–A–O with sludge landfill (A1) had the highest carbon footprint (9928 t CO2e/year). As a whole, for each of the three wastewater treatment alternatives, different sludge treatment pathways led to different levels of GHG emissions. For four different sludge treatment scenarios, direct landfill gave rise to highest GHG emissions due to its generation of potent CH4 emissions, while anaerobic digestion brought about much lower emissions; in particular, the case of biogas utilization resulted in significant emission offsets (1186, 992, and 855 t CO2e/year for A–A–O, SBR and Oxygen Ditch, respectively). Although aerobic fermentation emitted less GHG emissions than direct landfill, higher energy consumption requirement for aeration (around 10 kWh/t biosolids) significantly contributed to the overall carbon footprint. Compared with sludge direct landfill in each wastewater treatment alternatives, sludge anaerobic digestion and biogas utilization with CHP could help to reduce 37% carbon footprint for A–A–O, 34% for SBR and 24% for Oxygen Ditch. Although sludge aerobic fermentation could also contribute to carbon footprint reduction, emissions reduction (8%–10%) is not as significant as anaerobic digestion with energy recovery. Sludge aerobic fermentation has a high degradation rate of organic matters and generates large amounts of CO2 (1607–2259 t CO2/year for three wastewater treatment alternatives), and the generation rate of fugitive N2O (0.9–1.3 t N2O/year for three wastewater treatment alternatives) is much larger than that of biogas combustion following sludge anaerobic digestion (0.7–1.0 kg N2O/year for three wastewater treatment alternatives), so that is why the carbon footprint of sludge aerobic fermentation was still larger than that of sludge anaerobic digestion with biogas combustion and utilization. Meanwhile, for three of the sludge treatment alternatives (landfill, composting, anaerobic digestion and biogas combustion), the A–A–O process had the highest GHG emissions, Oxygen Ditch had the second highest, and SBR had the lowest GHG. However, for sludge anaerobic digestion with energy recovery via CHP, Oxygen Ditch had the largest carbon footprint, and A–A–O process had the second largest carbon footprint and SBR still had the lowest. This is because energy recovery via the biogas CHP system contributed to emission offsets and was significantly dependent on sludge production, biogas generation rate and biogas utilization efficiency. In this study, assuming other factors remain the same among different treatment alternatives, sludge production was the key determinant on energy recovery and emissions offsets, and sludge production from Oxygen Ditch was much lower than the other two wastewater treatment alternatives due to its process characteristics of extended aeration, longer solids retention time (SRT) and more stabilized biosolids.
According to the assessment of carbon footprints for the different treatment alternatives, as shown in Figure 3, direct emissions of CO2 (22%–49%) and N2O (23%–36%), and electricity (14%–26%) were significant contributors to GHG emissions. According to our study, CO2 emissions, although traditionally not taken into account, can be of similar importance to electricity-associated ones if 50% are supposed not be of biogenic origin. In the scenario of sludge direct landfill, CH4 from landfill process was also a significant source and contributed to 25%–32% of carbon footprints of three wastewater treatment alternatives. Although indirect emissions from construction materials (4%–6% of total GHG emissions) were not as significant as electricity and direct emissions of CO2 and N2O, they were still larger than indirect emissions from chemicals (0.07%–0.18% of total GHG emissions) and transports (0.1%–0.4% of total GHG emissions).
Table 3. Carbon footprints and GHG emissions from different sources for the twelve wastewater and sludge treatment scenarios.
ScenariosTotal GHG Emissions (t CO2e/year)GHG Emissions from Construction (t CO2e/year)GHG Emissions from Chemicals (t CO2e/year)GHG Emissions from Electricity Use (t CO2e/year)GHG Emissions from Transport (t CO2e/year)CH4 Emissions (t CO2e/year)N2O Emissions (t CO2e/year)CO2 Emissions (t CO2e/year)GHG Offsets (t CO2e/year)
A1992836411151641312725012367n/a
A288703327123734.5026831957n/a
A390473336.1170531.3020542662n/a
A4891236411.416939.2026494298−1186
S17995332713848.4261828063551n/a
S282913336.118318.8021594033n/a
S3746636411.417749.2022533054n/a
S46809332714518.4024782532−992
O172713336.118898.8225518783157n/a
O2628036411.417749.2022533054n/a
O35817332714518.4024782532n/a
O468623336.118898.8018783157−855
Figure 2. Carbon footprint of the twelve wastewater and sludge treatment scenarios.
Water 07 00918 g002
Figure 3. Proportions of different sources for GHG emissions of wastewater and sludge treatment.
Water 07 00918 g003
According to the depiction of direct GHG emissions from wastewater and sludge treatment in Figure 4a, CH4 from landfill accounted for around a third (32%–39%) of the total direct GHG emissions in the sludge direct landfill scenario, but CO2 and N2O emissions from wastewater treatment dominated in most cases, ranging from 23%–48%, and 27%–49%, of total direct GHG emissions, respectively. N2O emissions from sludge anaerobic digestion were very small (0.004%–0.006% of total direct emissions), while N2O from landfill were ranging from 2%–3% of total direct emissions and that from aerobic fermentation ranged from 4%–6%. It is indicated that aerobic conditions was more favorable for N2O emissions than anaerobic conditions in landfill and anaerobic digestion, and N2O emissions from sludge aerobic fermentation need to be controlled to lower the overall carbon footprint. Besides, CO2 emissions from aerobic fermentation were also significant, accounting for 26%–33% of total direct emissions. While CO2 emissions from anaerobic digestion were much less, only contributing to 15%–19% of total direct emissions. This is because under anaerobic conditions the degradation rate of biodegradable organic matter is much lower than aerobic conditions in fermentation. It suggests that aerobic condition was not only favorable for N2O emissions but also CO2 emissions during sludge treatment. Meanwhile, indirect emissions from electricity and transports during wastewater and sludge treatment and disposal in Figure 4b suggested that emission from electricity used for wastewater treatment significantly dominated the indirect GHG emissions, namely, 85%–99%. GHG emissions from electricity consumption during sludge anaerobic digestion, mainly for mixing and heating, were also significant, accounting for 10%–15% of total indirect GHG emissions, which is consistent with conclusions in previous studies that energy consumption in anaerobic digestion usually accounts for around 15% of total energy consumption in wastewater treatment [20]. It has to be noted that GHG emission offsets resulted from recovered electricity and heat from biogas CHP system contributed to 45%–68% of emissions reductions from energy consumption. Therefore, the results suggest that sludge anaerobic digestion is a very promising sludge treatment alternative to achieve energy recovery and lower carbon footprint. However, it should be realized that emission offsets from energy recovery in Oxygen Ditch were the lowest, 45% of reduction in indirect GHG emissions and SBR gained the highest emissions offsets, 68% of reduction in indirect GHG emissions. This is because electricity consumption for wastewater treatment was highest (1705 tCO2e/year) for Oxygen Ditch, while emission offsets from recovered energy was the lowest (855 tCO2e/year) for Oxygen Ditch due to its low sludge production and resulting biogas generation. Therefore, it could be concluded that sludge anaerobic digestion and energy recovery is less cost-effective and beneficial for Oxygen Ditch than that for SBR and A–A–O processes.
Figure 4. The most important contributors to carbon footprint: (a) Direct emissions from wastewater treatment and sludge treatment; and (b) Indirect emissions from energy consumption (electricity and transport fuels) in wastewater treatment and sludge treatment.
Water 07 00918 g004aWater 07 00918 g004b

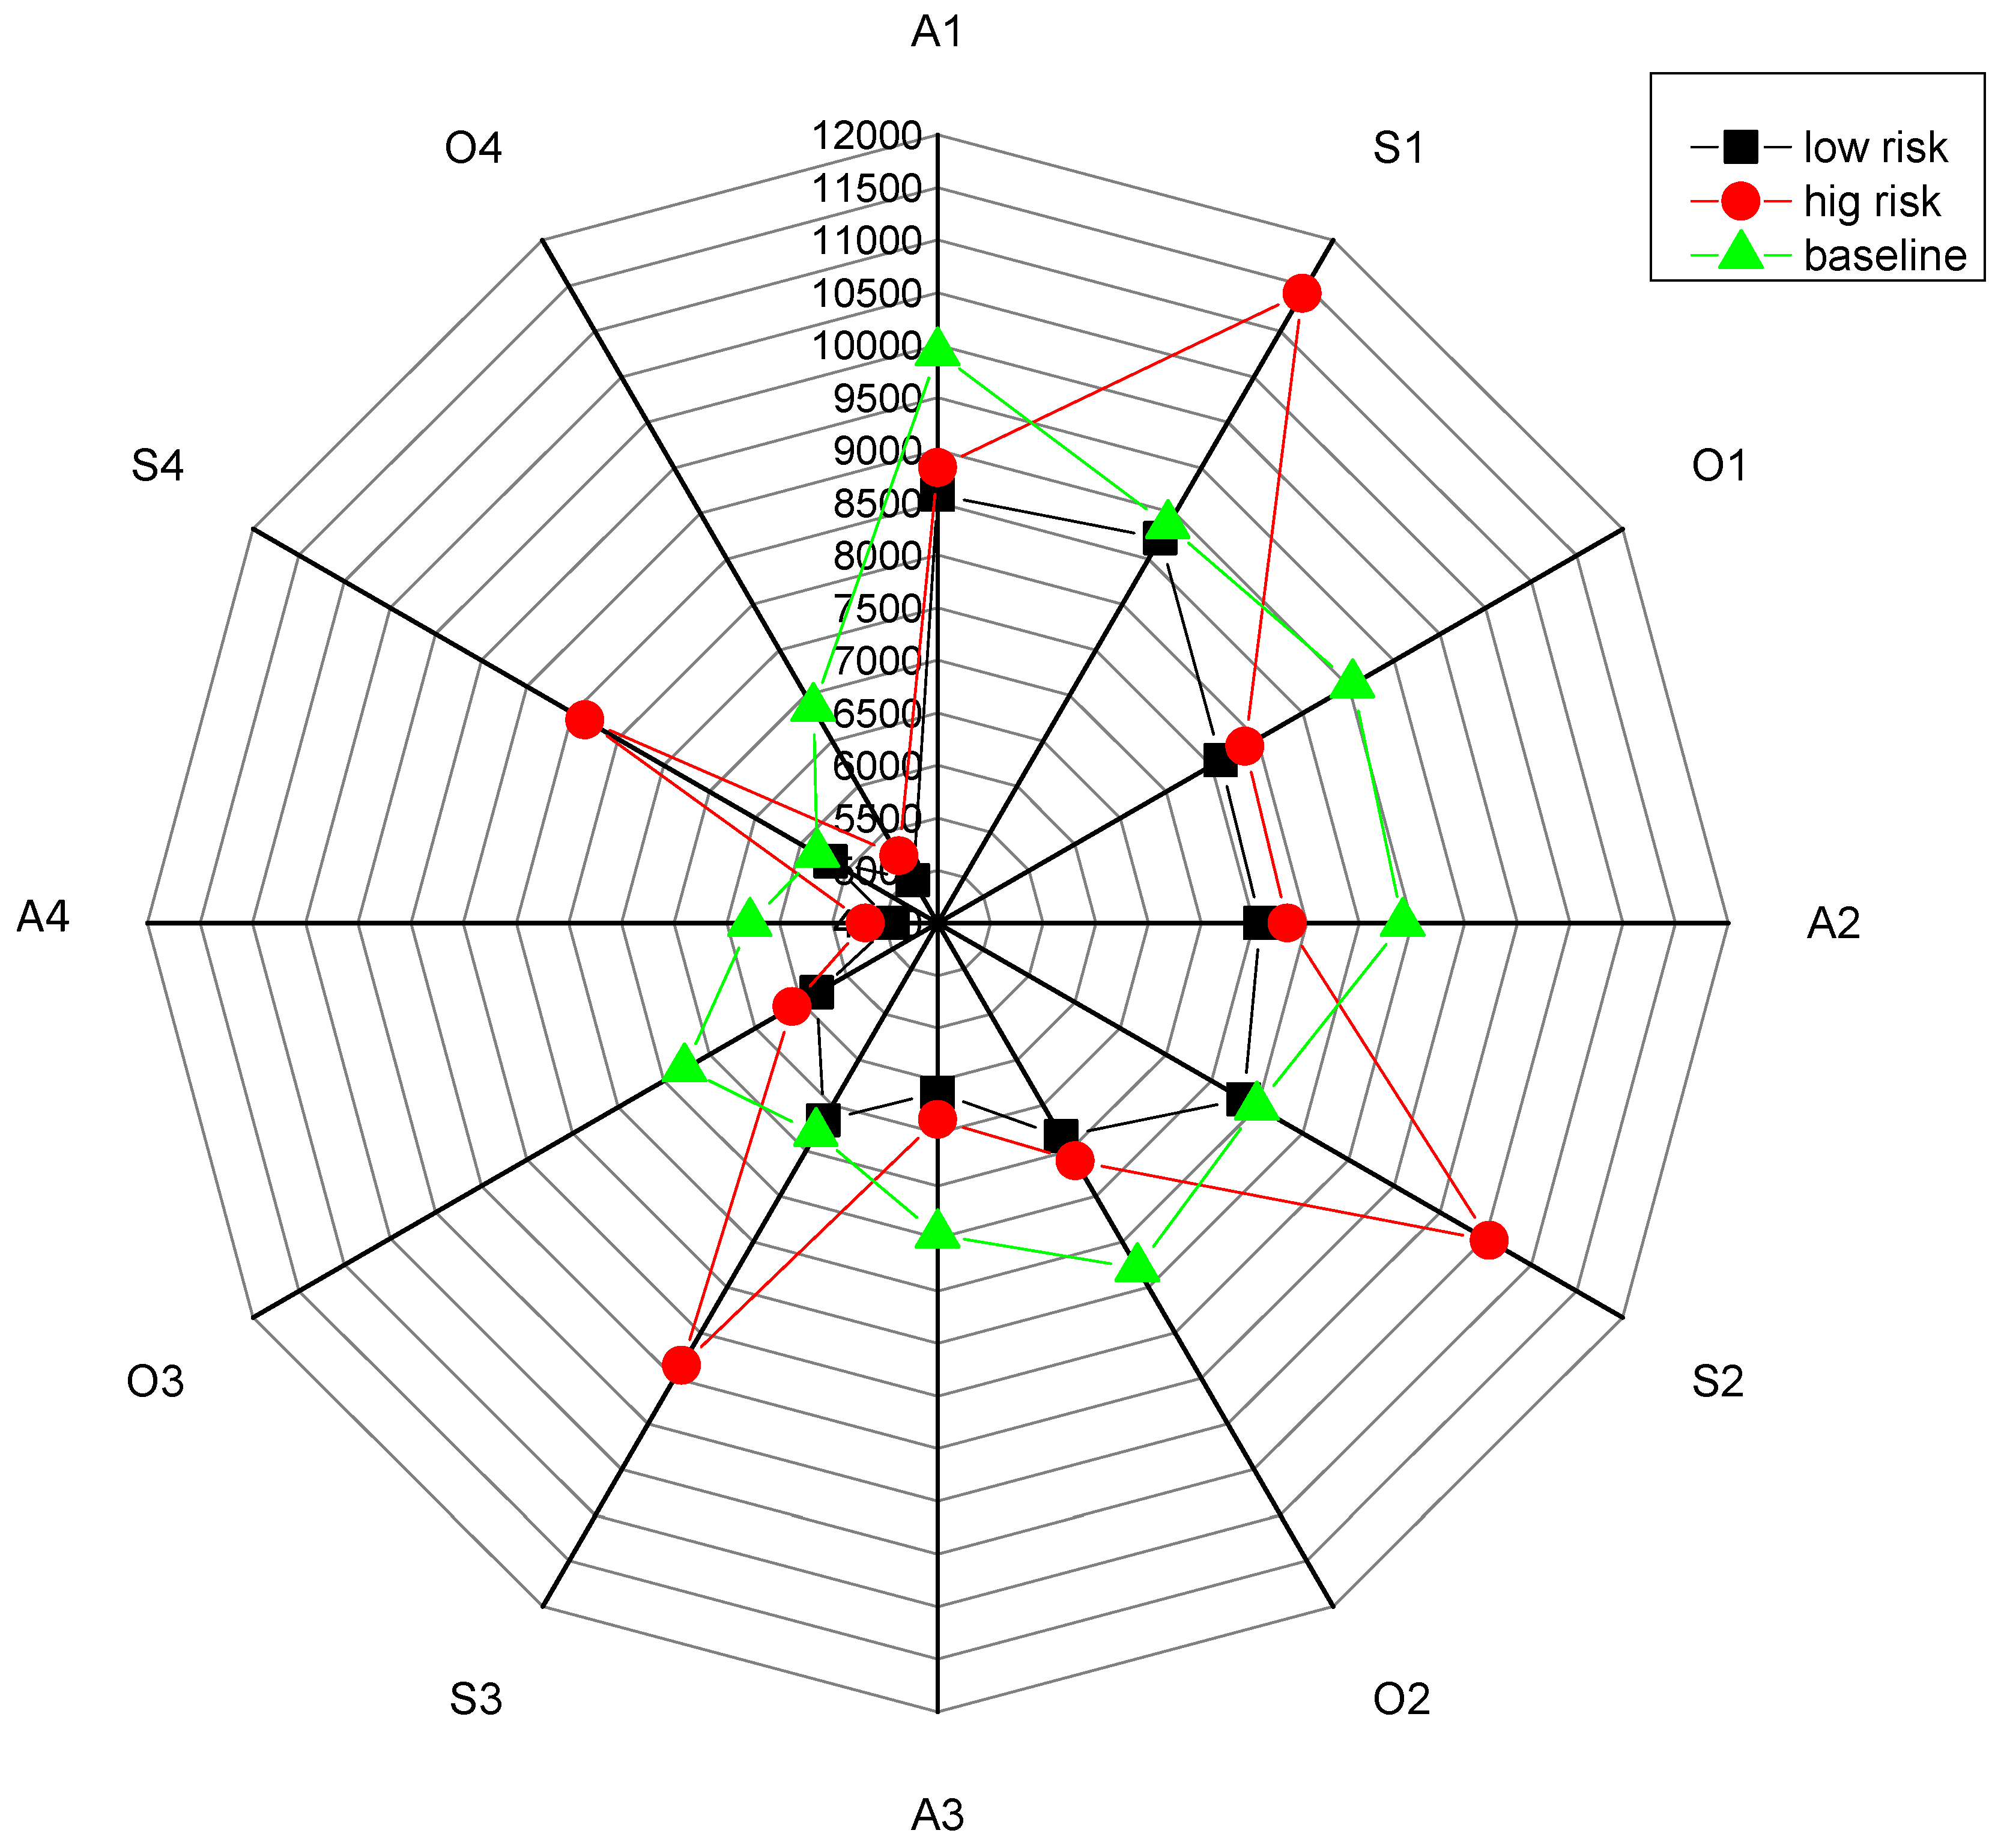
3.2. Emission Factors of N2O

As mentioned in Section 2.3, the consensus on the main mechanism of N2O emission during wastewater treatment has not yet been achieved and there are many process design parameters and operation conditions closely related to N2O emission, the emission factor selected in this study is based on an average value of the measurement of N2O emissions from seven full-scale biological nutrient removal (BNR) WWTPs in Australia [24]. The measurements found that particular design parameters, e.g., high mixed-liquor recycle (MLR) rates and low effluent TN concentrations, potentially influence the generation of N2O and higher MLR rates, and lower effluent TN concentrations were more likely to have higher and variable N2O generation factors. The design of low effluent TN concentration, influent flow balancing, high MLR rate, larger bioreactor volume, and long SRT is more likely to lead to complete denitrification, which could result in low and stable N2O emissions. For example, a high MLR rate tends to dilute the concentrations of all the intermediates of nitrification–denitrification, including nitrite ( NO 2 ) and nitric oxide (NO), thus reducing their inhibitory effect. In light of the possible N2O formation mechanisms, Foley, deHaas, Yuan and Lant [24] suggests that wastewater treatment process designed and operated for low effluent TN concentrations and that approach “ideal” well-mixed hydraulic conditions are expected to have relatively low N2O generation factors, and vice versa.
The design parameters of three wastewater treatment alternatives are listed in Table 4. It was found that the designed effluent TN concentrations were all set at 15 mg/L, thus may lead to partial denitrification. Oxygen Ditch had the highest MLR rate and SBR had the lowest MLR rate, which indicates that higher MLR rate in Oxygen Ditch is more likely to depress the inhibitory effect by intermediates and reduce N2O emissions than A–A–O and SBR. Besides, the wastewater treatment alternatives all had relatively long SRT (i.e., 18–22 days), which suggest relatively slow change in biomass inventory. It is suggested that plants that do not have a high degree of denitrification and approach more “plug flow” hydraulic conditions are more likely to occur nitrite accumulation and high N2O generation factors [24]. While SBR which operate timed process sequences is similar to plug flow continuous reactors, thus resulting in higher N2O generation factors. Therefore, in this study, Oxygen Ditch is at low risk of N2O emission, while SBR is at high risk of N2O generation. N2O generation factors from measurement of seven full-scale BNR WWTPs varied in the range 0.006–0.253 kg N2O-N/kg Ndenitrified with average value at 0.035 ± 0.027. In order to examine the influence on carbon footprint by different emission factors of N2O, the study employed two levels of assessment at “high risk” and “low risk” of N2O generation factors, together with the baseline estimation using a unified emission factor in abovementioned carbon footprint assessment. In the “low risk” estimation, the emission factors of N2O were selected as the average value of the data range for each of the alternatives measured in [24]. And for the “high risk” estimation, emission factors were determined as the maximum value of the data range, shown as in Table 2.
Table 4. Design parameters of three wastewater treatment alternatives and adjustment of N2O emission factor.
Treatment TechnologyEffluent TN (mg/L)MLR Rate (%)SRT (days)N2O Emission Factor (kg N2O-N/kg Ndenitrified) [24]N2O Emission Factor (kg N2O-N/kg Ndenitrified) BaselineN2O Emission Factor (kg N2O-N/kg Ndenitrified) High RiskN2O Emission Factor (kg N2O-N/kg Ndenitrified) Low Risk
A–A–O15200180.010–0.018 (ave. 0.014)0.0350.0180.014
SBR15150200.010–0.071 (ave. 0.033)0.0350.0710.033
Oxygen Ditch15300220.006–0.013 (ave. 0.008)0.0350.0130.008
After the adjustment, SBR with sludge direct landfill (S1) occupied the largest carbon footprints and A–A–O with sludge anaerobic digestion and energy recovery (A4) showed the lowest carbon footprints for both “low risk” and “high risk” estimation of N2O emission factors. As shown in Figure 5, compared with “baseline” estimation, carbon footprints of all treatment scenarios for “low risk” estimation were reduced, with scenario O4 reduced most of 28%. Therefore, in the “low risk” estimation, carbon footprint of O4 was more sensitive than other treatment scenarios in reducing carbon footprints. It is to be noted that except the scenarios with sludge anaerobic digestion and energy recovery, for other three sludge treatment and disposal alternatives (direct landfill, aerobic fermentation, anaerobic digestion and biogas combustion), SBR had the largest carbon footprint, A–A–O had the second largest carbon footprint, and Oxygen Ditch had the lowest carbon footprint. While for sludge anaerobic digestion and energy recovery, A–A–O was calculated for lowest carbon footprint due to its largest biogas production and recovered energy to avoid emissions from electricity and coal consumption, and Oxygen Ditch had the second largest carbon footprint and SBR still had the largest carbon footprint. While in the “high risk” estimation, due to the highest emission factor applied carbon footprint of SBR scenarios (S1, S2, S3 and S4) all increased significantly from the “baseline” level. Among them, carbon footprint of scenario S4 was increased most, namely, 43.8% from the level of baseline estimation. This is because N2O emissions in scenario S4 accounted for 42.6% of total emissions, the largest fraction among all the scenarios. Therefore, carbon footprint of S4 was very sensitive to N2O emission factor so that the control of N2O emissions in SBR is crucial for reducing its carbon footprint. In both estimations of N2O emission factors, scenario A4 displayed the lowest carbon footprint, which indicates its better performance on resilience to changes of N2O emission factors and leads the way to reduce overall carbon footprint of wastewater treatment and sludge treatment process.
Figure 5. Carbon footprints under different N2O emission factors at low risk, high risk and baseline estimation.
Water 07 00918 g005

3.3. Measures to be Taken for Reducing Carbon Footprint

Carbon neutrality or negative carbon footprint of WWTPs has been widely discussed and investigated. Theoretically, the energy contained in the wastewater is far beyond the energy required [3], thus carbon neutrality should be possible. Energy content in wastewater, in the form of chemical oxygen demand (COD), is usually converted into CO2 or CH4 and biosolids through either aerobic treatment or anaerobic treatment. Therefore, decreasing the degree of aerobic treatment and maximizing energy recovery from CH4 and biosolids are crucial to lower carbon footprint. From the perspective of energy consumption, anaerobic wastewater treatment is more favorable. However, municipal wastewater is characteristic of low temperature and low concentrations, which make it difficult for efficient anaerobic treatment. An efficient precipitation in pre-settlers with sludge anaerobic digestion could contribute to the decrease of the degree of subsequent aerobic treatment, by removing certain amount of COD and reducing CO2 emissions, and recover energy from CH4 by anaerobic digestion. Nevertheless, denitrification requires COD and addition of external carbon source can increase carbon footprint. Anaerobic hydrolysis of sludge produces a favorable carbon source which can be used as external carbon source for denitrification.
The N2O emissions from the wastewater treatment significantly affect the footprint of carbon emissions. Process design and operation condition can crucially have influences on the process of denitrification, thus determining the generation of N2O emissions [24,36]. Parameters of process design that can facilitate complete denitrification, i.e., low effluent TN concentration, high MLR rate, long SRT, and large reactor volume, can reduce the formation of N2O. Meanwhile, annamox process could lead to less energy consumption and reduce N2O emissions during the process. However, the dominant microbial of annamox preferred an environment of higher temperature, thus heat energy is required and a renewable energy source for heating is appropriate.
The rationale of reducing aerobic treatment and maximizing anaerobic treatment also applies to sludge treatment for reducing the carbon footprint. In this study, carbon footprints of sludge anaerobic digestion were much lower than sludge landfill and aerobic fermentation. In addition, the utilization of biogas generated from anaerobic digestion further contributed to offset GHG emissions by avoiding purchased electricity and coal for heating. Biogas production is also a key factor influencing the amount of recovered energy in the case of Oxygen Ditch, of which the characteristic of extended aeration resulted in less production of sludge fed into anaerobic digester. Therefore, improving biogas production and energy conversion efficiency is the subject of further research regarding their contribution to carbon emissions reduction.

3.4. Limitations

Although this study examined the carbon footprints of several mainstream wastewater treatment and sludge treatment technologies applied in Chinese WWTPs, several limitations exist and more research is needed for further study and application. First of all, because of the effect of scale economy, the results of carbon footprints in this study only apply to the studied treatment scale of 20,000 m3/day. Different treatment scales could lead to a disproportionate decrease or increase in emissions and energy consumption. Secondly, by using the process design data, this study does not take into consideration the impacts of operational conditions on carbon footprints. The operational condition is a dynamic process, and any change will influence the emission factors, energy consumption and chemicals consumption. Therefore, additional research needs to be conducted investigating carbon footprints under various operation conditions.

4. Conclusions

In order to investigate the carbon footprints of future mainstream WWTPs at the flow rate of 20,000 m3/day in China, 12 scenarios consisting of three wastewater treatment alternatives and four sludge treatment pathways were examined. The carbon footprints ranged from 5817–9928 t CO2e per year, with the lowest carbon footprint from SBR with sludge anaerobic digestion and energy recovery via CHP, and the largest carbon footprint was from A–A–O with sludge landfill. Sludge anaerobic digestion and biogas utilization with A–A–O, SBR and Oxygen Ditch helped to reduce the carbon footprints, by 37%, 34%, and 24%, respectively, from the sludge landfill scenarios. There were three significant sources for GHG emissions, namely, direct emissions of CO2 (22%–49%) from aerobic treatment of wastewater and sludge, direct N2O emissions (23%–43%) from wastewater treatment, and indirect emissions from electricity use (14%–28%). According to our study, CO2 emissions, although traditionally not taken into account, can be of similar importance to electricity-associated ones if 50% are supposed to not be of biogenic origin. Whether or not to include direct CO2 emissions in GHG accounting, is highly dependent on the sources of wastewater; the study results still highlighted that if no CO2 emissions are considered at all during GHG accounting of wastewater and sludge treatment, it could, at a high probability, introduce bias to the result. Although indirect emissions from construction materials (4%–6%) were not as significant as direct GHG emissions and emissions from electricity, they were much larger than indirect emissions from chemicals (0.07%–0.18%) and transports (0.1%–0.4%). As N2O emissions significantly influence the carbon footprint of wastewater treatment, emission factors of N2O need to be deliberately chosen. Since SBR operates in timed sequences, and is similar to plug flow continuous reactors which is likely to have relatively steep concentration gradients throughout the reactor, incomplete denitrification is more likely to occur, thus resulting in higher N2O emission factors. Therefore, the process design (i.e., effluent TN concentrations, MLR rates, SRT, reactor volume) and operation conditions (i.e., DO, nitrite concentration) are crucial for SBR to reduce N2O emissions. More detailed research and onsite measurement are therefore needed in the future to investigate N2O emission under different process configurations and operational conditions.

Acknowledgments

This work was supported by State Key Laboratory of Urban Water Resource and Environment (SKLUWRE), Harbin Institute of Technology (Grant No. 2013DX08) and by the National Natural Science Fund for Distinguished Young Scholars (Grant No. 51125033). The authors also acknowledged the supports from the Creative Research Groups of China (Grant No. 51121062). The research was also supported by the National Science & Technology Pillar Program during the Twelfth Five-Year Plan Period (Grant No. 2011BAD14B03) and International S&T Cooperation Program of China between China and Canada (Grant No. 2011DFG93360). This work was also partly funded by SKLUWRE Open Fund Project (Grant No. ESK201303). This research was sponsored by the grant PolyU 1-ZVBP from the Research Institute for Sustainable Urban Development, the Hong Kong Polytechnic University, Open Project (Grant No. ESK201303) from the State Key Laboratory of Urban Water Resource and Environment, Harbin Institute of Technology.

Author Contributions

Yujie Feng conceived the paper and Man Sing Wong contributed to analysis tools and proofreading; Chunyan Chai performed data analysis and wrote the paper; Dawei Zhang and Yanling Yu contributed to technical expertise on wastewater treatment and sludge treatment and disposal.

Conflicts of Interest

The authors declare no conflict of interest.

References

  1. OECD Economic Surveys: China 2013; OECD Publishing: Paris, France, 2013.
  2. Corominas, L.; Foley, J.; Guest, J.S.; Hospido, A.; Larsen, H.F.; Morera, S.; Shaw, A. Life cycle assessment applied to wastewater treatment: State of the art. Water Res. 2013, 47, 5480–5492. [Google Scholar] [CrossRef] [PubMed]
  3. Zhou, Y.Z.; Zhang, D.Q.; Le, M.T.; Puah, A.N.; Ng, W.J. Energy utilization in sewage treatment—A review with comparisons. J. Water Clim. Chang. 2013, 4, 1. [Google Scholar] [CrossRef]
  4. Sahely, H.R.; Monteith, H.D.; MacLean, H.L.; Bagley, D.M. Comparison of on-site and upstream greenhouse gas emissions from canadian municipal wastewater treatment facilities. J. Environ. Eng. Sci. 2006, 5, 405–415. [Google Scholar] [CrossRef]
  5. Technical Speification for Management of Municipal Wastewater Treatment Plant Operaion (HJ 2038–2014); Ministry of Environmental Protection of the People’s Republic of China, China Environmental Science Press: Beijing, China, 2014. (In Chinese)
  6. Second National Communication on Climate Change of the People’s Republic of China; Climate Change Division of National Development and Reform Commission of the People’s Republic of China, China Economic Press: Beijing, China, 2013. (In Chinese)
  7. Yu, J.; Tian, N.; Wang, K.; Ren, Y. Analysis and discussion of sludge disposal and treatment of sewage treatment plants in China. Chin. J. Environ. Eng. 2007, 1, 5. (In Chinese) [Google Scholar]
  8. Wang, X.; Liu, J.; Ren, N.Q.; Yu, H.Q.; Lee, D.J.; Guo, X. Assessment of multiple sustainability demands for wastewater treatment alternatives: A refined evaluation scheme and case study. Environ. Sci. Technol. 2012, 46, 5542–5549. [Google Scholar] [CrossRef] [PubMed]
  9. De Haas, D.; Foley, J.; Barr, K. Greenhouse gas inventories from WWTPs—The trade-off with nutrient removal. In Sustainability 2008 Green Practices for the Water Environment; Water Environment Federation: National Harbor, MD, USA, 2008. [Google Scholar]
  10. Gustavsson, D.J.; Tumlin, S. Carbon footprints of scandinavian wastewater treatment plants. Water Sci. Technol. 2013, 68, 887–893. [Google Scholar] [CrossRef] [PubMed]
  11. Zhang, Q.H.; Wang, X.C.; Xiong, J.Q.; Chen, R.; Cao, B. Application of life cycle assessment for an evaluation of wastewater treatment and reuse project—Case study of Xi’an, China. Bioresour. Technol. 2010, 101, 1421–1425. [Google Scholar] [CrossRef] [PubMed]
  12. Mo, W.; Zhang, Q. Can municipal wastewater treatment systems be carbon neutral? J. Environ. Manag. 2012, 112, 360–367. [Google Scholar] [CrossRef]
  13. De Haas, D.W.; Pepperell, C.; Foley, J. Perspective on greenhouse gas emission estimates based on australian wastewater treatment plant operating data. Water Sci. Technol. 2014, 69, 451–463. [Google Scholar]
  14. Suh, Y.-J.; Rousseaux, R. An lca of alternative wastewater sludge treatment scenarios. Resour. Conserv. Recycl. 2002, 35, 10. [Google Scholar]
  15. Liu, B.; Wei, Q.; Zhang, B.; Bi, J. Life cycle ghg emissions of sewage sludge treatment and disposal options in tai lake watershed, china. Sci. Total Environ. 2013, 447, 361–369. [Google Scholar] [CrossRef] [PubMed]
  16. Cao, Y.; Pawlowski, A. Life cycle assessment of two emerging sewage sludge-to-energy systems: Evaluating energy and greenhouse gas emissions implications. Bioresour. Technol. 2013, 127, 81–91. [Google Scholar] [CrossRef] [PubMed]
  17. Griffith, D.R.; Barnes, R.T.; Raymond, P.A. Inputs of fossil carbon from wastewater treatment plants to U.S. rivers and oceans. Environ. Sci. Technol. 2009, 43, 5. [Google Scholar] [CrossRef]
  18. Law, Y.; Jacobsen, G.E.; Smith, A.M.; Yuan, Z.; Lant, P. Fossil organic carbon in wastewater and its fate in treatment plants. Water Res. 2013, 47, 5270–5281. [Google Scholar] [CrossRef] [PubMed]
  19. Rodriguez-Garcia, G.; Hospido, A.; Bagley, D.M.; Moreira, M.T.; Feijoo, G. A methodology to estimate greenhouse gases emissions in life cycle inventories of wastewater treatment plants. Environ. Impact Assess. Rev. 2012, 37, 37–46. [Google Scholar] [CrossRef]
  20. Chen, S.; Chen, B. Net energy production and emissions mitigation of domestic wastewater treatment system: A comparison of different biogas-sludge use alternatives. Bioresour. Technol. 2013, 144, 296–303. [Google Scholar] [CrossRef] [PubMed]
  21. Doorn, M.R.J.; Towprayoon, S.; Vieira, S.M.M.; Irving, W.; Palmer, C.; Pipatti, R.; Wang, C. Chapter 6 Wastewater Treatment and Emissions; Intergovernmental Panel on Climate Change: New York, NY, USA, 2006. [Google Scholar]
  22. Average CO2 Emission Factors of Regional Electric Grids in China during 2011 and 2012; National Development and Reform Commission of People’s Republic of China, Climate Change Division: Beijing, China, 2014. (In Chinese)
  23. Cakir, F.Y.; Stenstrom, M.K. Greenhouse gas production: A comparison between aerobic and anaerobic wastewater treatment technology. Water Res. 2005, 39, 4197–4203. [Google Scholar] [CrossRef] [PubMed]
  24. Foley, J.; de Haas, D.; Yuan, Z.; Lant, P. Nitrous oxide generation in full-scale biological nutrient removal wastewater treatment plants. Water Res. 2010, 44, 831–844. [Google Scholar] [CrossRef] [PubMed]
  25. Foley, J.; Lant, P. Fugitive greenhouse gas emissions from wastewater treatment. Water J. Aust. Water Assoc. 2008, 38, 6. [Google Scholar]
  26. Brown, S.; Beecher, N.; Carpenter, A. Calculator tool for determining greenhouse gas emissions for biosolids processing and end use. Environ. Sci. Technol. 2010, 44, 7. [Google Scholar] [CrossRef]
  27. Carr, M. Reducing Greenhouse Gas Emissions Industrial Biotechnology And Biorefining. In 2007 Taiwan International Chemical Industry Forum; Taiwan Chemical Industry Association: Taipei, Taiwan, 2007. [Google Scholar]
  28. Sharaai, A.H.; Mahmood, N.Z.; Sulaiman, A.H. Life cycle impact assessment (LCIA) using the ecological scaricity (ecopoints) method: A potential impact analysis to potable water production. World Applied Sci. J. 2010, 11, 12. [Google Scholar]
  29. MOHUD. Municipal Projects Investment Estimation Index Book IV Drainage Project; China Planning Press: Beijing, China, 2008. [Google Scholar]
  30. Hammond, G.; Jones, C. Inventory of Carbon and Energy (ICE) Version 1.6a; University of Bath: Bath, UK, 2008. Available online: www.bath.ac.uk/mech-eng/sert/embodied/ (accessed on 13 November 2014).
  31. Lu, H.; Price, L. China’s industrial carbon dioxide emissions in manufacturing subsectors and in selected provinces. Proceeedings of ECEEE Industrial Summer Study; Lawrence Berkeley National Laboratory: Berkeley, CA, USA, 2013. Available online: http://escholarship.org/uc/item/917755dp (accessed on 15 November 2014).
  32. China Energy Statistical Yearbook 2013; National Bureau of Statistics of the People’s Republic of China, China Statistics Press: Beijing, China, 2013.
  33. Revised 1996 IPCC Guidelines for National Greenhouse Gas Inventories: Energy Workbook (Volume 2); Intergovernmental Panel on Climate Change (IPCC): New York, NY, USA, 1997.
  34. Revised 1996 IPCC Guidelines for National Greenhouse Gas Inventories: Reference Manual (Volume 3); Intergovernmental Panel on Climate Change (IPCC): New York, NY, USA, 1997.
  35. Monteith, H.D.; Sahely, H.R.; MacLean, H.L.; Bagley, D.M. A rational procedure for estimation of greenhouse-gas emissions from municipal wastewater treatment plants. Water Environ. Res. 2005, 77, 390–403. [Google Scholar] [CrossRef] [PubMed]
  36. Kampschreur, M.J.; Temmink, H.; Kleerebezem, R.; Jetten, M.S.; van Loosdrecht, M.C. Nitrous oxide emission during wastewater treatment. Water Res. 2009, 43, 4093–4103. [Google Scholar] [CrossRef] [PubMed]

