
Water Discharge and Sediment Load Changes in China: Change Patterns, Causes, and Implications

Abstract
:1. Introduction
2. Data and Methodology
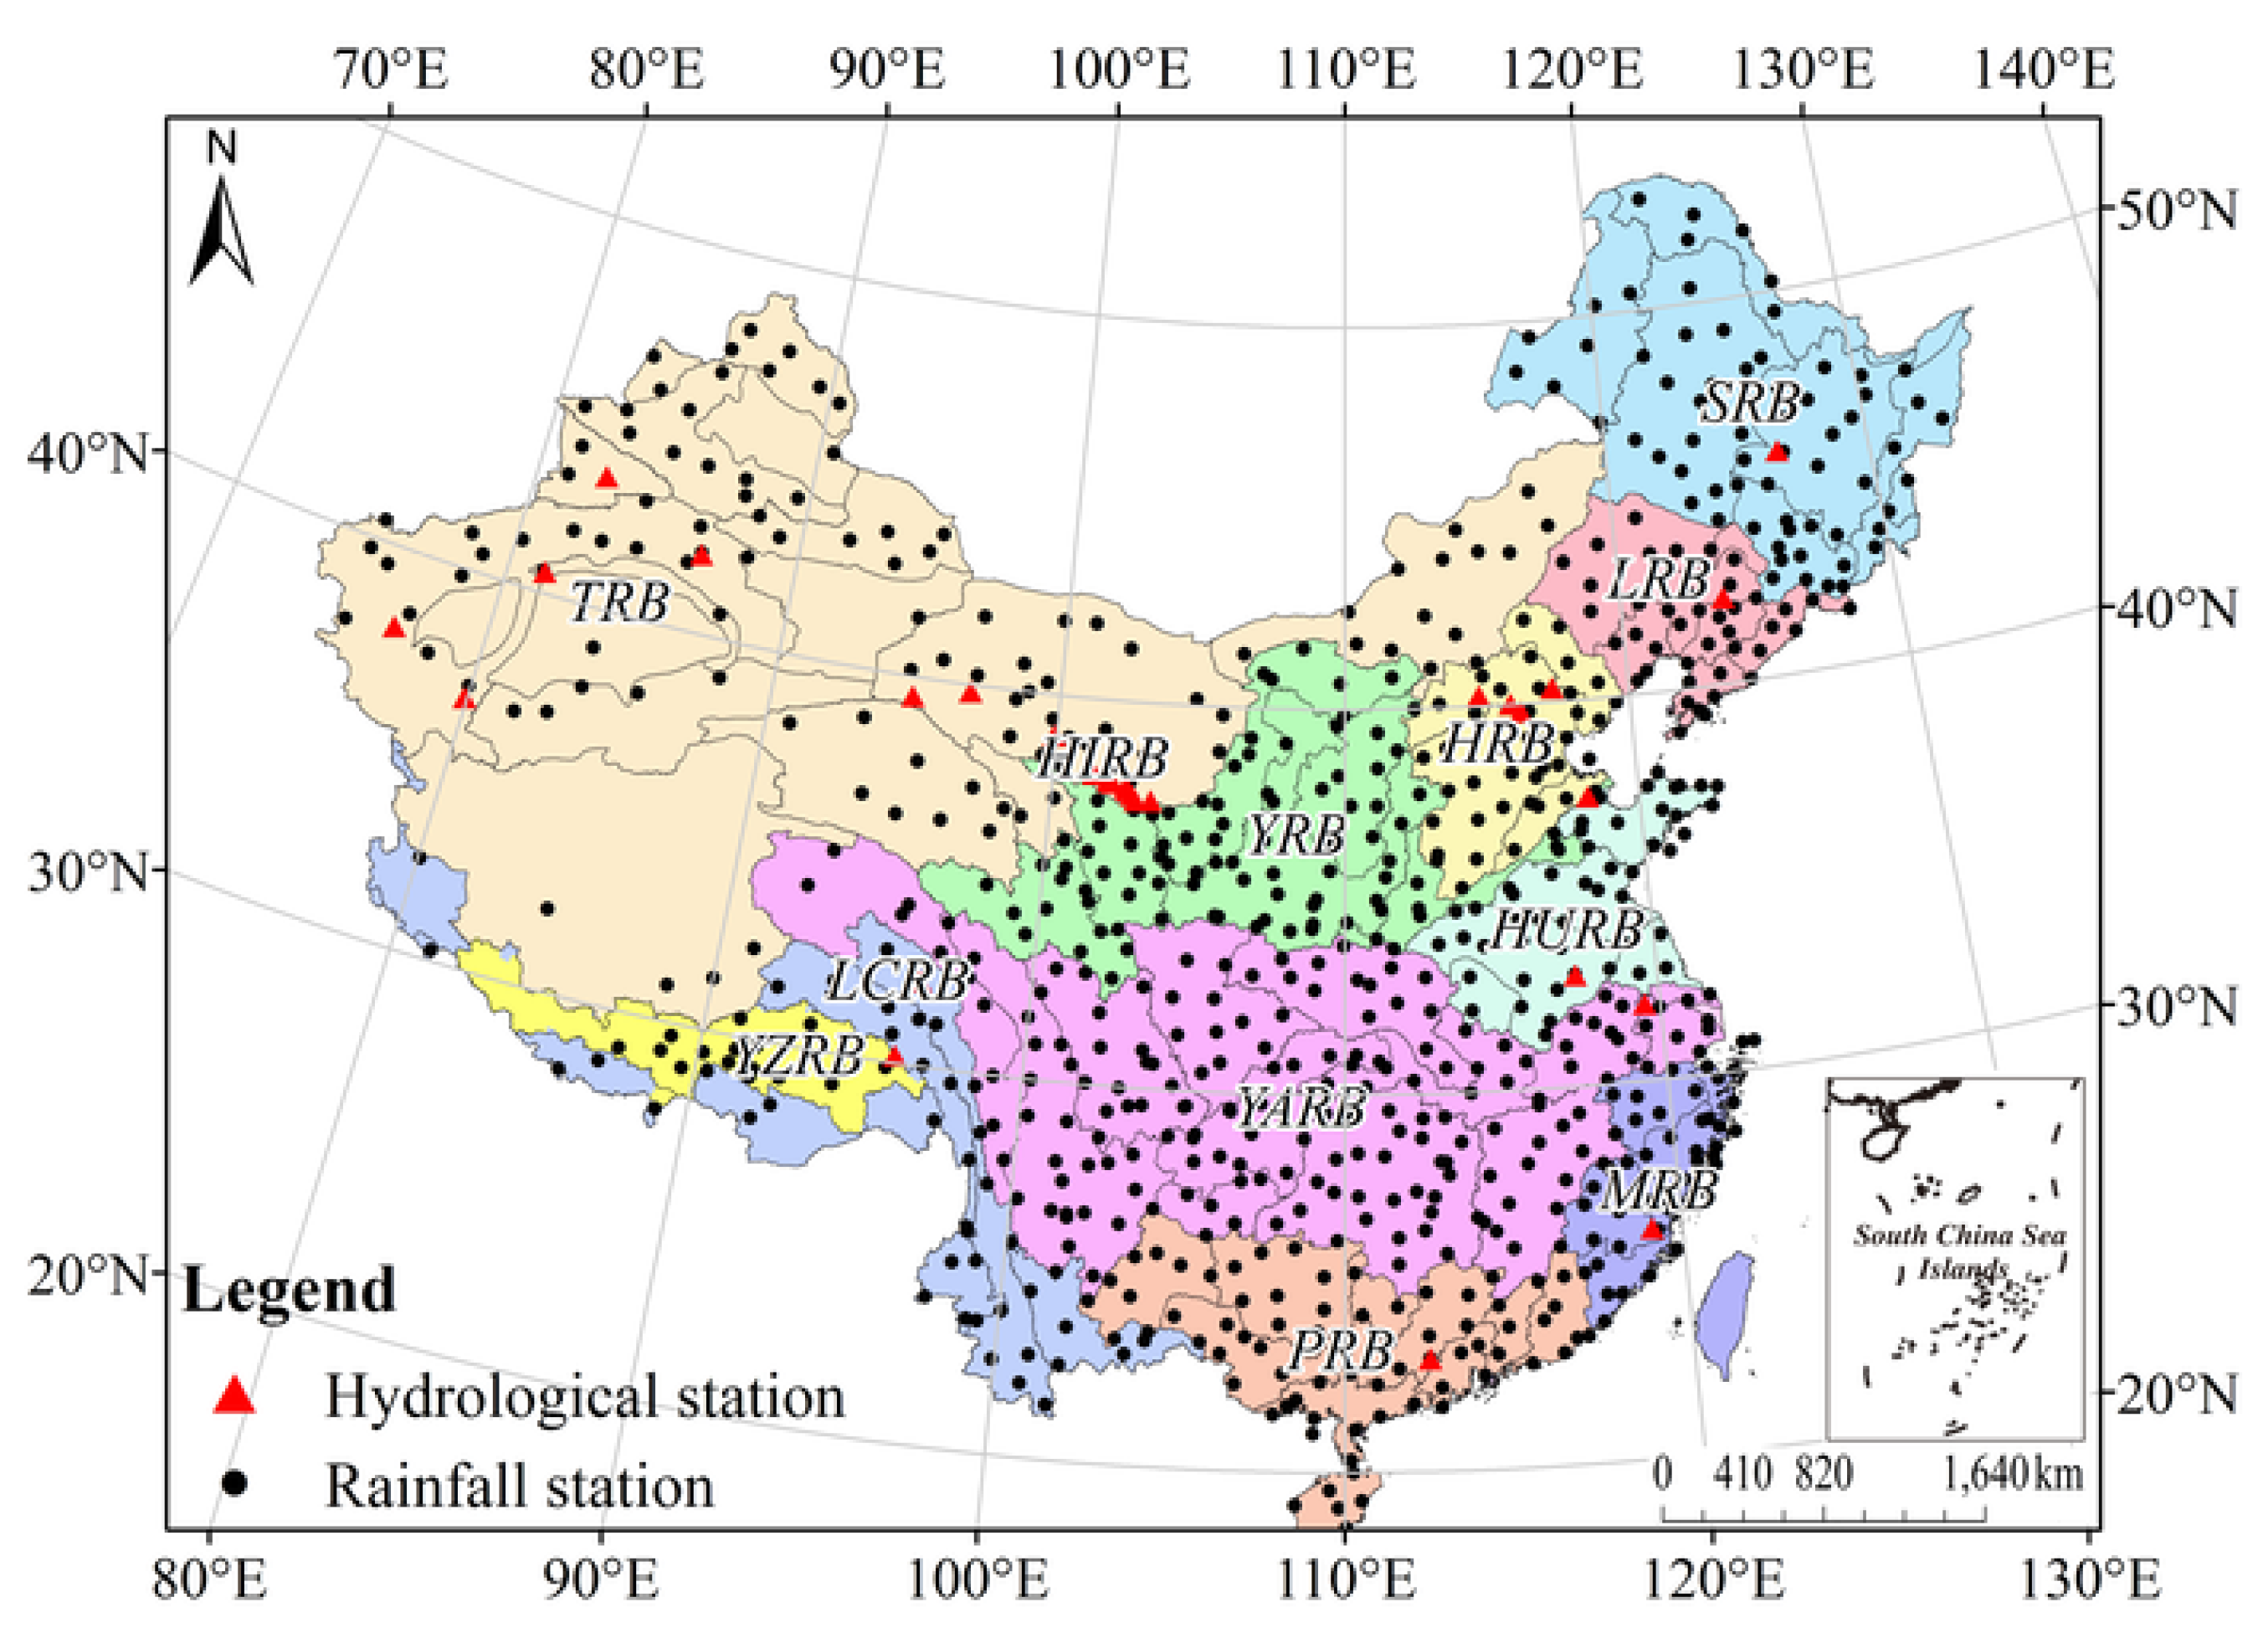
2.1. Data Collection and Processing

| ID | Gauge Station | Basin (Abbreviation) | Location | Longitude (N°) | Latitude (E°) | DA (km2) | Time Span |
|---|---|---|---|---|---|---|---|
| 1 | Lijin | Yellow River Basin (YRB) | Mainstream | 118°15′ | 37°29′ | 752,032 | 1952–2012 |
| 2 | Datong | Yangtze River Basin (YARB) | Mainstream | 117°03′ | 32°37′ | 1,705,383 | 1950–2012 |
| 3 | Wujiadu | Huai River Basin (HURB) | Mainstream | 117°23′ | 32°54′ | 121,330 | 1950–2011 |
| 4 | Zhangjiafen | Hai River Basin (HRB) | Bai River | 116°10′ | 39°48′ | 8506 | 1954–2011 |
| 5 | Xiahui | Chao River | 117°18′ | 40°22′ | 5340 | 1961–2011 | |
| 6 | Shixiali | Sanggan River | 114°43′ | 40°16′ | 23,944 | 1952–2011 | |
| 7 | Xiangshuipu | Yang River | 109°40′ | 38°01′ | 14,507 | 1952–2011 | |
| 8 | Yanling | Yongding River | 115°49′ | 40°01′ | 43,674 | 1952–2011 | |
| 9 | Haerbin | Songhua River Basin (SRB) | Mainstream | 126°32′ | 45°48′ | 389,769 | 1955–2012 |
| 10 | Tieling | Liao River Basin (LRB) | Mainstream | 123°43′ | 42°13′ | 120,764 | 1954–2012 |
| 11 | Gaoyao | Pearl River Basin (PRB) | Xi River | 112°27′ | 23°01′ | 351,535 | 1957–2011 |
| 12 | Zhuqi | Southeast Rivers Basin (Min River Basin, MRB) | Mainstream | 119°06′ | 26°08′ | 54,500 | 1950–2011 |
| 13 | Nuxia | Southwestern Rivers Basin (Yarlung Zangbo River, YZRB) | Mainstream | 95°05′ | 31°17′ | 191,235 | 1956–2009 |
| 14 | Xiangda | Southwestern Rivers Basin (Lancang River Basin, LCRB) | Mainstream | 96°28′ | 32°12′ | 17,909 | 1956–2012 |
| 15 | Dajingxia Reservoir | Hexi Inland River Basin (HIRB) | Dajing River | 103°24′ | 37°28′ | 68,300 | 1961–2010 |
| 16 | Gulang | Gulang River | 102°52′ | 37°27′ | 1961–2010 | ||
| 17 | Huangyanghe Reservoir | Huangyang River | 102°44′ | 37°35′ | 1961–2010 | ||
| 18 | Zamusi | Zamu River | 102°34′ | 37°42′ | 1961–2010 | ||
| 19 | Nanying Reservoir | Jinta River | 102°31′ | 37°48′ | 1961–2010 | ||
| 20 | Jiutiaoling | Xiying River | 102°03′ | 37°52′ | 1961–2010 | ||
| 21 | Shagousi | Dongda River | 101°55′ | 37°58′ | 1961–2010 | ||
| 22 | Xidahe Reservoir | Xida River | 101°23′ | 38°03′ | 1961–2010 | ||
| 23 | Changmapu | Shule River | 96°51′ | 39°49′ | 1961–2010 | ||
| 24 | Dangchengwan | Dang River | 94°53′ | 39°30′ | 1961–2010 | ||
| 25 | Yingluoxia | Hei River | 99°55′ | 38°57′ | 1961–2010 | ||
| 26 | Binggou | Beida River | 101°56′ | 37°54′ | 1961–2010 | ||
| 27 | Kaqun | Xinjiang Inland River Basin (Tarim River Basin, TRB) | Yeerqiang River | 76°54′ | 37°59′ | 50,248 | 1957–2011 |
| 28 | Tongguziluoke | Yulongkashi River | 79°55′ | 36°49′ | 14,575 | 1957–2011 | |
| 29 | Yanqi | Kaidu River | 86°34′ | 42°02′ | 22,516 | 1957–2011 | |
| 30 | Alaer | Mainstream | 81°19′ | 40°32′ | 127,900 | 1957–2011 |
2.2. Methodology
2.2.1. Mann–Kendall Test for Monotonic Trend
2.2.2. Modified Mann–Kendall Test (Mann–Kendall Test with Trend-Free Pre-whitening)
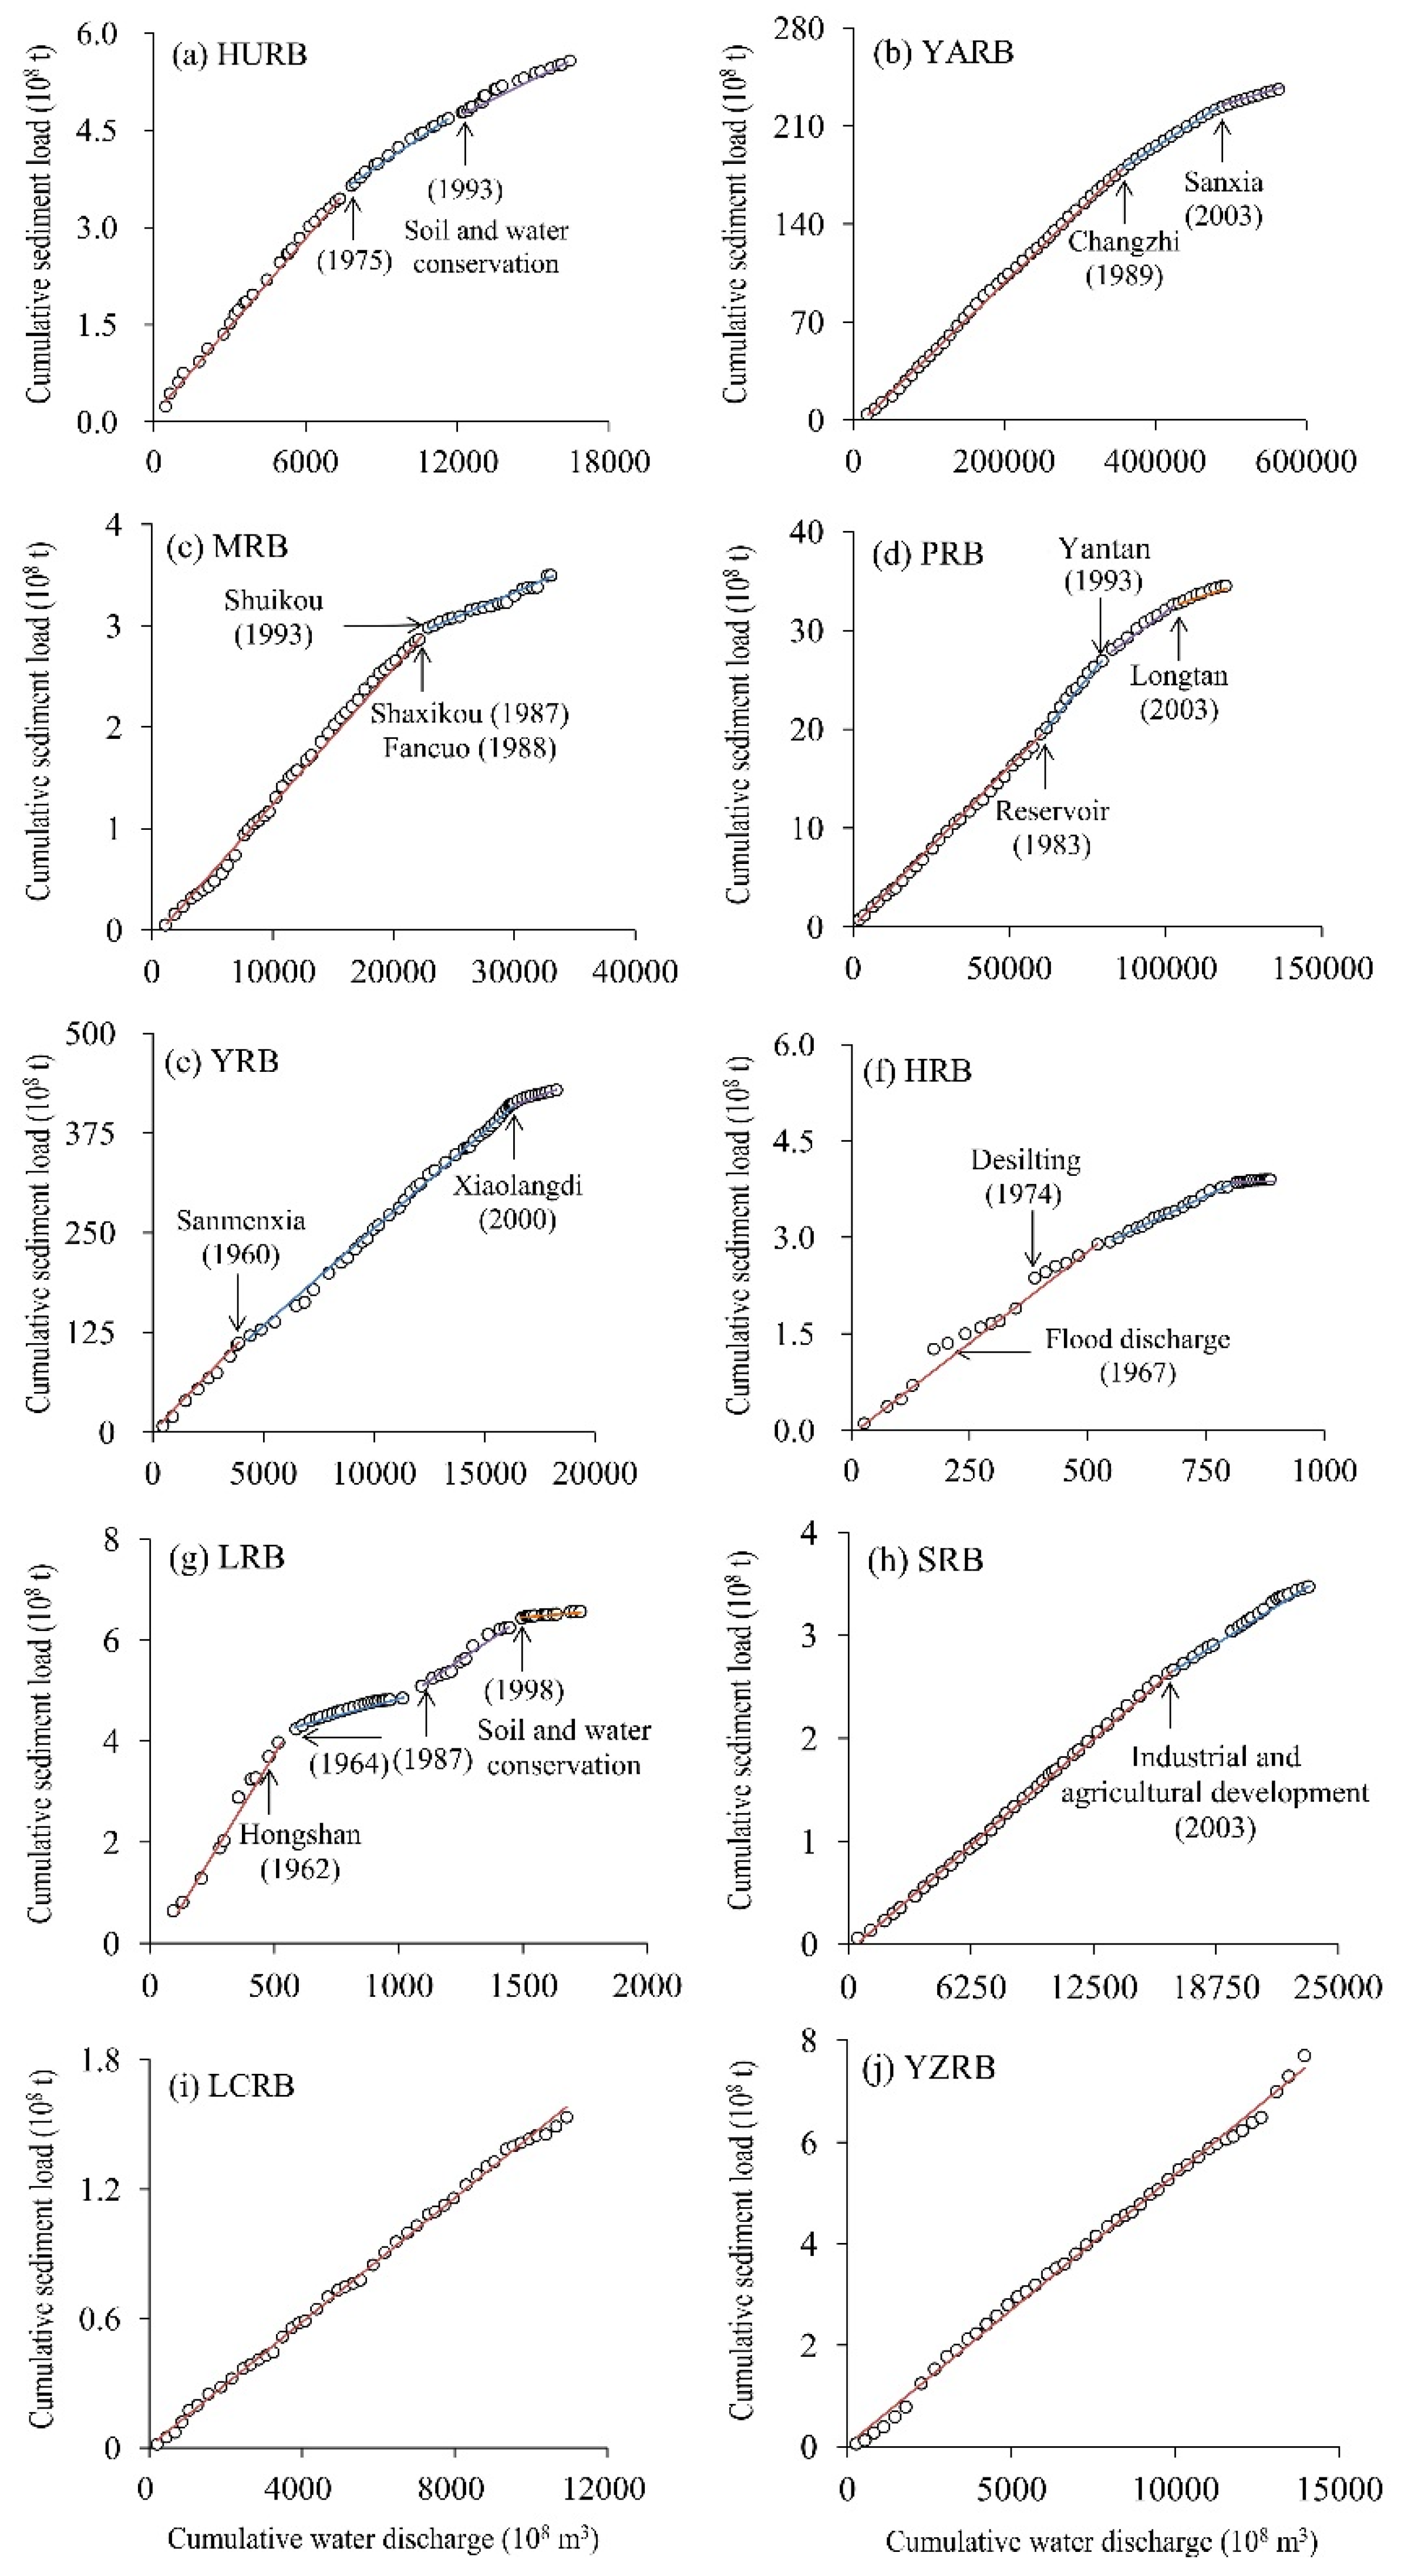
2.2.3. Double Mass Curve
3. Variation of Streamflow and Sediment Load
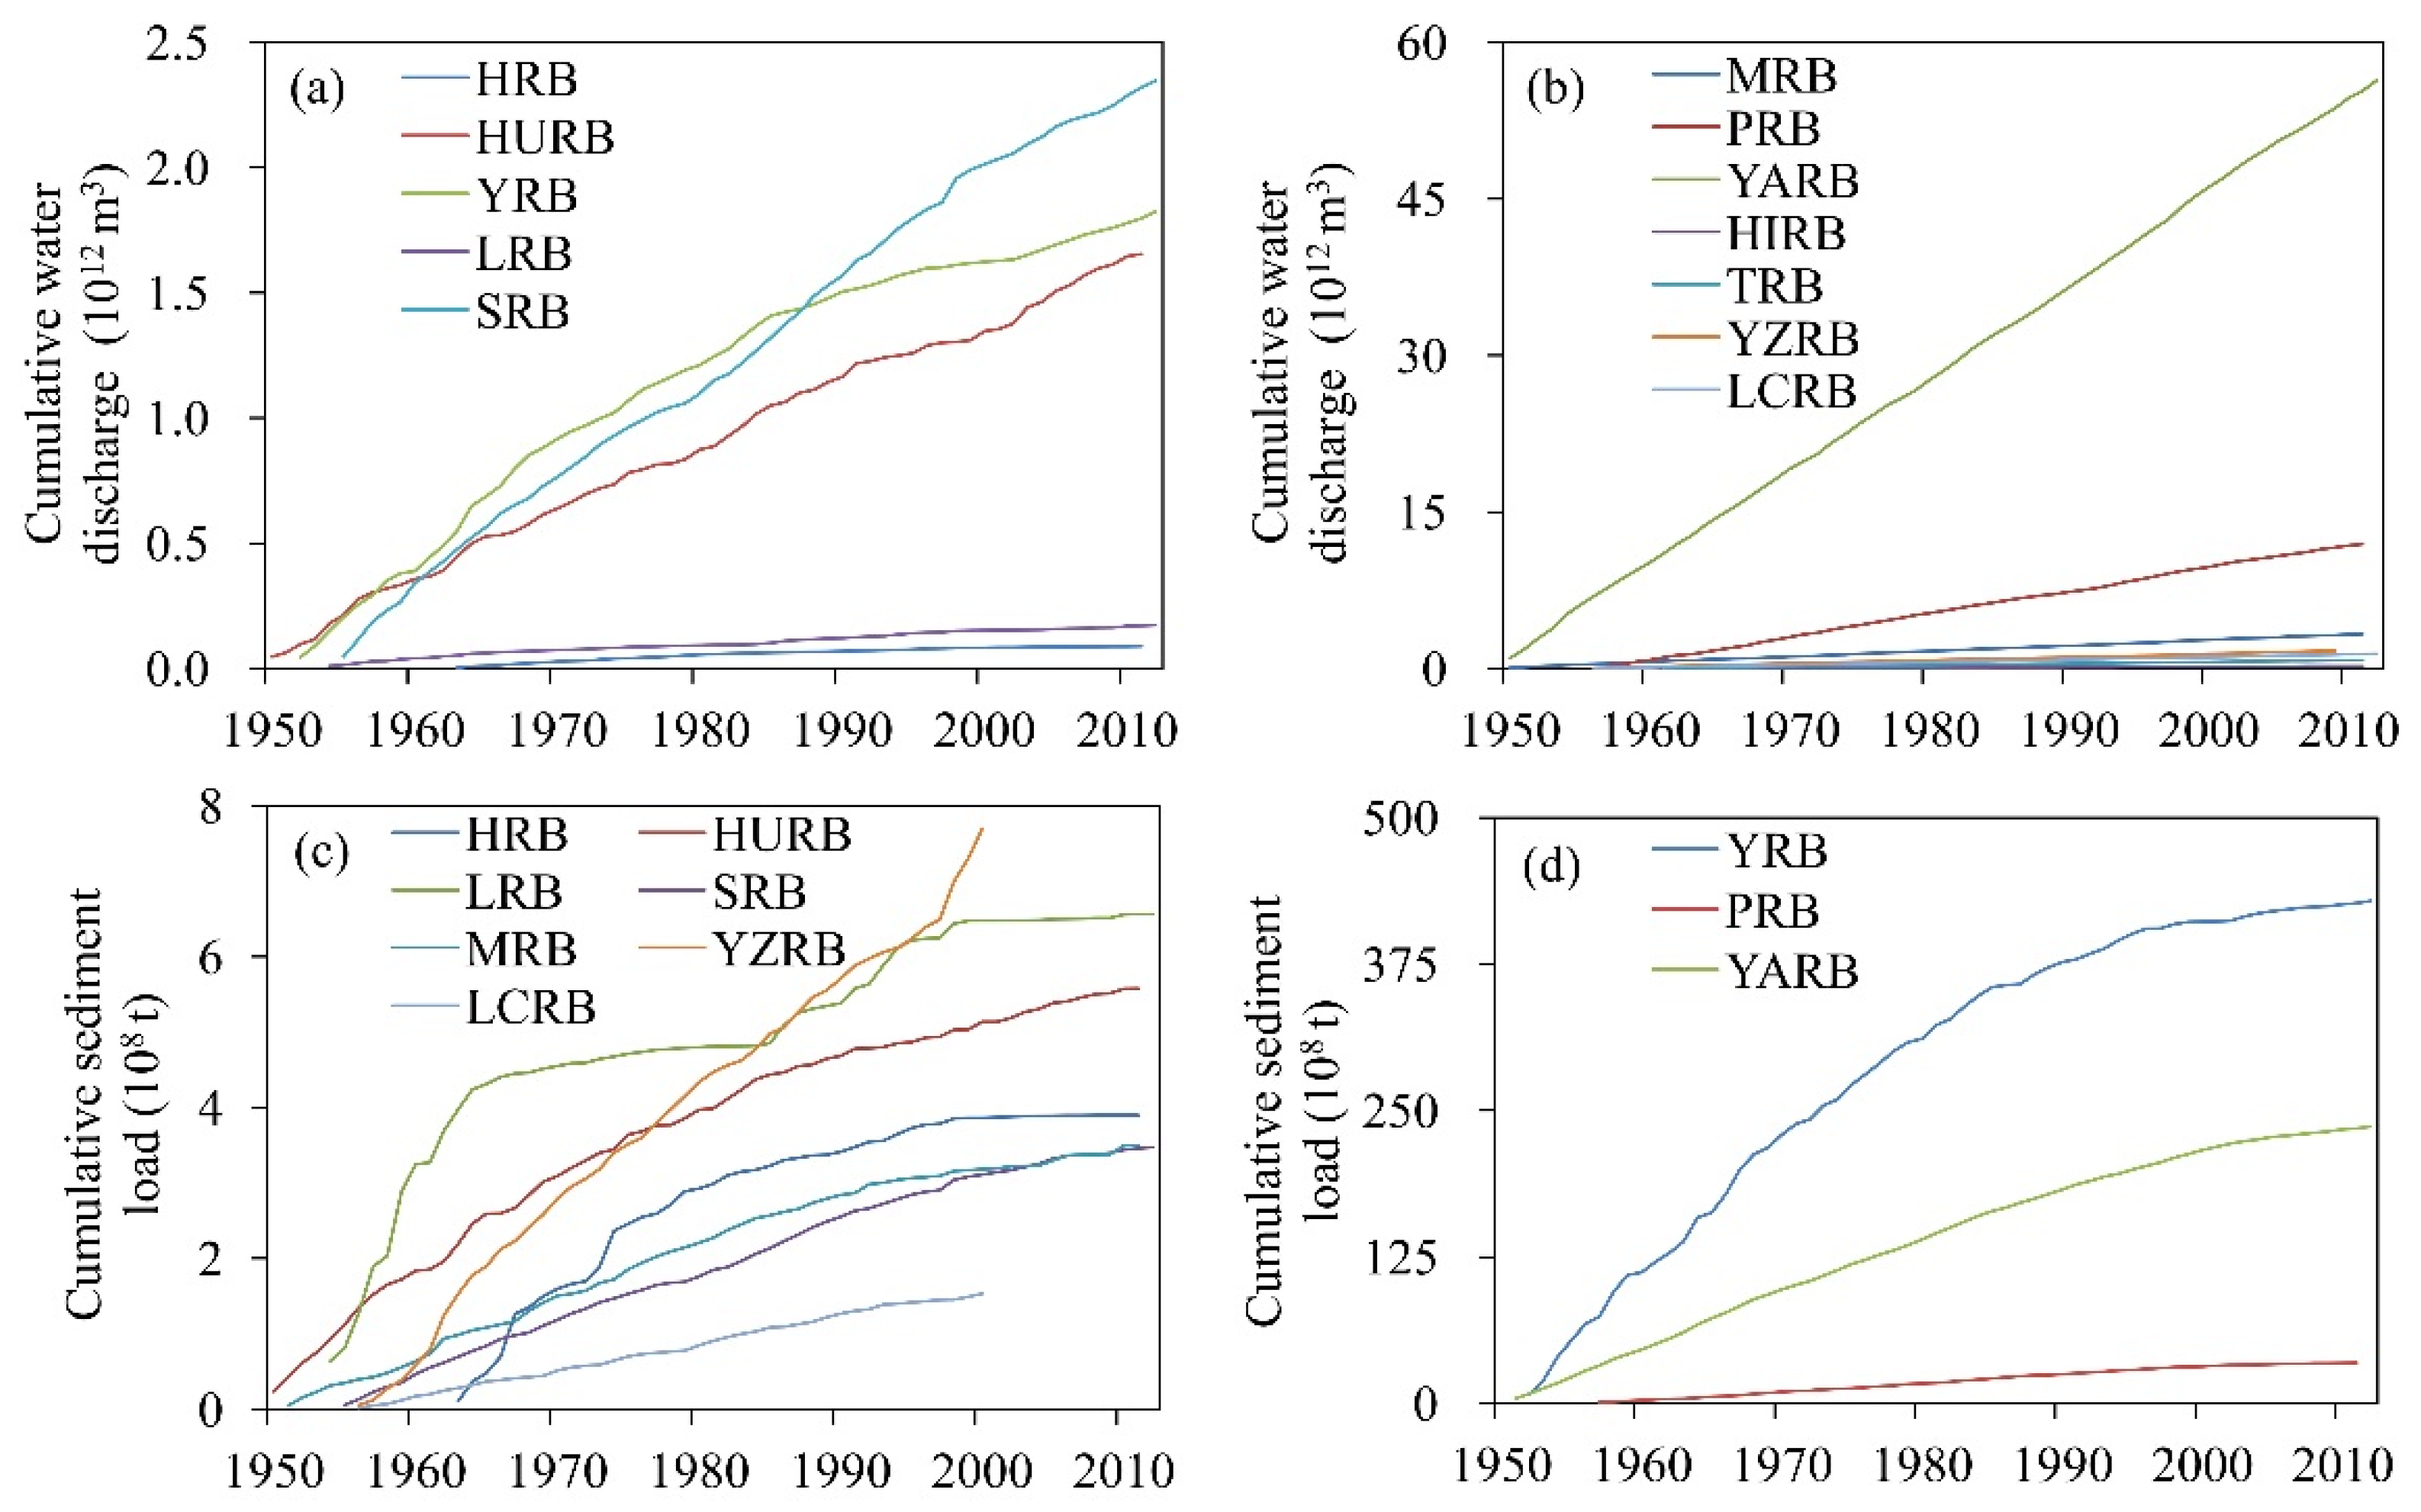
3.1. Overall Change of Streamflow
| Basins | Water Discharge (108 m3) | Sediment Load (104 t) |
|---|---|---|
| HRB | 18.1 | 795.1 |
| HURB | 266.9 | 881.4 |
| YRB | 299.2 | 76,655 |
| LRB | 29.3 | 1112.9 |
| SRB | 404.7 | 598.8 |
| MRB | 532.7 | 573.3 |
| PRB | 2166.4 | 6274.6 |
| YARB | 8944.8 | 40791 |
| HIRB | 44.0 | – |
| TRB | 157.3 | – |
| YZRB | 312.5 | 1710.4 |
| LCRB | 247.3 | 341.0 |
3.2. Overall Change in Sediment Load

| Basins | Change in Water Discharge (%) | Change in Sediment Load (%) | ||||||
|---|---|---|---|---|---|---|---|---|
| 1970s | 1980s | 1990s | 2000s | 1970s | 1980s | 1990s | 2000s | |
| HRB | –18.6 | –55.9 | –56.4 | –84.6 | –35.0 | –77.5 | –77.2 | –98.7 |
| HURB | –27.8 | 0.1 | –45.5 | –6.5 | –43.4 | –46.8 | –73.7 | –69.6 |
| YRB | –36.4 | –41.5 | –71.2 | –67.5 | –26.0 | –47.3 | –67.8 | –88.7 |
| LRB | –56.9 | –36.8 | –27.3 | –62.8 | –90.2 | –80.3 | –59.9 | –97.6 |
| SRB | –31.6 | –2.9 | –4.6 | –43.4 | –21.3 | 7.7 | –19.6 | –59.4 |
| MRB | –1.7 | –2.6 | 4.2 | –5.4 | –1.6 | –13.4 | –49.0 | –63.4 |
| PRB | 11.2 | –4.0 | 13.3 | –6.4 | 10.9 | 14.7 | 4.4 | –59.1 |
| YARB | –6.1 | –0.9 | 5.8 | –5.7 | –13.0 | –10.9 | –29.7 | –63.1 |
| YZRB | –6.6 | –14.2 | –4.5 | 5.2 | –14.9 | –24.0 | –5.2 | – |
| LCRB | –1.4 | 19.3 | 1.7 | 14.1 | 5.7 | 39.4 | –14.4 | – |
| Basins | Water Discharge (108 m3) | Sediment Load (104 t) | ||||
|---|---|---|---|---|---|---|
| Slope | Z | Significance | Slope | Z | Significance | |
| HRB | −0.69 | −6.96 ** | P < 0.001 | −46.96 | −6.73 ** | P < 0.001 |
| HURB | −1.50 | −1.49 | P > 0.1 | −25.35 | −5.42 ** | P < 0.001 |
| YRB | −7.25 | −6.01 ** | P < 0.001 | −2300 | −6.58 ** | P < 0.001 |
| LRB | −0.48 | −3.2 * | P < 0.01 | −55.33 | −4.90 ** | P < 0.001 |
| SRB | −3.32 | −3.37 ** | P < 0.001 | −8.44 | −4.11 ** | P < 0.001 |
| MRB | −0.53 | −0.58 | P > 0.1 | −9.74 | −4.10 ** | P < 0.001 |
| PRB | −2.04 | −0.98 | P > 0.1 | −77.49 | −3.31 ** | P < 0.001 |
| YARB | −5.72 | −0.36 | P > 0.1 | −6000 | −6.73 ** | P < 0.001 |
| HIRB | 0.16 | 2.81 * | P < 0.01 | − | − | − |
| TRB | 0.10 | 0.80 | P > 0.1 | − | − | − |
| YZRB | 0.20 | 0.40 | P > 0.1 | 6.12 | 0.47 | P > 0.1 |
| LCRB | 0.61 | 1.58 | P > 0.1 | −0.96 | −0.67 | P > 0.1 |
3.3. Pattern of Changes in Streamflow and Sediment Load
3.3.1. Streamflow Remained Stable and Sediment Load Reduced
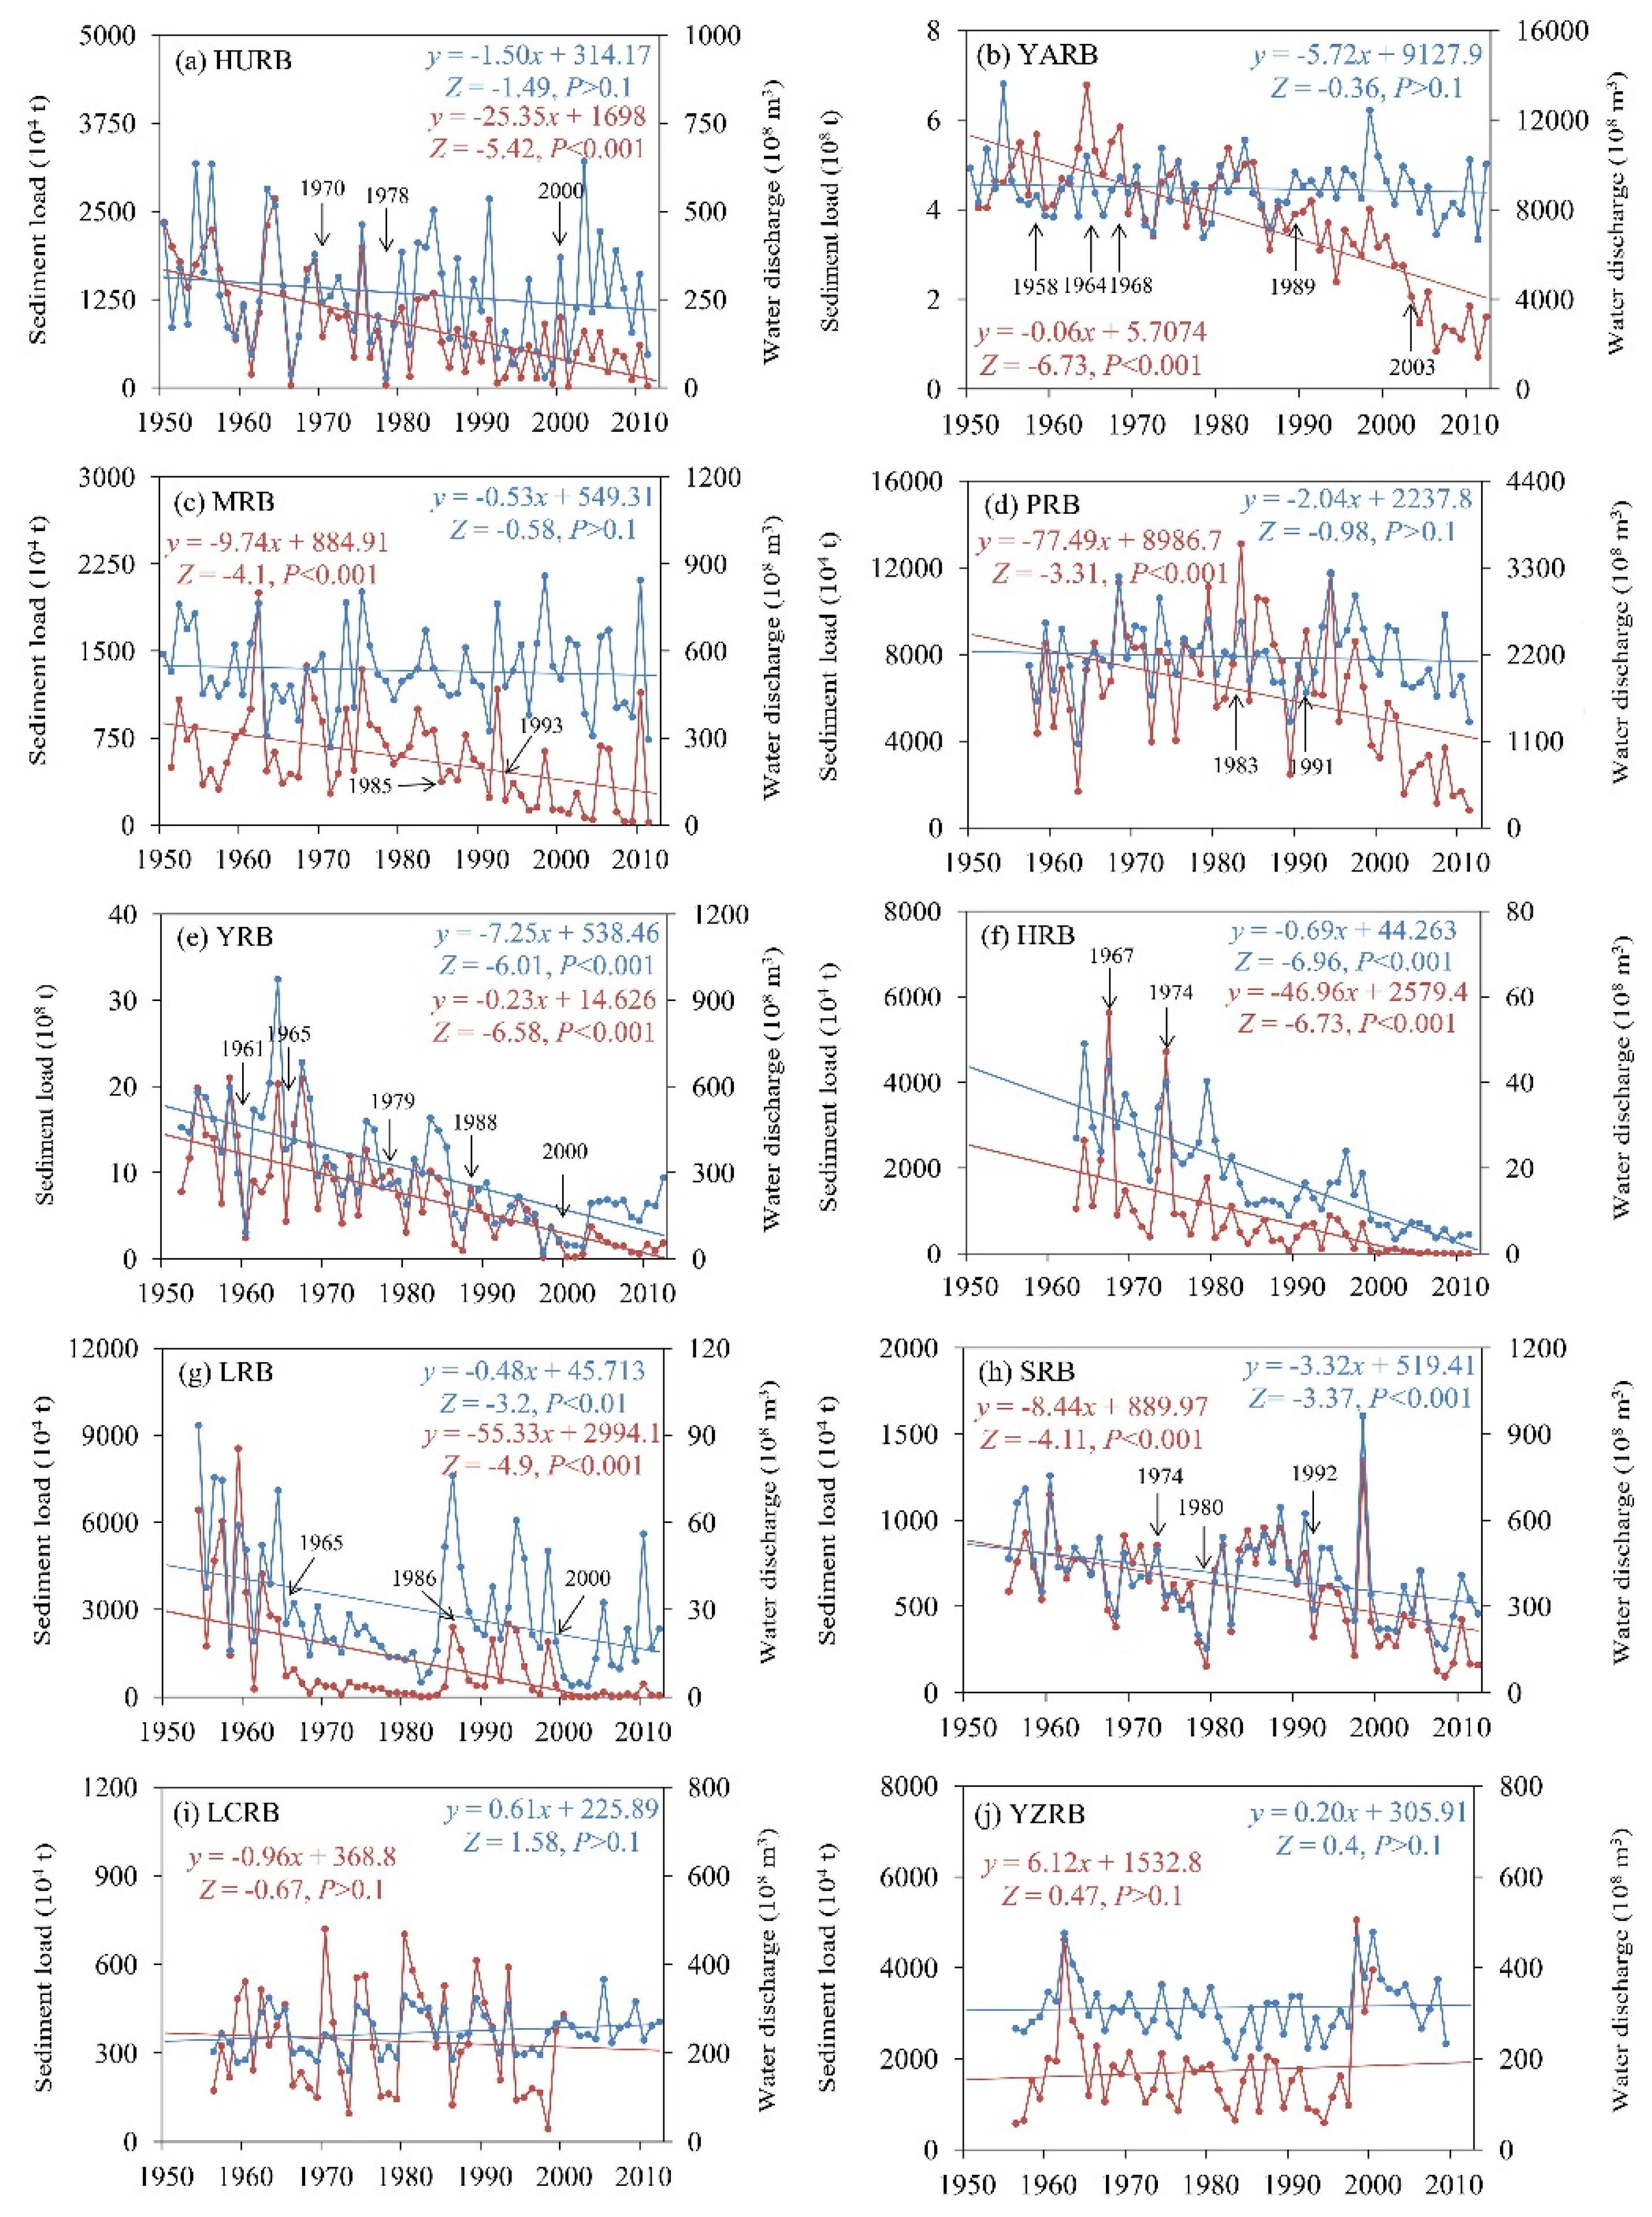
3.3.2. Streamflow and Sediment Load Reduced Together
3.3.3. Both Streamflow and Sediment Discharge Remained Stable
4. Influencing Factors of Streamflow Variation
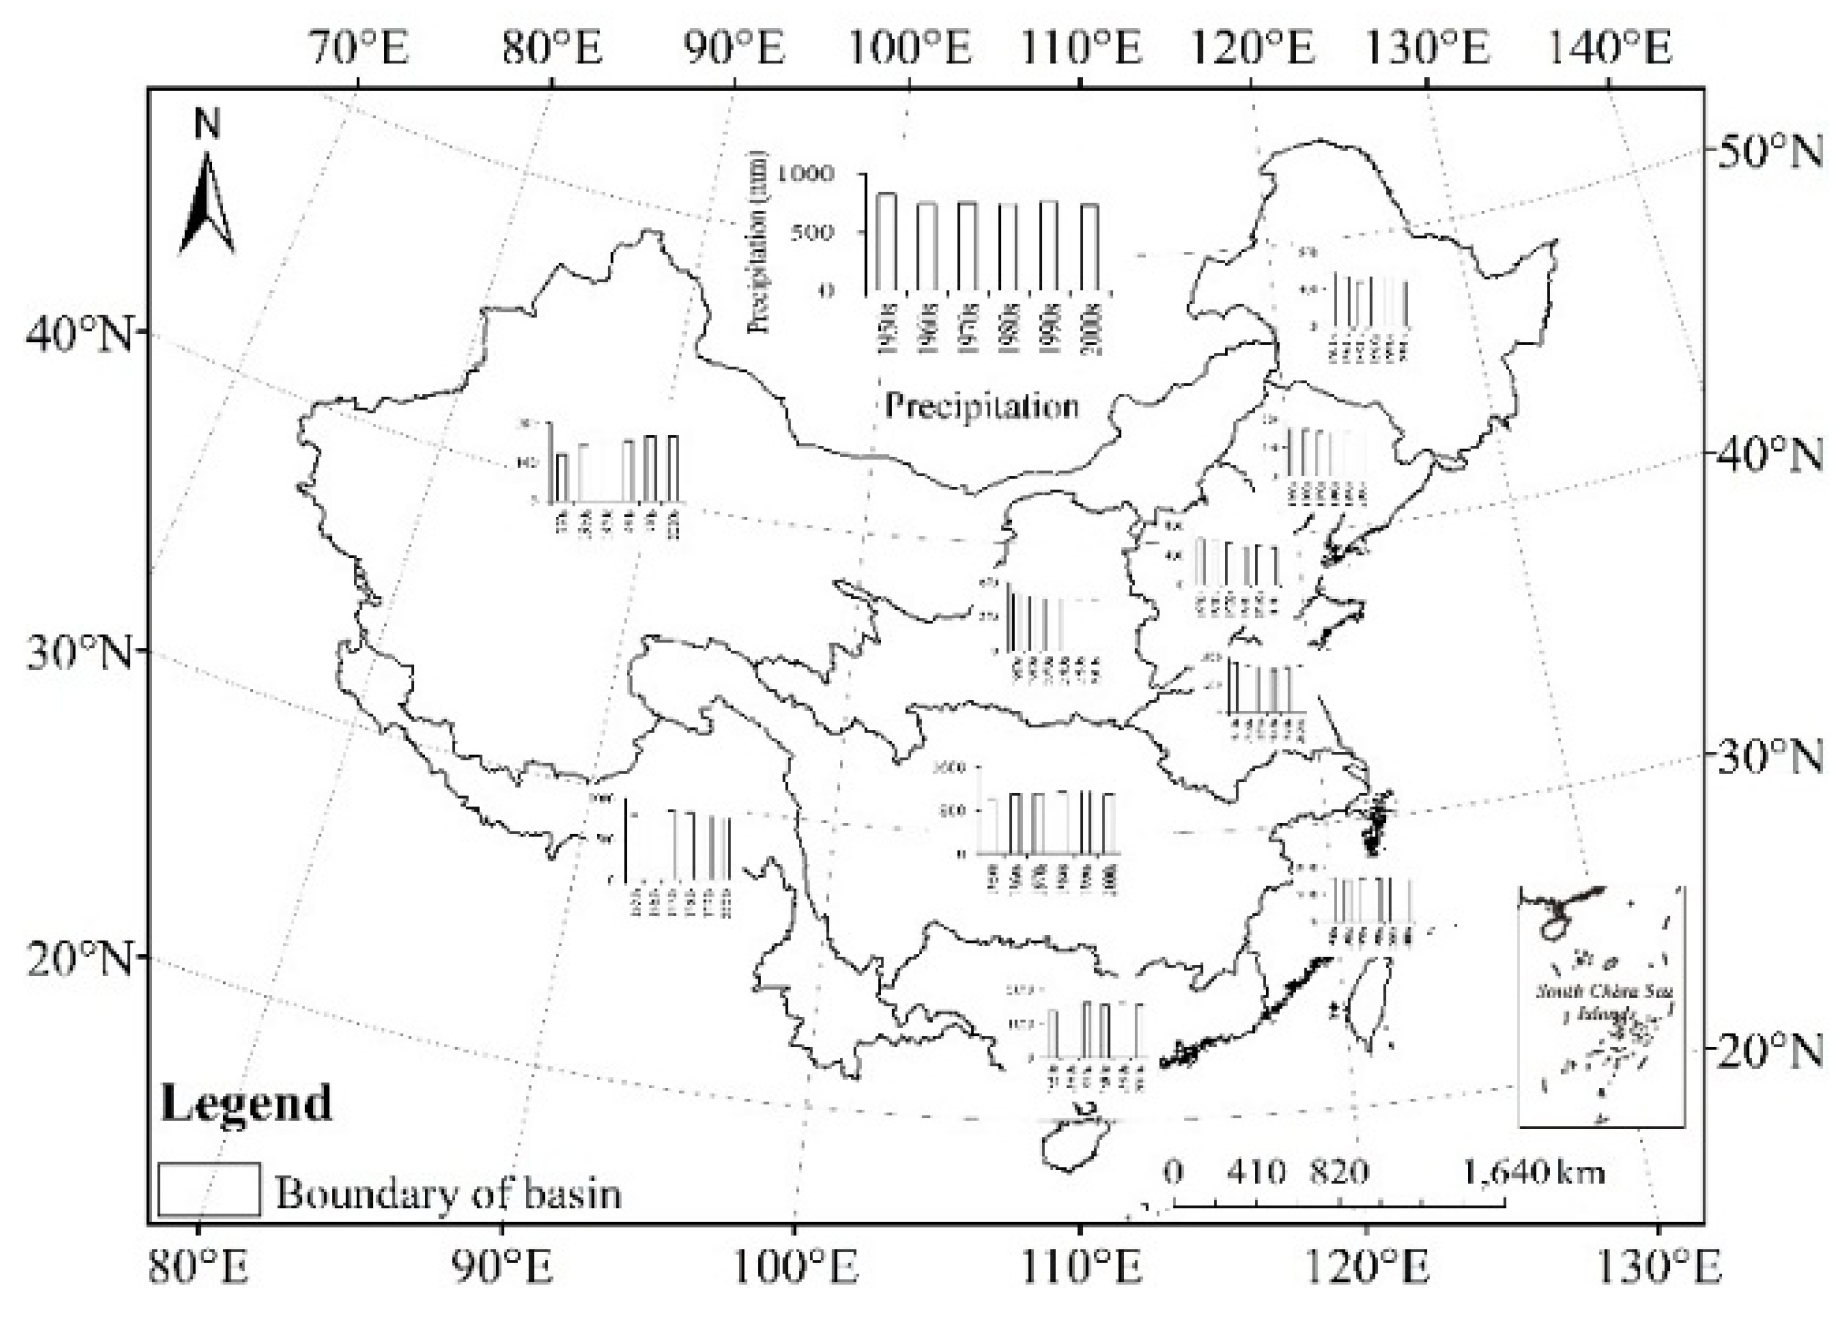
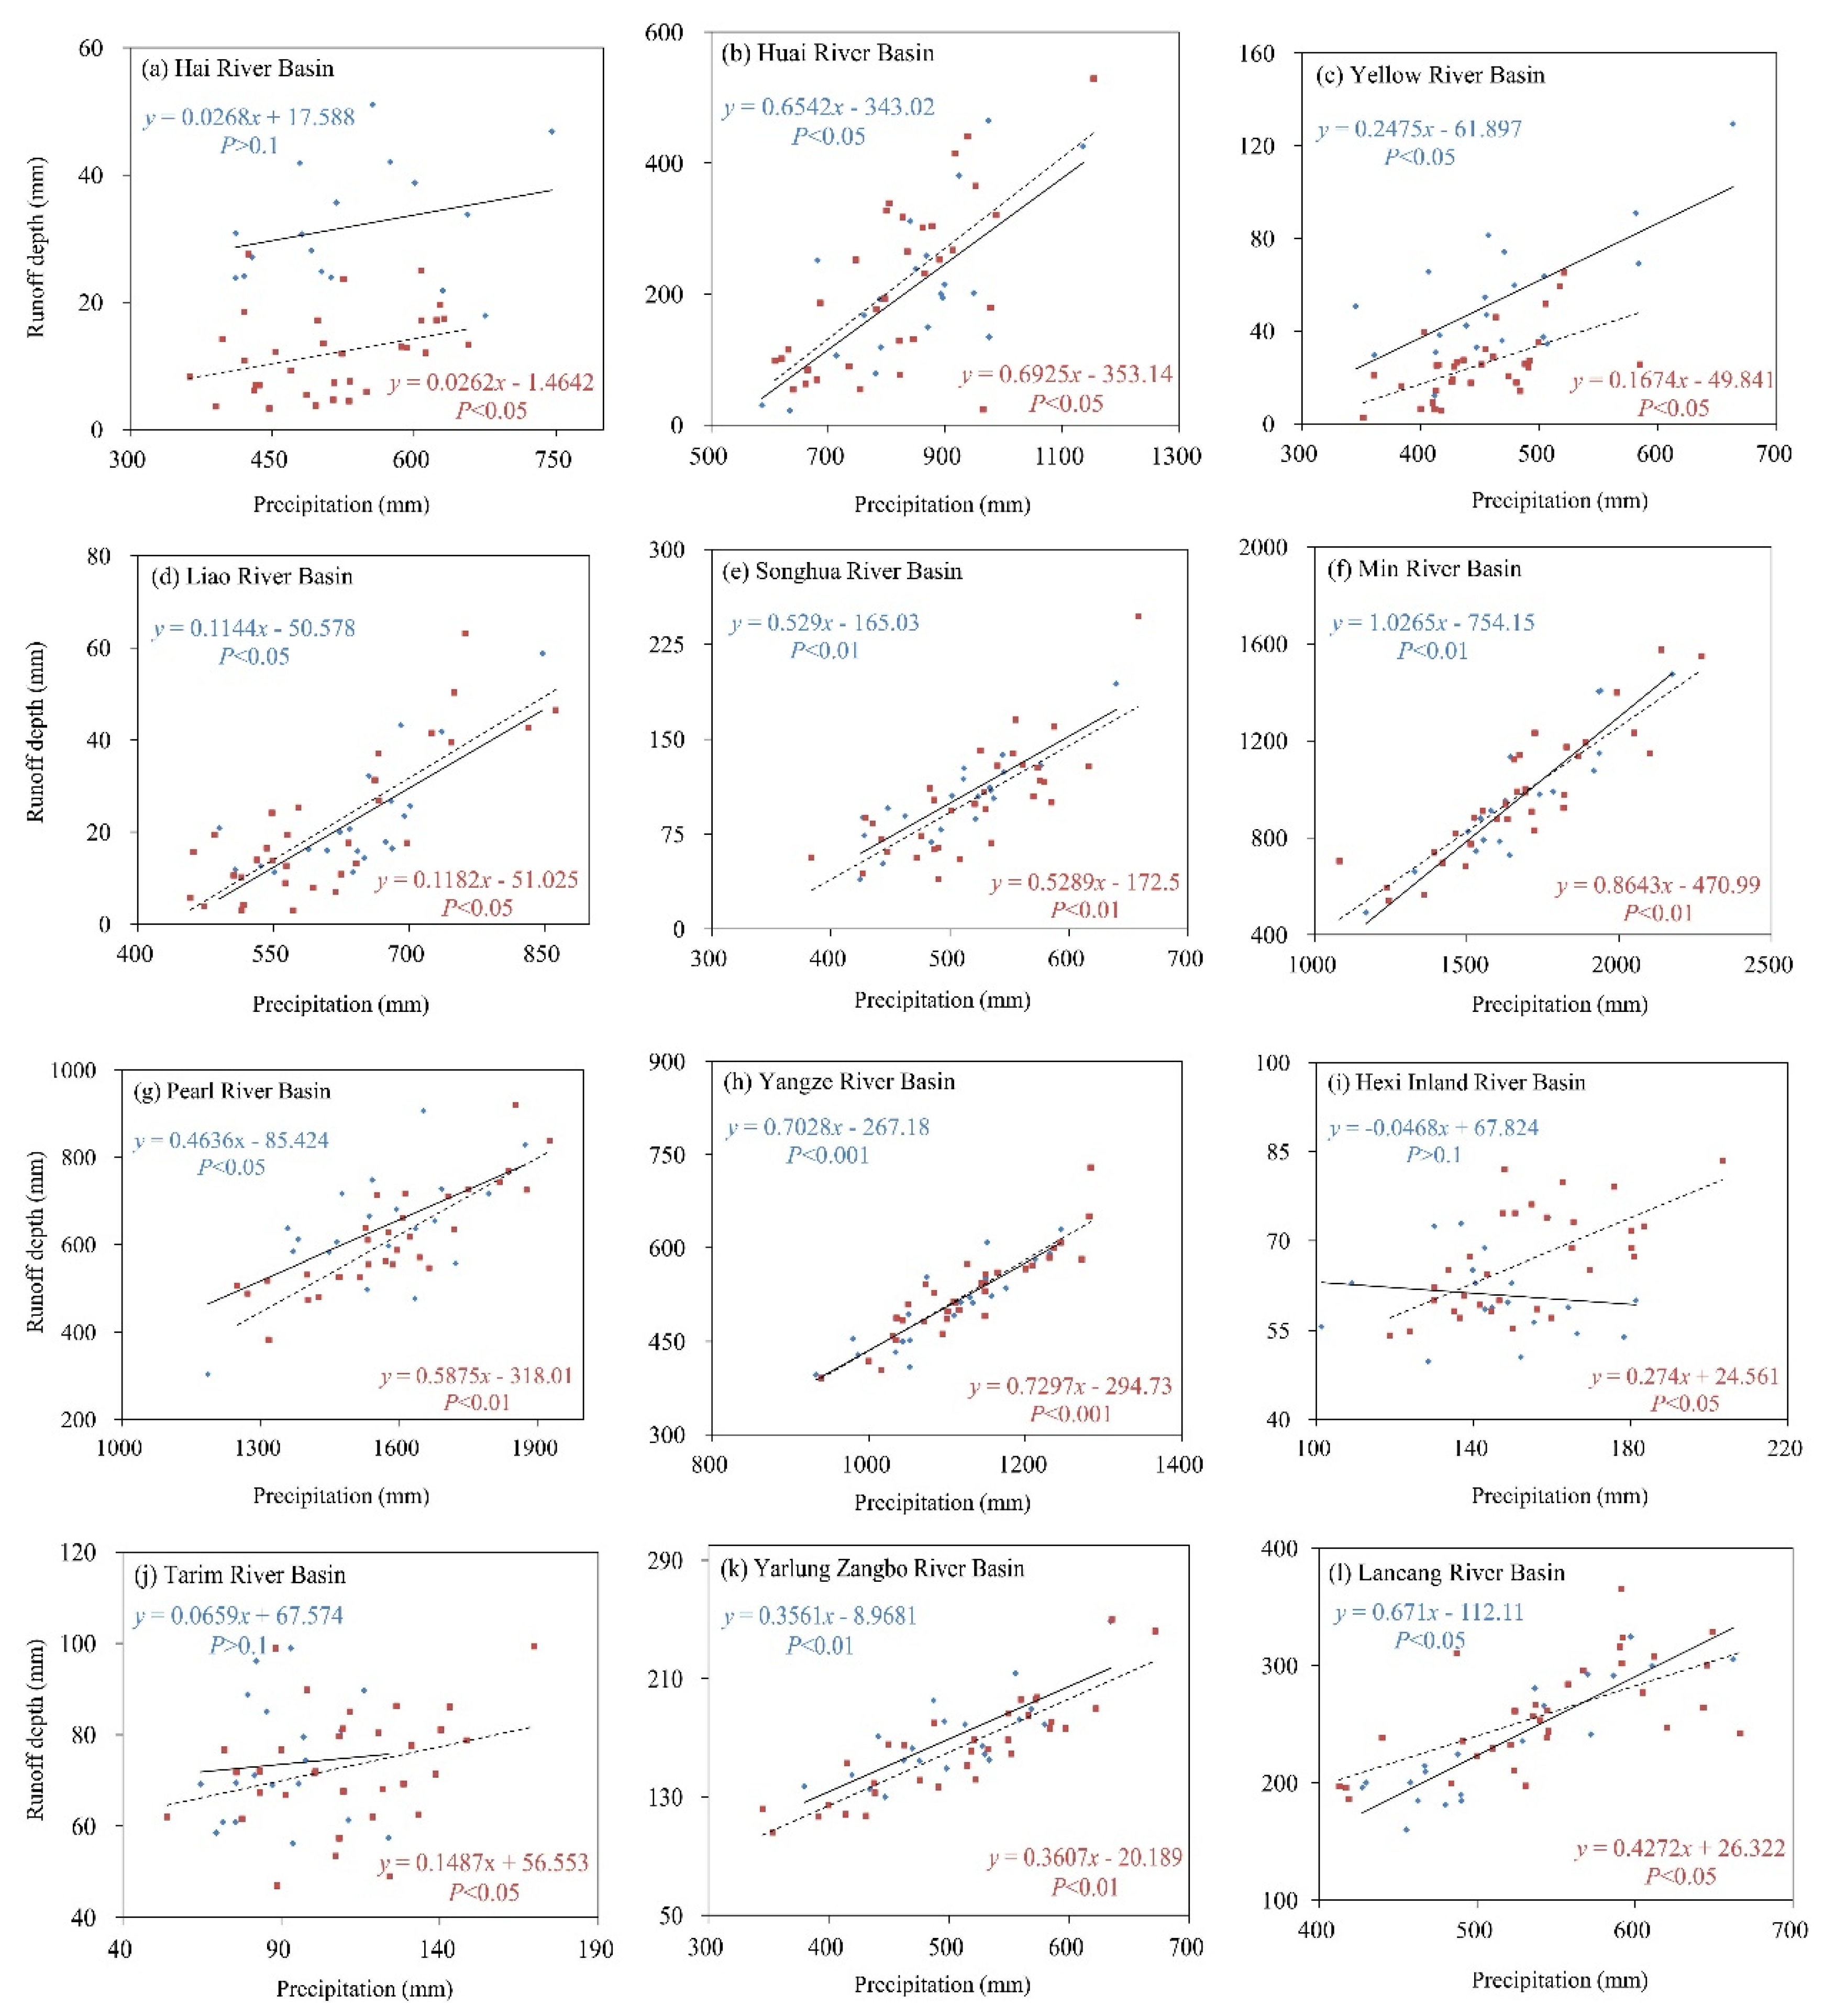
4.1. Precipitation
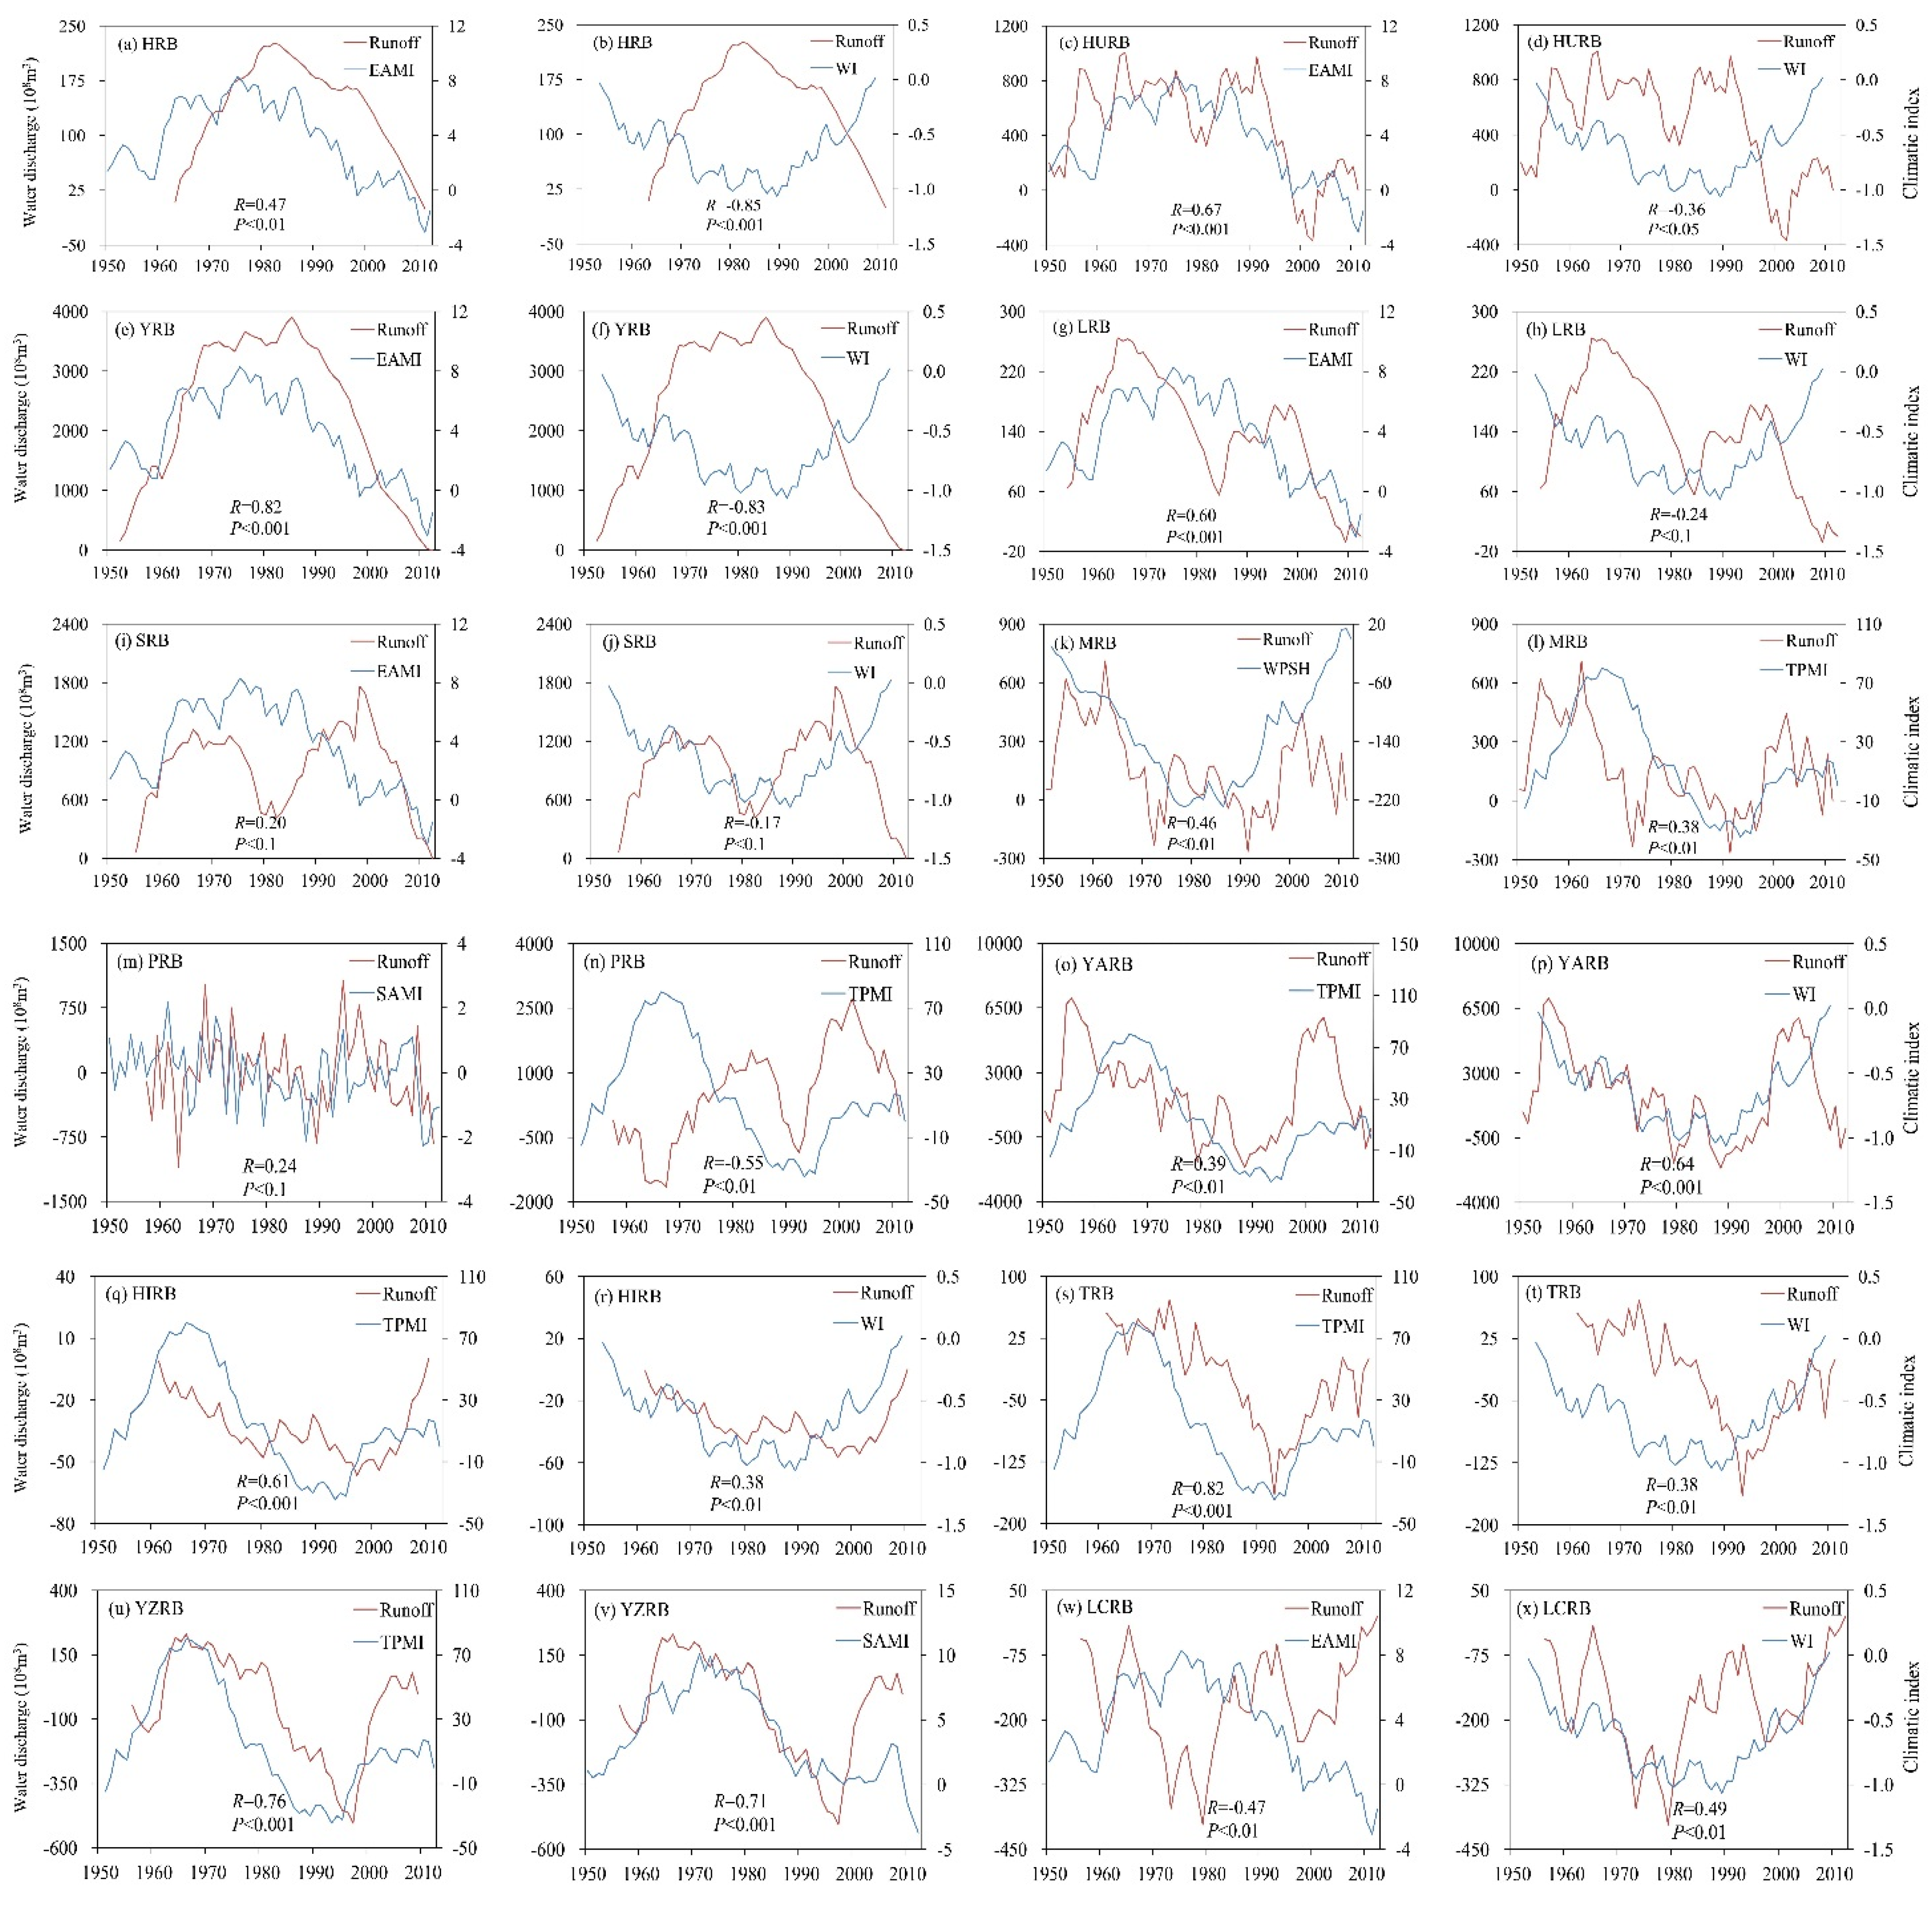
4.2. Monsoons
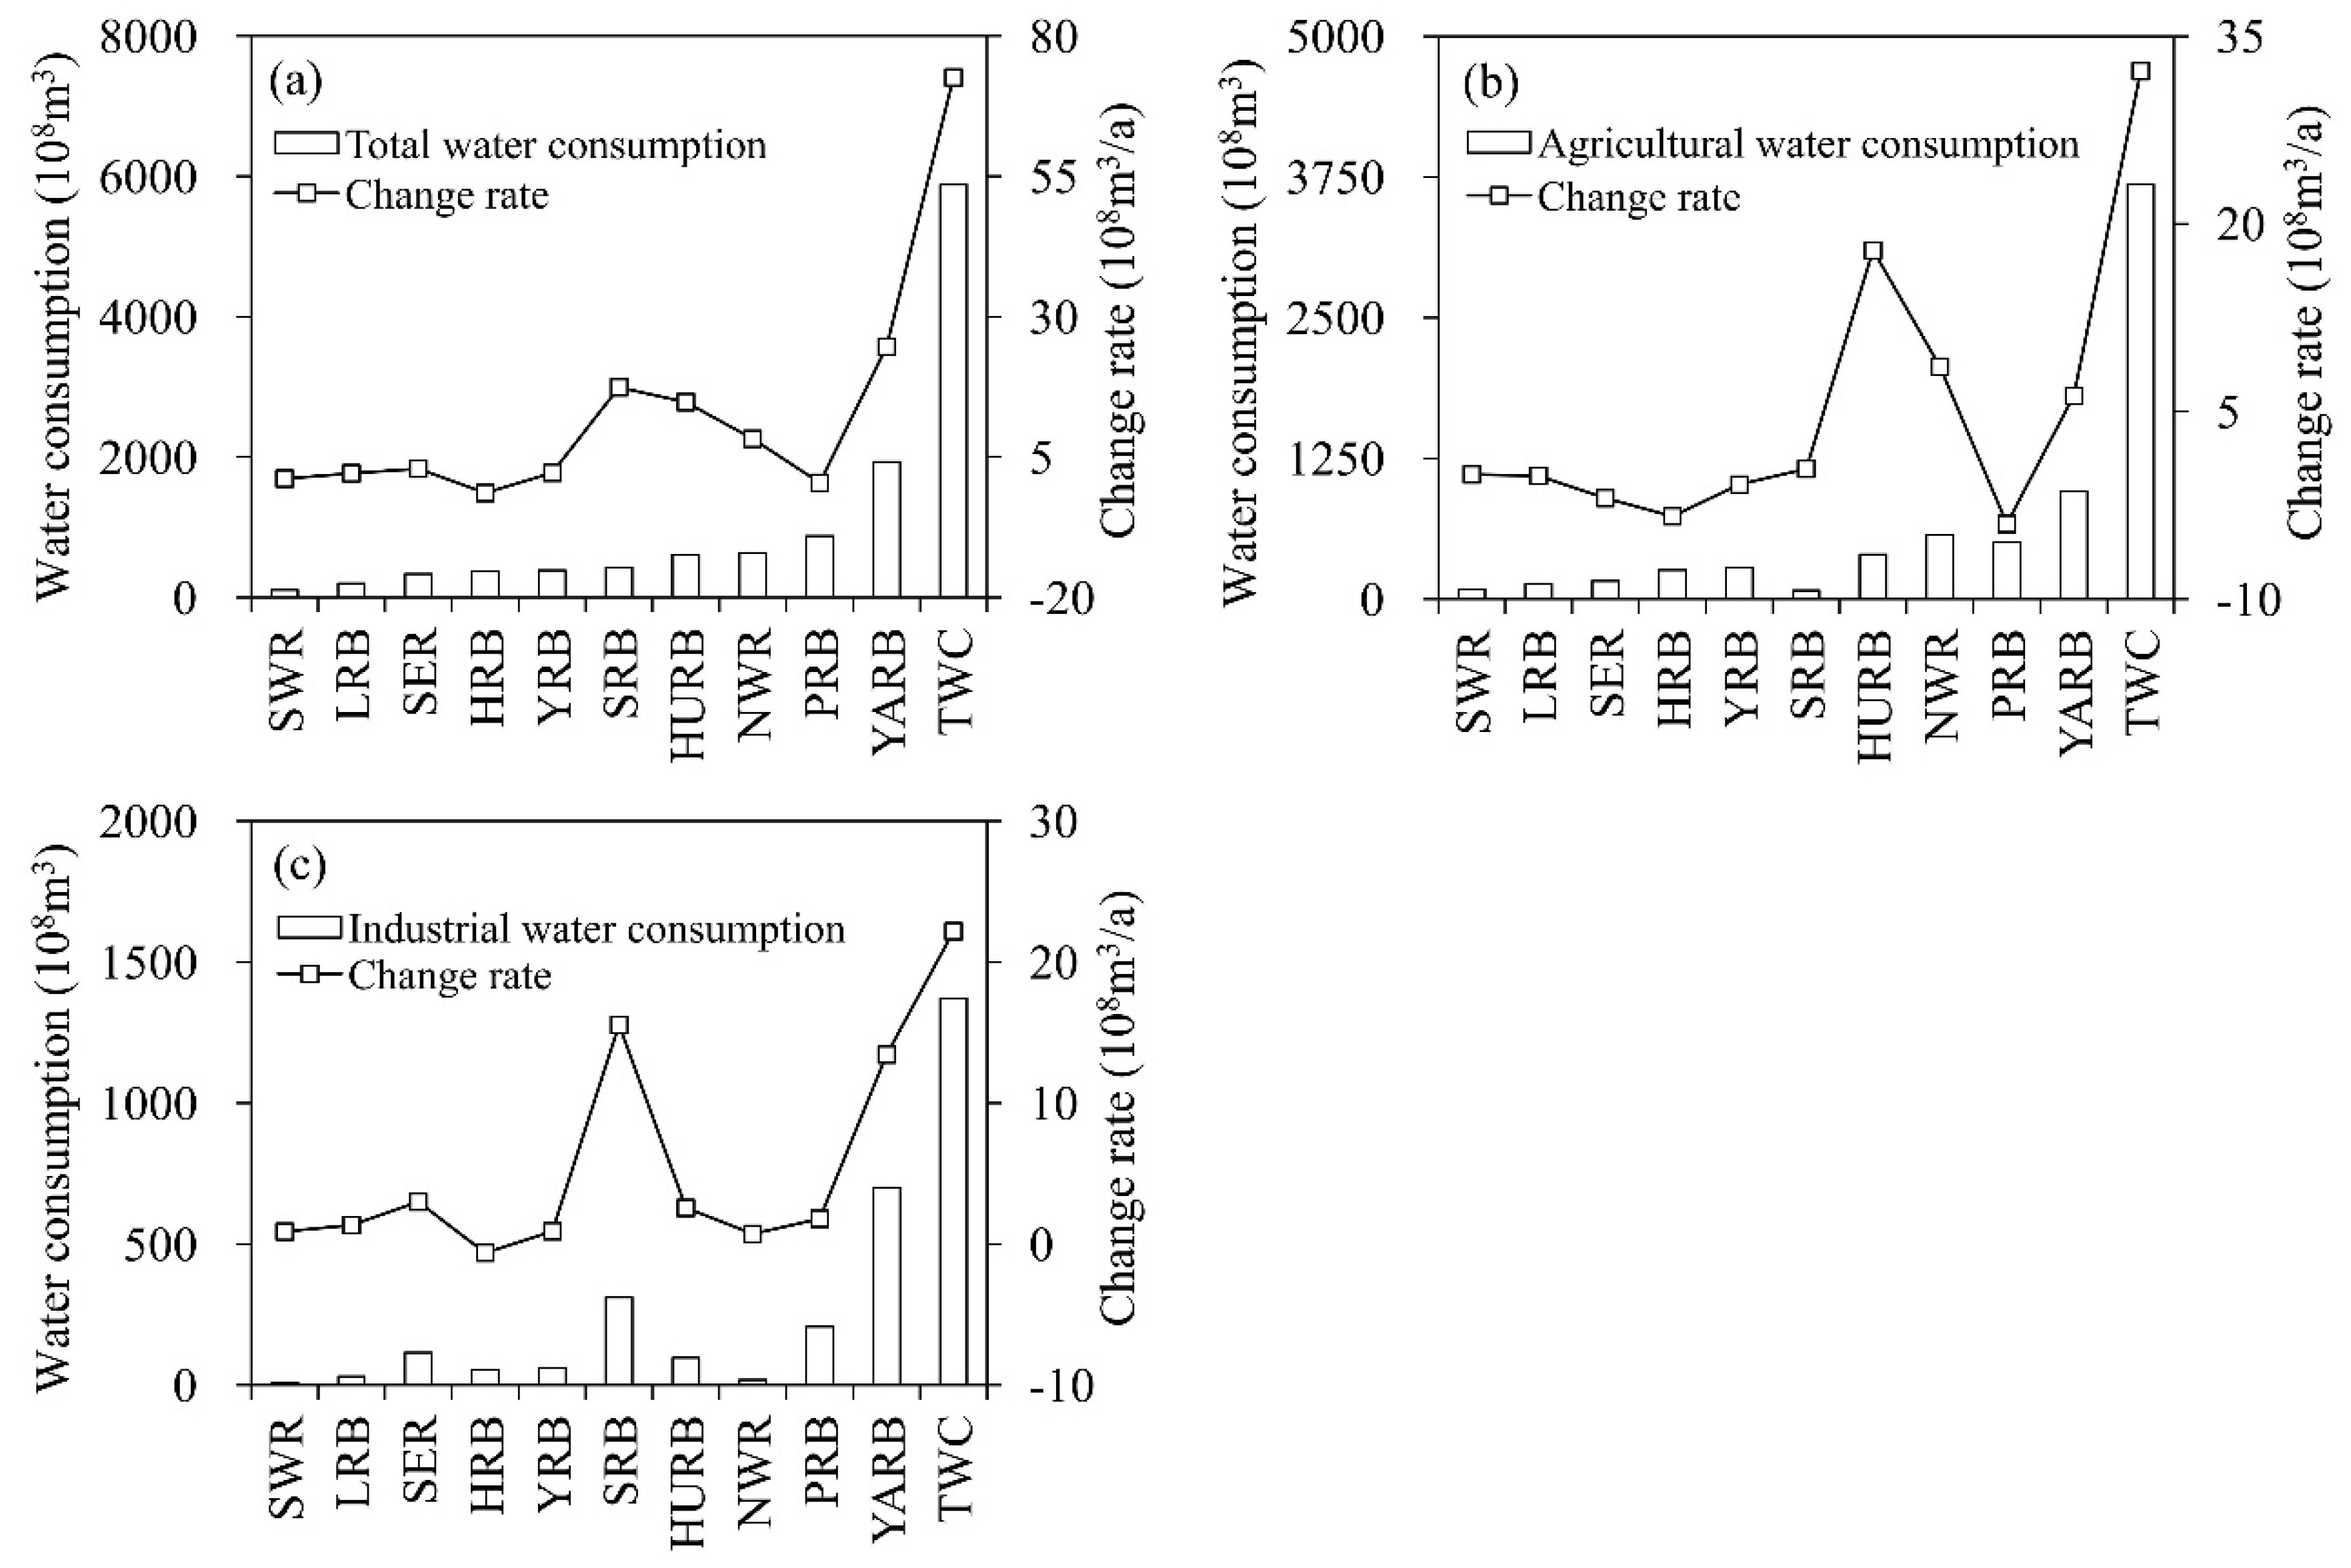
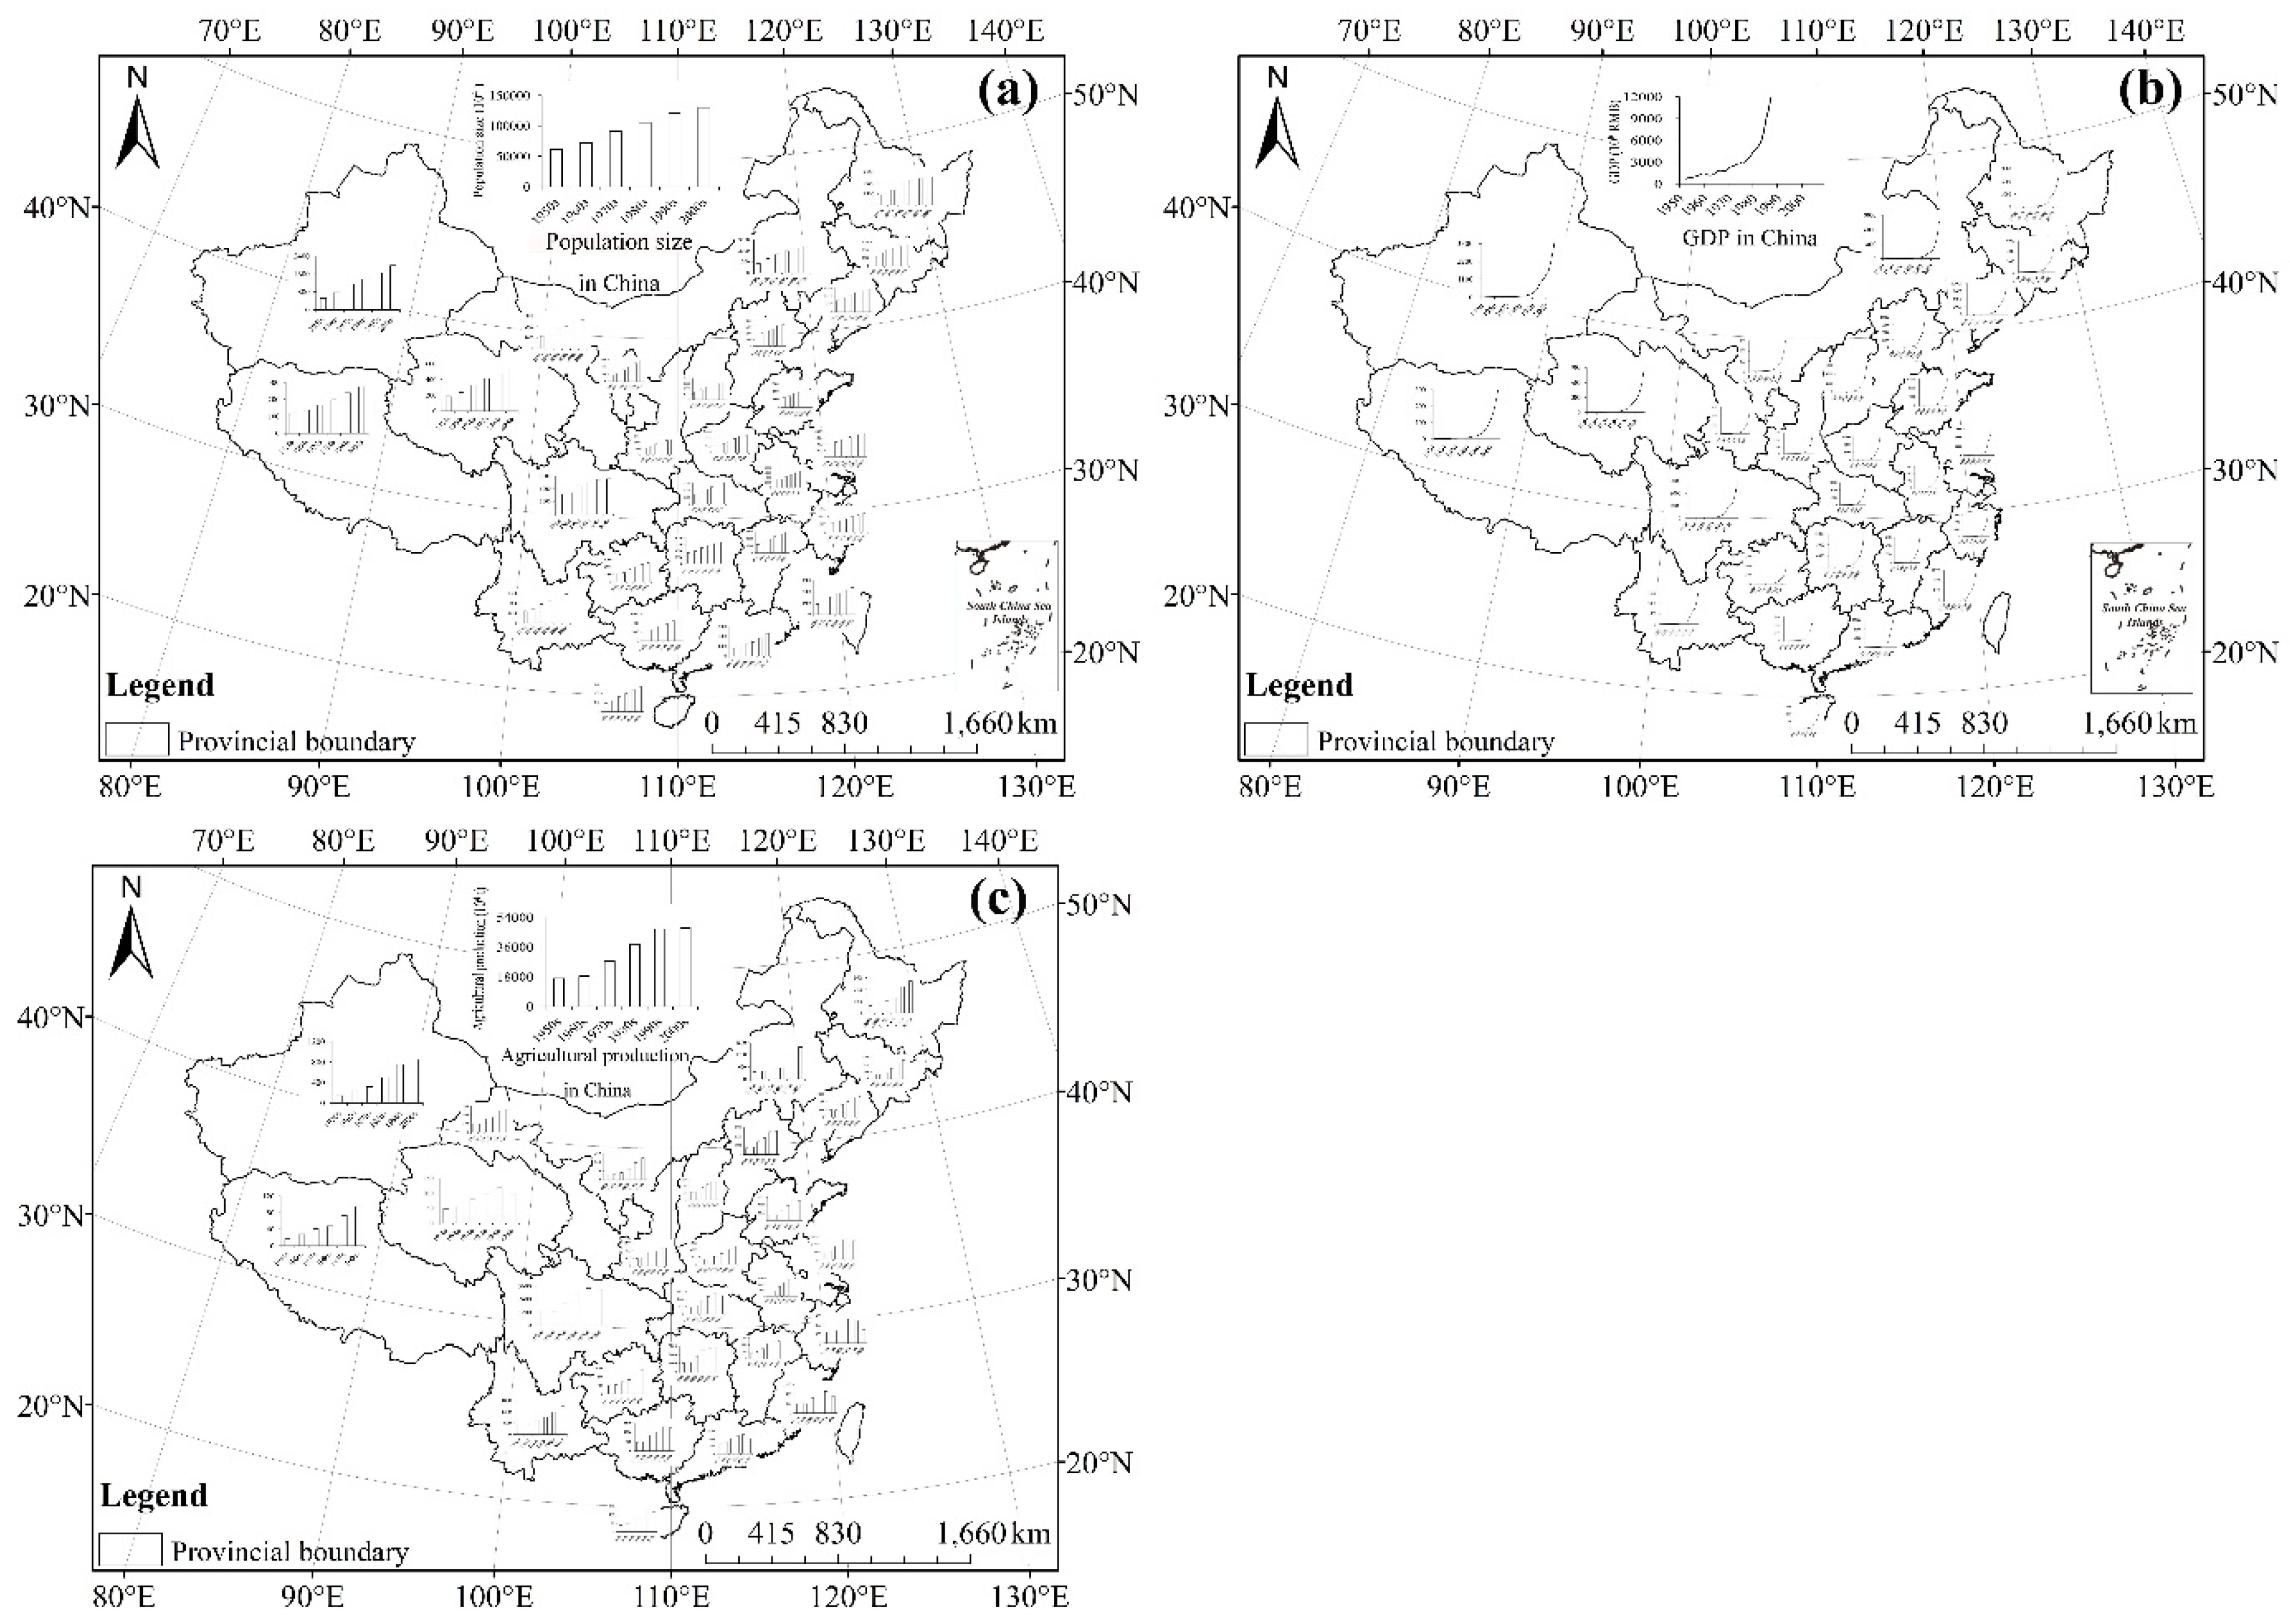
4.3. Water Consumption for Industrial and Residential Purposes
4.4. Land Use/Land Coverage Change
| Transfer Types | Dryland–Paddy Field | Grassland–Forest | Others–Waters | Others–ConstructionLand | Forest–Farmland | Forest–Grassland | Grassland–Farmland | Grassland–Forest | Waters–Others |
|---|---|---|---|---|---|---|---|---|---|
| 1980–2000 | 173.15 | 115.80 | 80.81 | 177.63 | 174.73 | 81.14 | 345.76 | 104.73 | 62.40 |
| 2000–2010 | 138.12 | 142.36 | 114.55 | 378.24 | 37.54 | 41.85 | 197.38 | 88.79 | 83.27 |
5. Influencing Factors of Sediment Load Variation
5.1. Hydraulic Engineering and Soil and Water Conservation Engineering
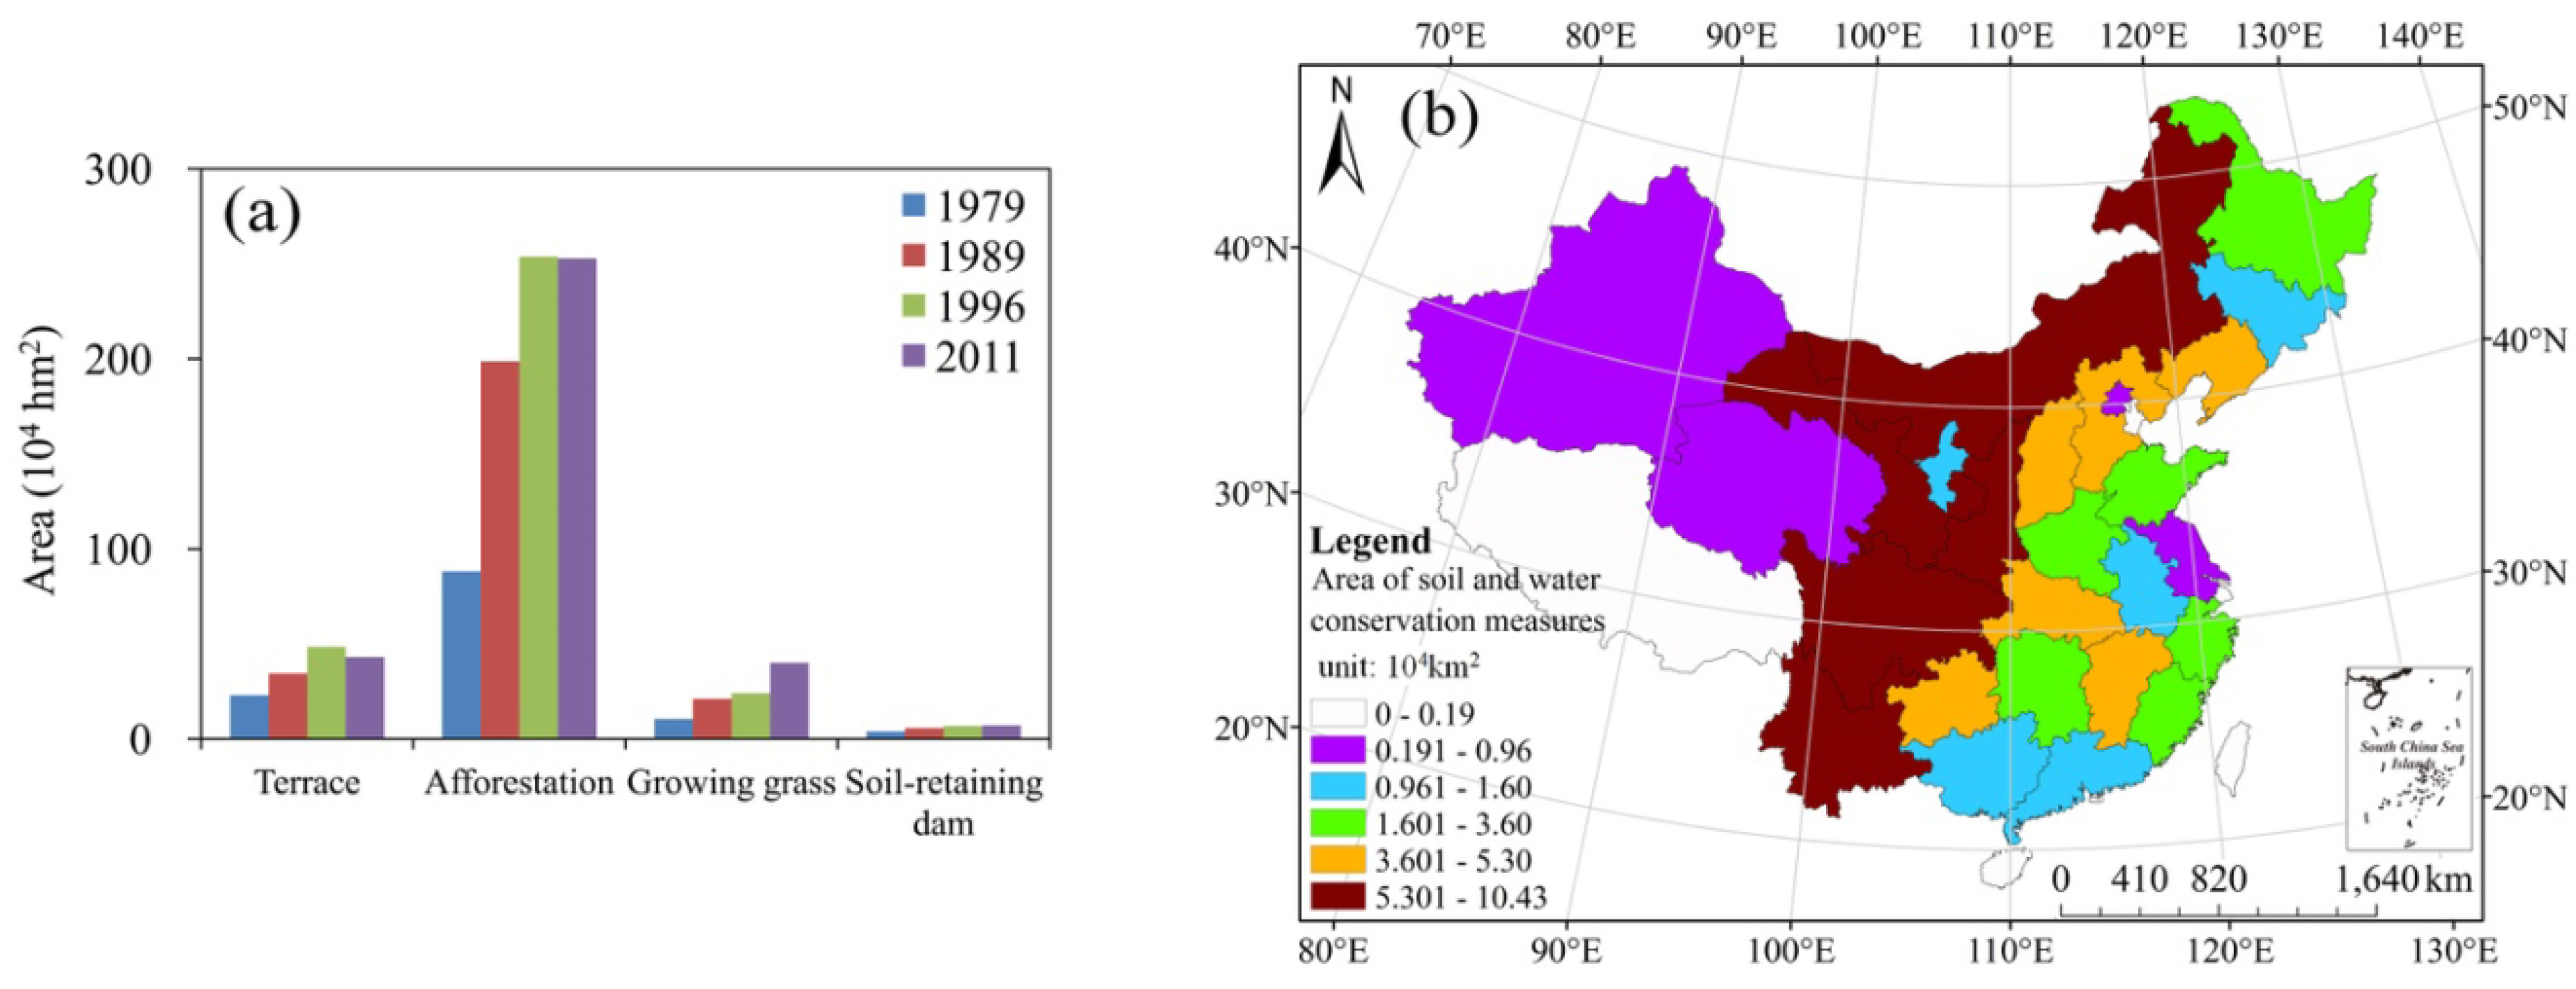
5.1.1. Soil and Water Conservation Engineering
5.1.2. Reservoir and Dam Construction
5.1.3. Water and Sediment Diversion Projects
| Channel Segment | Xixiayuan–Huayuankou | Huayuankou–Jiahetan | Jiahetan–Gaocun | Gaocun–Sunkou | Sunkou–Aishan | Aishan–luokou | Luokou–Lijin | Lower Reaches of Lijin | Total |
|---|---|---|---|---|---|---|---|---|---|
| Length (km) | 109.8 | 100.8 | 77.1 | 118.2 | 63.9 | 101.8 | 167.8 | 110.0 | 849.4 |
| Amount of water diversion (108 m3) | 4.19 | 14.57 | 17.31 | 11.50 | 8.5 | 21.07 | 22.08 | 4.66 | 103.88 |
| Amount of sediment diversion (104 t) | 62.8 | 111.3 | 286.6 | 242.7 | 266.3 | 800.2 | 464.4 | 94.5 | 2328.8 |
5.2. Other Human Activities
6. Impacts of Water and Sediment Discharge Reduction on Utilization of Sediment Resources
6.1. Effects of River Regulation and Flood Control
6.2. Effects of Flood Irrigation and Soil Improvement
6.3. Effects of Land and Wetland Formation
7. Conclusions
- During the past 60 years, the streamflow in northern China, including the HRB, HURB, YRB, LRB, and SRB, showed different decreasing trends. That in the southern rivers, including MRB, PRB and YARB, presented severe fluctuations, although the declining trend did not reach significant levels. For the streamflow in the TRB, HIRB, YZRB, and LCRB, increasing trends were presented. The runoff yield capacity was weakened in the HRB, YRB, SRB, and PRB and enhanced in the LRB and HURB. That in the MRB and YARB remained stable.
- In the northern rivers, runoff correlated positively with the EAMI and negatively with the WI. In the southern rivers, runoff was mainly influenced by the Tibet–Qinghai monsoon, South Asian monsoon, and westerlies. That in the HIRB and TRB was controlled mainly by the Tibet–Qinghai monsoon and westerlies. Runoff in the YZRB was controlled by the South Asian monsoon and the Tibet–Qinghai monsoon, whereas that in the LCRB was influenced mainly by the East Asian monsoon and westerlies.
- Sediment loads in the LCRB and YZRB did not present significant change trends. However, sediment loads in other rivers exhibited varying degrees of gradual reduction, the greatest of which was in the 2000s.
- Underlying surface and precipitation changes jointly influenced the runoff in eastern rivers. Water consumption for industrial and residential purposes, soil and water conservation engineering projects, hydraulic engineering, and underlying surface changes induced by other factors were the main causes of runoff and sediment reduction.
Acknowledgments
Author Contributions
Conflicts of Interest
References
- Alan, D.Z.; Justin, S.; Edwin, P.M.; Bart, N.; Eric, F.W.; Dennis, P.L. Detection of intensification in global and continental scale hydrological cycles: Temporal scale of evaluation. J. Clim. 2003, 16, 535–547. [Google Scholar]
- Easterling, D.R.; Meehl, G.A.; Parmesan, C.; Changnon, S.A.; Karl, T.R.; Mearns, L.O. Climate extremes: Observations, modeling, and impacts. Science 2000, 289, 2068–2074. [Google Scholar] [CrossRef] [PubMed]
- Qiu, J. China drought highlights future climate threats. Nature 2010, 465, 142–143. [Google Scholar] [CrossRef] [PubMed]
- Zhang, J.Y.; He, R.M.; Qi, J.; Liu, C.S.; Wang, G.Q.; Jin, J.L. A new perspective on water issues in north China. Adv. Water Sci. 2013, 24, 303–310. [Google Scholar]
- Zhang, Y.J.; Hu, C.H.; Wang, Y.G. Analysis on variation characteristics and influential factors of runoff and sediment of Liaohe River Basin. Yangtze River 2014, 45, 32–35. [Google Scholar]
- World Water Assessment Programme (WWAP). The United Nations World Water Development Report 4: Managing Water under Uncertainty and Risk; World Water Assessment Programme: Paris, France, 2012. [Google Scholar]
- Vörösmarty, C.J.; McIntyre, P.B.; Gessner, M.O.; Dudgeon, D.; Prusevich, A.; Green, P.; Glidden, S.; Bunn, S.E.; Sullivan, C.A.; Liermann, C.R.; et al. Global threats to human water security and river biodiversity. Nature 2010, 467, 555–561. [Google Scholar] [CrossRef] [PubMed]
- Intergovernmental Panel on Climate Change (IPCC). Managing the Risks of Extreme Events and Disasters to Advance Climate Change Adaptation; Cambridge University Press: Cambridge, UK, 2012. [Google Scholar]
- Climate Change 2013: The Physical Science Basis, Summary for Policy Makers, Technical Summary and Frequently Asked Questions. Available online: https://www.ipcc.ch/pdf/assessment-report/ar5/wg1/WG1AR5_SummaryVolume_FINAL.pdf (accessed on 13 October 2015).
- Matthew, B.C.; Nigel, W.A. Adapting to climate change impacts on water resources in England-An assessment of draft water resources management plans. Glob. Environ. Chang. 2011, 21, 238–248. [Google Scholar]
- Domroes, M.; Peng, G. The Climate of China; Springer: Berlin, Germany, 1988. [Google Scholar]
- Zhai, P.M.; Zhang, X.B.; Wan, H.; Pan, X.H. Trends in total precipitation and frequency of daily precipitation extremes over China. J. Clim. 2005, 18, 1096–1108. [Google Scholar] [CrossRef]
- Ding, Y. Monsoons Over China; Kluwer Academic Publishers: Amsterdam, the Netherland, 1994. [Google Scholar]
- Holeman, J.N. The sediment yield of major rivers of the world. Water Resour. Res. 1968, 4, 737–747. [Google Scholar] [CrossRef]
- Holland, H.D. River transport to the oceans. In The Ocean Lithosphere; John Wiley & Sons: New York, NY, USA, 1981. [Google Scholar]
- Walling, D.E.; Fang, D. Recent trends in the suspended sediment loads of the world rivers. Glob. Planet. Chang. 2003, 39, 111–126. [Google Scholar] [CrossRef]
- Milliman, J.D. Delivery and fate of fluvial water and sediment to the sea: A marine geologist’s view of European rivers. Sci. Mar. 2001, 65, 121–132. [Google Scholar] [CrossRef]
- Bobrovitskaya, N.N.; Kokorev, A.V.; Lemeshko, N.A. Regional patterns in recent trends in sediment yields of Eurasian and Siberian rivers. Glob. Planet. Chang. 2003, 39, 127–146. [Google Scholar] [CrossRef]
- Liu, C.; Wang, Y.G.; Sui, J.Y. Analysis on variation of seagoing water and sediment load in main rivers of China. J. Hydraul. Eng. 2007, 38, 1444–1452. [Google Scholar]
- Subramainian, V. Sediment load of Indian rivers. Curr. Sci. 1993, 64, 928–930. [Google Scholar]
- Siakeu, J.; Oguchi, T.; Aoki, T.; Esakid, Y.; Jarviee, H.P. Change in riverine suspended sediment concentration in central Japan in response to late 20th century human activities. Catena 2004, 55, 231–254. [Google Scholar] [CrossRef]
- Wang, Y.G.; Liu, X.; Shi, H.L. Variation and influence factor of runoff and sediment in the lower and middle Yangtze River. J. Sed. Res. 2014, 29, 38–47. [Google Scholar]
- Miao, C.Y.; Ni, J.R.; Borthwick, A.G.L. Recent changes of water discharge and sediment load in the Yellow River basin. Prog. Phys. Geogr. 2010, 34, 541–561. [Google Scholar] [CrossRef]
- Shi, H.L.; Hu, C.H.; Wang, Y.G.; Tian, Q.Q. Variation trend and cause of runoff and sediment load variations in Huaihe River. J. Hydraul. Eng. 2012, 43, 571–579. [Google Scholar]
- Zhang, J.Y.; Zhang, S.L.; Wang, J.X.; Li, Y. Study on runoff trends of the six larger basins in China over the past 50 years. Adv. Water Sci. 2007, 18, 230–234. [Google Scholar]
- Miao, C.Y.; Yang, L.; Liu, B.Y.; Gao, Y.; Li, S.L. Streamflow changes and its influencing factors in the mainstream of the Songhua River basin, Northeast China over the past 50 years. Environ. Earth Sci. 2011, 63, 489–499. [Google Scholar] [CrossRef]
- Yang, S.L.; Zhao, Q.Y.; Belkin, I.M. Temporal variation in the sediment load of the Yangtze River and the influences of the human activities. J. Hydrol. 2002, 263, 56–71. [Google Scholar] [CrossRef]
- Gao, G.; Chen, D.L.; Xu, C.Y.; Simelton, E. Trend of estimated actual evapotranspiration over China during 1960–2002. J. Geophys. Res. 2007, 112, D11120. [Google Scholar] [CrossRef]
- International Research and Training Center on Erosion and Sedimentation (IRTCES) China. Gazette of River Sedimentation 2011; China Water Power Press: Beijing, China, 2012. [Google Scholar]
- Lu, X.X.; Higgitt, D.L. Sediment yield variability in the upper Yangtze, China. Earth Surf. Proc. Land 1999, 24, 1077–1093. [Google Scholar] [CrossRef]
- Hassan, M.A.; Church, M.C.; Xu, J.X.; Yan, Y.X. Spatial and temporal variation of sediment yield in the landscape: Example of Huanghe (Yellow River). Geophys. Res. Lett. 2008, 35, L06401. [Google Scholar] [CrossRef]
- Mann, H.B. Non-parametric tests against trend. Econometrica 1945, 13, 245–259. [Google Scholar] [CrossRef]
- Kendall, M.G. Rank Correlation Methods; Griffin: London, UK, 1975; pp. 1–200. [Google Scholar]
- Chattopadhyay, S.; Jhajharia, D.; Chattopadhyay, G. Trend estimation and univariate forecast of the sunspot numbers: Development and comparison of ARMA, ARIMA and Autoregressive Neural Network models. C.R. Geosci. 2011, 343, 433–442. [Google Scholar] [CrossRef]
- Theil, H. A rank invariant method of linear and polynomial regression analysis. Proc. R. Neth. Acad. Sci. 1950, 53, 1397–1412. [Google Scholar]
- Sen, P.K. Estimates of the regression coefficients based on Kendall’s tau. J. Am. Stat. Assoc. 1968, 63, 1379–1389. [Google Scholar] [CrossRef]
- Jhajharia, D.; Dinpashoh, Y.; Kahya, E.; Choudhary, R.R.; Singh, V.P. Trends in temperature over Godavari River basin in Southern Peninsular India. Int. J. Climatol. 2013, 34, 1369–1384. [Google Scholar] [CrossRef]
- Storch, H.; Navarra, A. (Eds.) Misuses of statistical analysis in climate researchvon. In Analysis of Climate Variability: Applications of Statistical Techniques; Springer: Berlin, Germany, 1995; pp. 11–26.
- Chattopadhyay, S.; Jhajharia, D.; Chattopadhyay, G. Univariate modeling of monthly maximum temperature time series over northeast India: Neural network versus Yule-walker equation based approach. Meteorol. Appl. 2011, 18, 70–82. [Google Scholar] [CrossRef]
- Kumar, S.; Merwade, V.; Kam, J.; Thurner, K. Streamflow trends in Indiana: Effects of long term persistence, precipitation and subsurface drains. J. Hydrol. 2009, 374, 171–183. [Google Scholar] [CrossRef]
- Xu, J.X. Recent variations in water and sediment in relation with reservoir construction in the upper Changjiang River Basin. J. Mount. Sci. 2009, 27, 385–393. [Google Scholar]
- Merriam, C.F. A comprehensive study of the rainfall on the susquehanna valley. Trans. Amer. Geophys. Union 1937, 18, 471–476. [Google Scholar] [CrossRef]
- Searcy, J.K.; Hardisoni, C.H.; Langbein, W.B. Double Mass Curves; Geological Survey Water Supply Paper 1541-B; US Geological Survey: Washington, DC, USA, 1960.
- Mu, X.M.; Zhang, X.Q.; Gao, P.; Wang, F. Theory of double curves and its applications in hydrology and meteorology. J. China Hydrol. 2010, 30, 47–51. [Google Scholar]
- Li, Y.Y.; Cao, J.T.; Shen, F.X.; Xia, J. The changes of renewable water resources in China during 1956–2010. Sci. China Earth Sci. 2014, 57, 1825–1833. [Google Scholar] [CrossRef]
- Li, J.P.; Wu, Z.W.; Jiang, Z.H.; He, J.H. Can global warming strengthen the East Asian summer monsoon? J. Clim. 2010, 23, 6696–6705. [Google Scholar] [CrossRef]
- Li, J.P.; Feng, J.; Li, Y. A possible cause of decreasing summer rainfall in northeast Australia. Int. J. Climatol. 2011, 31. [Google Scholar] [CrossRef]
- Wang, M.C.; Liang, J.; Shao, M.J.; Shi, G. Preliminary analysis on interannual change of Tibet–Qinghai Plateau monsoon. Plateau Meteorol. 1984, 3, 76–82. [Google Scholar]
- Ma, H.; Yang, D.W.; Tan, S.K.; Gao, B.; Hu, Q.F. Impact of climate variability and human activity on streamflow decrease in the Miyun Reservoir catchment. J. Hydrol. 2010, 389, 317–324. [Google Scholar] [CrossRef]
- Chen, Y.N.; Fan, Y.T.; Wang, H.J.; Fang, G.H. Research progress on the impact of climate change on water resources in the arid region of Northwest China. Acta Geogr. Sin. 2014, 69, 1295–1304. [Google Scholar]
- Song, X.M.; Zhang, J.Y.; Zhan, C.S.; Liu, C.Z. Review for impacts of climate change and human activities on water cycle. J. Hydraul. Eng. 2013, 44, 779–790. [Google Scholar]
- He, D.M.; Liu, C.M.; Feng, Y.; Hu, J.M.; Ji, X.; Li, Y.G. Progress and perspective of international river researches in China. Acta Geogr. Sin. 2014, 69, 1284–1294. [Google Scholar]
- Liu, C.; Hu, C.H.; Shi, H.L. Changes of runoff and sediment fluxes of river in mainland of China discharge into Pacific Ocean. J. Sed. Res. 2012, 27, 70–75. [Google Scholar]
- Liu, C.; He, Y.; Zhang, H.Y. Trends analysis of the water and sediment loads of the main rivers in China using water-sediment diagram. Adv. Water Sci. 2008, 19, 317–324. [Google Scholar]
- Liu, C.; Wang, Z.Y.; Sui, J.Y. Variation of flow and sediment of the Yellow River and their influential factors. Adv. Sci. Technol. Water Resour. 2008, 28, 1–7. [Google Scholar]
- Ministry of Water Resources of the People’s Republic of China (MWRPRC). Chinese River Sediment Bulletin 2012; China Water Power Press: Beijing, China, 2013; pp. 1–60.
- Ministry of Water Resources of the People’s Republic of China (MWRPRC). Chinese River Sediment Bulletin 2006; China Water Power Press: Beijing, China, 2007; pp. 1–55.
- Wang, Y.G.; Hu, C.H.; Shi, H.L. Variation in water and sediment resources and its influence on utilization of sediment resource in the Yellow River Basin. J. China Inst. Water Resour. Hydropower Res. 2010, 8, 237–245. [Google Scholar]
© 2015 by the authors; licensee MDPI, Basel, Switzerland. This article is an open access article distributed under the terms and conditions of the Creative Commons Attribution license (http://creativecommons.org/licenses/by/4.0/).
Share and Cite
Jiang, C.; Zhang, L.; Li, D.; Li, F. Water Discharge and Sediment Load Changes in China: Change Patterns, Causes, and Implications. Water 2015, 7, 5849-5875. https://doi.org/10.3390/w7105849
Jiang C, Zhang L, Li D, Li F. Water Discharge and Sediment Load Changes in China: Change Patterns, Causes, and Implications. Water. 2015; 7(10):5849-5875. https://doi.org/10.3390/w7105849
Chicago/Turabian StyleJiang, Chong, Linbo Zhang, Daiqing Li, and Fen Li. 2015. "Water Discharge and Sediment Load Changes in China: Change Patterns, Causes, and Implications" Water 7, no. 10: 5849-5875. https://doi.org/10.3390/w7105849
APA StyleJiang, C., Zhang, L., Li, D., & Li, F. (2015). Water Discharge and Sediment Load Changes in China: Change Patterns, Causes, and Implications. Water, 7(10), 5849-5875. https://doi.org/10.3390/w7105849