1. Introduction
Although the world currently produces enough food for its citizens, there exist large disparities in the access to food across regions and income levels [
1,
2]. Food security has been declared as a key challenge to be faced in the near future by many international institutions. In this line, the United Nations [
3] states that “the food and agriculture sector offers key solutions for development, and is central for hunger and poverty eradication”. Moreover, the European Commission [
4] says that “the challenge is how to meet consumers’ needs and preferences while minimizing the related impact on health and the environment”.
Several studies [
5,
6] point at water scarcity, climate change, crop yields, the level of investment or the AIDS epidemic as some of the factors conditioning the achievement of one of the Millennium Development Goals (MDGs), the eradication of poverty and hunger [
7]. In the path towards food security, two sectors stand out as essential in all economies: agriculture and the food industry. It has been proven that economic development is associated with increases in the food supply, as well as with dietary changes that lead to the improvement of the nutritional status of countries [
8,
9]. Moreover, these changes usually happen together with qualitative variations in the production, processing, distribution and marketing of food,
i.e., with the development of the food industry [
9]. In this line, there are studies that state that as countries develop, they tend to increase the share of the food and beverage industries on GDP. Then, this sector seems to maintain a high share in the economy across different levels of GDP per capita [
10].
Globalization has increased the level of interdependence of the regional food industries and has consequently raised concerns on its impact, not only on the economies, but also on the environment. Today, we find a vast literature examining the water footprint of countries, studying the impact that trade patterns and domestic consumption has on water resources [
11,
12,
13]. Food security and the global water crisis seem to be increasingly linked, since local shortages can become global through international supply chains and threaten global food security. Thus, in this paper, we focus on the impact of the growing integration of the food industry on water resources. More concretely, our main objective is to study the impact of the food industry on water resources through its activity on global supply chains, paying special attention to the interactions with other domestic and foreign sectors.
Focusing in a semi-arid country, Spain, we analyze the trends on the water consumed by this sector between 1995 and 2009. To that aim, we examine the forward and backward linkages with the rest of economic sectors in Spain and with all of the sectors in other countries in the world using an environmentally-extended multiregional input-output model.
According to the statistical classification of economic activities in the European Community NACE revision 2, the food industry involves the processing of the products of agriculture into food, dealing with different kinds of products: meat, fish, fruit and vegetables, fats and oils, milk products, grain mill products and other food products. The food industry in Spain is the first industrial sector, accounting for 20.5% of net sales, 18.4% of employed people and 15.1% of value added in 2012 (Spanish Ministry of Agriculture and the Industrial Companies Survey [
14]). Thus, we analyze one of the main sectors generating industrial income and employment in Spain, presenting important backward linkages with the agricultural sector [
15].
This article contributes to the existing literature on the food industry sustainability [
16,
17,
18] by offering a general overview of the situation, trends, interrelations and explaining factors lying behind the water consumption of this key sector. Our model offers a comprehensive assessment of the food industry, allowing identifying the intermediate and final demands, the level of integration of the sectors and countries, as well as the responsibilities of production and consumption. This analysis shows a growing separation of the production and consumption sides of the food industry with relevant impacts on domestic and foreign water resources.
We use an environmentally-extended multiregional input-output (MRIO) model to estimate the volume of water embodied in the domestic and traded production of the Spanish food sector. Subsequently, we apply a structural decomposition analysis (SDA), which enables measuring the contribution of water intensity changes, technological changes or variations in the level of demand to the pattern followed by water consumption.
The article is organized as follows.
Section 2 explains the materials and the method used and is divided into two parts. First,
Section 2.1 describes the data sources used. Then,
Section 2.2 presents the methodology utilized in the paper.
Section 3 analyzes and discusses the main results in the paper, and the paper closes with the main conclusions in
Section 4.
3. Results and Discussion
The agri-food sector is a relevant industry with positive economic effects in Spain, highlighting its capacity to generate income and employment in rural areas and its strong linkages with other activities, especially with the agrarian sectors, which mainly provide their inputs. Nonetheless, given its important relationship with agrarian activity, the main direct consumer of water in Spain (which represents more than 80% of the direct consumption of water), it is very important to assess the environmental impacts of this key sector, especially regarding the impact on water resources. As can be seen in
Table 1, on average, the food industry in Spain entails about 30% of the water embodied in the Spanish final demand. That is, this sector is responsible for about one third of the water consumed worldwide to meet the Spanish final demand. Studying this sector deeply is therefore essential to determine its effect in terms of domestic and foreign water resources.
Table 1.
Water embodied in the Spanish final demand, million m3.
Table 1.
Water embodied in the Spanish final demand, million m3.
| Embodied water | 1995 | 2009 |
|---|
| Blue | Green | Grey | Blue | Green | Grey |
|---|
| Spain (million m3) (a) | 56,491 | 307,397 | 39,192 | 57,804 | 311,016 | 42,846 |
| Agri-Food Spanish sector (million m3) (b) | 17,140 | 108,170 | 13,184 | 15,572 | 104,224 | 12,505 |
| (a)/(b) % | 30 | 35 | 34 | 27 | 34 | 29 |
As
Table 2 shows, the embodied water (water consumption measured from the consumer responsibility) of the food sector is much higher than direct water consumption (water consumption measured from the producer responsibility) for green, blue and grey water. This basically means that the effect exerted by the food industry on water resources is not shown by its direct water consumption, making a comprehensive analysis of the water consumed by this sector through the whole global supply chain necessary. That way, in order to assess the actual impact of this relevant sector on foreign water resources and on the Spanish water ecosystems, it is crucial to study its interrelations and linkages among countries and sectors all over the world. As an example, over 25% of the water finally crystallized in the Spanish food products is consumed in other countries and another 74% comes from other domestic sectors, embodied mostly in agricultural products.
Table 2.
The impact of the Spanish food industry on water resources, 1995–2009 (million m3).
Table 2.
The impact of the Spanish food industry on water resources, 1995–2009 (million m3).
| Impact of the food industry | 1995 | 2009 | 1995–2009 |
|---|
| Blue | Green | Grey | Blue | Green | Grey | Blue | Green | Grey |
|---|
| Producer responsibility /Direct water consumption | 41.0 | 0.0 | 0.0 | 49.4 | 0.0 | 0.0 | 8.4 | 0.0 | 0.0 |
| Consumer resp./Embodied water consumption | 17,140 | 108,170 | 13,184 | 15,572 | 104,224 | 12,505 | −1569 | −3946 | −679 |
| Producer responsibility—Consumer responsibility | −17,099 | −108,170 | −13,184 | −15,522 | −104,224 | −12,505 | 1577 | 3946 | 679 |
| Direct water consumption of the agri-food sector | 23.8 | 0.0 | 0.0 | 25.5 | 0.0 | 0.0 | 1.7 | 0.0 | 0.0 |
| Water embodied in exports to other countries | 2899 | 17,092 | 2145 | 4243 | 25,493 | 3171 | 1344 | 8401 | 1026 |
| Water embodied in imports from other countries | 3252 | 30,879 | 3282 | 4350 | 43,242 | 4632 | 1098 | 12,363 | 1350 |
| Foreign net balance (WEX-WEM) | −353 | −13,787 | −1137 | −107 | −17,749 | −1461 | 246 | −3962 | −324 |
| Water embodied in sales to other Spanish sectors | 15.8 | 0.0 | 0.0 | 21.7 | 0.0 | 0.0 | 5.9 | 0.0 | 0.0 |
| Water embodied in purchases from other Spanish sectors | 16,762 | 94,383 | 12,047 | 15,437 | 86,475 | 11,044 | −1325 | −7908 | −1004 |
| Domestic net balance (WEDS-WEDP) | −16,747 | −94,383 | −12,047 | −15,415 | −86,475 | −11,044 | 1331 | 7908 | 1004 |
Despite the fact that the direct water consumption of the Spanish food sector can be considered limited, the volume of water embodied in exports and imports of these products to the rest of the world, as well as the exchanges of embodied water with other domestic sectors is really significant.
Table 2 shows that the Spanish food industry exported in its products about 2899, 17,092 and 2145 million m
3 of blue, green and grey water, respectively, in 1995. These volumes notably increased between 1995 and 2009, growing yearly at an average growth rate higher than 2.5%. Green water displayed not only the largest absolute increase (8401 million m
3), but also the most rapid average annual growth (3%). In 1995, over 90% of water embodied in exports was a direct consequence of the exports of final food products produced with inputs from other Spanish sectors (see Table S1). Besides, the remaining Spanish food exports (about 10%) also consisted of outputs that were produced domestically, but using inputs coming from abroad. In 2009, the pattern was quite similar; however, the share of water embodied in exports produced with foreign inputs increased, chiefly in the case of green water.
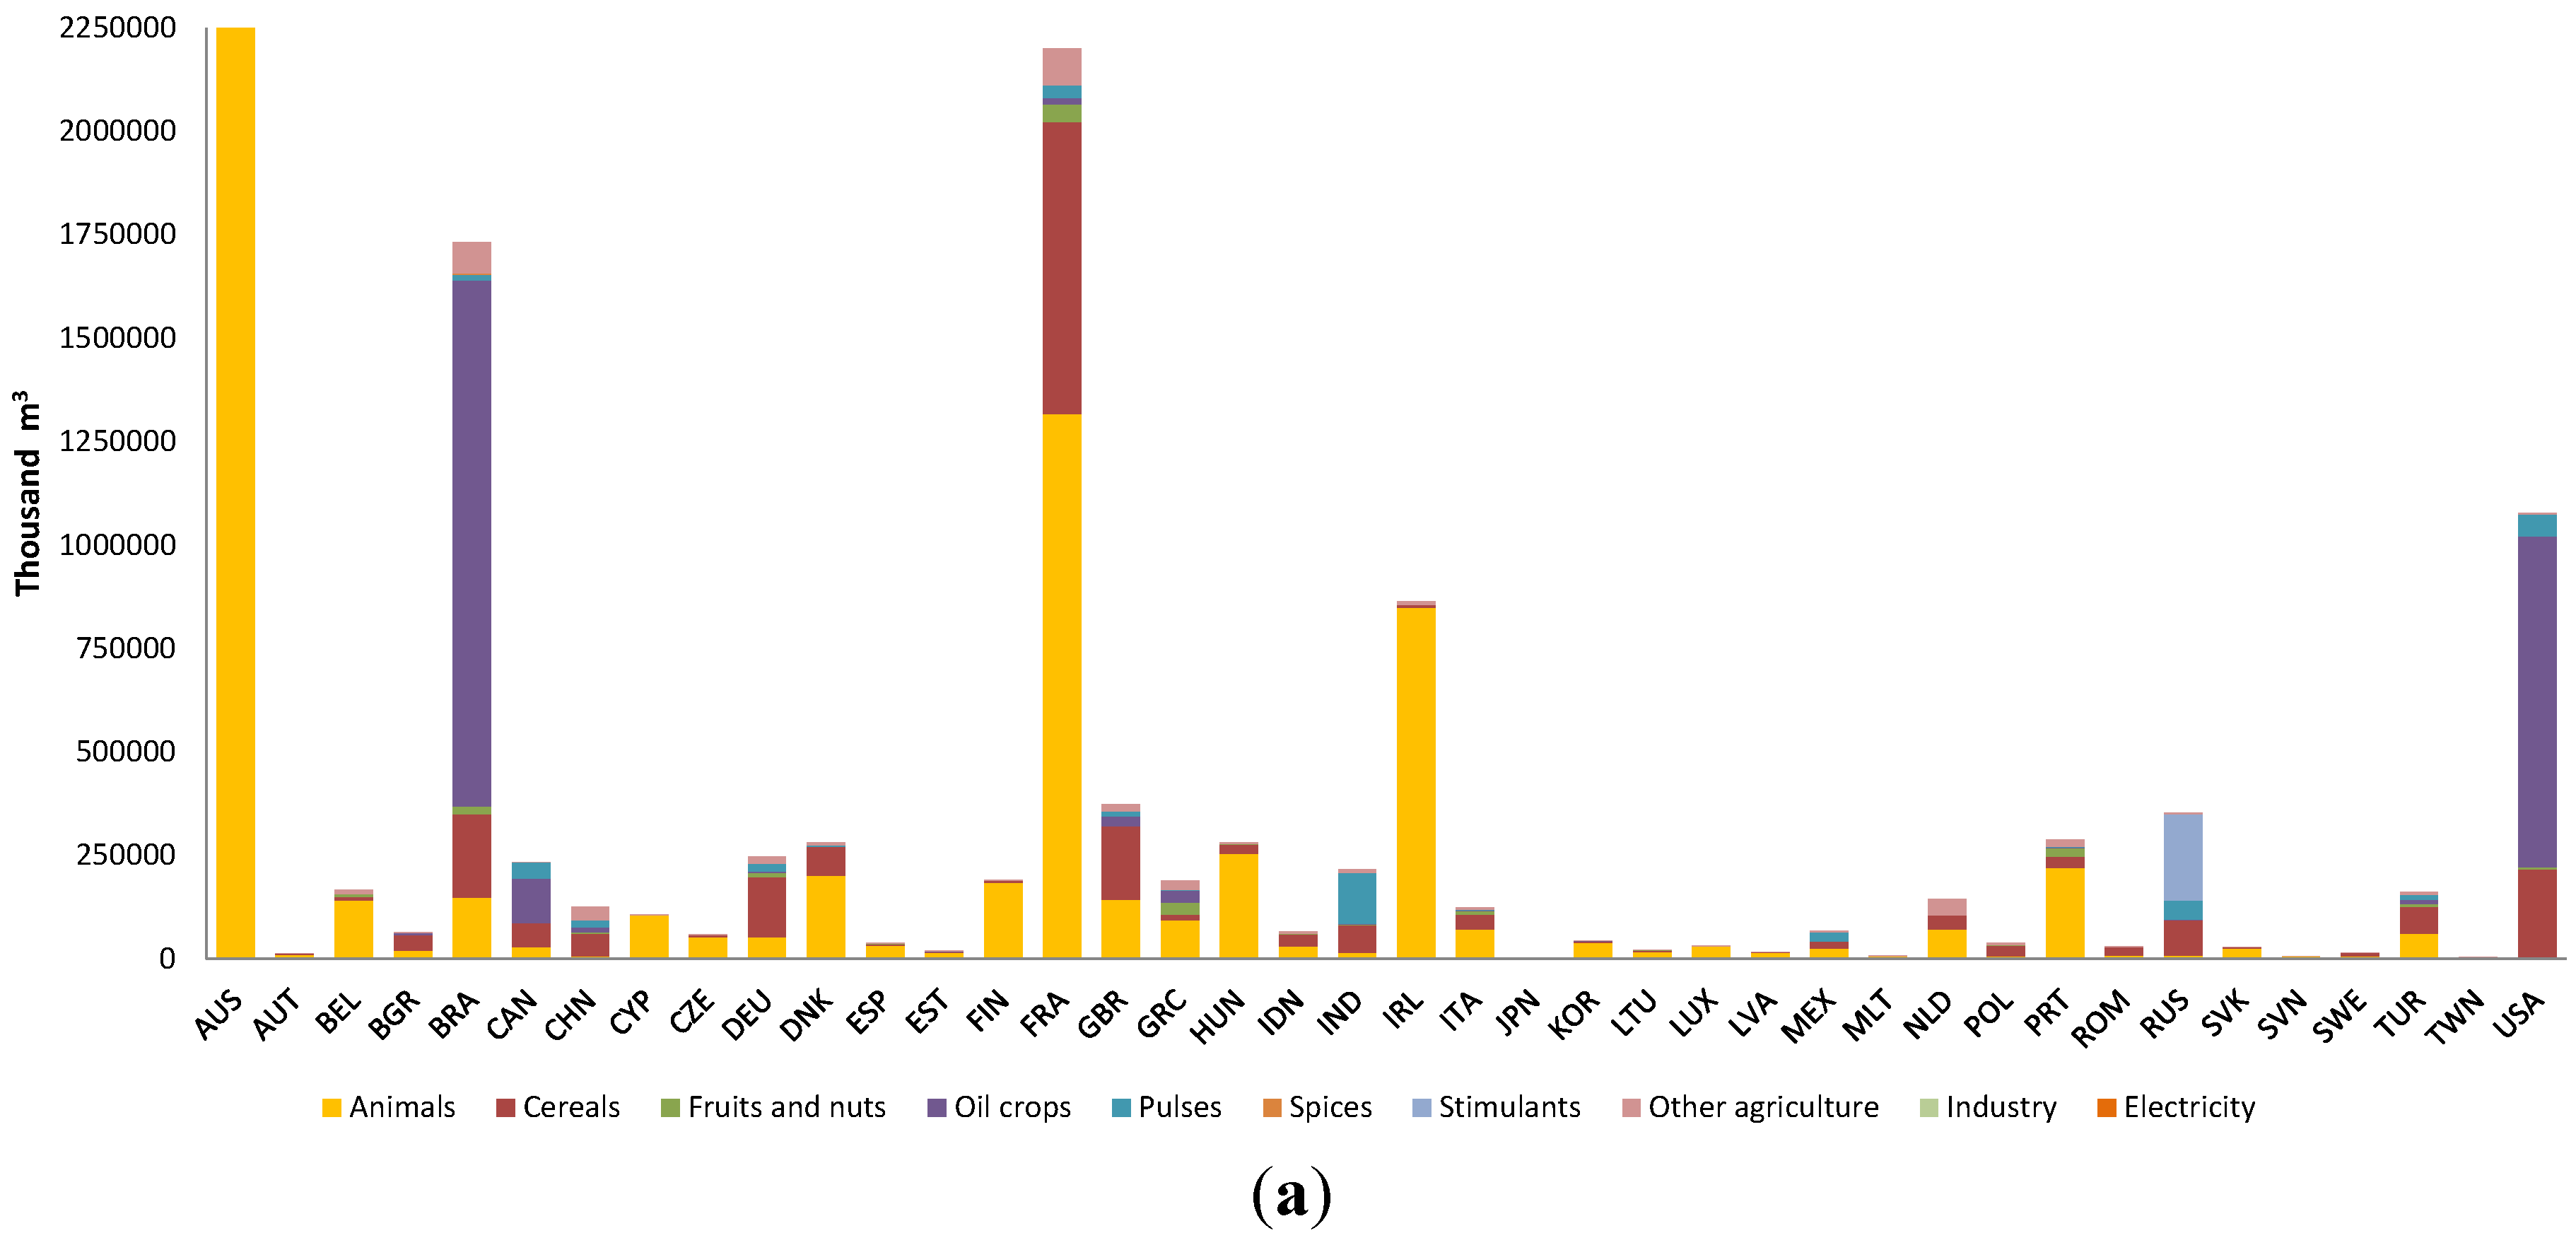
As seen in
Figure 1 (and in Figures S1 and S2), the food industries in France, Italy, Portugal or Germany were the main destination of water embodied in Spanish water exports, both in 1995 and 2009. Some of the flows experienced a great increase during these years; this is the case of exports to Bulgaria, Romania, Lithuania, Latvia, Hungary, China and India, which increased more than seven-fold. On the contrary, exports of water embodied in food products to countries, such as Australia, Japan, Brazil, the USA and Turkey, tended to decrease. This can be seen for all colors of water.
Concerning imports, they went from 3252 million m3 of blue water, 30,879 of green water and 3282 of grey water in 1995 to 4350, 43,242 and 4632 million m3 of blue, green and grey water in 2009, respectively. On the whole, in 1995, more than 50% of water came embodied in final food output from abroad. This percentage increased by 2009 accounting for about 65%, regardless of the color of water examined. This means a sort of delocalization of impacts, increasing the pressure on other countries induced by the Spanish food products. About 35% of water was also imported, embodied in inputs to produce final outputs that were domestically consumed in 1995. By 2009, these imports represented 25% on total water embodied in imports. Besides, Spain also imported water through inputs used in the food industry that were re-exported, representing around 7% on total water embodied in imports by 1995 and 9% in 2009 (see Table S1).
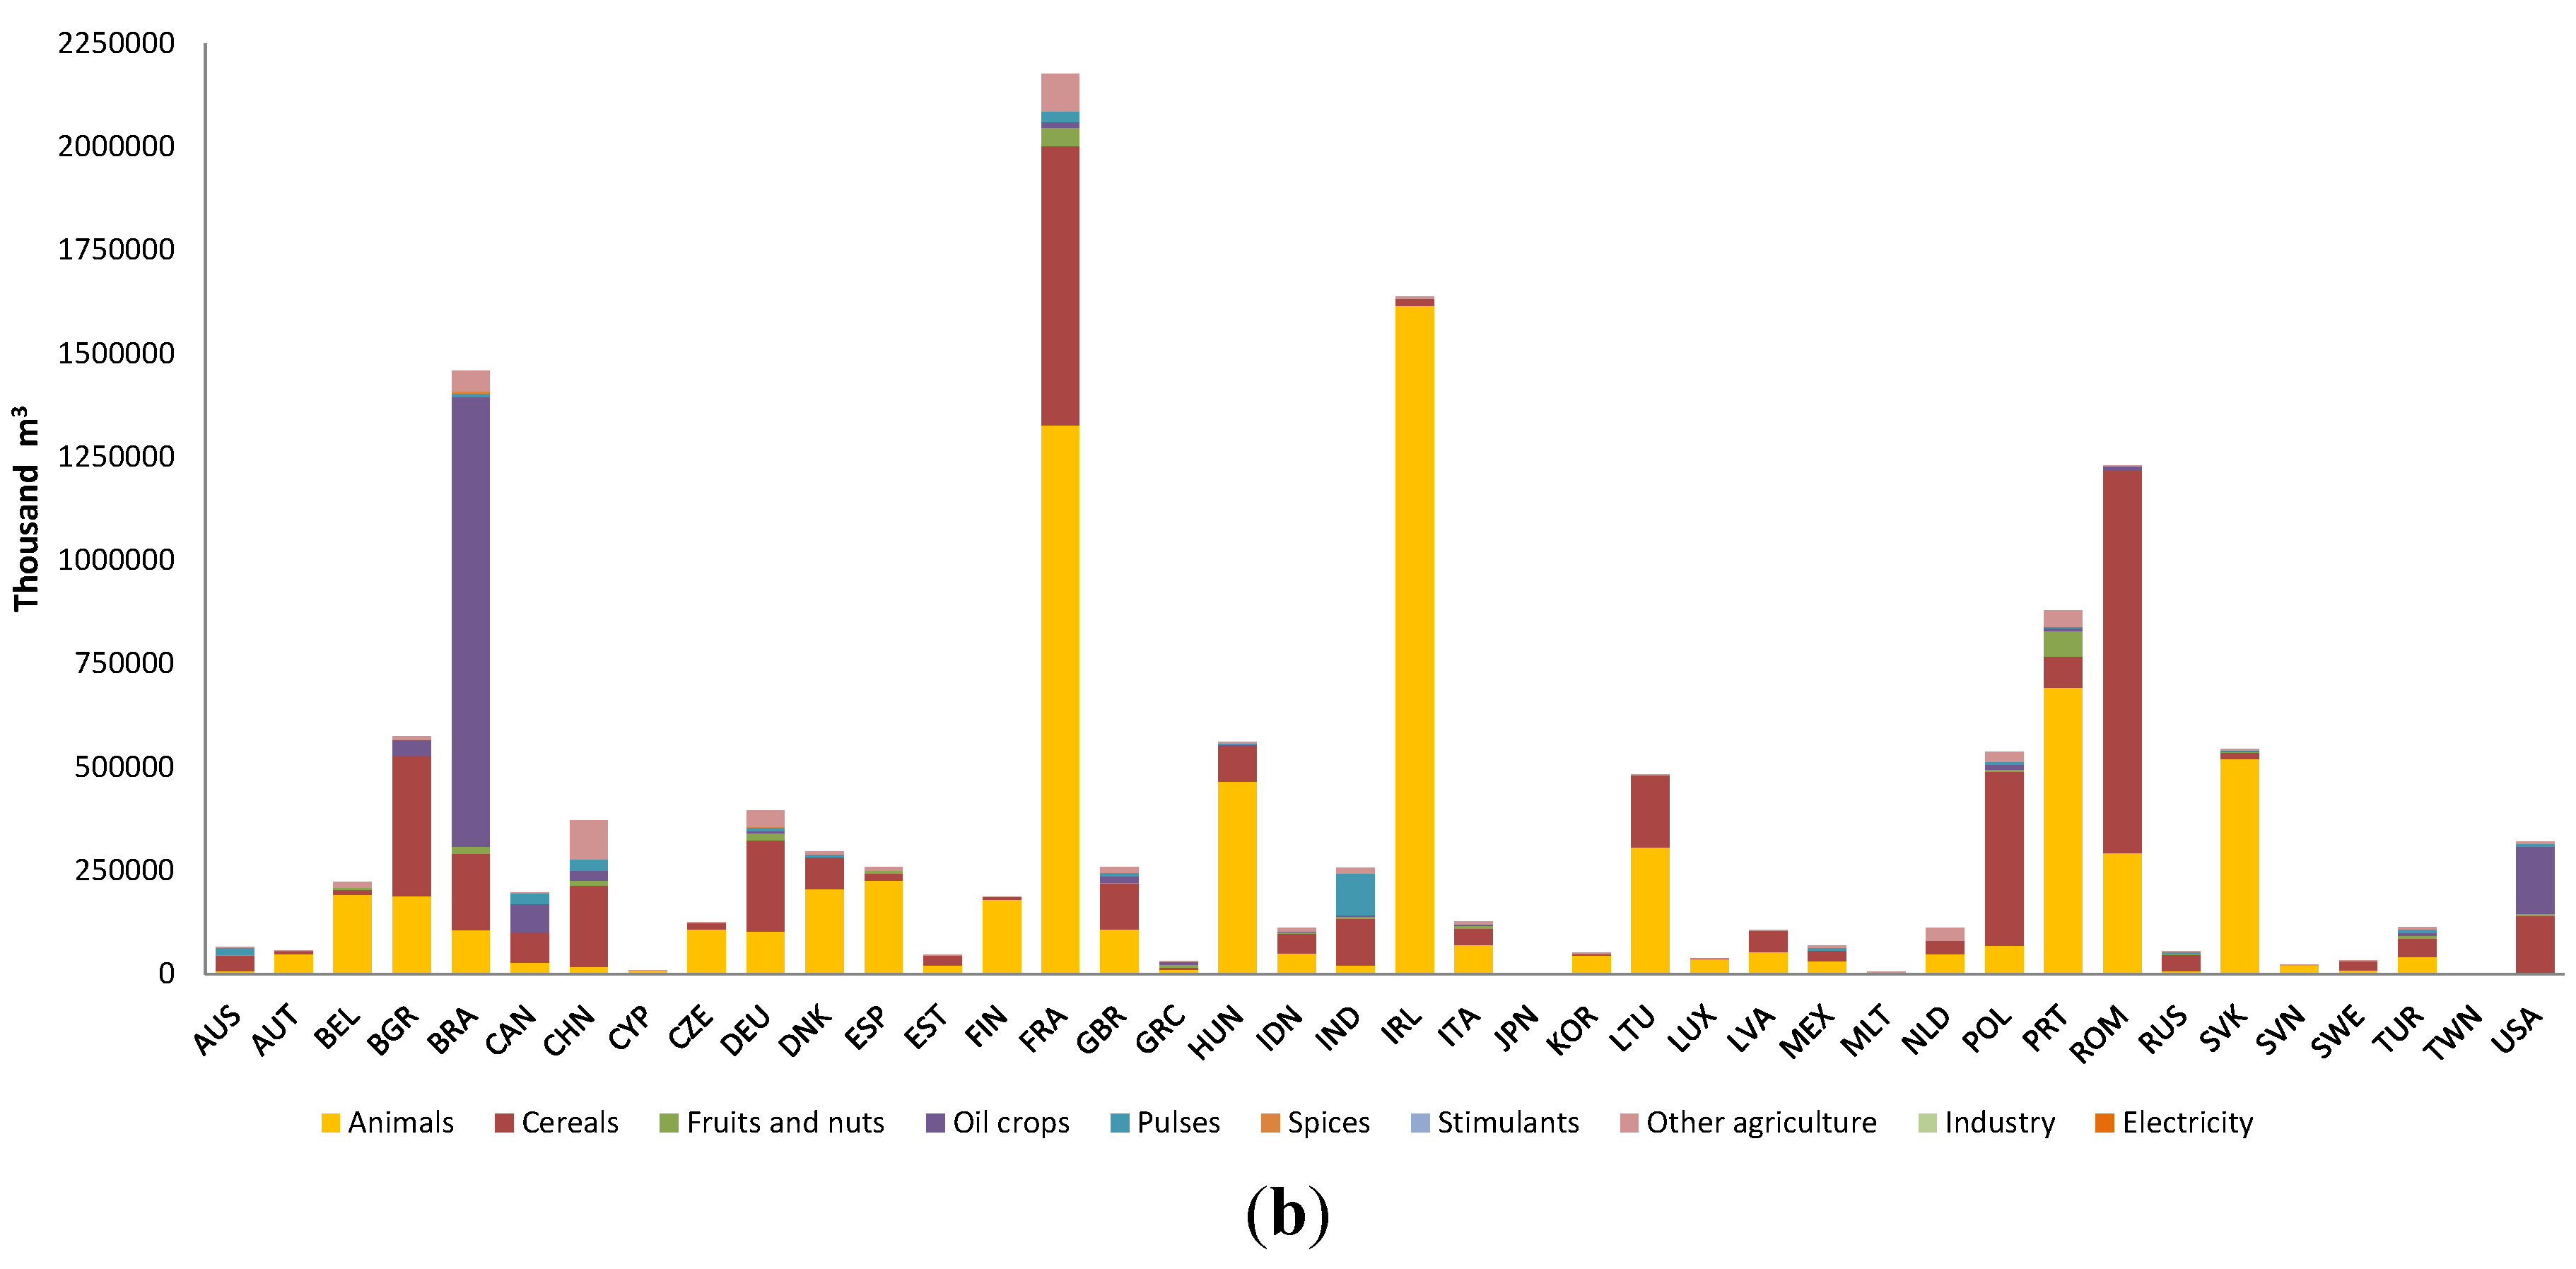
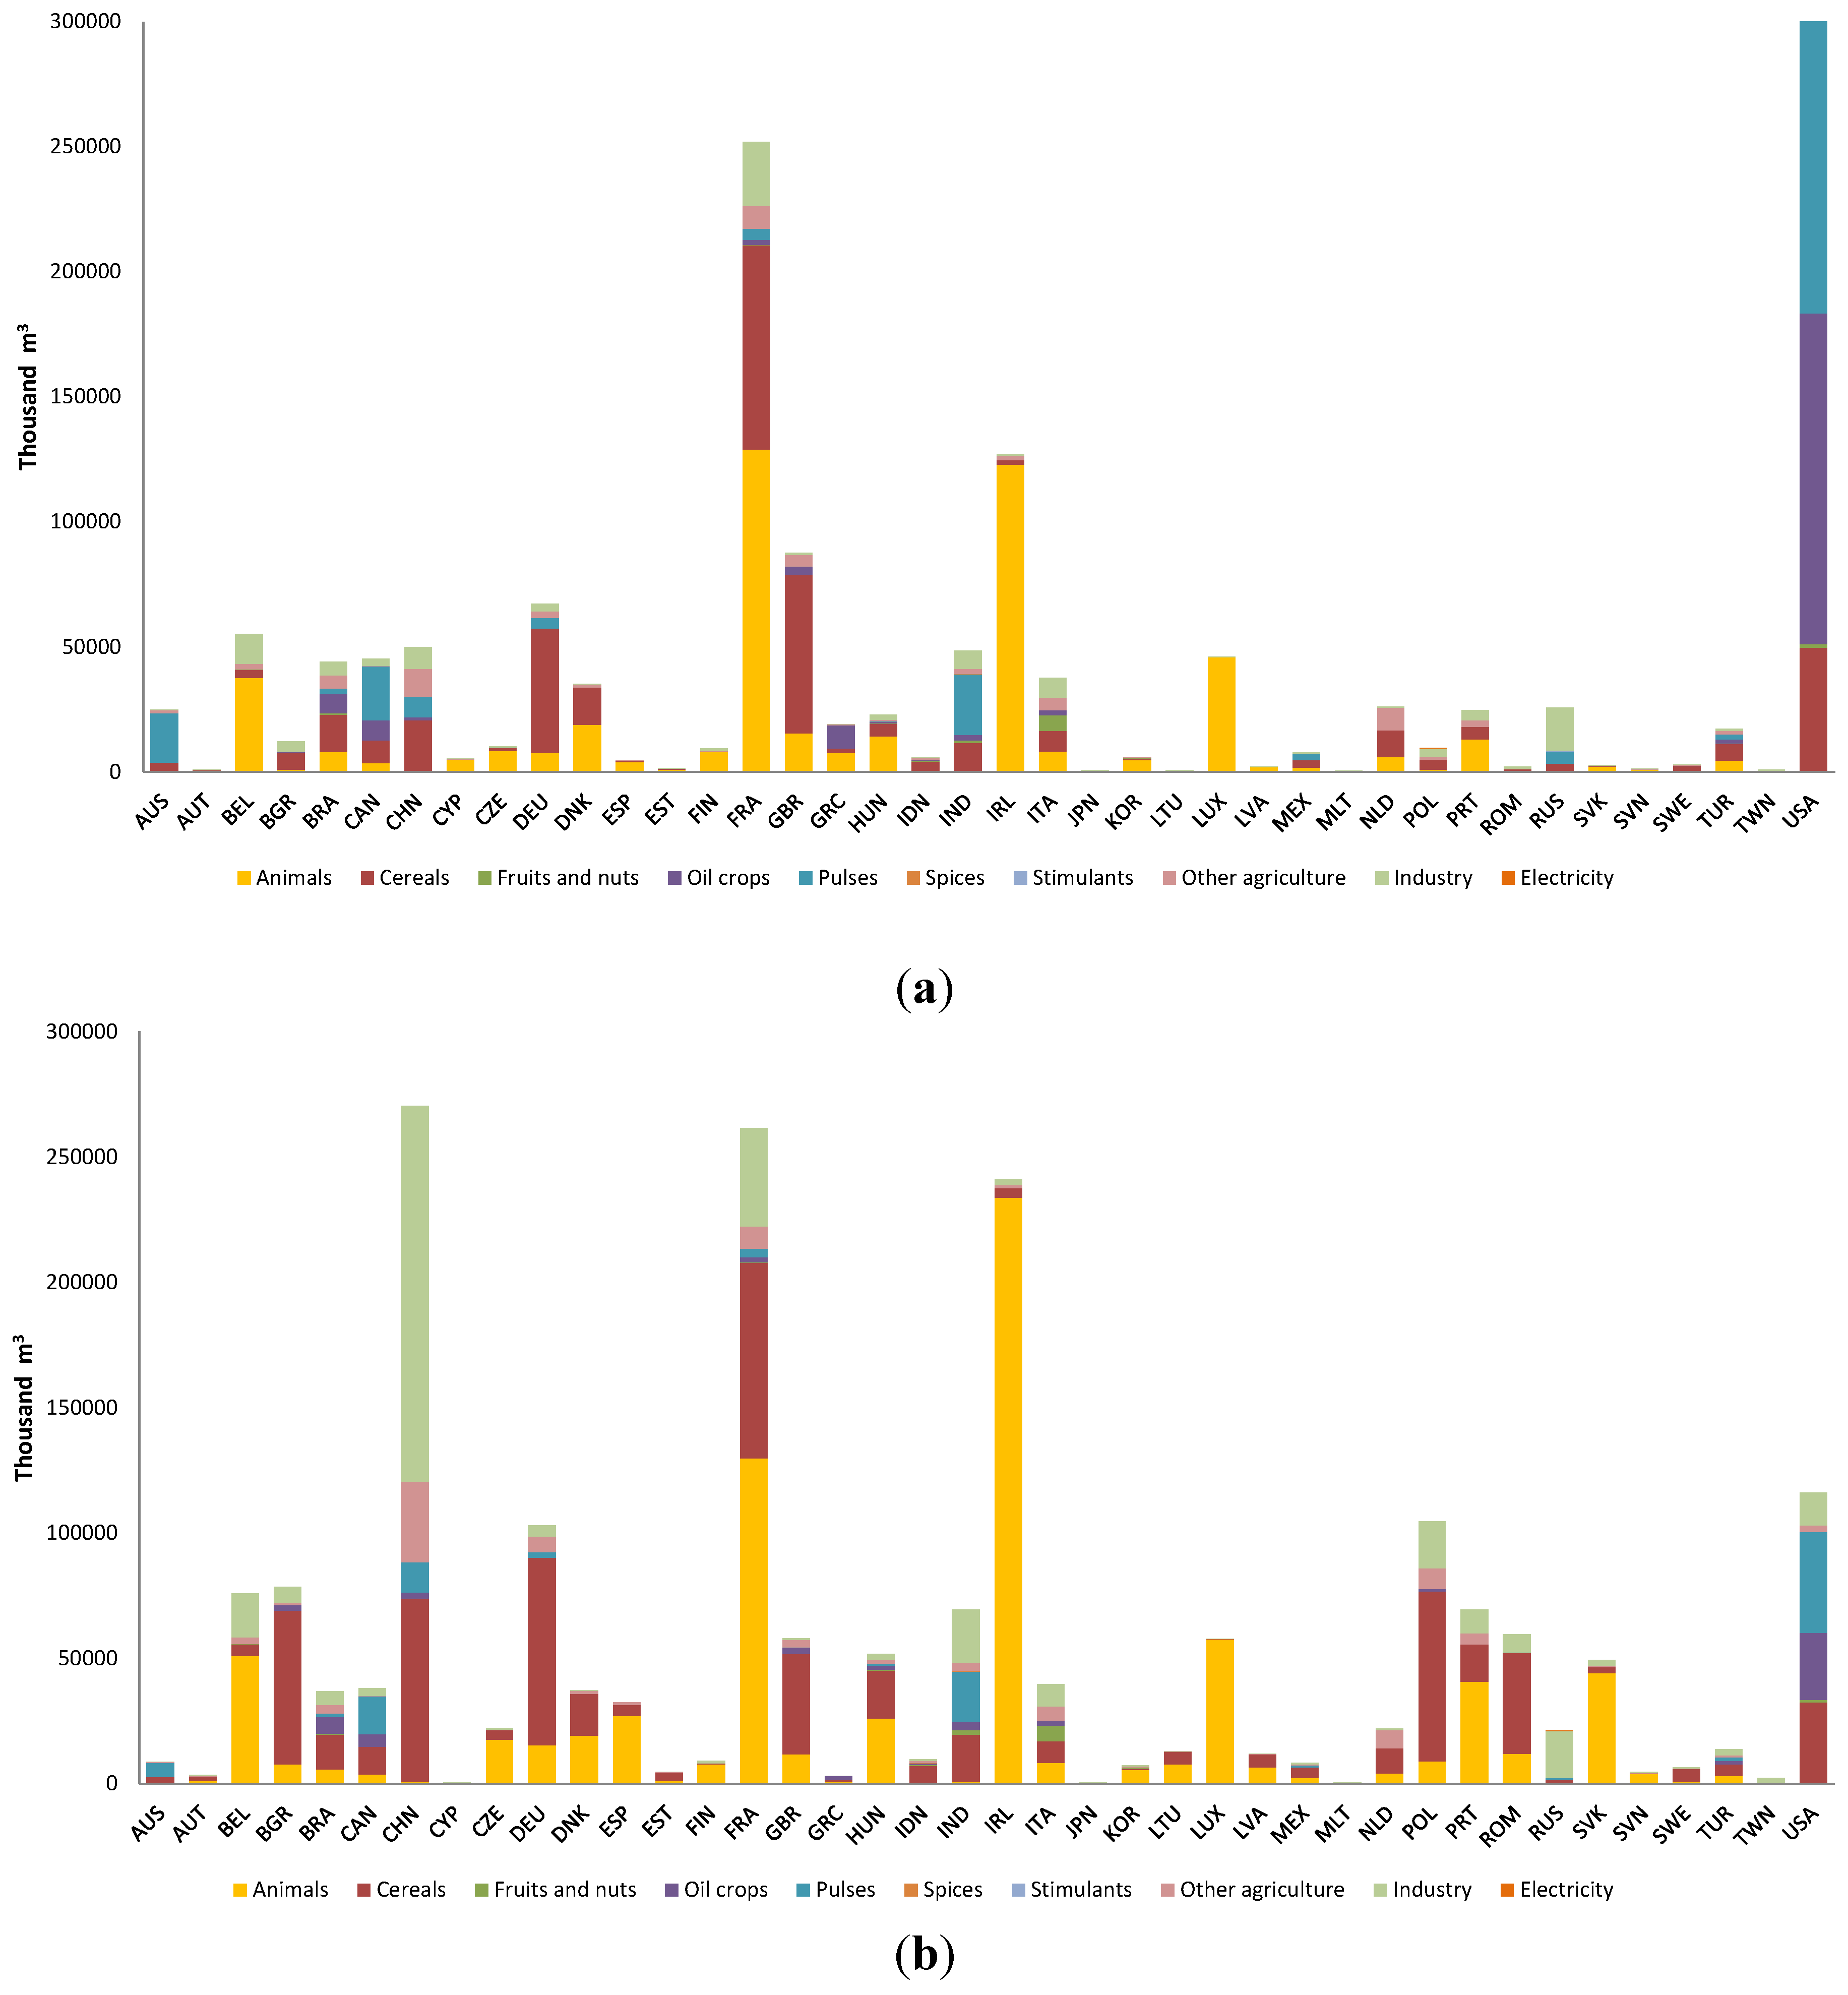
As we can see in
Figure 2, in 1995, Spain tended to import blue water mostly from the USA and France. The former provided blue water embodied chiefly in oil crops; however, the latter did it by means of animals, cereals, fruits and nuts, other agricultural products or even the electricity sector. Ireland can also be highlighted as a provider of blue water to Spain by means of animals. The picture seems to be quite different in 2009. Despite that the Spanish food sector kept on obtaining water mostly from the farming sector in France and other agricultural sectors, Spain reduced its blue water imports from the USA. In return, Ireland notably increased its share in the food water imports, transferring mostly water through animals. The same happened with Portugal, which more than doubled its virtual blue water exports to the food industry in Spain. In this period, Spain also obtained large volumes of water embodied in cereals and the electricity sector in China, as well as in cereals and oil crops from India and Romania.
Figure 1.
Blue virtual water exports of the food sector by country and sector in 1995 (a) and 2009 (b), thousand m3.
Figure 1.
Blue virtual water exports of the food sector by country and sector in 1995 (a) and 2009 (b), thousand m3.
Figure 2.
Blue virtual water imports of the food sector by country and sector in 1995 (a) and 2009 (b), thousand m3.
Figure 2.
Blue virtual water imports of the food sector by country and sector in 1995 (a) and 2009 (b), thousand m3.
Figure 3 shows the pattern of water embodied in imports for green water. In this case, both France and Brazil were the main providers of green water, both in 1995 and 2009. Whereas France exported water embodied in animals and cereals, the Latin American country provided water embodied in oil crops. The share of Brazil for virtual water imports decreased by 2009, but there was an increase in the contribution of countries, such as Ireland, Romania, Portugal and Poland. Displacements of green water from Ireland and Portugal to the Spanish food sector were mainly associated with animal inputs; nevertheless, in the case of Eastern European countries, they were related to cereals used in the Spanish food sector as an important input.
Figure 3.
Green virtual water imports of the food sector by country and sector in 1995 (a) and 2009 (b), thousand m3.
Figure 3.
Green virtual water imports of the food sector by country and sector in 1995 (a) and 2009 (b), thousand m3.
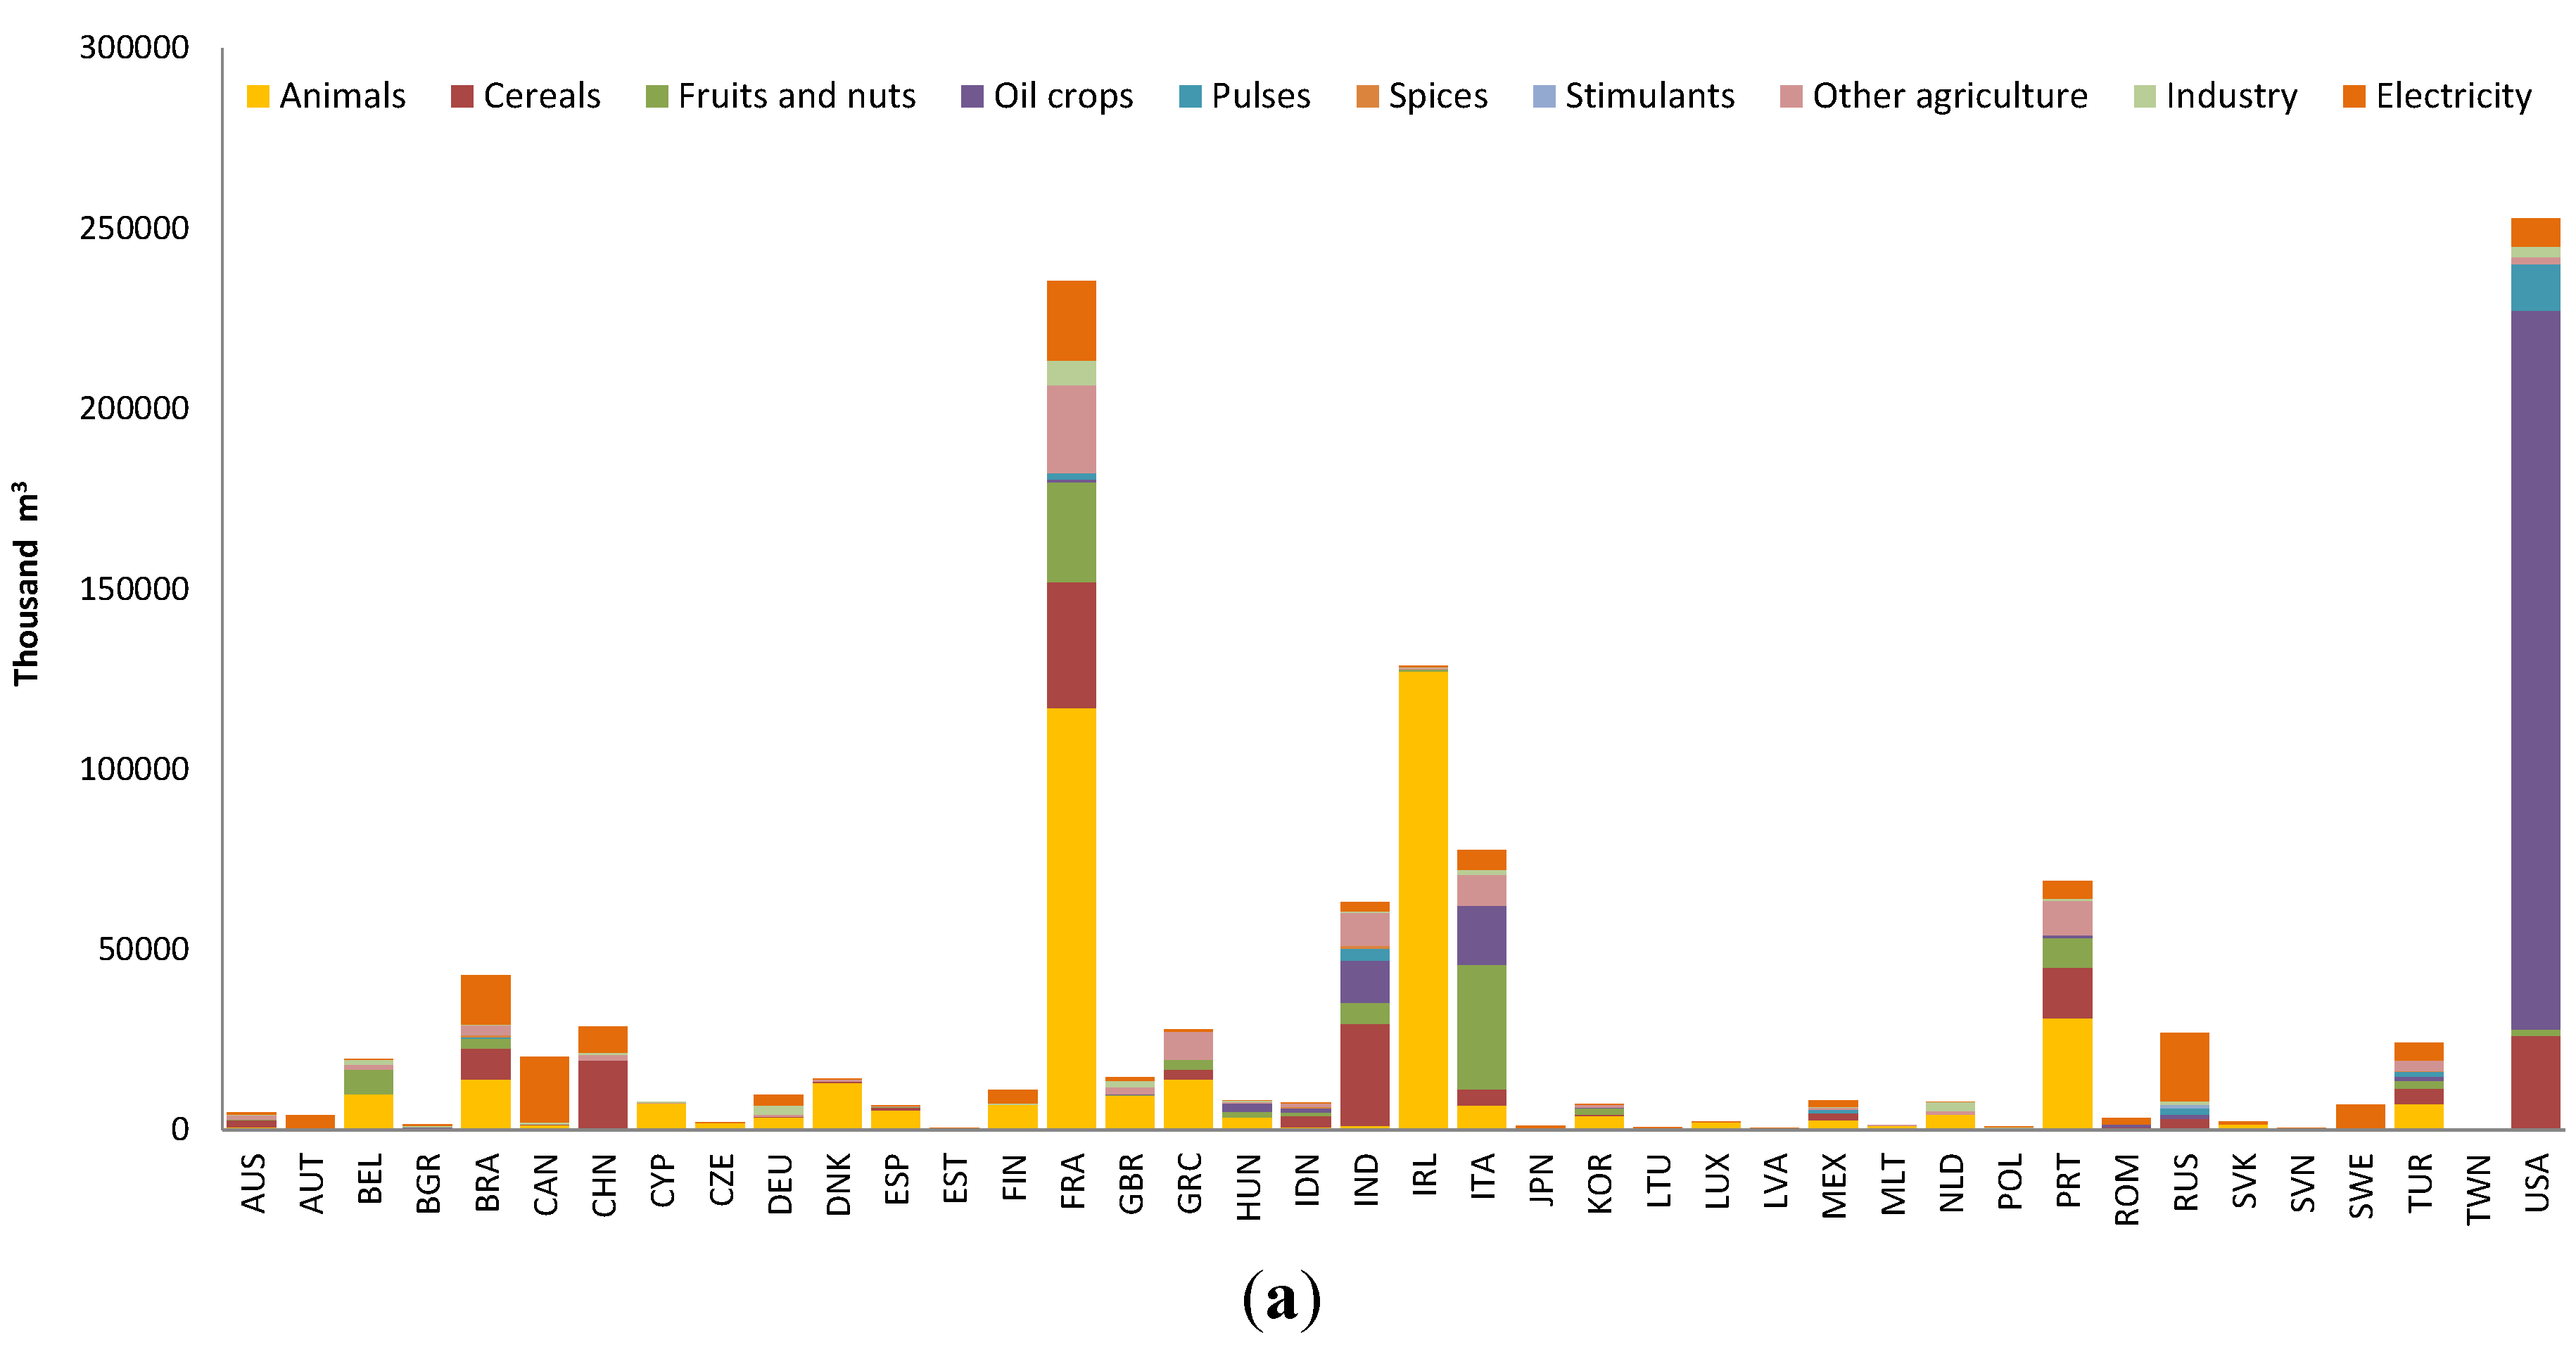
Finally, as for grey water (
Figure 4), in 1995, it was imported as embodied in animals and cereals from France and also in cereals, oil crops and pulses. Growing these agricultural products involves important impacts on water resources, and Spain prevented water pollution by importing these products. In 2009, Spain still imported grey water from France and the share for the USA fell in Spanish food imports. Nonetheless, the most remarkable feature was the great increase of grey water imports from China embodied in industrial products, cereals, pulses or vegetables. Furthermore, in 2009, Spain increasingly imported grey water from Poland, Romania and Bulgaria embodied in cereals and from Ireland embodied in animals.
Thus, in the balance, the Spanish food sector was a net importer of water resources. That is, the volume of water obtained from abroad was higher than the water resources provided to the rest of the world. This is found for green, blue and grey water. Moreover, this pattern tended to consolidate, i.e., the gap between virtual water imports and exports kept on widening between 1995 and 2009. This was particularly intense for green water and less profound in the case of blue water.
When looking at a particular sector, it is also of great importance to analyze the exchanges of water embodied with other domestic sectors (
Table 3). This is essential in the Spanish food sector, since it shows remarkable backward and forward linkages with other Spanish industries. In fact, the Spanish food industry gets 16,762 million m
3 embodied in products from other domestic sectors. Around 84% of these inputs are used to produce food output that is domestically consumed, and the remaining 16% is exported. However, the Spanish food sector only provides 15.8 million m
3 to other Spanish industries. Looking at the backward linkages first, it seems quite clear that between 1995 and 2009, there was a reduction in the volume of water embodied in inputs purchased from other domestic sectors. Firstly, water was obtained as embodied in animals, cereals, dairy products, eggs, fruits, nuts, sugar crops and electricity, both in 1995 and 2009. Nevertheless, the volume of water obtained through these products tended to decrease during these years, with the exception of the backward linkages with the electricity sector that tended to strengthen.
Figure 4.
Grey virtual water imports of the food sector by country and sector in 1995 (a) and 2009 (b), thousand m3.
Figure 4.
Grey virtual water imports of the food sector by country and sector in 1995 (a) and 2009 (b), thousand m3.
Besides, there was also a trend towards the strengthening of the forward linkages with other Spanish sectors that also increased the consumption of domestic blue water. The Spanish food sector has a strong dependency on the final demand of the hotel and restaurant sector, which stands out as the main final consumer of Spanish blue water and whose water demands increased from 1995 to 2009. In addition, Spain also obtained water embodied in inputs from other domestic sectors to export food products to countries, such as Belgium, France, Italy, Netherlands, China, Poland, among others.
Table 3.
Water embodied in Spanish food sector purchases from domestic sectors, thousand m3.
Table 3.
Water embodied in Spanish food sector purchases from domestic sectors, thousand m3.
| Product | 1995 | 2009 |
|---|
| Blue | Green | Grey | Green | Blue | Grey |
|---|
| Animals | 14,166 | 71,989 | 10,596 | 11,992 | 59,260 | 9074 |
| Cereals | 1,613 | 5,866 | 1,583 | 1,339 | 4,732 | 1,315 |
| Fruits and nuts | 64 | 874 | 11 | 48 | 620 | 11 |
| Milk and eggs | 353 | 2368 | 404 | 296 | 1928 | 337 |
| Oil crops | 0 | 28 | 1 | 0 | 22 | 1 |
| Pulses | 16 | 230 | 9 | 11 | 152 | 7 |
| Roots and tubers | 78 | 88 | 52 | 64 | 73 | 44 |
| Sugar crops | 147 | 116 | 69 | 124 | 99 | 60 |
| Vegetables | 10 | 405 | 25 | 8 | 308 | 19 |
| Food, Beverages and Tobacco | 24 | 0 | 0 | 25 | 0 | 0 |
| Pulp, Paper, Paper , Printing and Publishing | 4 | 1 | 1 | 0 | 0 | 0 |
| Chemicals and Chemical Products | 4 | 1 | 1 | 4 | 1 | 1 |
| Electricity, Gas and Water Supply | 307 | 49 | 49 | 4 | 1 | 1 |
Given the former findings, it is possible to say that during the period 1995–2009, the Spanish food industry went through a process of commercial integration in international trade that resulted in growing pressures on domestic water resources. These pressures took place mostly through the intense, but also decreasing backward linkages with Spanish agriculture. In this line, it seems to be a kind of substitution effect, decreasing imports of water from other Spanish sectors (mainly agriculture), but increasing imports of agricultural goods from abroad. From an environmental perspective, this would mean a tendency towards reducing the pressure on domestic water resources by means of imports of intermediate products, but increasing environmental damage abroad. In the case of blue water, this substitution was so intense, that it involved a drop of embodied water consumption between 1995 and 2009. Besides, Spain exported goods that were chiefly used as intermediate inputs in the food sector of other countries, i.e., it exerted damage on its natural resources to produce goods that were further processed in other countries, with these areas being the ones that obtained the higher share on the total value added. Moreover, water embodied in food output was also finally consumed by the Spanish hotel and restaurant sector.
As we can see in
Table 2, embodied water consumption increased for green and grey water between 1995 and 2009; nonetheless, it fell in the case of blue water. This decline was a direct consequence of the intense drop experienced by virtual water imports from other Spanish sectors previously seen, despite virtual water imports from other countries growing. Therefore, we can say that there was a clear increase in the final consumption responsibility of the Spanish food sector for green and grey water. On the contrary, as for blue water, the final consumption responsibility falls during this period. Quite the opposite, the production responsibility of the Spanish food sector grew, that is domestic direct water consumption rose. Given these trends, in the following, we are applying structural decomposition analysis, trying to quantify the factors behind changes in the final consumption and production responsibilities of the Spanish food sector.
The increase in the embodied green water consumption happening between 1995 and 2009 was mainly due to the growth in the demand for water of the food sector in Spain, that is the scale effect (see
Table 4). This demand was mainly driven by water embodied in animals and cereals produced in Spain, as well as by water embodied in animals from ROW, France and Portugal, Cereals from China or ROW, Oil Crops from ROW, Brazil and the USA or stimulants from ROW. In this regard, it is important to highlight that the scale effect was higher if we compare the demand for water embodied in foreign goods (550%) to the Spanish demand for water embodied in domestic final goods (100%). Additionally, embodied green water consumption was also boosted by the backward technological effect. There seems to be a tendency towards the reduction of input purchases from countries that would involve a deceleration of water consumption, such as, for example, animals from Ireland and France, oil crops from the USA, cereals from France or stimulants from ROW and Russia. However during these years, imports of intermediate inputs from other countries that utilize more water-intense technologies increased. This is the case of the upsurge of animal imports from ROW, Slovak Republic, Romania and Lithuania or cereals imports from Romania, Poland or Bulgaria. Hence, these inputs coming from abroad and embodying large volumes of green water also made embodied green water consumption to rise (90%).
As shown in
Table 4, the picture on grey water was quite similar to the former, but we can also find some peculiarities. The great boost of the demand for final domestic and imported goods also entailed an increase in the embodied grey water consumption. Domestic and foreign water intensity changes (mainly in the cereals and animals sectors from ROW, Spain and China), as well as changes in domestic technology grey water consumption declined.
Table 4.
Decomposition analysis of water consumption.
Table 4.
Decomposition analysis of water consumption.
| Consumer Approach/Embodied Water Consumption |
| Water type | Water change (Thousand m3) | Domestic intensity (%) | Imported intensity (%) | Domestic technology (%) | Backward technology (%) | Domestic demand (%) | Demand for imports (%) |
| Blue | −1,568,777 | 209 | 107 | −2 | −22 | −45 | −146 |
| Green | −3,946,015 | 446 | 375 | 23 | −90 | −100 | −555 |
| Grey | −679,231 | 331 | 182 | 17 | −7 | −74 | −349 |
| Producer Approach/Direct Water Consumption |
| Water type | Water Change (Thousand m3) | Intensity (%) | Domestic technology (%) | Forward technology (%) | Domestic demand (%) | Foreign demand (%) |
| Blue | 8427 | 0 | −10 | 4 | 50 | 56 |
As for blue water, embodied water consumption decreased during these years. In this case, the large upsurge of demand, i.e., the scale effect, was totally made up by the negative contribution of water intensity and domestic technology changes. Again, it was the large demand for animals and cereals, both from Spanish and foreign agricultural sectors, that involved the largest pressure on global blue water resources. Regarding the technology effect, it is also possible to find foreign technological improvements that moderate water consumption, particularly in the case of oil crops in the USA or animals in Ireland and France. However, given the growing imports of blue water embodied in animals from ROW, in cereals from China, Romania and India or in electricity from Russia and China, the backward technological effect displays a slight, but positive sign. Finally, intensity changes also contributed to the deceleration of embodied blue water consumption (10%).
In the case of blue water direct consumption (
Table 4), we found an increase of around 8427 thousand m
3. This increase was triggered by the scale effect. Both internal (50%) and foreign (56%) demand for final food products boosted blue water consumption. These increasing demands for goods produced in the Spanish food industry that embody large volumes of blue water were driven by the Spanish hotel and restaurant sector and also by other European food sectors, like the ones in France, Italy, Portugal, Germany and Great Britain. The construction, health and social work sectors in Spain also exerted some pressure on blue water. The forward technology effect also involved a larger consumption of blue water, although to a lesser extent (4%). This can be associated with the growing exports to the food sectors in ROW, France, Portugal, Germany, Italy and also the hotel and restaurant sectors in France. Finally, intensity changes in the Spanish food sector, but mostly domestic technological improvements, made direct blue water consumption increase and then level off.
Accordingly, the change in the water consumption of the Spanish food industry between 1995 and 2009 was mainly associated with the growth of domestic demand, as well as the increasing trade exchanges with other countries. On the one hand, the notable economic growth experienced in Spain during these years led to a generalized increase in households’ income, also implying changes in lifestyles and consumption patterns. In this regard, Cazcarro
et al. [
40] showed that the consumption patterns of households, whose diets present a high meat content, are behind an important share of total water consumption in Spain. On the other hand, trade has alleviated, to some extent, the pressures on water resources through imports of agricultural inputs.
4. Conclusions
In this paper, the Spanish food industry has been analyzed from an environmentally multiregional input-output approach. This study offers insights into the importance of studying the impact of the food sector on water resources over global international chains, considering both direct and indirect water consumption. In fact, we show the strong pressures that the Spanish food industry has exerted on domestic and foreign water resources given the strengthening of the interrelations among sectors and countries happened between 1995 and 2009. Demand growth together with changes in consumption patterns and the growing commercial exchanges during these years have been key to explain the trend followed by water consumption.
The Spanish food sector has gone through a process of growing vertical integration in global and domestic supply chains that has involved increasing pressures on water ecosystems all over the world. This industry presents important backward linkages with the agriculture and electricity sectors in Spain and the rest of the world, meaning that it obtains water embodied in intermediate products that will be subsequently processed. Besides, there is a tendency towards the substitution of water embodied in domestic for imported agricultural inputs, entailing an externalization of the pressures on water resources. It happened for the three types/kinds of water considered, but was particularly intense in the case of blue water, involving a decline in embodied blue water consumption during these years. This was a direct consequence of the decreasing backward linkages with domestic agricultural sectors, mostly cereals and animals. Nevertheless, these products were increasingly imported from other countries, such as Ireland, Portugal, France, China and the rest of the world. This substitution prevented higher water consumption in Spain. However, water crystallized in the products of the food industry grew at the global level, since Ireland, ROW and Portugal produced cereals and particularly animals with higher green water than Spain. In this period, we also found growing forward linkages with the food industry sectors of other countries and with the hotel and restaurant sector in Spain.
The increase in green and grey embodied water consumption was mostly driven by the growing demand of food products. However, water intensity, together with changes in domestic technologies and also the backward technological effect for grey water, triggered the deceleration of water embodied. The contribution of the former effects and more concretely of the improvement of Spanish technology were so intense in the case of blue water, that it totally made up for the boost of the scale effect.
Although it is necessary to be aware of the methodological and conceptual uncertainties of the water footprint and virtual water concepts [
41,
42], the study of water embodied in domestic and international flows, providing a consumption-based perspective of the water consumption at the global level, represents an informative tool, which may be useful for policy makers at different decisional scales (local, national and supranational). In this line, Hoekstra and Mekkonnen [
12] show that the large volume of international virtual water flows and the associated water dependencies make it necessary to study water scarcity in a global context. However, as some studies argue [
43,
44], it is necessary to identify the flows coming from water-scarce areas before concrete drawing policy implications. Dalin
et al. [
45] indicate that it is possible to obtain global water savings from virtual water trade due to an increase in the proportion of water-efficient relationships, an increase in volumes of food traded through efficient trade relationships and an increase in the gap between the virtual content of products in the importing country and the exporting country. In this line, as Cazcarro
et al. [
46] suggest, using traceability indicators of water to inform about the water content of products could be a way to improve water management and reduce environmental impacts. Multiregional models can be therefore an interesting tool to track water demands from production to consumption through global supply chains, offering useful information on the economic demands and their associated environmental impacts.
Hence, this paper offers an empirical application of the way that the existing linkages on the global economies affect water resources. It is necessary therefore to develop comprehensive assessments of the use and consumption of water in the economies to understand which countries and sectors are the main contributors to water consumption trends. That way, it would be possible to study the relationship between global water scarcity and food security in a more general framework. Furthermore, it seems essential to promote the improvement of technologies, as well as the moderation and change of demand patterns, looking for more sustainable economies.


