1. Introduction
Rainfall-runoff is an important component of hydrological cycles, as it determines many of the characteristics of a landscape and the occurrence and size of floods; thus, understanding and modeling the rainfall-runoff process is essential in many flood and water resources problems [
1]. Owing to different meteorological and land conditions, it can be found that there is a significant difference between arid or semi-arid climates with deep water tables and humid areas with shallow water tables. Therefore, the correct understanding of the most important hydrological processes under different climate conditions or special study areas is fundamental, for either an appropriate creation of a new hydrological model or the correct choice among a large number of existing hydrological models.
Identifying the runoff generation mechanism and controlling factors is useful in the prediction of hydrological response. In arid or semi-arid areas, a large body of knowledge concerning the hydrology processes has been collected during the last three decades [
2,
3,
4,
5,
6]. Examples include the surface runoff generation in the Mediterranean semi-arid environment, where the soil type and rainfall characteristics exerted the runoff mechanism [
3] and the hydrological response of runoff; and soil moisture and groundwater levels to rainfall events in semi-arid Zimbabwe [
5]. These studies show that the hydrological responses and processes in different regions are strongly influenced by variations in soil type, vegetation and slope angle, apart from the temporal and spatial variability of rainfall, and the main factors affecting the runoff processes varied by the actual characteristics of the different study areas [
5,
7].
In addition, some research focused more on the interactions between the surface condition and runoff production or runoff measurement at different scales in semi-arid areas by field study. The results showed that the relationships among runoff, infiltration, vegetation and geomorphology are different at different scales, and the runoff decreased with an increasing scale [
2,
6,
8]. Moreover, due to the close relationship between stream flows, especially subsurface flow processes and soil moisture patterns [
9], some studies also focused on the patterns and spatial variability of soil moisture on runoff formation, which plays an important and key role in hydrological processes, especially in the runoff simulation of hydrology models [
10,
11].
Numerous studies regarding hydrological processes have been carried out in arid or semi-arid areas of different regions, due to the lower amount of effective rainfall events there, as well as the heterogeneous underlying surface. However, little research on the rainfall-runoff processes has been conducted in the semi-arid regions of northern China, where the rainfall-runoff data on a natural slope is very difficult to observe for the study of runoff generation [
12]. Furthermore, other than surface runoff, subsurface flow is generally observed and analyzed in the purple and red soils of southern China [
13,
14,
15], but rarely in those of northern China. Yu
et al. investigated the slope runoff generation in a 50-m
2 runoff plot in mountainous areas of northern China by means of simulated rainfall experiment, and the results showed that surface flow was the main contributor, accounting for more than 60% of the total runoff in this study area [
12]. Han
et al. discussed the critical factors of runoff generation and the differences between overland and subsurface flow in Shimen hillslope micro-catchment of Taihang Mountain [
16]. For the mountain-constrained environment, these studies were generally conducted on bare land or sparse land with a steep slope, and subsurface flow was rarely studied in detail.
In order to understand the runoff generation process in these regions, rainfall simulation experiments have been an important research approach to rainfall-runoff process and soil water movement under different conditions and are widely used in the field of hydrology [
11,
17,
18]. A number of studies on slope runoff, performed by means of simulated rainfall, have also been conducted on the Loess Plateau of China [
19,
20]. However, the rainfall-runoff process in northern China, especially in areas with gradual slope angles and shallow soil depths, has rarely been studied. Beyond this, as a key state variable of hydrological processes and rainfall-runoff modeling, research on the variation of soil moisture during runoff generation in this region is also seldom discussed.
For these reasons, a series of rainfall simulation experiments at the plot scale with a gentle slope was carried out to clarify the dominant rainfall-runoff process and mechanism, to provide a reference for the studies of both slope and watershed scale rainfall-runoff processes and to supply a basis or support for the foundation and development of the hydrological model in the semi-arid regions of northern China. In addition, land cover was also considered by means of different ryegrass coverage, which is widely used in the lawn and artificial pasturage of northern China, due to its important role in controlling soil erosion and increasing soil moisture in arid and semiarid zones. The specific objectives of the present study mainly focus on the following: (1) characterizing the precipitation-runoff processes in the hill slope with a gentle slope angle (5°) and soil depth (50 cm) under three different soil cover conditions (i.e., grassland with 5 cm, 10-cm row spacing, bare soil); (2) describing the recession curve of interflow in silty loam soil in northern China; and (3) observing and analyzing the dynamics of soil moisture at different depths and positions during the rainfall-runoff processes and the soil moisture response to the rainfall event. The findings of this study will supply certain theoretical and field support for the catchment hydrological processes, especially in semi-arid regions.
2. Materials and Methods
2.1. Experimental Materials
The rainfall was conducted by artificial rainfall simulation devices with sprinkler heads at a height of 16 m in laboratory. A silty loam soil was collected from the upper 300 cm layer of a cultivated field in the Daxing Experimental Base of IWHR (China Institute of Water Resources and Hydropower Research), Beijing, China. The soil was air-dried (3.5% m
3/m
3 soil water content), and visible organic material was removed, then further filtered with a 10-mm screen mesh. The soil bin was prepared by packing a layer of fine sand (2.5 cm) at the bottom, and then the soil of a determined mass was packed uniformly into the soil bin to obtain a dry bulk density of about 1.5 g/cm
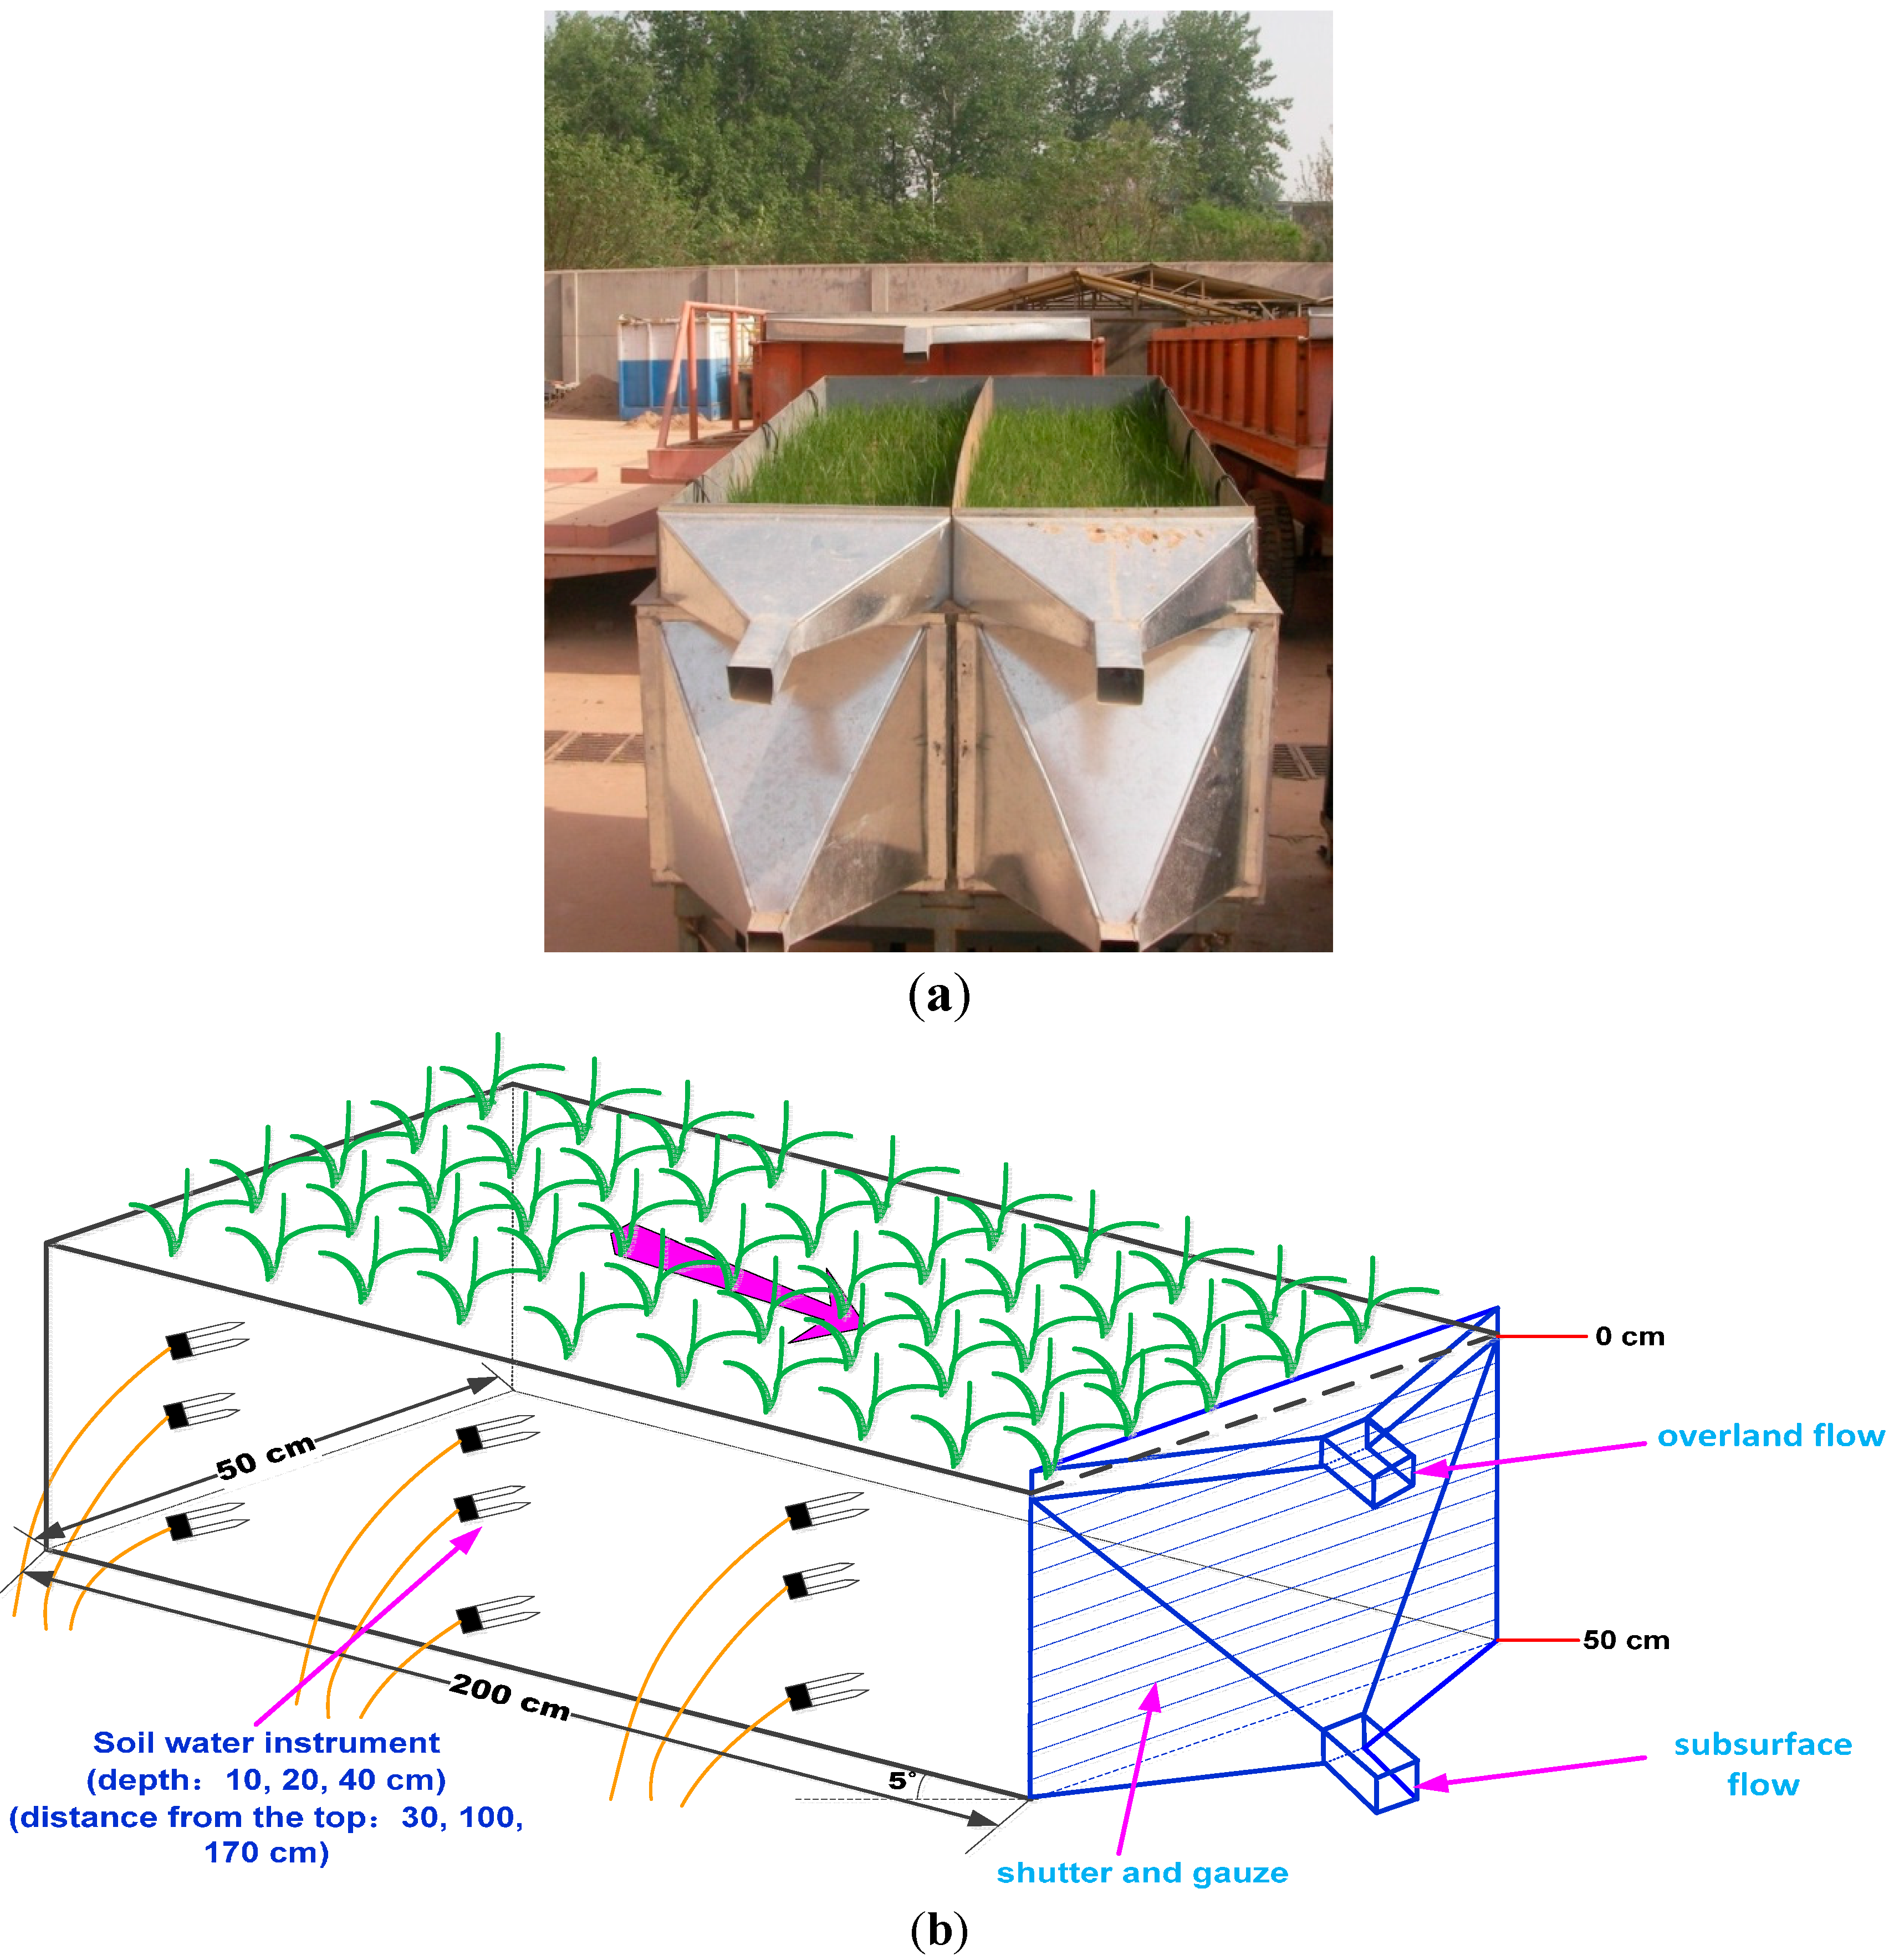
3, approximating the cultivated field bulk density in northern China, in 5 cm-deep layers, to a total depth of 50 cm for all of the experimental treatments. The packed soil bin was adjusted to the required slope (5°) (
Figure 1a), and water was uniformly sprinkled for grass seeding and survival.
The soil bins used in the experiment were self-designed steel grooves (200 cm × 50 cm × 50 cm) with a steel plate capsulation, and the slopes could be adjusted between 0° and 30°. A thin iron sheet with a height of 10 cm was equipped in the inner earth groove to avoid the water splashing into the groove. In order to observe subsurface flow, the longitudinal profile of the soil bin outlet was encapsulated with iron shutters, and gauze was installed on the internal side of the shutter to prevent soil leakage during the rainfall process. The upper soil slot (
i.e., soil surface) and the bottom of the trench (soil bottom) were all arranged with guide devices (
Figure 1b) to observe the surface flow and interflow.
Figure 1.
Experimental plots and instruments: (a) photograph of plots (ryegrass); and (b) the structure of the experimental plots and soil water measurement instruments.
Figure 1.
Experimental plots and instruments: (a) photograph of plots (ryegrass); and (b) the structure of the experimental plots and soil water measurement instruments.
To investigate the dynamics, as well as the variation process in soil moisture profiles along the slope, three groups of soil moisture sensors were buried along the slope direction, at distances of 30, 100 and 170 cm from the top of the soil groove, respectively, and the buried depths were 10, 20, and 40 cm (
Figure 1b). The type of soil moisture sensor was EC-5, with the measurement accuracy of soil volumetric water content reaching ±1%–2% (as given by the manufacturer). The moisture sensors were calibrated before installation [
21,
22,
23]. The soil moisture data acquisition was conducted with soil moisture sensors externally linked with an EM50 data collector, for which the acquisition time interval can be set to 1–1440 min.
2.2. Measurements and Methods
Limited by experimental conditions, only grassland, which is one of the main vegetation and land covers in the semi-arid area of northern China to prevent soil erosion, was considered during the first stage of this experiment, with bare land as a comparison. The variety of grassland was ryegrass, which is widely planted in the lawns and pastures of northern China. Meanwhile, due to the fact that 5-cm and 10-cm row spacings are generally used in artificial lawns, both were assigned to the grassland to analyze the runoff process under different soil coverage, in which the 10 cm spacing could also be considered as representative of relatively sparse vegetation. Two soil bins were used to plant ryegrass after soil packing, and the other was set as bare land to compare with grassland.
According to the rainfall statistical characteristics in the last three decades of the study area, the simulating rainstorm intensity and duration during each growth stage of the ryegrass are shown in
Table 1, and the rainfall durations were relatively longer to observe subsurface flow. The particle size and soil hydraulic characteristic parameters were also measured (
Table 2) when the soil structure became stable after many successive precipitations. Particle size analysis using the hydrometer method, and mineral soil was comprised of 28.5 sand (>0.05 mm), 59.7 silt (0.05–0.005 mm) and 11.8% clay (<0.005 mm).
The surface flow and subsurface flow during the precipitation were collected by manual measurement, at 10 and 20 min time intervals, respectively. To observe the dynamics of the soil moisture, the monitoring time intervals during the rainfall process were 1 min and 30 min after the rainfall had ended. Soil bins were placed outdoors to observe the soil moisture migration process under evapotranspiration conditions after precipitation.
The influence of groundwater was not considered in this experiment, since the bottom of the soil bins had been sealed up with steel, which could be recognized as impermeable bedrock, to observe interflow along the slope. Moreover, the aquifer system in China also has quickly become one of the most overexploited in the world, due to its higher irrigation requirements, and the shallow groundwater level has declined by almost 50 m from 1958 to 1998 [
24,
25]. Therefore, the interactions between groundwater and soil water or surface conditions in this experiment are negligible to some extent.
Table 1.
Rainfall intensity and duration of the experiment.
Table 1.
Rainfall intensity and duration of the experiment.
| Rainfall events | Initial growth stage | Mid-growth stage | Late growth stage |
|---|
| P1 | P2 | P2* | P3 | P4 | P5 | P6 | P7 | P7* | P8 | P9 | P10 | P10* | P11 |
|---|
| Average intensity (mm/min) | 0.42 | 0.75 | 0.42 | 0.42 | 0.42 | 0.50 | 0.50 | 0.75 | 0.42 | 0.58 | 0.49 | 0.70 | 0.58 | 0.43 |
| duration (min) | 183 | 180 | 120 | 360 | 360 | 360 | 360 | 180 | 180 | 360 | 180 | 180 | 180 | 180 |
Table 2.
Physical and chemical properties of tested soil.
Table 2.
Physical and chemical properties of tested soil.
| θs | θf, | θw | Ks | Total phosphorus | Total potassium | Total nitrogen | Organic matter | Soil particle size distribution (%) |
|---|
| m3/m3 | m3/m3 | m3/m3 | mm/min | g/kg | g/kg | g/kg | g/kg | <0.002 mm | 0.002–0.05 mm | >0.05mm |
| 0.392 | 0.256 | 0.134 | 0.013 | 0.61 | 19.60 | 0.48 | 1.18 | 11.80 | 59.7 | 28.5 |
3. Results
3.1. Runoff Formation
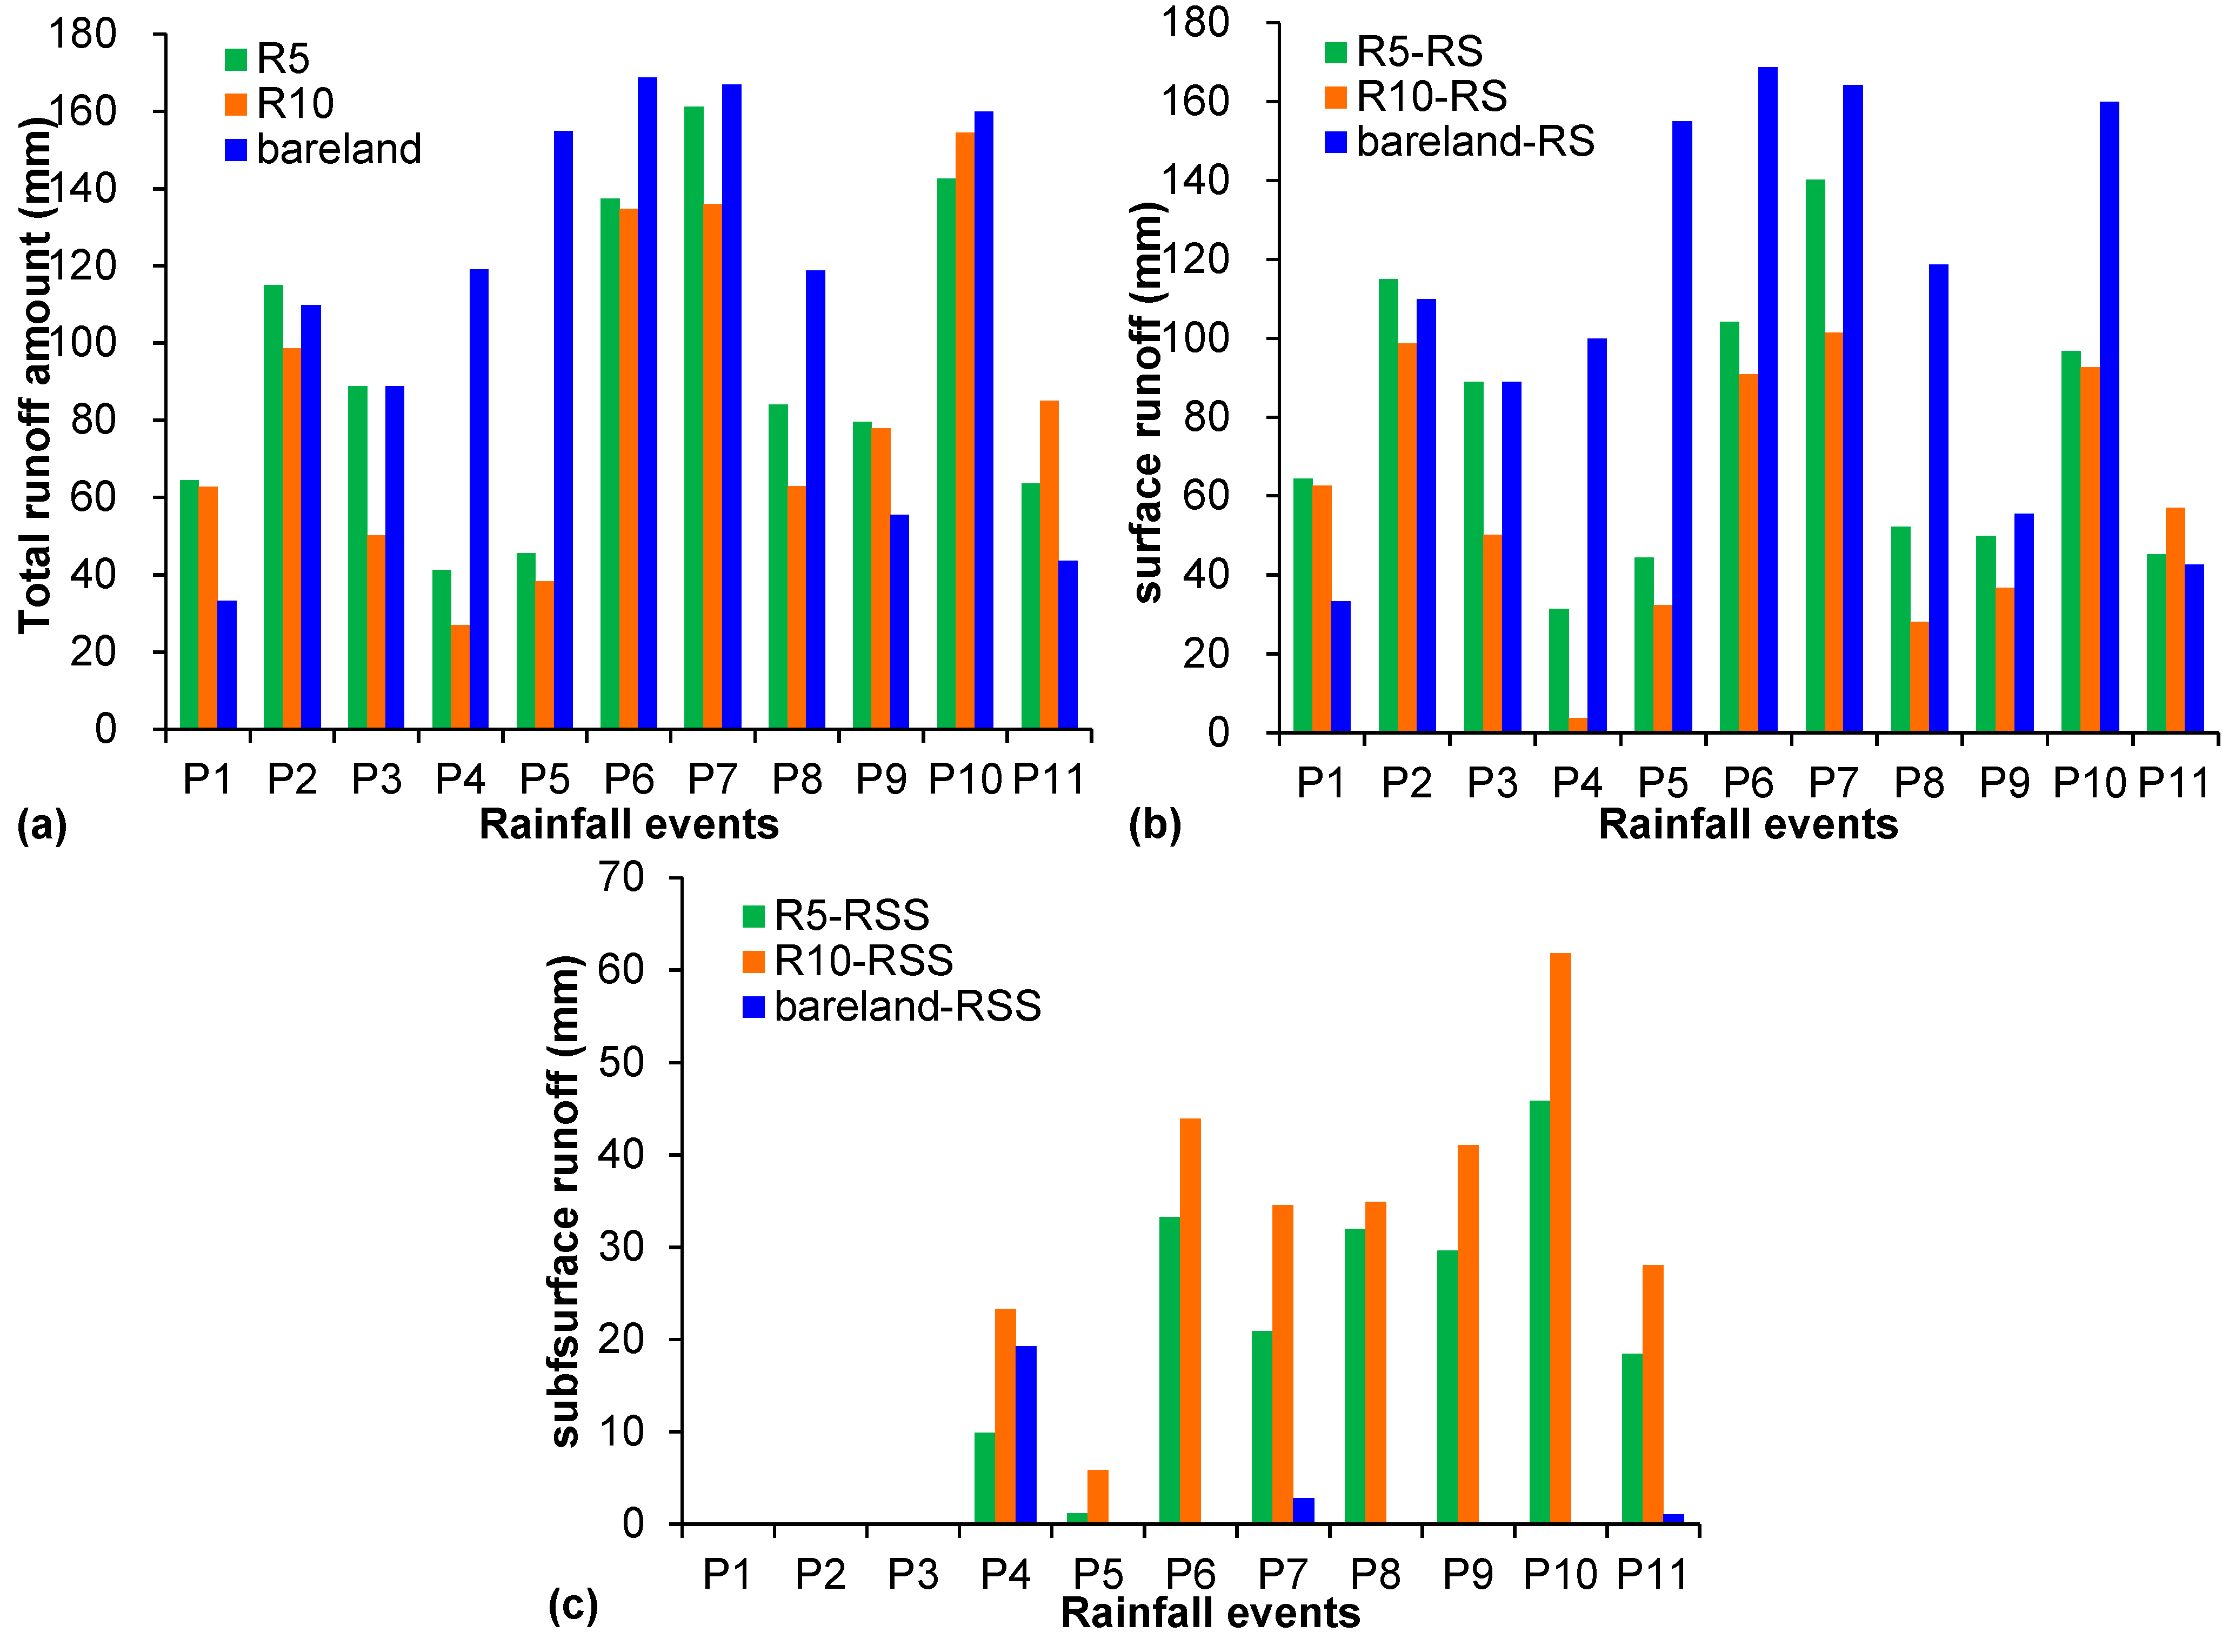
As shown in
Figure 2a, the total runoff yield of the 5-cm row spacing (hereinafter referred to as R5) was slightly higher than that of the 10-cm row spacing (hereinafter referred to as R10), but the exact opposite is true during the last two rainfall events, perhaps due to the significant increase in subsurface flow for the R10 treatment. For bare land, the total runoff depth was significantly higher than all grasslands, except the P1 and P2 rainfall events, because of the relatively looser backfill soil structure. Moreover, the surface runoff depth between the three treatments also showed a similar variation with a total runoff during the 11 rainfall events (
Figure 2b).
Interestingly, according to
Figure 2c, the interflow of grassland presented the opposite behavior to the surface runoff depth, namely the subsurface runoff depth of R10 treatment was clearly larger than that of R5. The results between the surface and subsurface flow for both grassland treatments simply showed that grassland spacing (or coverage) played an important role in the runoff generation, especially for the subsurface flow, and the soil water storage and infiltration rate were larger in the 10-cm spacing grassland than those of the 5-cm grassland. In addition, it may also be concluded that the decrease in grass coverage led to an increase in soil water and runoff generation. The same study conclusion was also reached in the alpine meadow of northwestern China [
26].
At the same time, only three interflow processes of bare land were observed when almost the entire soil profile was close to saturation, e.g., 19.3 mm in the P4 rainfall event with an average initial soil moisture of 0.42 m
3/m
3. The interflow was only 1.1 mm in the P11 rainfall event, perhaps due to the extent of soil surface crust and seal development at the bare land plot, which could increase the runoff coefficients and reduce the soil infiltration rate and cumulative infiltration water in the soil profile [
27,
28,
29]. In addition, the runoff coefficients and the ratio of surface runoff and interflow during each rainfall event are described in
Table 3.
Among the observed rainfall-runoff yield events, the ratio of surface runoff and interflow production was generally greater than 1.0. However, there were three events that had relatively lower ratios of surface flow to interflow (<1.0) for R10, namely the P4, P8 and P9 rainfall events, which perhaps were caused by the higher initial soil moisture under continuous rainfall and more infiltration water with vegetation cover. For the R5 plot, it was much higher (37.9) in the P5 event than the other rainfalls, which was mainly due to the fact that the observed interflow in the table generated in the first 45 minutes after rainfall had ceased, and the total interflow was smaller with a shorter duration (about 145 minutes). The average ratio of surface runoff to total runoff amount for the bare land, R5 and R10 plots were 93.2%, 75.0% and 57.4%, respectively. Consequently, the soil cover and vegetation coverage had a great impact on the runoff response, and the ryegrass with row spacing of 10 cm could increase more soil water storage for silty loam soil.
Apart from the land cover, the rainfall-runoff process is also affected by rainfall characteristics (e.g., total rainfall amount, duration, intensity) [
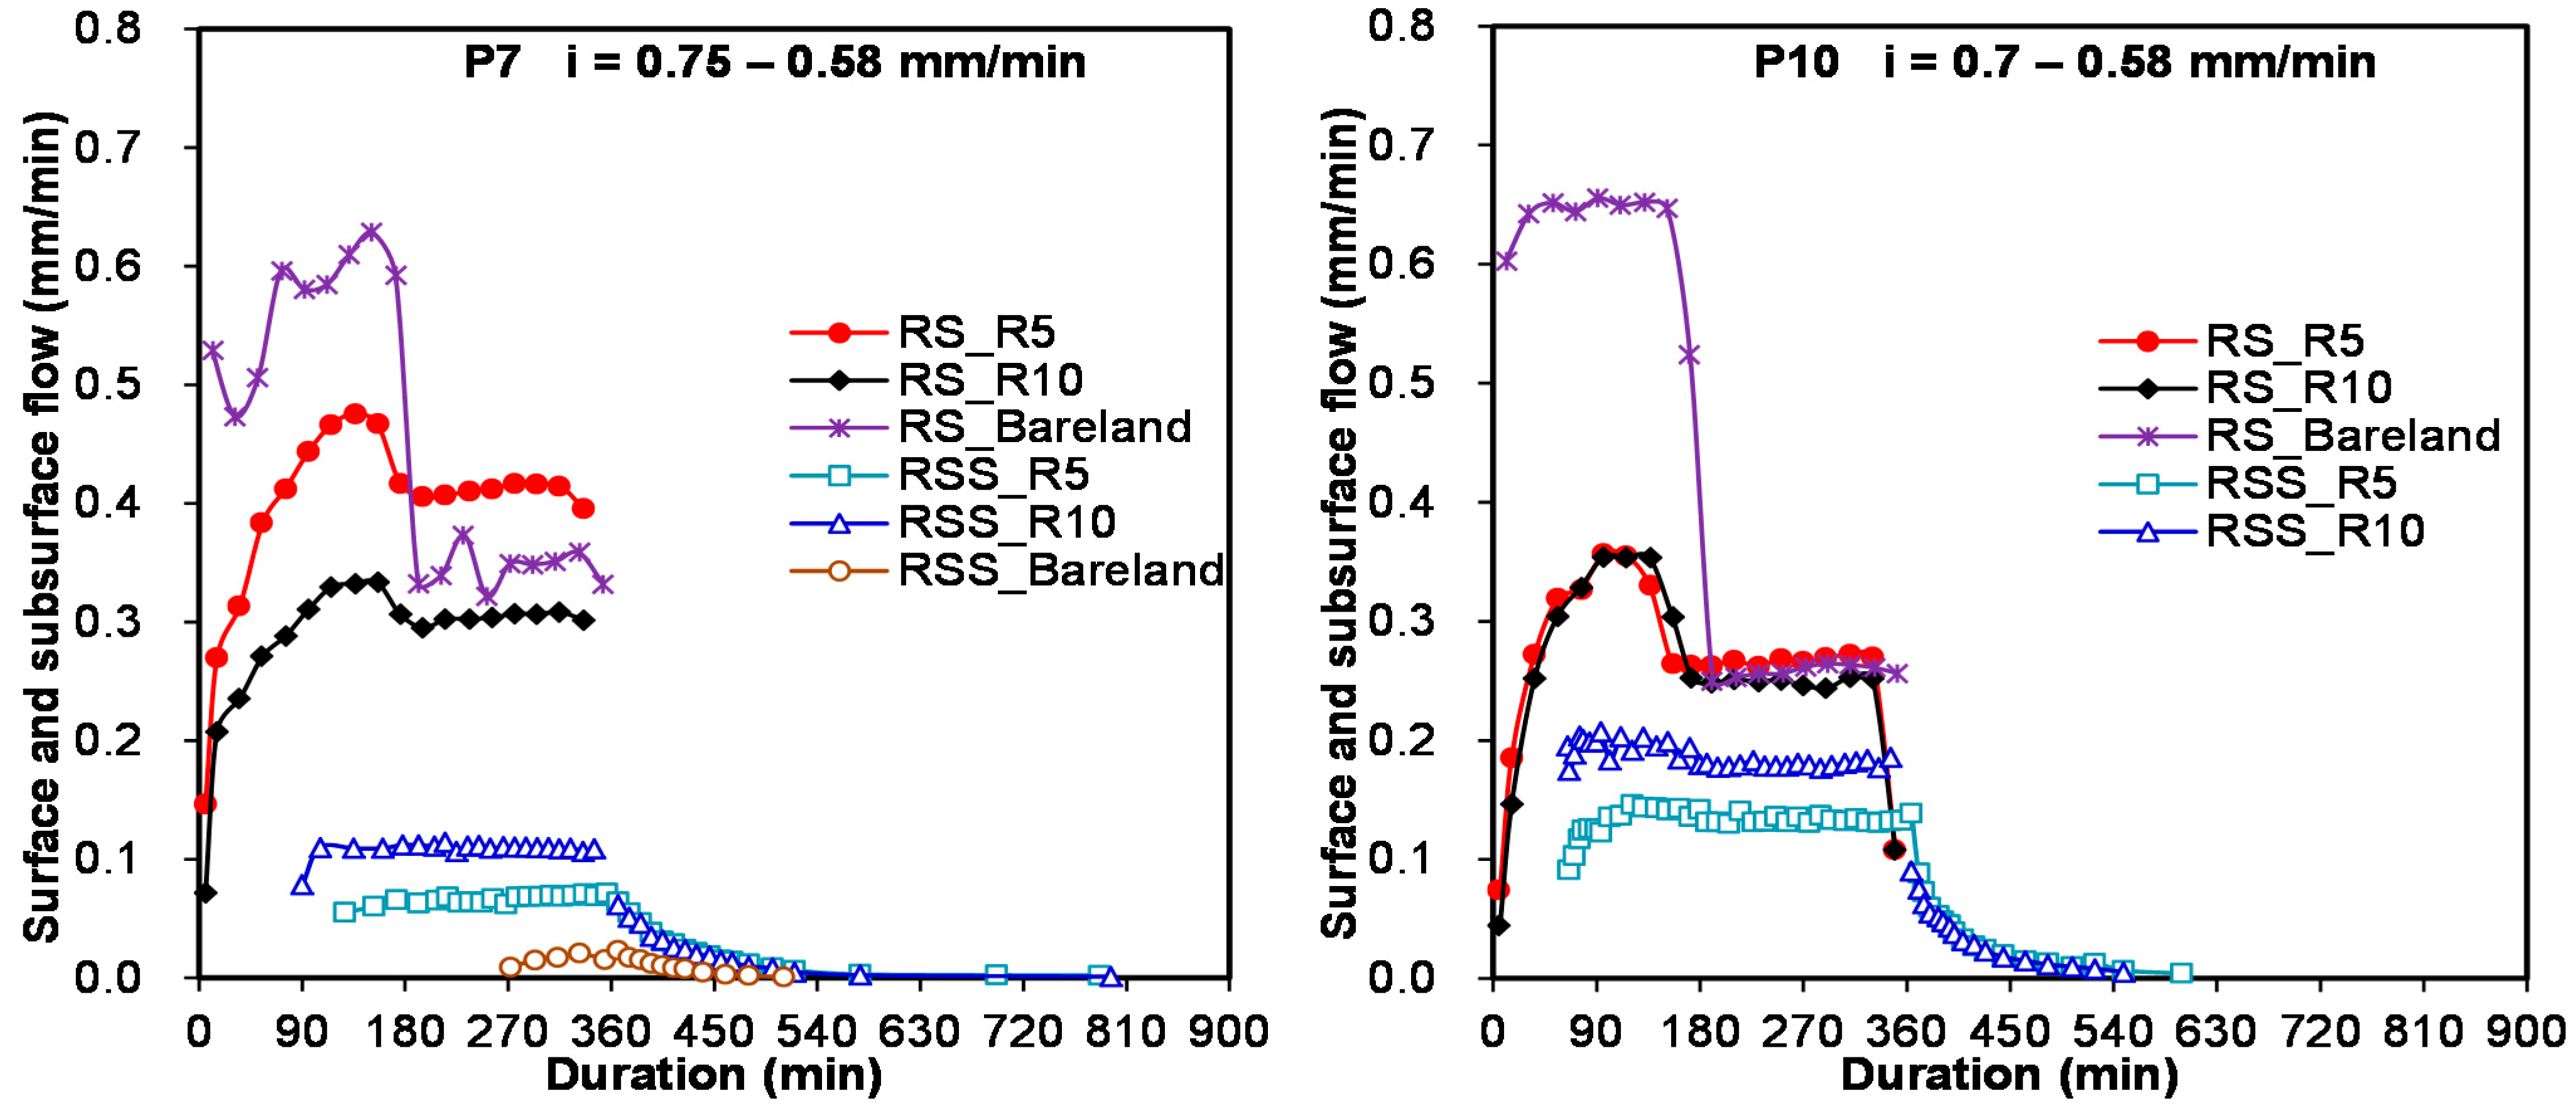
3]. The P7 and P10 rainfall-runoff with changing rainfall intensity were chosen as the typical storm runoff processes, as shown in
Figure 3. A clear decrease of surface flow occurred after the rainfall intensity was reduced, in which the R10 treatment was at its maximum decline from 0.57 to 0.15 mm. However, the interflow kept stable even when the rainfall intensity decreased abruptly, with a longer runoff recession duration (more than 120 min) than that of the surface runoff (3–5 min). The surface and subsurface runoff processes for both grassland plots were basically the same, especially in the P10 event. This signifies that the row spacing of grassland only has an effect on runoff amount, but not on the runoff process, and its influence also could be gradually abated with the increase of coverage for R5 and R10.
Figure 2.
Runoff amount of the three plots in 11 rainfall events: (a) total runoff, (b) surface runoff (referred to as RS) and (c) subsurface runoff (referred to as RSS).
Figure 2.
Runoff amount of the three plots in 11 rainfall events: (a) total runoff, (b) surface runoff (referred to as RS) and (c) subsurface runoff (referred to as RSS).
Table 3.
Rainfall runoff and infiltration rate statistics in different underlying surfaces and treatments.
Table 3.
Rainfall runoff and infiltration rate statistics in different underlying surfaces and treatments.
| Plot | Rainfallevents | Initial water content (%) | Surface runoff (mm) | Interflow (mm) | Average infiltration rate (mm/min) | Runoff coefficient | Ratio of surface runoff and interflow |
|---|
| Surface runoff | Interflow |
|---|
| R5 | P1 | 26.00 | 64.40 | / | 0.07 | 0.84 | / | / |
| P2 | 18.90 | 86.39 | / | 0.27 | 0.64 | / | / |
| P2* | / | 28.65 | / | 0.18 | 0.57 | / | / |
| P3 | 27.40 | 88.90 | / | 0.17 | 0.59 | / | / |
| P4 | 32.56 | 31.44 | 9.88 | 0.33 | 0.21 | 0.065 | 3.2 |
| P5 | 18.50 | 44.41 | 1.17 | 0.37 | 0.25 | 0.007 | 37.9 |
| P6 | 35.90 | 104.17 | 33.30 | 0.21 | 0.58 | 0.185 | 3.1 |
| P7 | 30.10 | 67.59 | 20.91 | 0.38 | 0.49 | 0.153 | 6.7 |
| P7* | / | 72.72 | / | 0.17 | 0.70 | / | / |
| P8 | 20.35 | 52.12 | 32.02 | 0.43 | 0.25 | 0.153 | 1.6 |
| P9 | 23.27 | 49.91 | 29.64 | 0.21 | 0.57 | 0.336 | 1.7 |
| P10 | 25.58 | 48.17 | 45.86 | 0.43 | 0.38 | 0.364 | 2.1 |
| P10* | / | 48.61 | / | 0.31 | 0.47 | / | / |
| P11 | 35.43 | 45.25 | 18.4 | 0.18 | 0.58 | 0.238 | 2.5 |
| R10 | P1 | 28.34 | 62.70 | / | 0.08 | 0.82 | / | / |
| P2 | 20.30 | 82.54 | / | 0.29 | 0.61 | / | / |
| P2* | / | 16.12 | / | 0.28 | 0.32 | / | / |
| P3 | 32.56 | 50.21 | / | 0.28 | 0.33 | / | / |
| P4 | 37.14 | 3.73 | 23.33 | 0.41 | 0.02 | 0.154 | 0.2 |
| P5 | 21.10 | 32.41 | 5.83 | 0.41 | 0.18 | 0.032 | 5.6 |
| P6 | 38.60 | 90.80 | 43.93 | 0.25 | 0.50 | 0.244 | 2.1 |
| P7 | 34.90 | 47.62 | 34.56 | 0.49 | 0.35 | 0.253 | 2.9 |
| P7* | / | 53.79 | / | 0.28 | 0.52 | / | / |
| P8 | 38.20 | 28.09 | 34.93 | 0.50 | 0.13 | 0.167 | 0.8 |
| P9 | 31.69 | 36.83 | 41.05 | 0.28 | 0.42 | 0.465 | 0.9 |
| P10 | 29.95 | 47.09 | 61.83 | 0.44 | 0.37 | 0.491 | 1.5 |
| P10* | / | 45.54 | / | 0.32 | 0.44 | / | / |
| P11 | 33.85 | 56.91 | 28.1 | 0.11 | 0.74 | 0.362 | 2.0 |
| Bare lands | P1 | 16.95 | 33.23 | / | 0.24 | 0.43 | / | / |
| P2 | 17.70 | 76.46 | / | 0.32 | 0.57 | / | / |
| P2* | / | 33.38 | / | 0.14 | 0.66 | / | / |
| P3 | 28.05 | 88.87 | / | 0.17 | 0.59 | / | / |
| P4 | 34.25 | 99.84 | 19.31 | 0.14 | 0.66 | 0.128 | 5.2 |
| P5 | 23.70 | 154.95 | / | 0.07 | 0.86 | / | / |
| P6 | 29.70 | 168.77 | / | 0.03 | 0.94 | / | / |
| P7 | 29.60 | 102.01 | 2.79 | 0.19 | 0.75 | 0.020 | 58.9 |
| P7* | / | 62.13 | / | 0.23 | 0.60 | / | / |
| P8 | 27.85 | 118.74 | / | 0.25 | 0.57 | / | / |
| P9 | 34.98 | 55.51 | / | 0.18 | 0.63 | / | / |
| P10 | 38.14 | 113.39 | / | 0.07 | 0.90 | / | / |
| P10* | / | 46.57 | / | 0.32 | 0.45 | / | / |
| P11 | 35.26 | 42.64 | 1.10 | 0.19 | 0.55 | 0.014 | 38.9 |
3.2. Recession Processes of Interflow
In our study, a diversion trench was designed in the bottom of the soil bin to observe the total interflow production at depths of 2 to 50 cm. As shown in
Figure 3, the interflow hydrograph, with a slower ascending limb and relatively remarkably stable period, was basically the same, despite the fact that the vegetation coverage and rainfall intensity were different. Except for the former three precipitations, there was a significant subsurface flow in the other eight rainfall events, with a significant interflow recession process (the right part of the dashed line in
Figure 3).
Figure 3.
Rainfall-runoff process during the P7 and P10 events with variable rainfall intensity. The vertical dashed line represents the time of the end of the rainfall event.
Figure 3.
Rainfall-runoff process during the P7 and P10 events with variable rainfall intensity. The vertical dashed line represents the time of the end of the rainfall event.
The withdrawing processes of interflow in all rainfall events are shown in
Figure 4, in which the interflow recession process was much slower than the surface runoff.
Figure 4a is the recession scatter under constant rainfall intensity, and the variable rainfall intensity is shown in
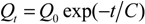
Figure 4b. The recession duration under variable rainfall intensity was slightly longer compared with the duration under constant rainfall intensity. In general, the duration of withdrawal was more than two hours and changed with different land use, which was mainly concerned with water storage in the soil aquifer. The interflow water withdrawal rate was faster at the first 90 min after the rainfall had ceased and later reached a very gentle stage. Despite the difference of interflow amount during each precipitation, the similar recession curve could be expressed as an exponential equation, given as Equation (1), the determination coefficient R2 of which ranged from 0.854 to 0.996.
where
![Water 06 02671 i002]()
is the flow of subsurface runoff at time
t (cm
3/min);
t is time (min) and
a and
b are the curve fitting parameters. The
a and
b values and coefficient of determination in the recession curve fitting equations with different rainfalls are shown in
Table 4.
Figure 4.
The recession process of interflow for the three plots under (a) constant rainfall intensity and (b) variable rainfall intensity.
Figure 4.
The recession process of interflow for the three plots under (a) constant rainfall intensity and (b) variable rainfall intensity.
Table 4.
a and b values and fitting degree comparisons in the curve fitting equation of interflow recession.
Table 4.
a and b values and fitting degree comparisons in the curve fitting equation of interflow recession.
| Plot | Parameter | P4 | P5 | P6 | P7 | P8 | P9 | P10 | P11 |
|---|
| R5 | a | 69.532 | 39.385 | 62.147 | 46.769 | 80.345 | 81.764 | 69.234 | 61.839 |
| b | 0.026 | 0.019 | 0.011 | 0.009 | 0.013 | 0.014 | 0.011 | 0.011 |
| R2 | 0.993 | 0.995 | 0.948 | 0.932 | 0.953 | 0.923 | 0.918 | 0.907 |
| R10 | a | 45.833 | 60.39 | 57.386 | 45.316 | 94.646 | 93.018 | 73.771 | 69.680 |
| b | 0.011 | 0.018 | 0.01 | 0.007 | 0.015 | 0.015 | 0.01 | 0.011 |
| R2 | 0.974 | 0.987 | 0.929 | 0.912 | 0.974 | 0.932 | 0.938 | 0.921 |
| Bare lands | a | 46.971 | / | / | 27.992 | / | / | / | 23.300 |
| b | 0.009 | / | / | 0.020 | / | / | / | 0.035 |
| R2 | 0.862 | / | / | 0.996 | / | / | / | 0.854 |
The recession curve is similar to that shown in the study of Barnes [
30], performed in the upper Mississippi Valley, given as Equation (2a) or in the alternative forms, Equation (2b) or Equation (2c). Tallaksen [
31] discussed various types of recession curve equations and pointed out that the foundations of the modeling recession equation were basically the same, even though these expressions were different. The recession constant
k values in our study were very high and clustered, mostly concentrated around 0.97–0.99, with about 0.99 as an almost equal average value. This
k value of interflow was slightly higher and the variations smaller than those in the rocky, mountainous area of northern China in Yang’s study [
32], with a relatively lower
k value 0.94 and larger variation, for which the very slow recession rate of alluvial soil on the North China Plain may be the main reason.
where
![Water 06 02671 i002]()
is same as before;
![Water 06 02671 i006]()
is the flow when
t = 0 and
C,
b,
k are recession constants. In the Equation (1), the fitting parameter
a as a replacement of
![Water 06 02671 i006]()
can also be expressed as a function of
![Water 06 02671 i006]()
, which is a linear relationship between
a and
![Water 06 02671 i006]()
.
a is related to
![Water 06 02671 i006]()
by the following expression:
3.3. Soil Water Dynamics in Rainfall-Runoff Process
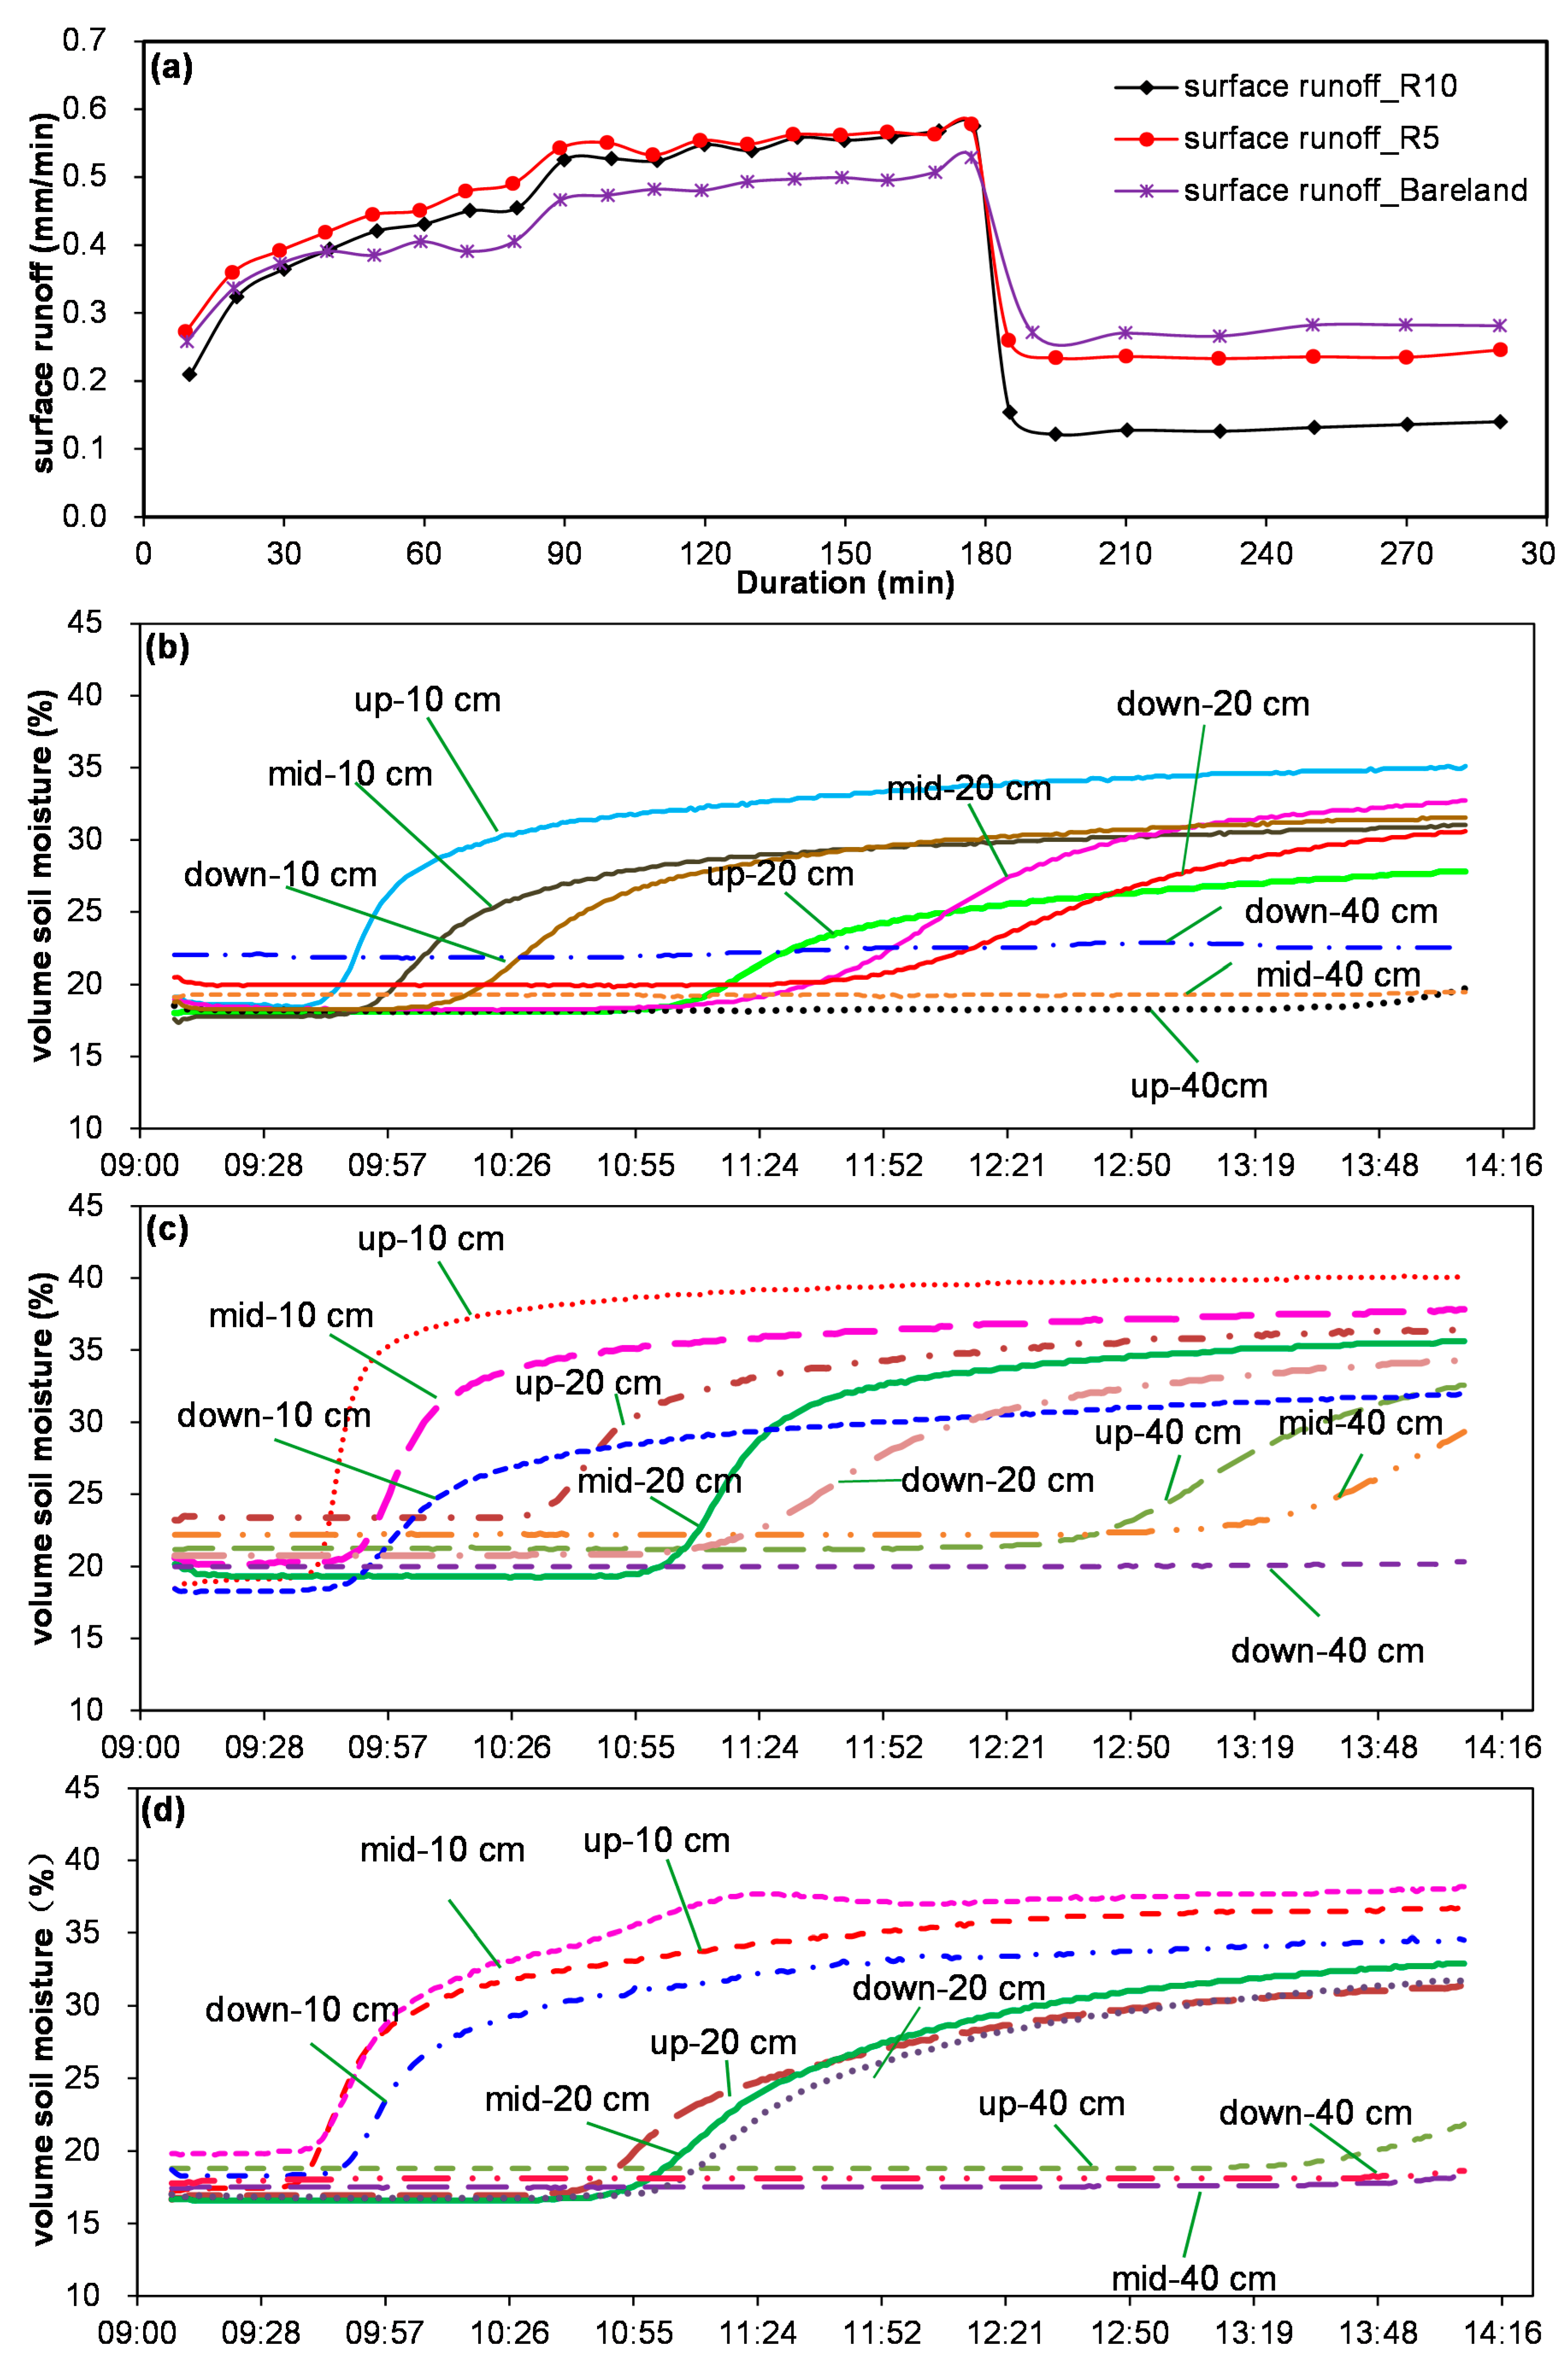
In this study, the soil water dynamics at different depths and slope positions during rainfall-runoff event were observed. The T variation of soil moisture at different soil layers and slope positions during the P2 rainfall event was selected as a case study to analyze the response of soil moisture to the rainfall (
Figure 5).
As shown in
Figure 5, the soil moisture at the 10-cm depth began to change at the 30–40th min after rainfall; the response time of bare land was earlier compared with the grassland, and the variation of soil moisture gradually decreased when this soil layer became saturated or close to saturated. At the 20-cm depth, the response soil moisture to rainfall was as follows: R10 (84–116 min) > bare land (104–110 min) > R5 (120–150 min). However, the soil moisture at the 40-cm depth varied little during the entire rainfall-runoff process, with a duration of 300 min, especially for the R5 plot. It began to increase gradually at the 210–240th min, only in the upper and middle slopes for the R10 treatment, and the 270th min at the top of slope for bare land. Results showed that soil moisture at the 0–20-cm soil layer was the main active layer, which was consistent with the study of Zhang
et al. [
33] for the in semi-arid regions of Inner Mongolia, where the rapid response soil layer was at 0–30 cm.
In addition, the soil moisture dynamics and patterns at different slope position also exhibit a great difference owing to the spatial variation of soil moisture. Generally, as described in
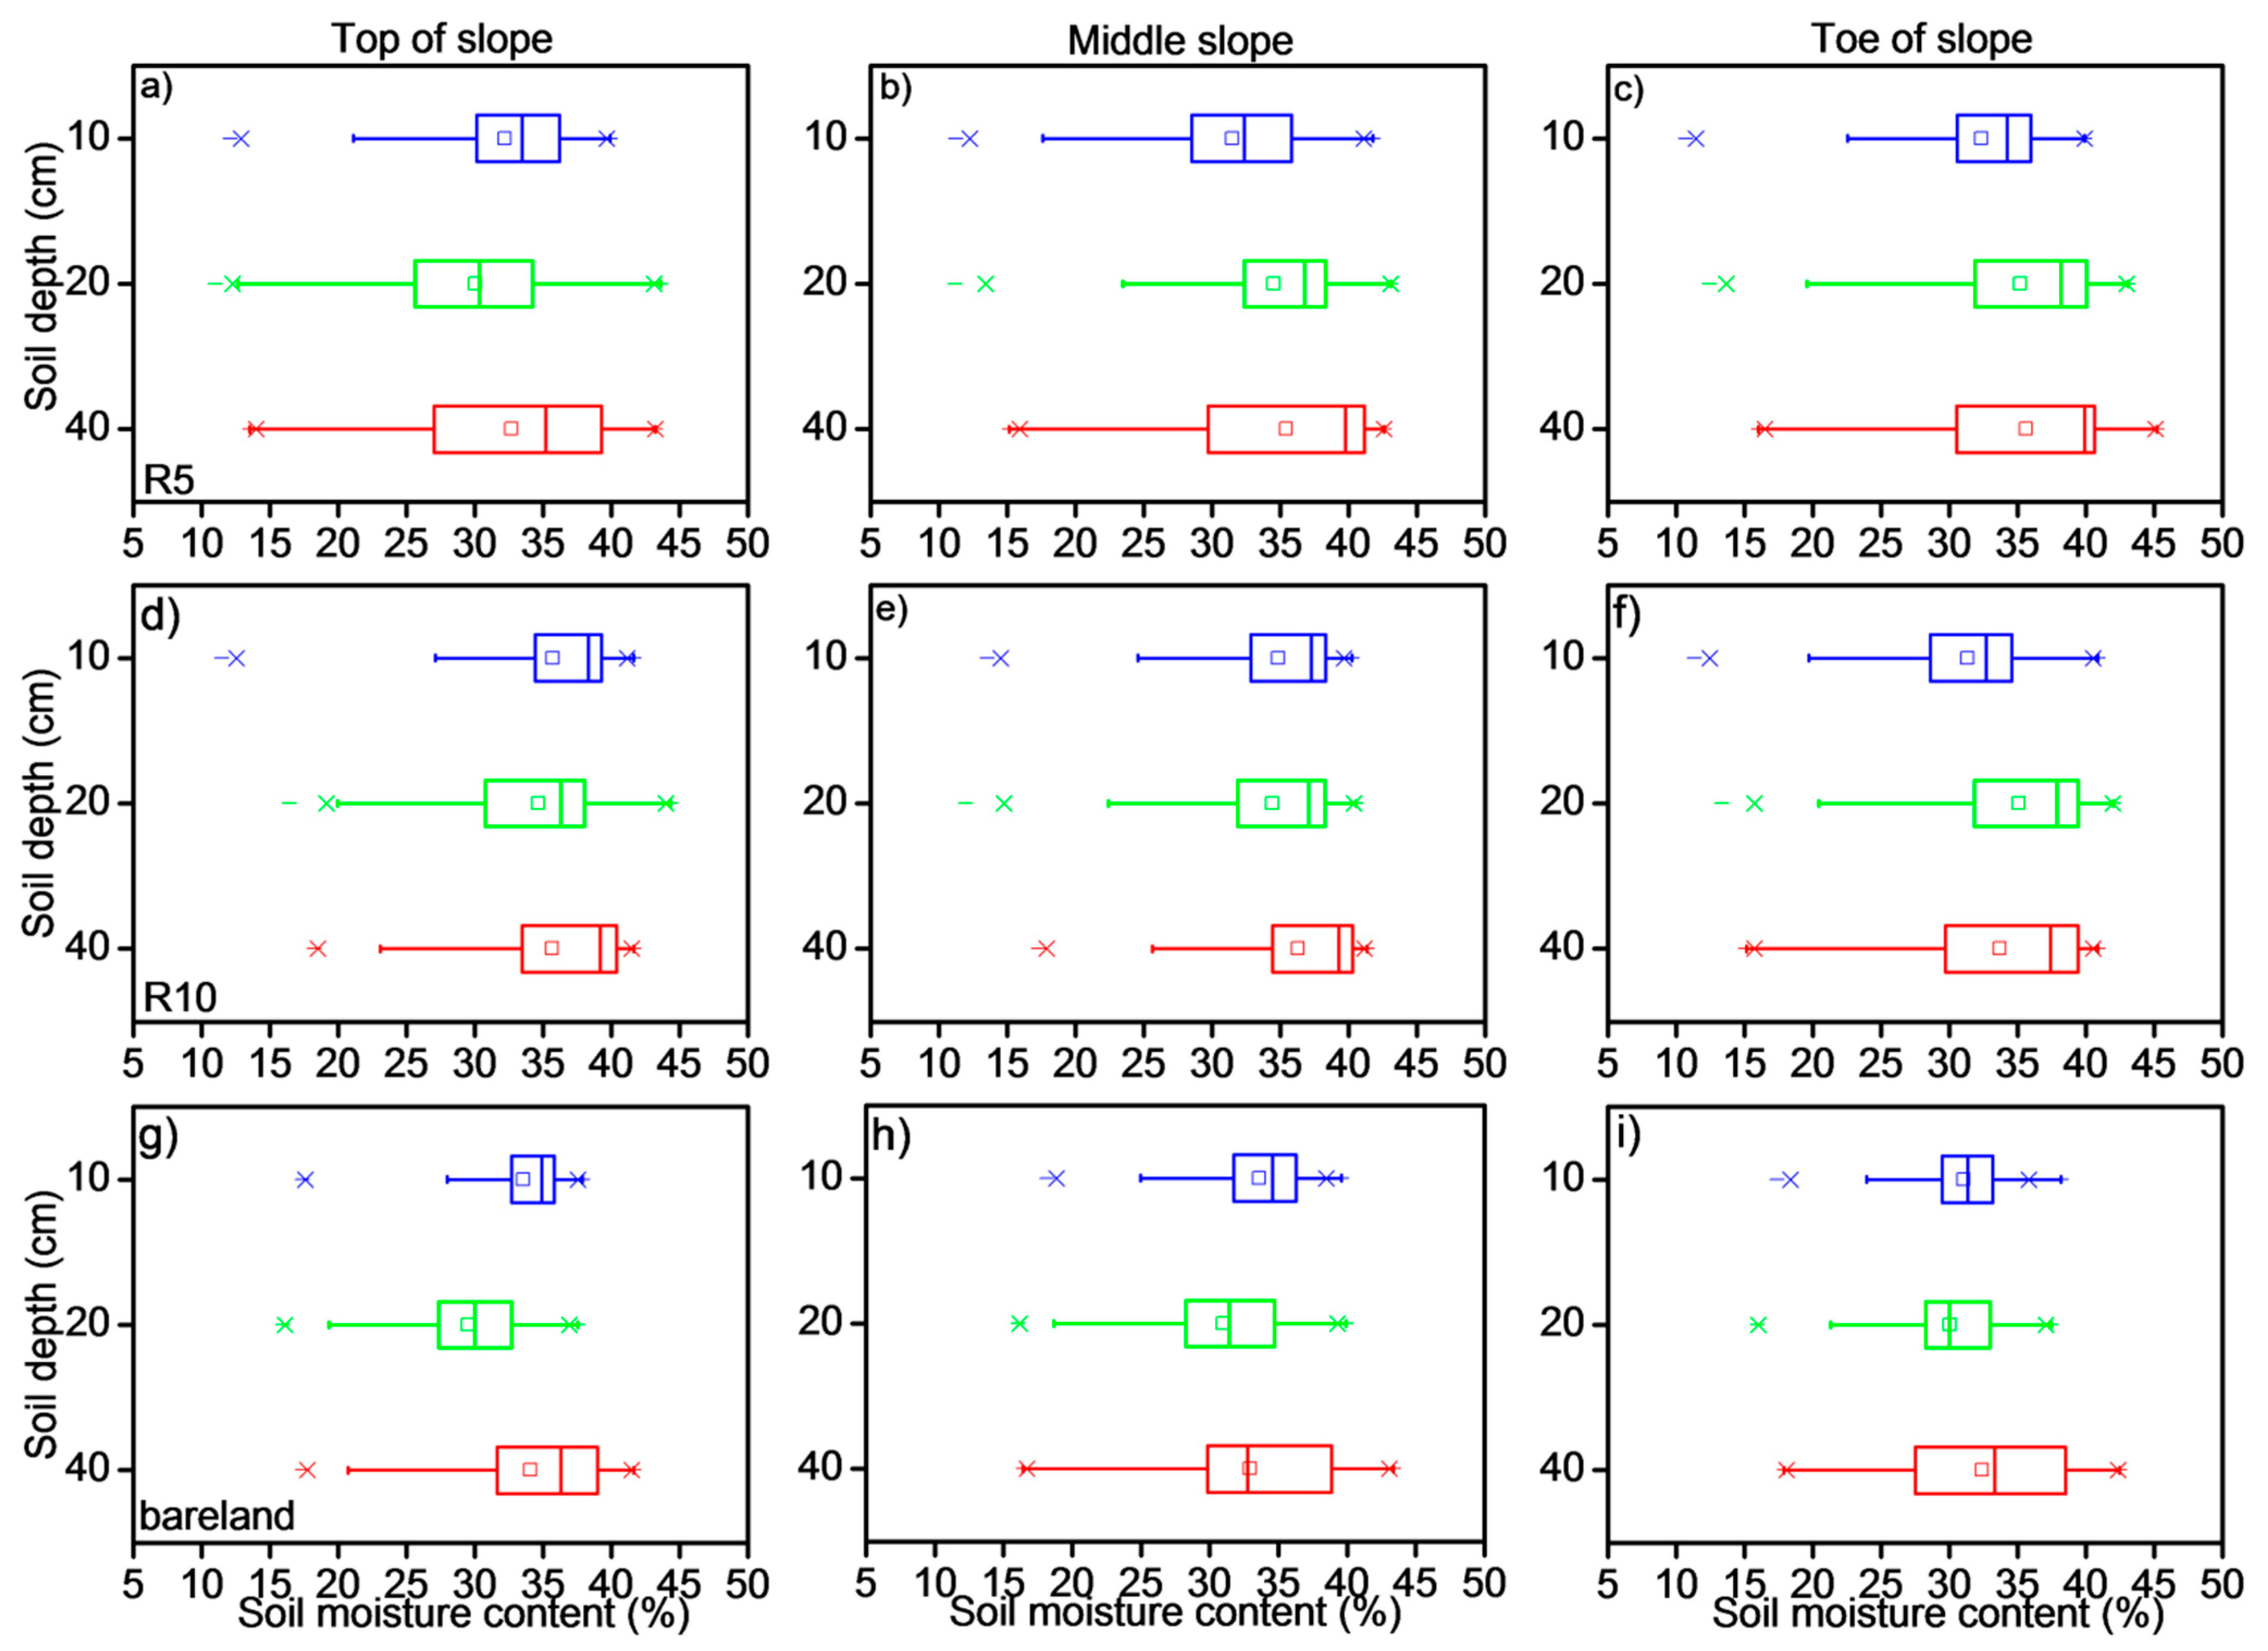
Figure 5, the soil moisture at the top position responded the fastest during the rainfall, followed by the middle slope and finally arriving at the foot of the slope. The soil moisture dynamics of grassland at different soil layers during the entire growth stage (April to August) were compared to that of bare land (
Figure 6). For both grassland treatments, the difference between R5 and R10 was very small. Overall, the soil moisture at the foot of the slope was higher than the other slope positions; and the soil moisture in plot R10 was slightly higher than that of plot R5, with smaller spatial variability from the top to foot of the slope. Moreover, the variation of soil moisture gradually increased with the increase of soil depth, and variation along the vertical depth for plot R5 was larger than R10. Compared to the grasslands, the soil moisture dynamics of the bare land were obviously smaller at both the vertical and horizontal levels along the slope, owing to the influence of grassland roots. This also illustrates the fact that vegetation has a significant influence on the spatial variability of soil moisture.
Figure 5.
Rainfall-runoff process (a) and soil moisture dynamics at different slope depths and positions for (b) R5 plot, (c) R10 plot and (d) bare land during the P2 rainfall event.
Figure 5.
Rainfall-runoff process (a) and soil moisture dynamics at different slope depths and positions for (b) R5 plot, (c) R10 plot and (d) bare land during the P2 rainfall event.
Figure 6.
Boxplot of soil moisture at each soil layer (10 cm, 20 cm and 40 cm) and different slope positions for both grassland and bare land treatments during the entire growth stage (April to August).
Figure 6.
Boxplot of soil moisture at each soil layer (10 cm, 20 cm and 40 cm) and different slope positions for both grassland and bare land treatments during the entire growth stage (April to August).
3.4. Average Infiltration Rate and Model Comparison
In order to describe rainfall allocation in the hydrological process, the average infiltration rates after runoff generation were calculated as follows:
i = (
P cos
α ‒
Rs)/
t, where
i is the average infiltration after the generation of surface flow (mm/min);
P is the total rainfall amount (mm);
α is the slope gradient (°);
Rs is the total surface runoff amount (mm); and
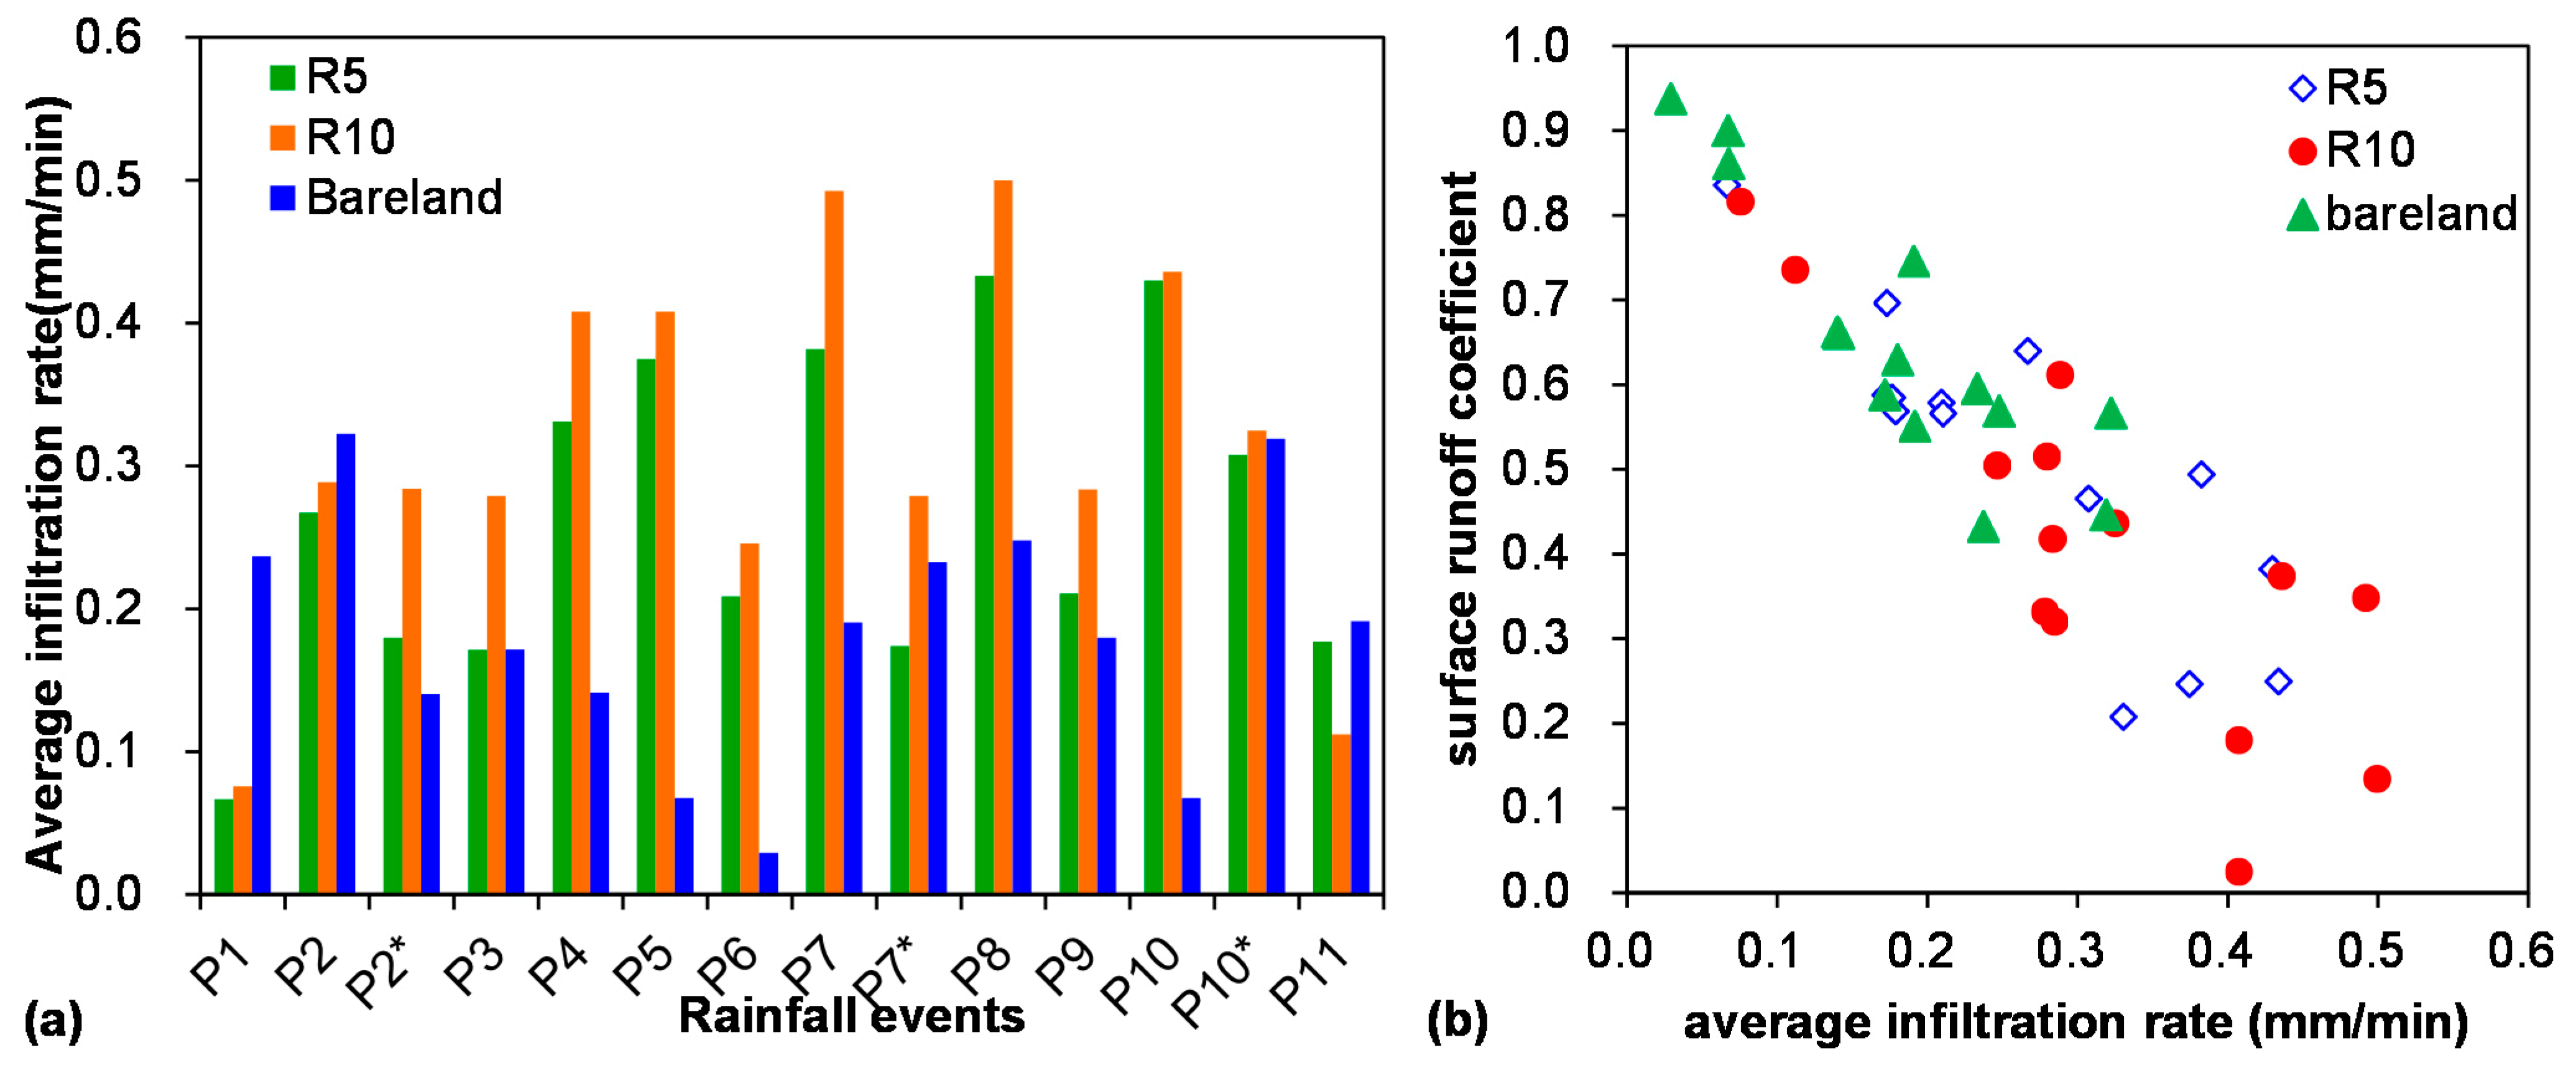
t is the rainfall duration (min). As described in
Figure 7a, the changing trends of the average infiltration rate for R5 and R10 were basically consistent, and that of R10 was generally higher than R5. This also explains the main cause for the difference in subsurface flow for both grassland plots and the runoff mechanism of interflow,
i.e., the infiltrated soil water gradually collected and formed a lateral flow along the impermeable base (the sealed bottom of the soil bins).
Moreover, the differences of the average infiltration rate for grassland among the 11 rainfall events were mainly caused by the coverage at different growth stages. For bare land, due to the soil seal and surface microbiotic crust formation under successive precipitation, the infiltration rate decreased significantly, and surface runoff increased [
27]. Overall, the surface runoff coefficient varied linearly with the average infiltration rate for all treatments (
Figure 7b) and decreased with the increasing infiltration.
Figure 7.
(a) Average infiltration rate in the 11 rainfall events and (b) the relationship between the surface runoff coefficient and the average infiltration rate.
Figure 7.
(a) Average infiltration rate in the 11 rainfall events and (b) the relationship between the surface runoff coefficient and the average infiltration rate.
According to runoff and rainfall intensity during the rainfall event, the infiltration rate was calculated by the water balance. Four rainfall events with a stable infiltration rate were used to model the infiltration process by means of three classical experimental models, namely the Kostiakov model, the Horton model and the Philip model (
Table 5). The results showed that these three empirical formulas were all simulated well in our experimental plot, but the Horton model had the best modelling result, with the determination coefficient ranging from 0.94 to 0.99, followed by the Kostiakov model, and the accuracy for the Philip model was the lowest. Liu
et al. came to the same conclusion using the runoff-on-out method [
34].
Table 5.
Statistics of regression analysis and infiltration parameters of three classical infiltration models for bare land and both grassland plots
Table 5.
Statistics of regression analysis and infiltration parameters of three classical infiltration models for bare land and both grassland plots
| Plots | Rainfall event | Kostiakov | R2 | Horton | R2 | Philip | R2 |
|---|
| i = atb | i = a + b exp(-kt) | i = at-0.5 + b |
|---|
| a | b | a | b | k | a | b |
|---|
| R5 | P1 | 0.064 | −1.090 | 0.940 | 0.012 | 0.192 | 1.215 | 0.962 | 0.127 | −0.059 | 0.953 |
| P2 | 0.306 | −2.214 | 0.990 | 0.019 | 2.023 | 1.959 | 0.988 | 0.460 | −0.223 | 0.833 |
| P5 | 0.523 | −2.361 | 0.939 | 0.026 | 3.963 | 2.072 | 0.956 | 0.679 | −0.311 | 0.715 |
| P7 | 0.081 | −0.975 | 0.940 | 0.020 | 0.366 | 1.659 | 0.964 | 0.173 | −0.078 | 0.929 |
| R10 | P1 | 0.083 | −1.856 | 0.966 | 0.015 | 0.789 | 2.429 | 0.969 | 0.160 | −0.086 | 0.877 |
| P2 | 0.246 | −1.828 | 0.899 | 0.007 | 1.637 | 1.770 | 0.937 | 0.597 | −0.312 | 0.812 |
| P5 | 0.688 | −6.150 | 0.988 | 0.019 | 315.128 | 6.153 | 0.998 | 0.695 | −0.341 | 0.477 |
| Bare land | P1 | 0.417 | −3.296 | 0.965 | 0.046 | 29.434 | 4.352 | 0.998 | 0.811 | −0.486 | 0.715 |
| P2 | 0.252 | −1.663 | 0.917 | 0.017 | 1.437 | 1.680 | 0.940 | 0.569 | −0.286 | 0.847 |
| P5 | 0.209 | −2.001 | 0.965 | 0.021 | 2.077 | 2.359 | 0.979 | 0.271 | −0.116 | 0.779 |
| P7 | 0.045 | −0.724 | 0.931 | 0.020 | 0.182 | 2.325 | 0.956 | 0.060 | −0.013 | 0.891 |
4. Discussion
The lag time of surface flow after the beginning of a rainfall event (
i.e., the time interval between the beginning of rainfall and outflow from every soil layer) is an important index to describe the runoff generation mechanism [
12]. The response time surface flow for both grasslands in our experiment were less than 10 min (
Table 6), except for the P5 event (nearly 20 min), which was carried out at the mid-growth stage when the vegetation coverage was above 0.90. Moreover, the lag times of surface flow between the R5 and R10 plots were almost exactly identical, but obviously reduced for bare land (less than 5 min), with the exception of the P1 event (19 min), due to the relatively looser soil structure compared with the grasslands.
Table 6.
Lag time of surface runoff and interflow for both grasslands and bare land plots.
Table 6.
Lag time of surface runoff and interflow for both grasslands and bare land plots.
| Rainfall event | Lag time of surface runoff (min) | Lag time of interflow (min) |
|---|
| R5 | R10 | Bare land | R5 | R10 | Bare land |
|---|
| P1 | 4.33 | 4.33 | 19.00 | / | / | / |
| P2 | 4.08 | 4.92 | 4.23 | / | / | / |
| P3 | 4.75 | 6.58 | 2.25 | / | / | / |
| P4 | 5.67 | 9.58 | 1.07 | 54.67 | 13.83 | 123 |
| P5 | 19.33 | 19.50 | 2 | 405 | 16.67 | / |
| P6 | 6.28 | 6.92 | 1.65 | 16.58 | 14 | / |
| P7 | 5.60 | 5.60 | 1.5 | 112.33 | 90.27 | 262.42 |
| P8 | 6.78 | 7.00 | 2.42 | 213.55 | 209 | / |
| P9 | 7.00 | 7.00 | 2.1 | 13.70 | 10.17 | / |
| P10 | 6.00 | 6.00 | 1.33 | 63.77 | 63.77 | / |
| P11 | 7.77 | 4.87 | 1.83 | 12.73 | 9.57 | 123.5 |
However, the lag times of interflow were far greater than those of the surface runoff, especially under drier antecedent soil moisture conditions, e.g., the lag time in the P8 event was more than 200 min for both grasslands plots. The reason for this is that the interflow in our study was usually observed under wetter conditions or saturated soil layers, which have been identified by the analysis on soil moisture dynamics during the rainfall-runoff process.
These observations suggest that the controlled runoff generation is caused by the infiltration excess overland flow in the study area, while being accompanied with saturation excess surface flow under long rainfall durations or higher initial soil water content. Furthermore, the interflow is generally a type of saturated lateral flow when the soil profile is close to saturation. Therefore, infiltration excess overland flow is the dominant runoff mechanism under drier conditions and saturation excess surface flow under wetter antecedent conditions when the soil moisture content is greater than the field capacity) or mixed runoff forms of first infiltration excess and finally saturation excess. This is consistent with other studies in the semi-arid regions of northern China, where many hydrological models based on the mixed runoff mechanism have been built up and validated with good results [
35,
36].
Although it is inappropriate to extrapolate the results of this study to a larger scale, this study is helpful to provide insight into the hydrological processes and soil moisture dynamics of grassland and to improve the understanding of the hydrological model in the arid and semi-arid areas of northern China. Moreover, the scale transition and hydrological connectivity between experimental plots or hillslope scales and catchment scales should be taken into consideration when these field results are used for hydrological modelling on a larger scale.
In addition, the groundwater and deep percolation were not considered in the present study, due to the seal bottom of the soil bins, which perhaps led to slightly higher runoff coefficients or surface runoff than the natural hillslope. However, the deep percolation and groundwater recharge from precipitation were also interrupted by the seal steel, which resulted in an overestimated interflow amount and soil moisture content at the bottom, but which would not affect the ultimate results and the conclusion of this study.
5. Conclusions
According to the investigation of rainfall-runoff process and the soil moisture dynamics of grasslands and bare land, the following conclusions are drawn:
(1) There were minor differences in the total runoff amount between plots R5 and R10, and R10 usually had a smaller surface runoff and higher interflow than R5, while the soil water storage and infiltration rate were relatively larger in the 10-cm spacing grassland than in the 5-cm grassland. In addition, the decrease in grass coverage led to an increase in soil water and runoff generation. The average runoff coefficients for the bare land and both grassland plots (R5 and R10) were 0.65, 0.51 and 0.41, respectively. The average infiltration rates for these three plots during the surface runoff formation were 0.18, 0.27 and 0.32, respectively.
(2) Interflow may occur under continuous rainfall, and the soil layer is gradually saturated. Its recession duration would be longer under high rainfall intensity. The recession curve of interflow can be expressed as a simple exponential function:
![Water 06 02671 i001]()
, for which the determination coefficient R
2 ranges from 0.854 to 0.996, in which the recession constant
a has a linear relationship with initial recession flow
![Water 06 02671 i006]()
, and the correlation coefficient is 0.84.
(3) Infiltration-excess overland flow was the dominant runoff mechanism for high rainfall intensity events regardless of the initial soil water content in the study area, and the saturation-excess overland flow would occur simultaneously under long durations of rainfall when the soil profile was close to saturation.
(4) The soil moisture in the surface 0–20-cm soil layer responded rapidly to rainfall, while the deep soil (below 40 cm) water storage response generally increased slightly after the rainfall-runoff process had ceased. Soil moisture at the top position responded the fastest during the rainfall, followed by the middle slope and, finally, arriving at the foot of the slope. Overall, for both grassland plots, the soil moisture at the foot of the slope was higher than the other slope positions; the soil moisture in plot R10 was slightly higher than that of R5, with smaller spatial variability from the top to the foot of the slope. Therefore, the 10-cm spacing for ryegrass is more suitable than the 5-cm spacing for the runoff and sediment decrease and increase of soil water storage and retention in the study region. The soil moisture dynamics of bare land were significantly smaller at both the vertical and horizontal levels along the slope, and vegetation cover has a significant influence on the spatial variability of soil moisture.
The research on the lateral flow and rainfall-runoff process, soil moisture dynamics at different depths and slope positions may help improve our understanding of the hydrological cycle and provide a research basis and evidence for the evolution of rainfall-runoff mechanisms in the semi-arid regions of northern China and other regions where experimental data are scarce or unavailable.
Acknowledgements
This study was supported by the Foundation of China Institute of Water Resources and Hydropower Research (1232), the International Science and Technology Cooperation Program of China (Grant No. 2013DFG70990), the National Natural Science Foundation of China (Grant No. 51209225), the Open Research Fund Program of State Key Laboratory of Water Resources and Hydropower Engineering Science (2012B093) and the Science and Technology Foundation for Selected Overseas Chinese Scholars, Ministry of Human Resources and Social Security of the People’s Republic of China.
Author Contributions
The four co-authors designed the experimental studies, specifically Nana Zhao and Chuanzhe Li carried out the experiments and the statistical analysis of the results, while Fuliang Yu and Hao Wang led the discussion and stated the final conclusions, and Jia Liu designed the framework of the study and oversaw the English edition of the manuscript. Wenbin Mu modified the discussion section, as well as made improvements to the English writing of the revised manuscript.
Conflicts of Interest
The authors declare no conflict of interest.
References
- Tarboton, D.G. Rainfall-Runoff Processes; Utah State University: Logan, UT, USA, 2003. [Google Scholar]
- Bergkamp, G. A hierarchical view of the interactions of runoff and infiltration with vegetation and microtopography in semiarid shrublands. Catena 1998, 33, 201–220. [Google Scholar]
- Martinez-Mena, M.; Albaladejo, J.; Castillo, V.M. Factors influencing surface runoff generation in a Mediterranean semi-arid environment: Chicamo watershed, SE Spain. Hydrol. Process. 1998, 12, 741–754. [Google Scholar] [CrossRef]
- Castillo, V.M.; Gomez-Plaza, A.; Martınez-Mena, M. The role of antecedent soil water content in the runoff response of semiarid catchments: A simulation approach. J. Hydrol. 2003, 284, 114–130. [Google Scholar] [CrossRef]
- Mugabe, F.T.; Hodnett, M.; Senzanje, A. Comparative hydrological behaviour of two small catchments in semi-arid Zimbabwe. J. Arid Environ. 2007, 69, 599–616. [Google Scholar]
- Mounirou, L.A.; Yacouba, H.; Karambiri, H.; Paturel, J.-E.; Mahé, G. Measuring runoff by plots at different scales: Understanding and analysing the sources of variation. Comptes Rendus Geosci. 2012, 344, 441–448. [Google Scholar] [CrossRef]
- Gurtz, J.; Zappa, M.; Jasper, K.; Lang, H.; Verbunt, M.; Badoux, A.; Vitvar, T. A comparative study in modelling runoff and its components in two mountainous catchments. Hydrol. Process. 2003, 17, 297–311. [Google Scholar]
- Tromp-van Meerveld, H.J.; McDonnell, J.J. On the interrelations between topography, soil depth, soil moisture, transpiration rates and species distribution at the hillslope scale. Adv. Water Resour. 2006, 29, 293–310. [Google Scholar]
- Blume, T.; Zehe, E.; Bronstert, A. Use of soil moisture dynamics and patterns at different spatio-temporal scales for the investigation of subsurface flow processes. Hydrol. Earth Syst. Sci. 2009, 13, 1215–1233. [Google Scholar] [CrossRef]
- Brocca, L.; Melone, F.; Moramarco, T.; Morbidelli, R. Spatial-temporal variability of soil moisture and its estimation across scales. Water Resour. Res. 2010, 46. [Google Scholar] [CrossRef]
- Han, E. Soil Moisture Data Assimilation at Multiple Scales and Estimation of Representative Field Scale Soil Moisture Characteristics. Ph.D. Thesis, Purdue University, West Lafayette, IN, USA, December 2011. [Google Scholar]
- Yu, J.; Yang, C.; Liu, C.; Song, X.; Hu, S.; Li, F.; Tang, C. Slope runoff study in situ using rainfall simulator in mountainous area of North China. J. Geogr. Sci. 2009, 19, 461–470. [Google Scholar]
- Han, J.G.; Li, Z.B.; Li, P.; Tian, J.L. Nitrogen and phosphorous concentrations in runoff from a purple soil in an agricultural watershed. Agric. Water Manag. 2010, 97, 757–762. [Google Scholar]
- Fu, C.; Chen, J.; Zeng, S. Observation and analysis of rainfall-runoff characteristics in a coastal granite catchment in Southern China. J. Hydrol. Eng. 2011, 17, 138–149. [Google Scholar]
- Xu, Q.; Wang, T.; Li, Z.; Cai, C.; Shi, Z. Characteristics of interflow in purple soil of hillslope. Adv. Water Sci. 2010, 2, 229–234. [Google Scholar]
- Han, S.; Yang, Y.; Fan, T.; Xiao, D.; Moiwo, J.P. Precipitation-runoff processes in Shimen hillslope micro-catchment of Taihang Mountain, north China. Hydrol. Process. 2012, 26, 1332–1341. [Google Scholar] [CrossRef]
- Jordan, A.; Martínez-Zavala, L. Soil loss and runoff rates on unpaved forest roads in southern Spain after simulated rainfall. For. Ecol. Manag. 2008, 255, 913–919. [Google Scholar]
- Kato, H.; Onda, Y.; Tanaka, Y.; Asano, M. Field measurement of infiltration rate using an oscillating nozzle rainfall simulator in the cold, semiarid grassland of Mongolia. Catena 2009, 76, 173–181. [Google Scholar]
- Yang, J.; Zhao, T.; Sun, B.; Sun, L. Kinematic wave theory and its application in slope runoff simulation. J. Beijing For. Univ. 1993, 15, 1–11. [Google Scholar]
- Zhang, G.; Jiang, D.; Shao, M. Runoff processes simulation on land based on unsaturated soil physical properties. J. Mt. Sci. 2001, 19, 461–470. [Google Scholar]
- Bogena, H.R.; Huisman, J.A.; Oberdörster, C.; Vereecken, H. Evaluation of a low-cost soil water content sensor for wireless network applications. J. Hydrol. 2007, 344, 32–42. [Google Scholar]
- Kizito, F.; Campbell, C.S.; Campbell, G.S.; Cobos, D.R.; Teare, B.L.; Carter, B.; Hopmans, J.W. Frequency, electrical conductivity and temperature analysis of a low-cost capacitance soil moisture sensor. J. Hydrol. 2008, 352, 367–378. [Google Scholar] [CrossRef]
- Saito, T.; Fujimaki, H.; Yasuda, H.; Inoue, M. Empirical temperature calibration of capacitance probes to measure soil water. Soil Sci. Soc. Am. J. 2009, 73, 1931–1937. [Google Scholar]
- China: Agenda for Water Sector Strategy for North China, vol. 1: Summary Report; Report No. 22040-CHA; World Bank: Washington, DC, USA, 2 April 2001; pp. 1–141.
- Kendy, E.; Zhang, Y.; Liu, C.; Wang, J.; Steenhuis, T. Groundwater recharge from irrigated cropland in the North China Plain: Case study of Luancheng County, Hebei Province, 1949–2000. Hydrol. Process. 2004, 18, 2289–2302. [Google Scholar] [CrossRef]
- Wang, G.; Liu, G.; Li, C. Effects of changes in alpine grassland vegetation cover on hillslope hydrological processes in a permafrost watershed. J. Hydrol. 2012, 444–445, 22–33. [Google Scholar] [CrossRef]
- Bissonnais, Y.L.; Singer, M.J. Seal formation, runoff, and interrill erosion from seventeen California soils. Soil Sci. Soc. Am. J. 1993, 57, 224–229. [Google Scholar] [CrossRef]
- Assouline, S.; Mualem, Y. Soil seal formation and its effect on infiltration: Uniform versus nonuniform seal approximation. Water Resour. Res. 2001, 37, 297–305. [Google Scholar]
- Neave, M.; Rayburg, S. A field investigation into the effects of progressive rainfall-induced soil seal and crust development on runoff and erosion rates: The impact of surface cover. Geomorphology 2007, 87, 378–390. [Google Scholar] [CrossRef]
- Barnes, B.S. The structure of discharge-recession curves. Trans. Am. Geophys. Union 1939, 20, 721–725. [Google Scholar]
- Tallaksen, L.M. A review of baseflow recession analysis. J. Hydrol. 1995, 165, 349–370. [Google Scholar] [CrossRef]
- Yang, C.; Yu, J.; Liu, C.; Song, X.; Hu, K.; Li, F.; Tang, C. Experimental study on slope runoff generation process in north China mountainous area. Acta Geogr. Sin. 2005, 60, 1021–1028. [Google Scholar]
- Zhang, Y.; Liu, J.; Xu, X.; Tian, Y.; Li, Y.; Gao, Q. The response of soil moisture content to rainfall events in semi-arid area of Inner Mongolia. Procedia Environ. Sci. 2010, 2, 1970–1978. [Google Scholar] [CrossRef]
- Liu, H.; Lei, T.W.; Zhao, J.; Yuan, C.P.; Fan, Y.T.; Qu, L.Q. Effects of rainfall intensity and antecedent soil water content on soil infiltrability under rainfall conditions using the run off-on-out method. J. Hydrol. 2011, 396, 24–32. [Google Scholar] [CrossRef]
- Yuan, F.; Xie, Z.; Liu, Q.; Xia, J. Simulating hydrologic changes with climate change scenarios in the Haihe River Basin. Pedosphere 2005, 15, 595–600. [Google Scholar]
- Hu, H.; Bao, W.; Huang, G. Application of the Vertical-mixed Runoff Model and real-time flood correction method in a semi-arid basin. IAHS-AISH Publ. 2011, 350, 720–725. [Google Scholar]
© 2014 by the authors; licensee MDPI, Basel, Switzerland. This article is an open access article distributed under the terms and conditions of the Creative Commons Attribution license (http://creativecommons.org/licenses/by/3.0/).


 is the flow of subsurface runoff at time t (cm3/min); t is time (min) and a and b are the curve fitting parameters. The a and b values and coefficient of determination in the recession curve fitting equations with different rainfalls are shown in Table 4.
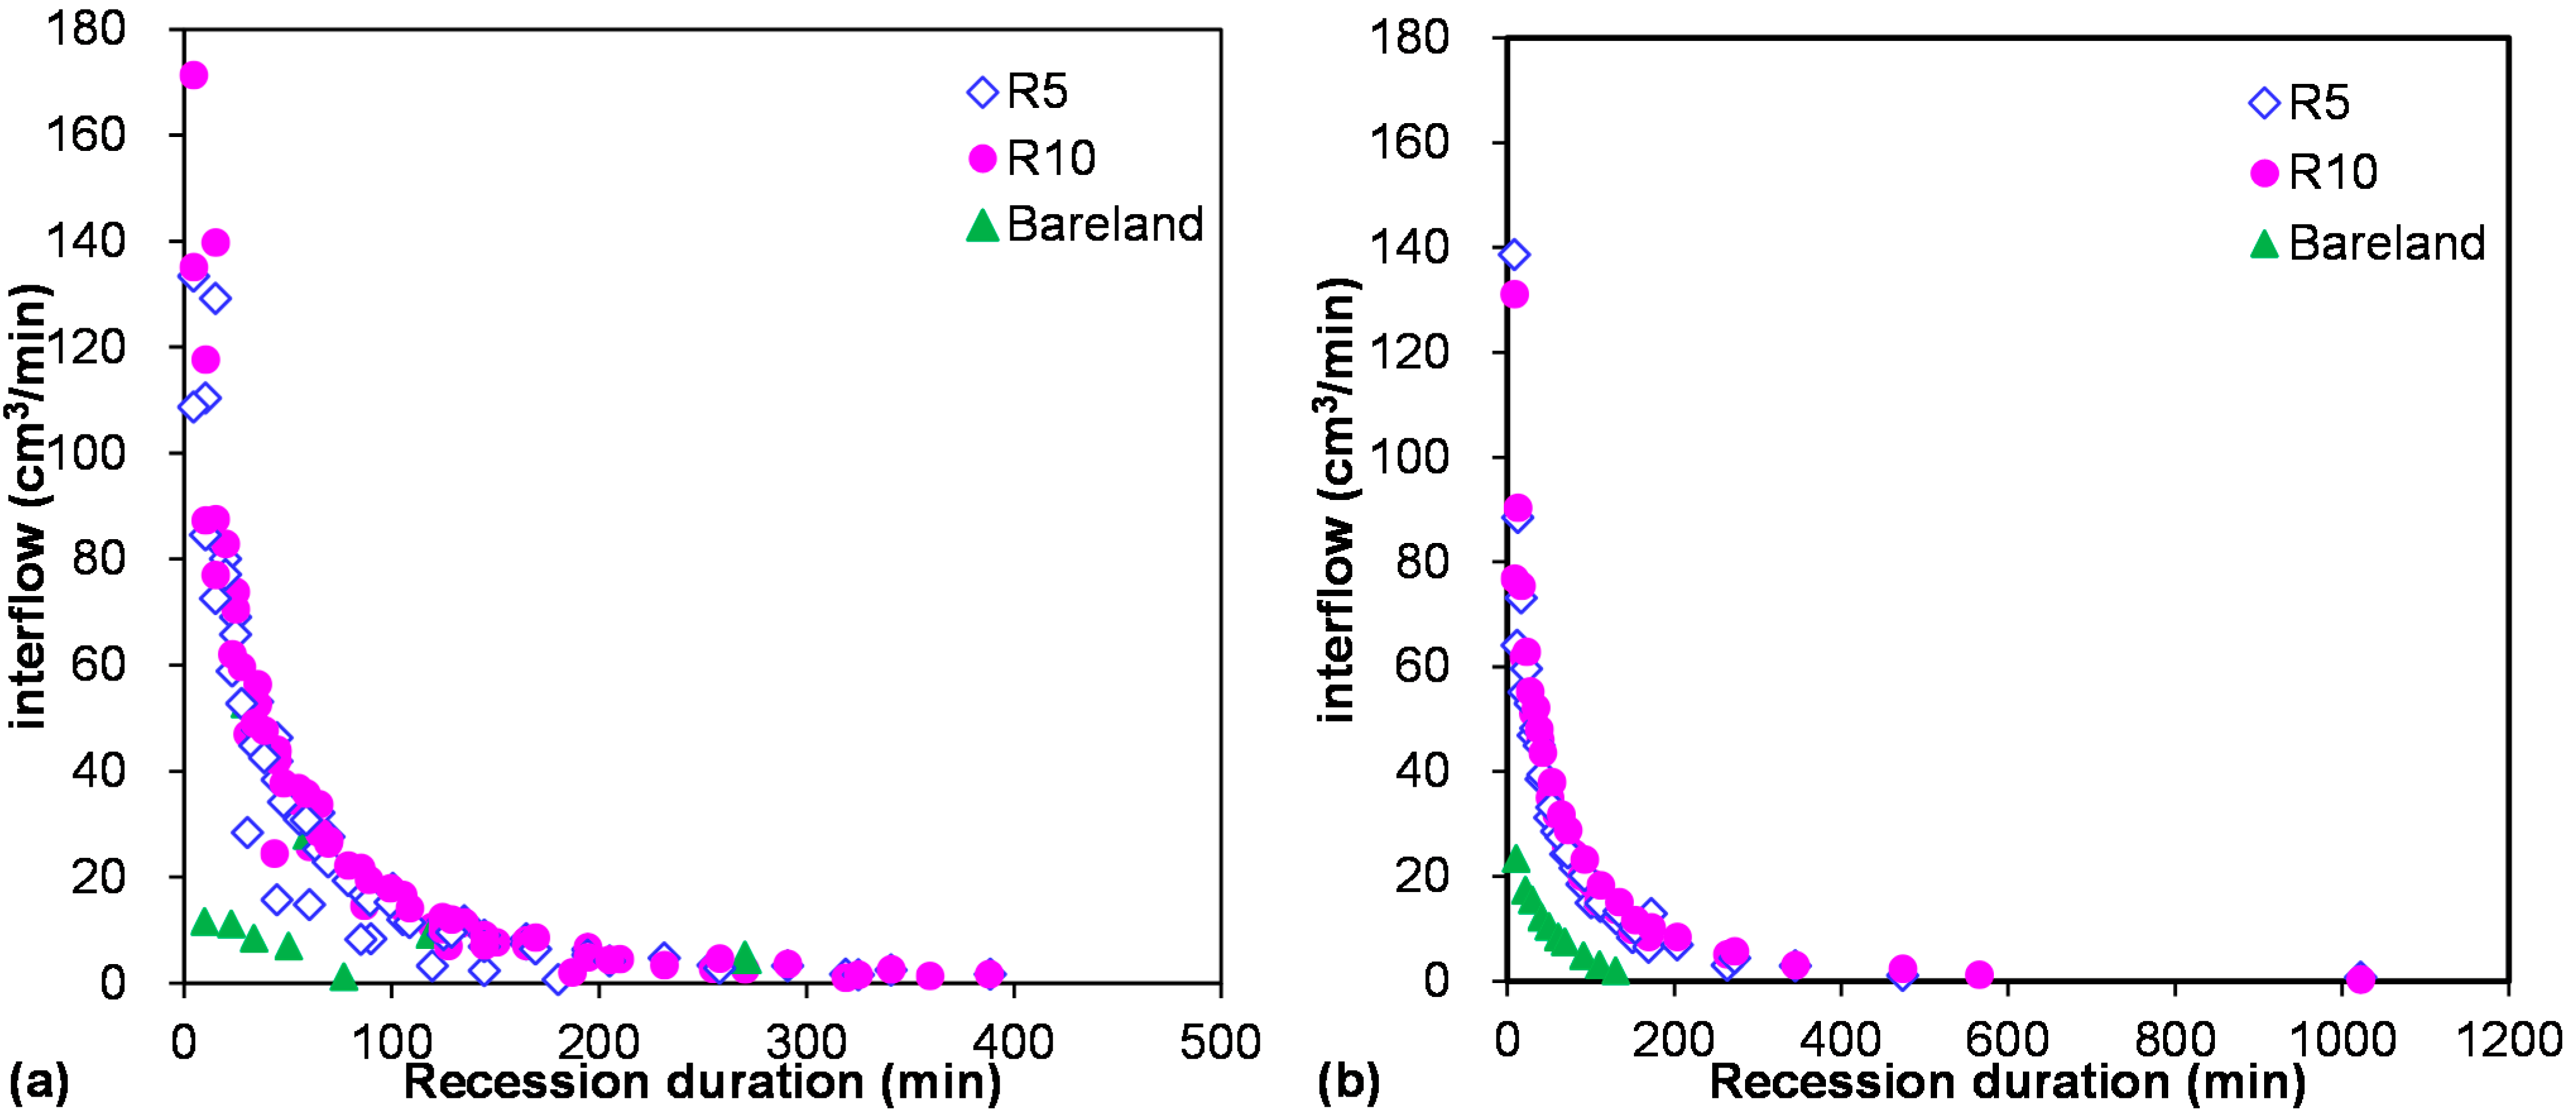


 is the flow when t = 0 and C, b, k are recession constants. In the Equation (1), the fitting parameter a as a replacement of