4.1. Reliability and Water Savings
Initially, the reliability and water savings considering the daily rainfall data of all the years on record were determined for the roof top, lawn and impervious areas of 200 m
2, 150 m
2 and 100 m
2, respectively. The reliability of rainwater tanks of different sizes and water use for these cases are shown in
Figure 3,
Figure 4 and
Figure 5.
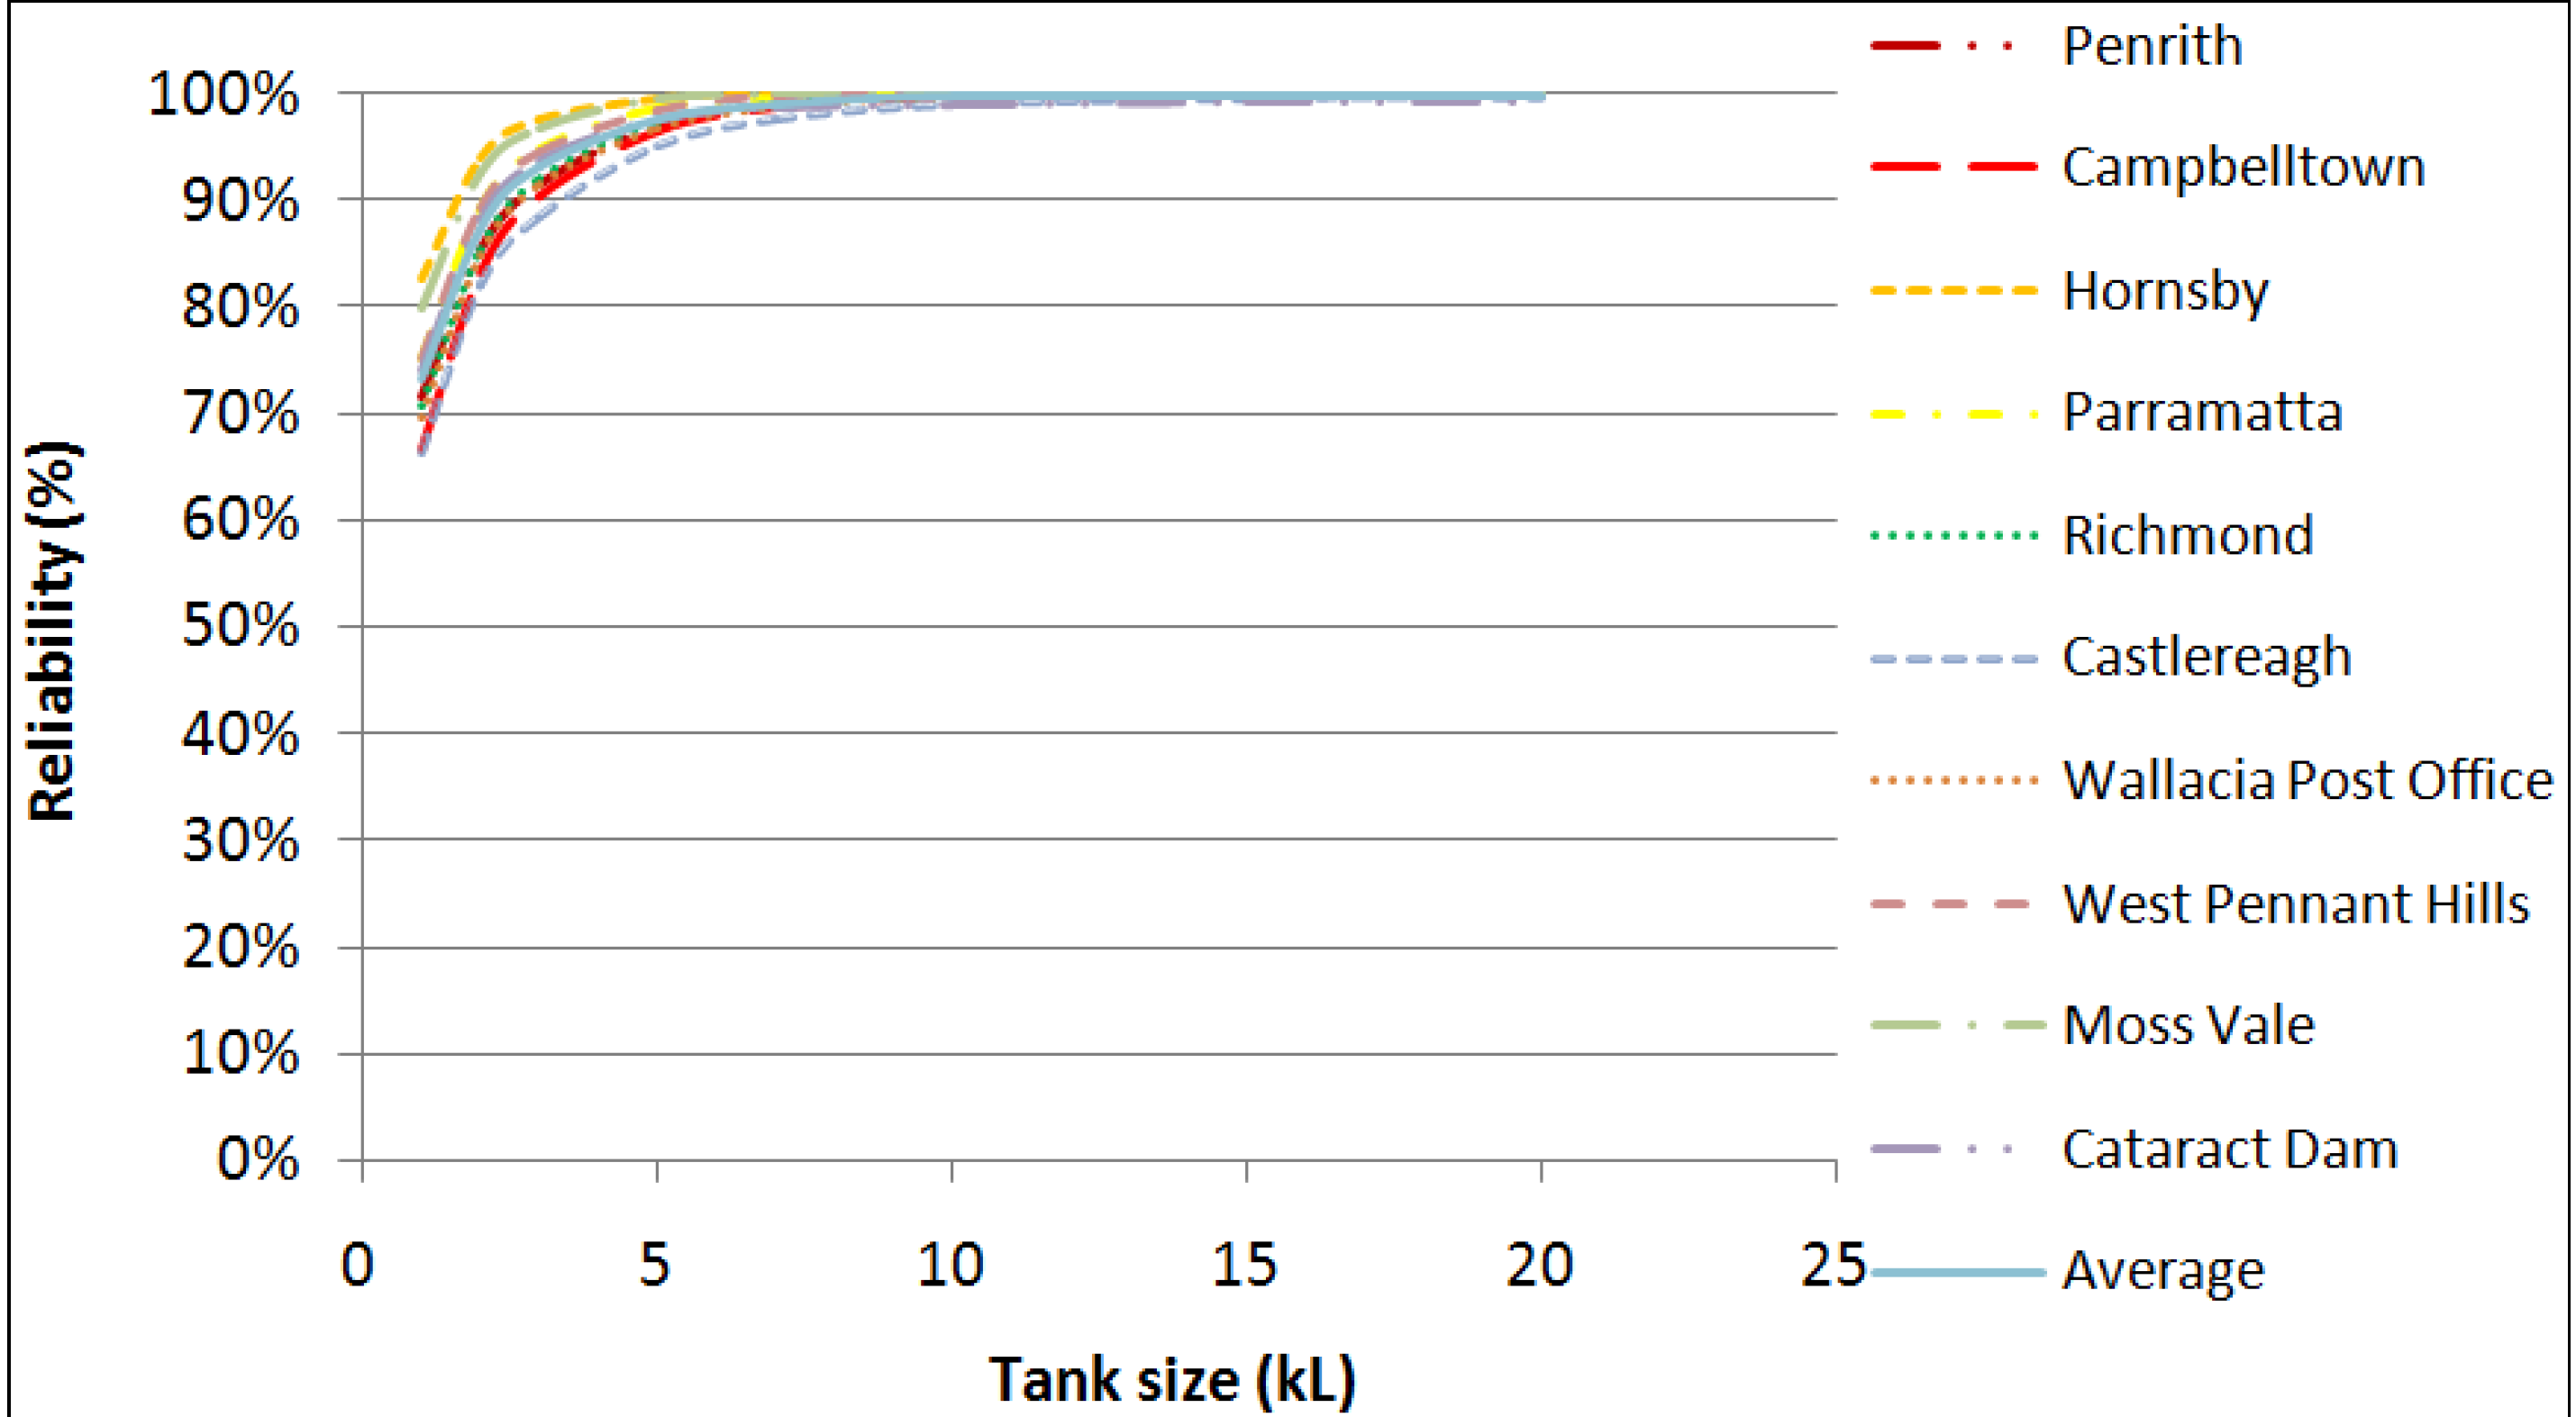
Figure 3 shows that, on average, a 1 kL rainwater tank can meet the demand for toilet and laundry use for 73% of the days in a year, which increases to 98% for a 5 kL tank size and 99% for a 20 kL tank. Among the ten locations, Hornsby has the highest reliability (99% for a 5 kL tank) and Campbelltown has the lowest (96% for a 5 kL tank). This reliability is well related with the average annual rainfall values at these two locations (1325 mm and 743 mm for Hornsby and Campbelltown, respectively).
Figure 3 also shows that the differences in reliability across different locations reduce as the tank size increases and a rainwater tank of 5 kL size can meet the demand for toilet and laundry use with a reliability of greater than 96% at all the ten locations.
Figure 3.
Reliability of RWHS at ten selected locations using rainwater for toilet and laundry use (considering the daily rainfall data of all the years on record).
Figure 3.
Reliability of RWHS at ten selected locations using rainwater for toilet and laundry use (considering the daily rainfall data of all the years on record).
As can be found in
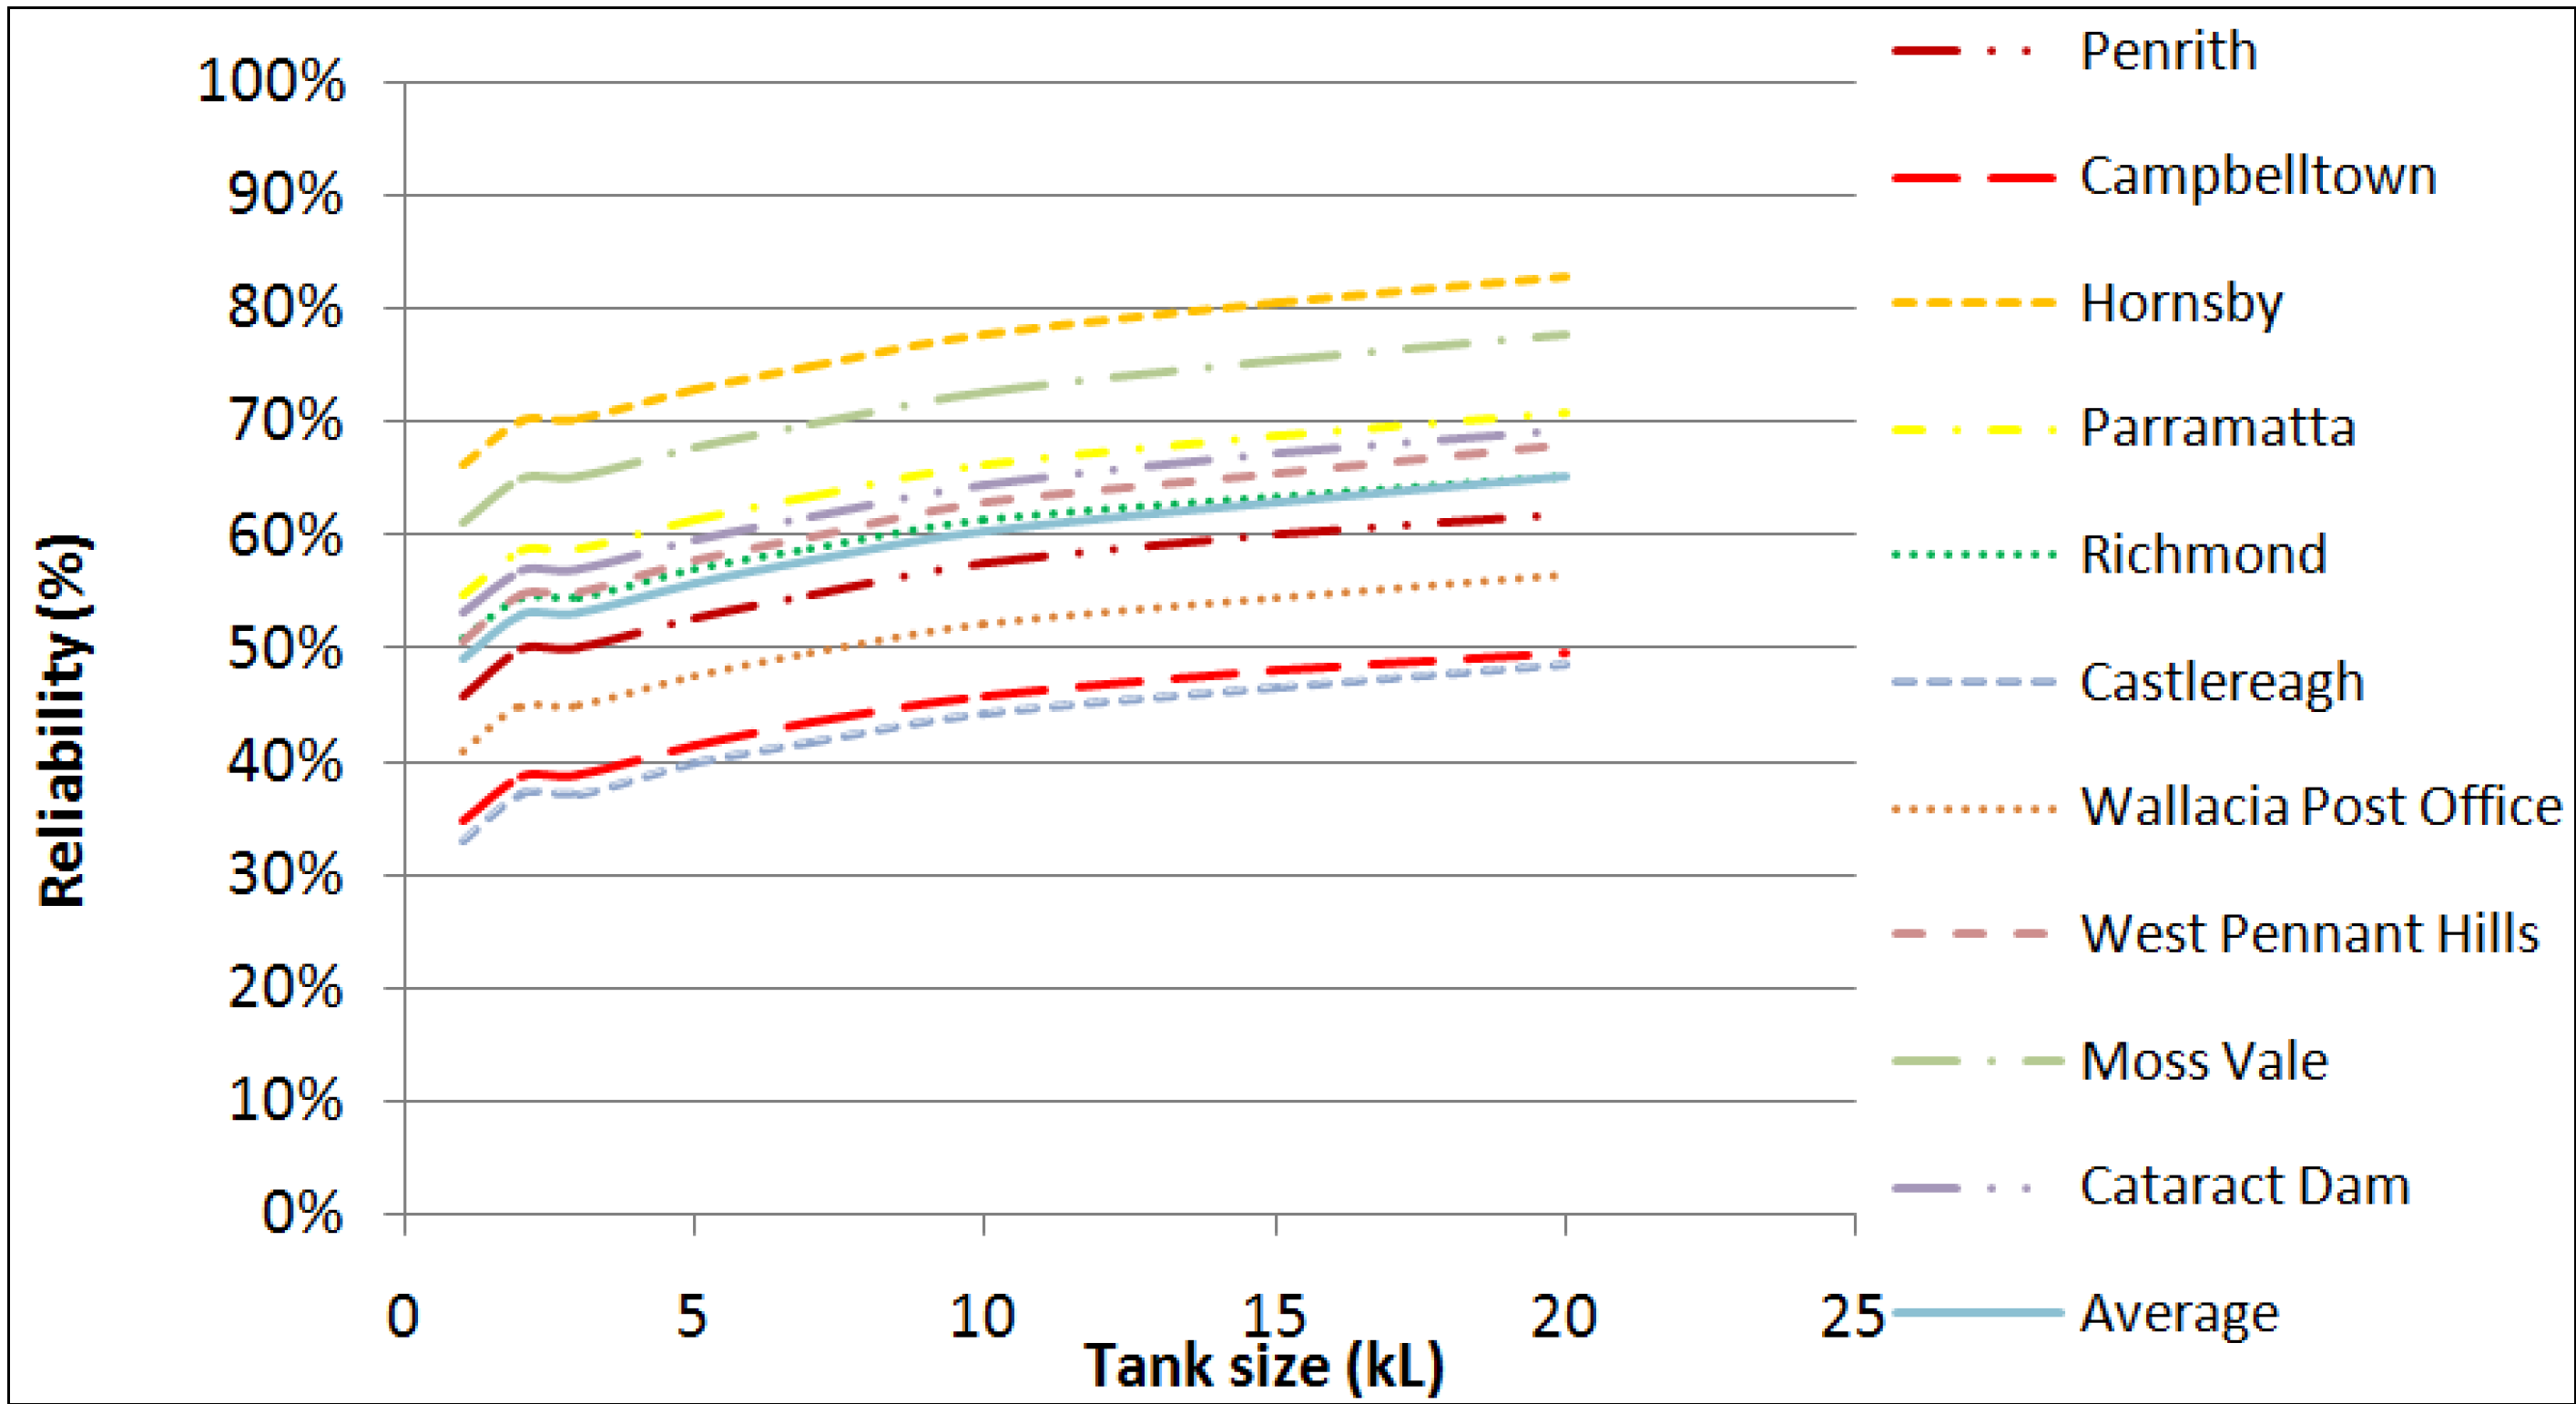
Figure 4, the reliability for irrigation use at all ten locations is smaller than for toilet and laundry use (shown in
Figure 3). For a 5 kL tank, the reliability values for Hornsby and Campbelltown are 73% and 41%, respectively. This result shows that the reliability varies significantly at these two locations, which is well related with the average annual rainfalls of these locations. The average reliability for the ten locations is very close to the reliability of Richmond. These results highlight that even with a 20 kL rainwater tank, the reliability of 99% cannot be achieved for irrigation use at any of the ten locations. This is due to the fact of the high irrigation demand in Greater Sydney regions, which is characterized by periods of drought spells lasting over weeks and even months in almost every year.
Figure 4.
Reliability of RWHS at ten selected locations using rainwater for irrigation use (considering the daily rainfall data of all the years on record).
Figure 4.
Reliability of RWHS at ten selected locations using rainwater for irrigation use (considering the daily rainfall data of all the years on record).
Figure 5.
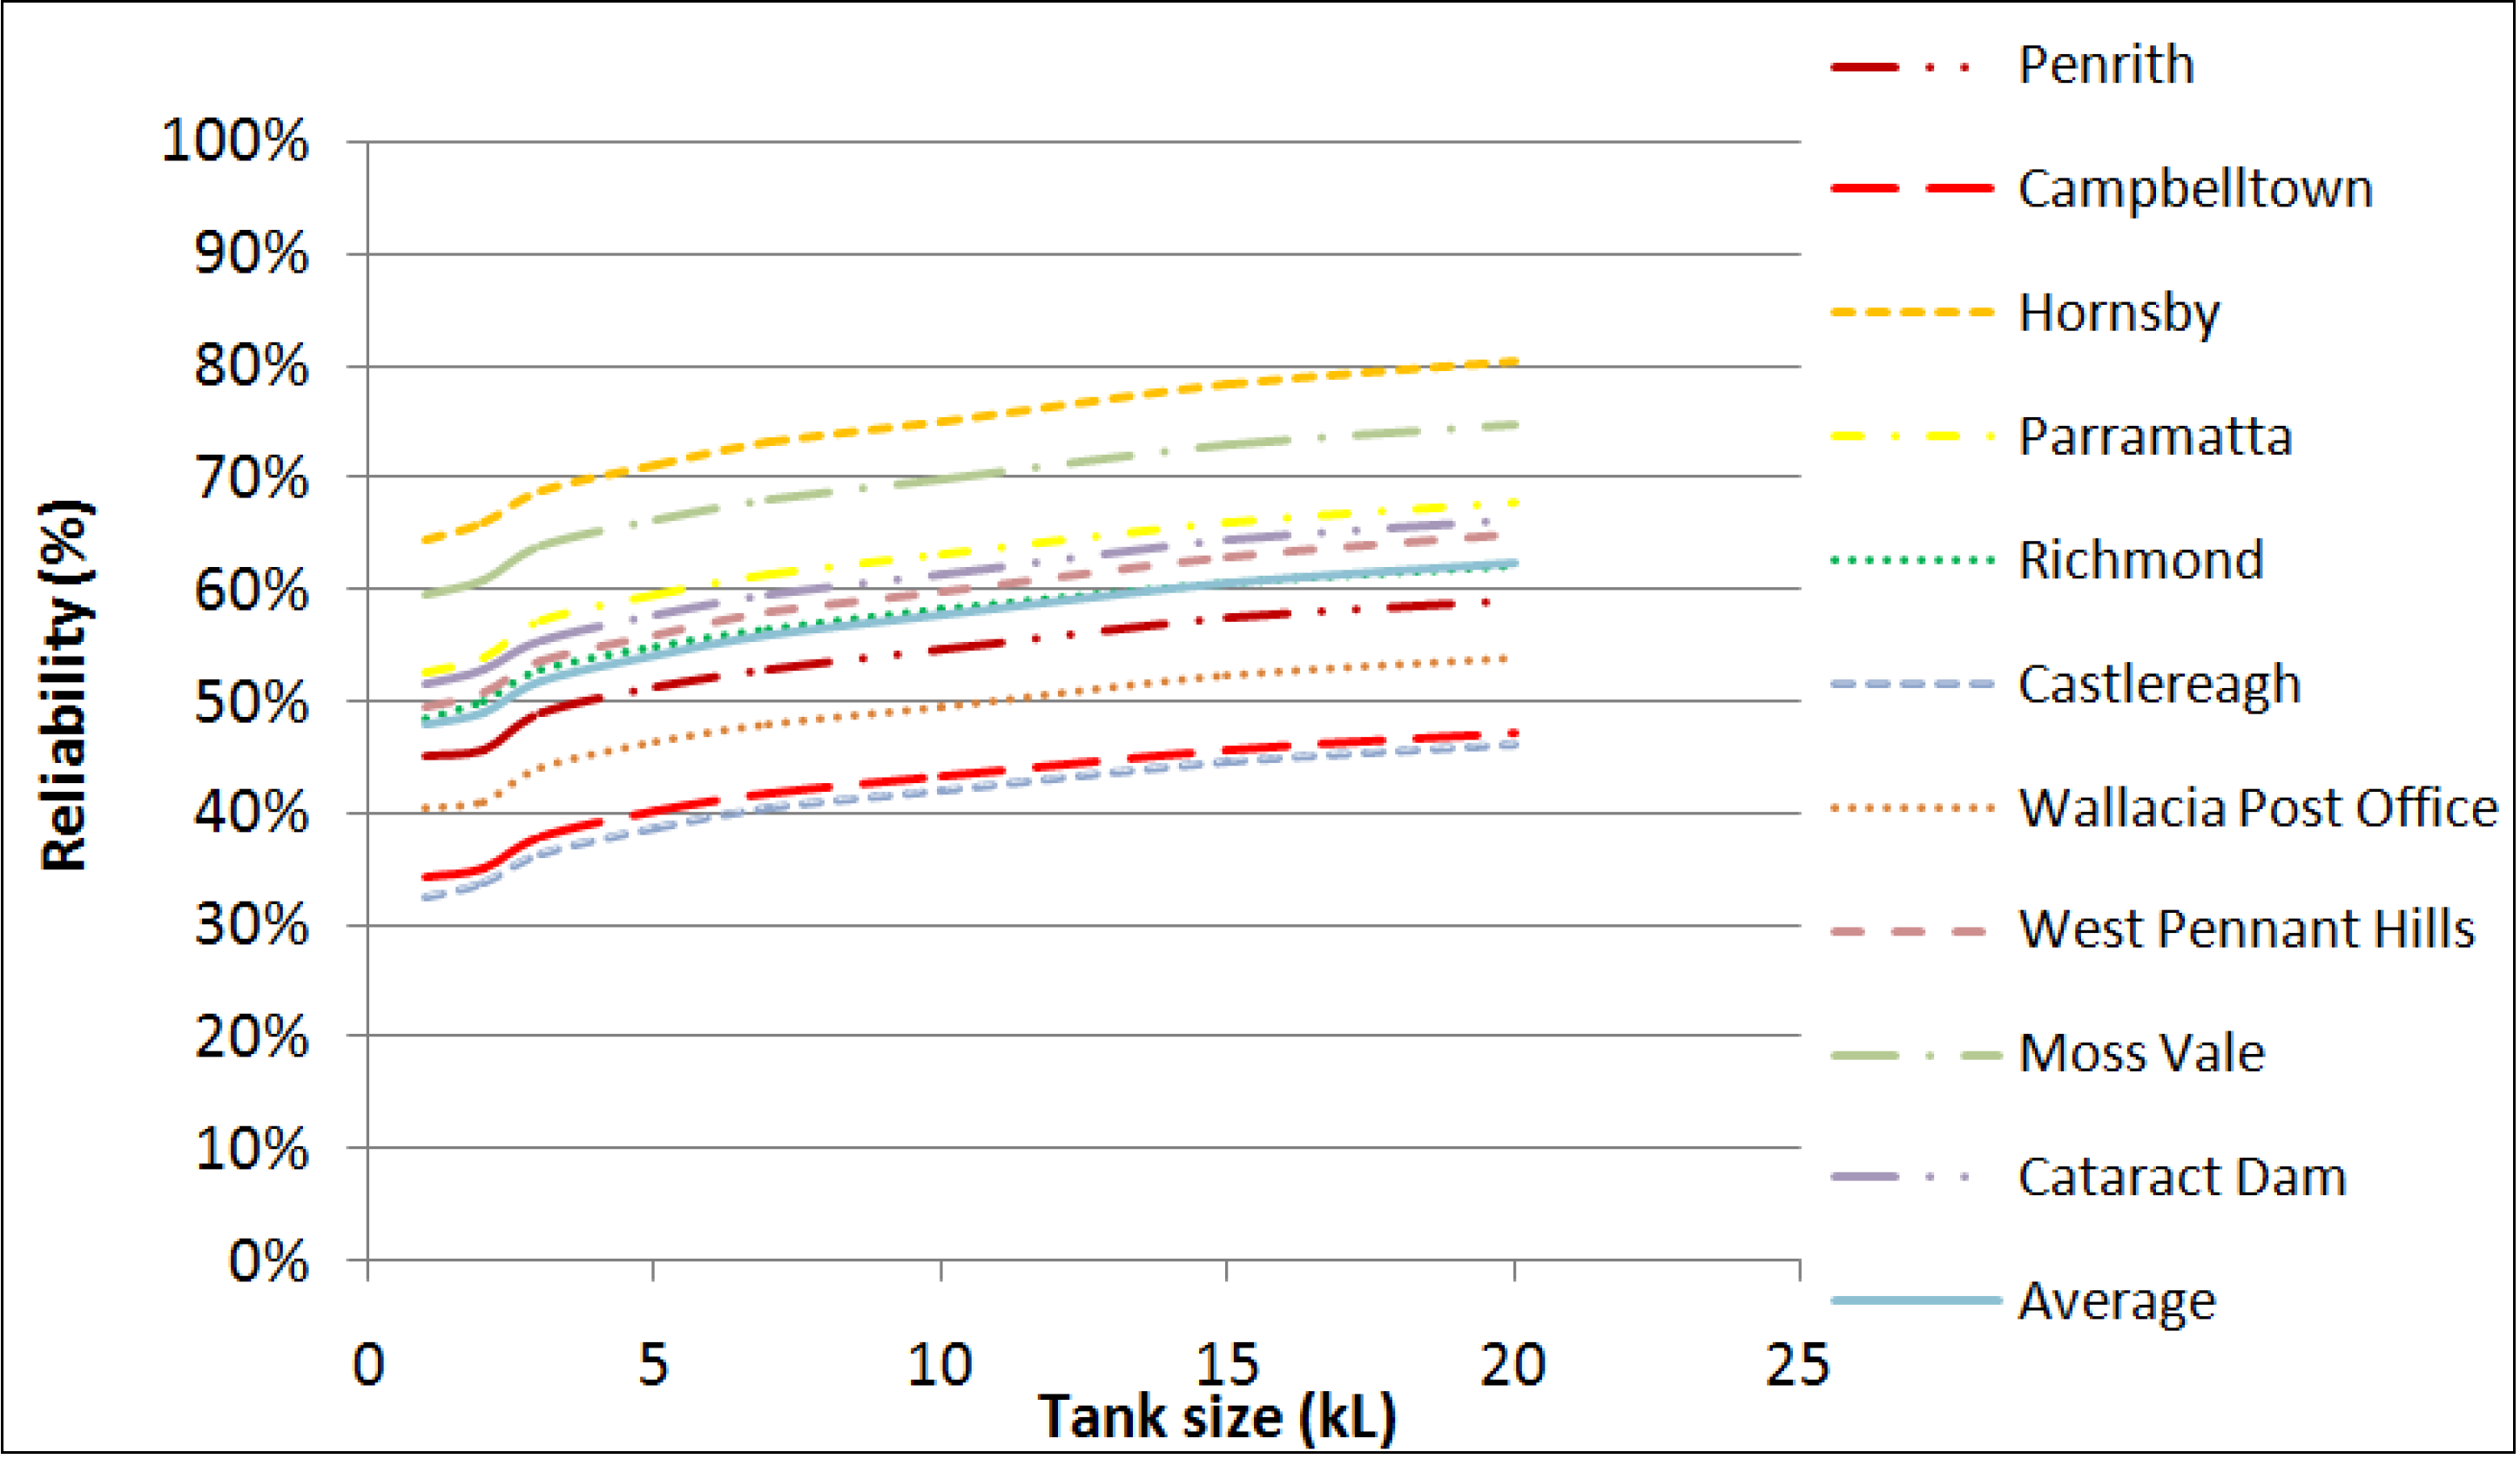
Reliability of RWHS at the ten selected locations for utilization of rainwater for combined use (considering the daily rainfall data of all the years on record).
Figure 5.
Reliability of RWHS at the ten selected locations for utilization of rainwater for combined use (considering the daily rainfall data of all the years on record).
Figure 5 presents reliability values for the toilet, laundry and irrigation use (combined use). It is found that the reliability increases with the increasing rainwater tank size as expected. The highest and lowest reliability values for a 5 kL tank were found to be for Hornsby (71%) and Campbelltown (40%) respectively. The average reliability over the ten locations is very close to the reliability for Richmond as can be seen in
Figure 5. The reliability for combined use does not reach 99% for any of the ten locations, not even for a 20 kL tank. Also, there is a notable difference in reliability across different locations in Greater Sydney, which suggests that a common tank size is not appropriate for Greater Sydney regions.
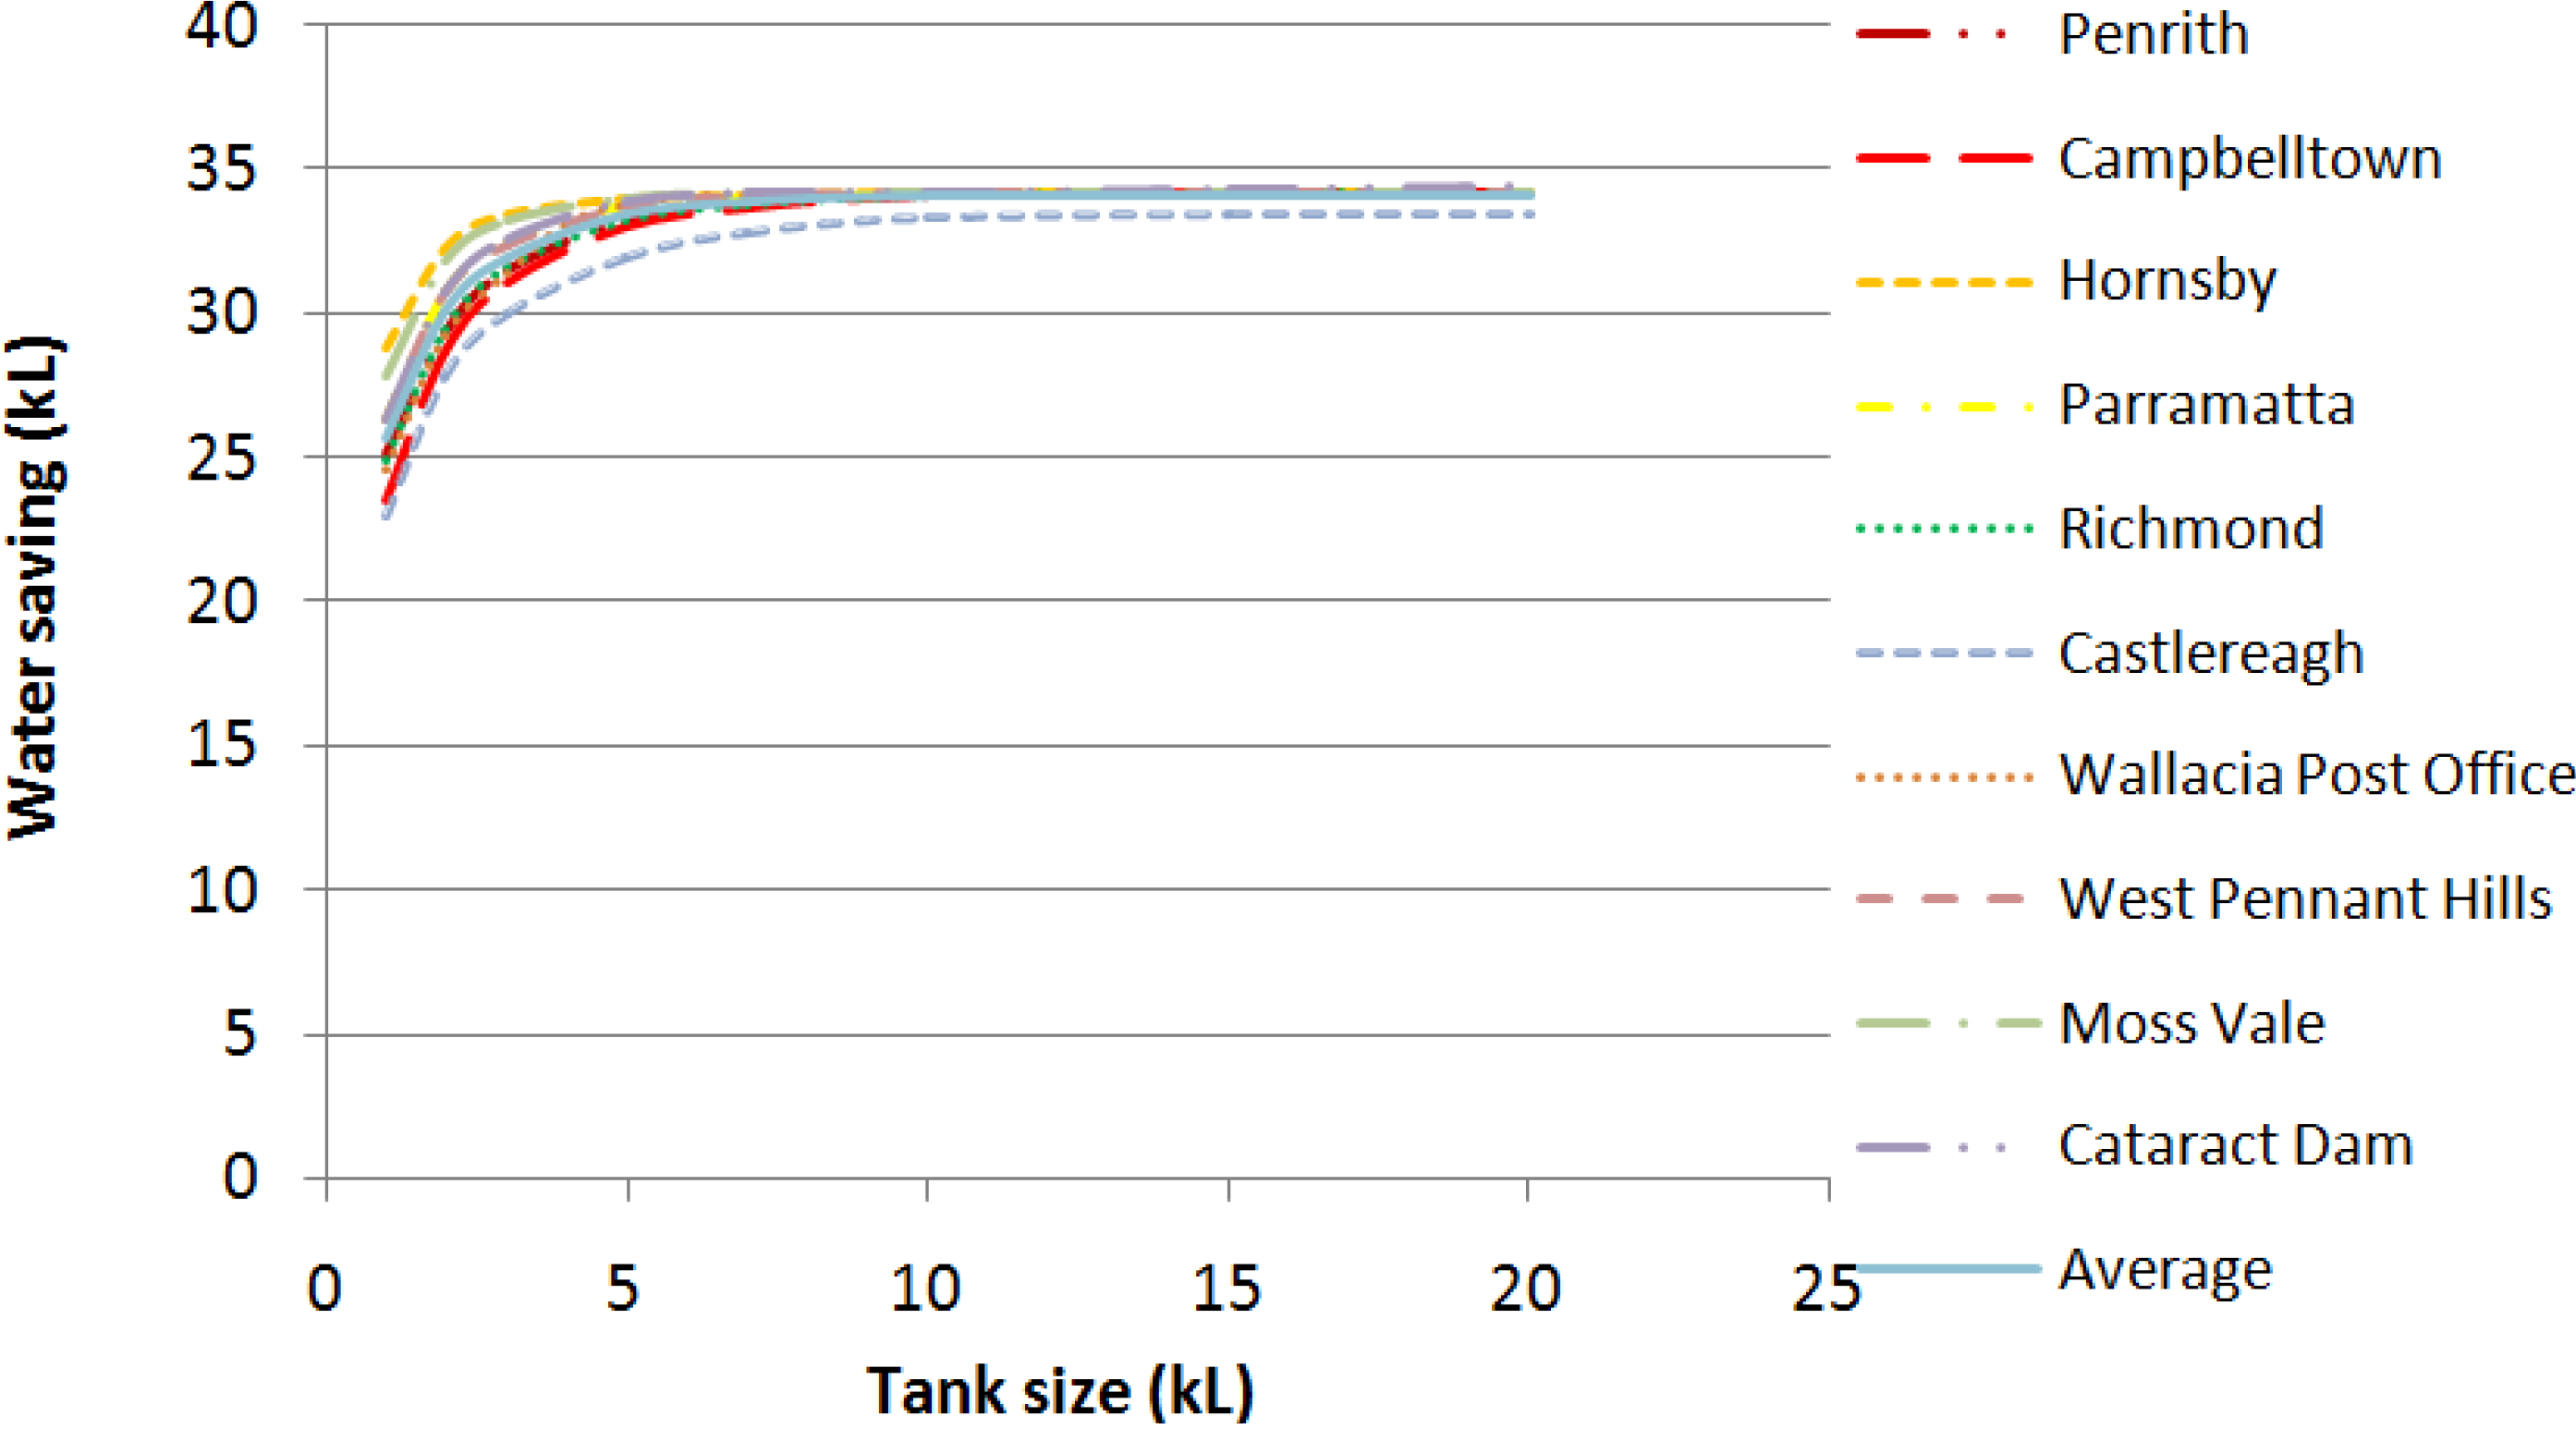
Figure 6 shows the water savings for toilet and laundry use. It can be seen that after about a 7 kL tank size, the water savings become nearly constant for all ten locations. This is due to the fact that water utilization from a tank largely depends on the number of users in the house; for a larger tank, if the number of users is not increased, the water savings would not increase as a significant portion of the harvested water would remain unutilized. For a 5 kL tank, the average annual water-savings range is from 34 kL (Hornsby) to 33 kL (Campbelltown) with a mean value of 33 kL over all the ten locations, which suggests a smaller variation across the ten locations with respect to water savings for toilet and laundry use.
Figure 6.
Water savings from a RWHS for toilet and laundry use (considering the daily rainfall data of all the years on record).
Figure 6.
Water savings from a RWHS for toilet and laundry use (considering the daily rainfall data of all the years on record).
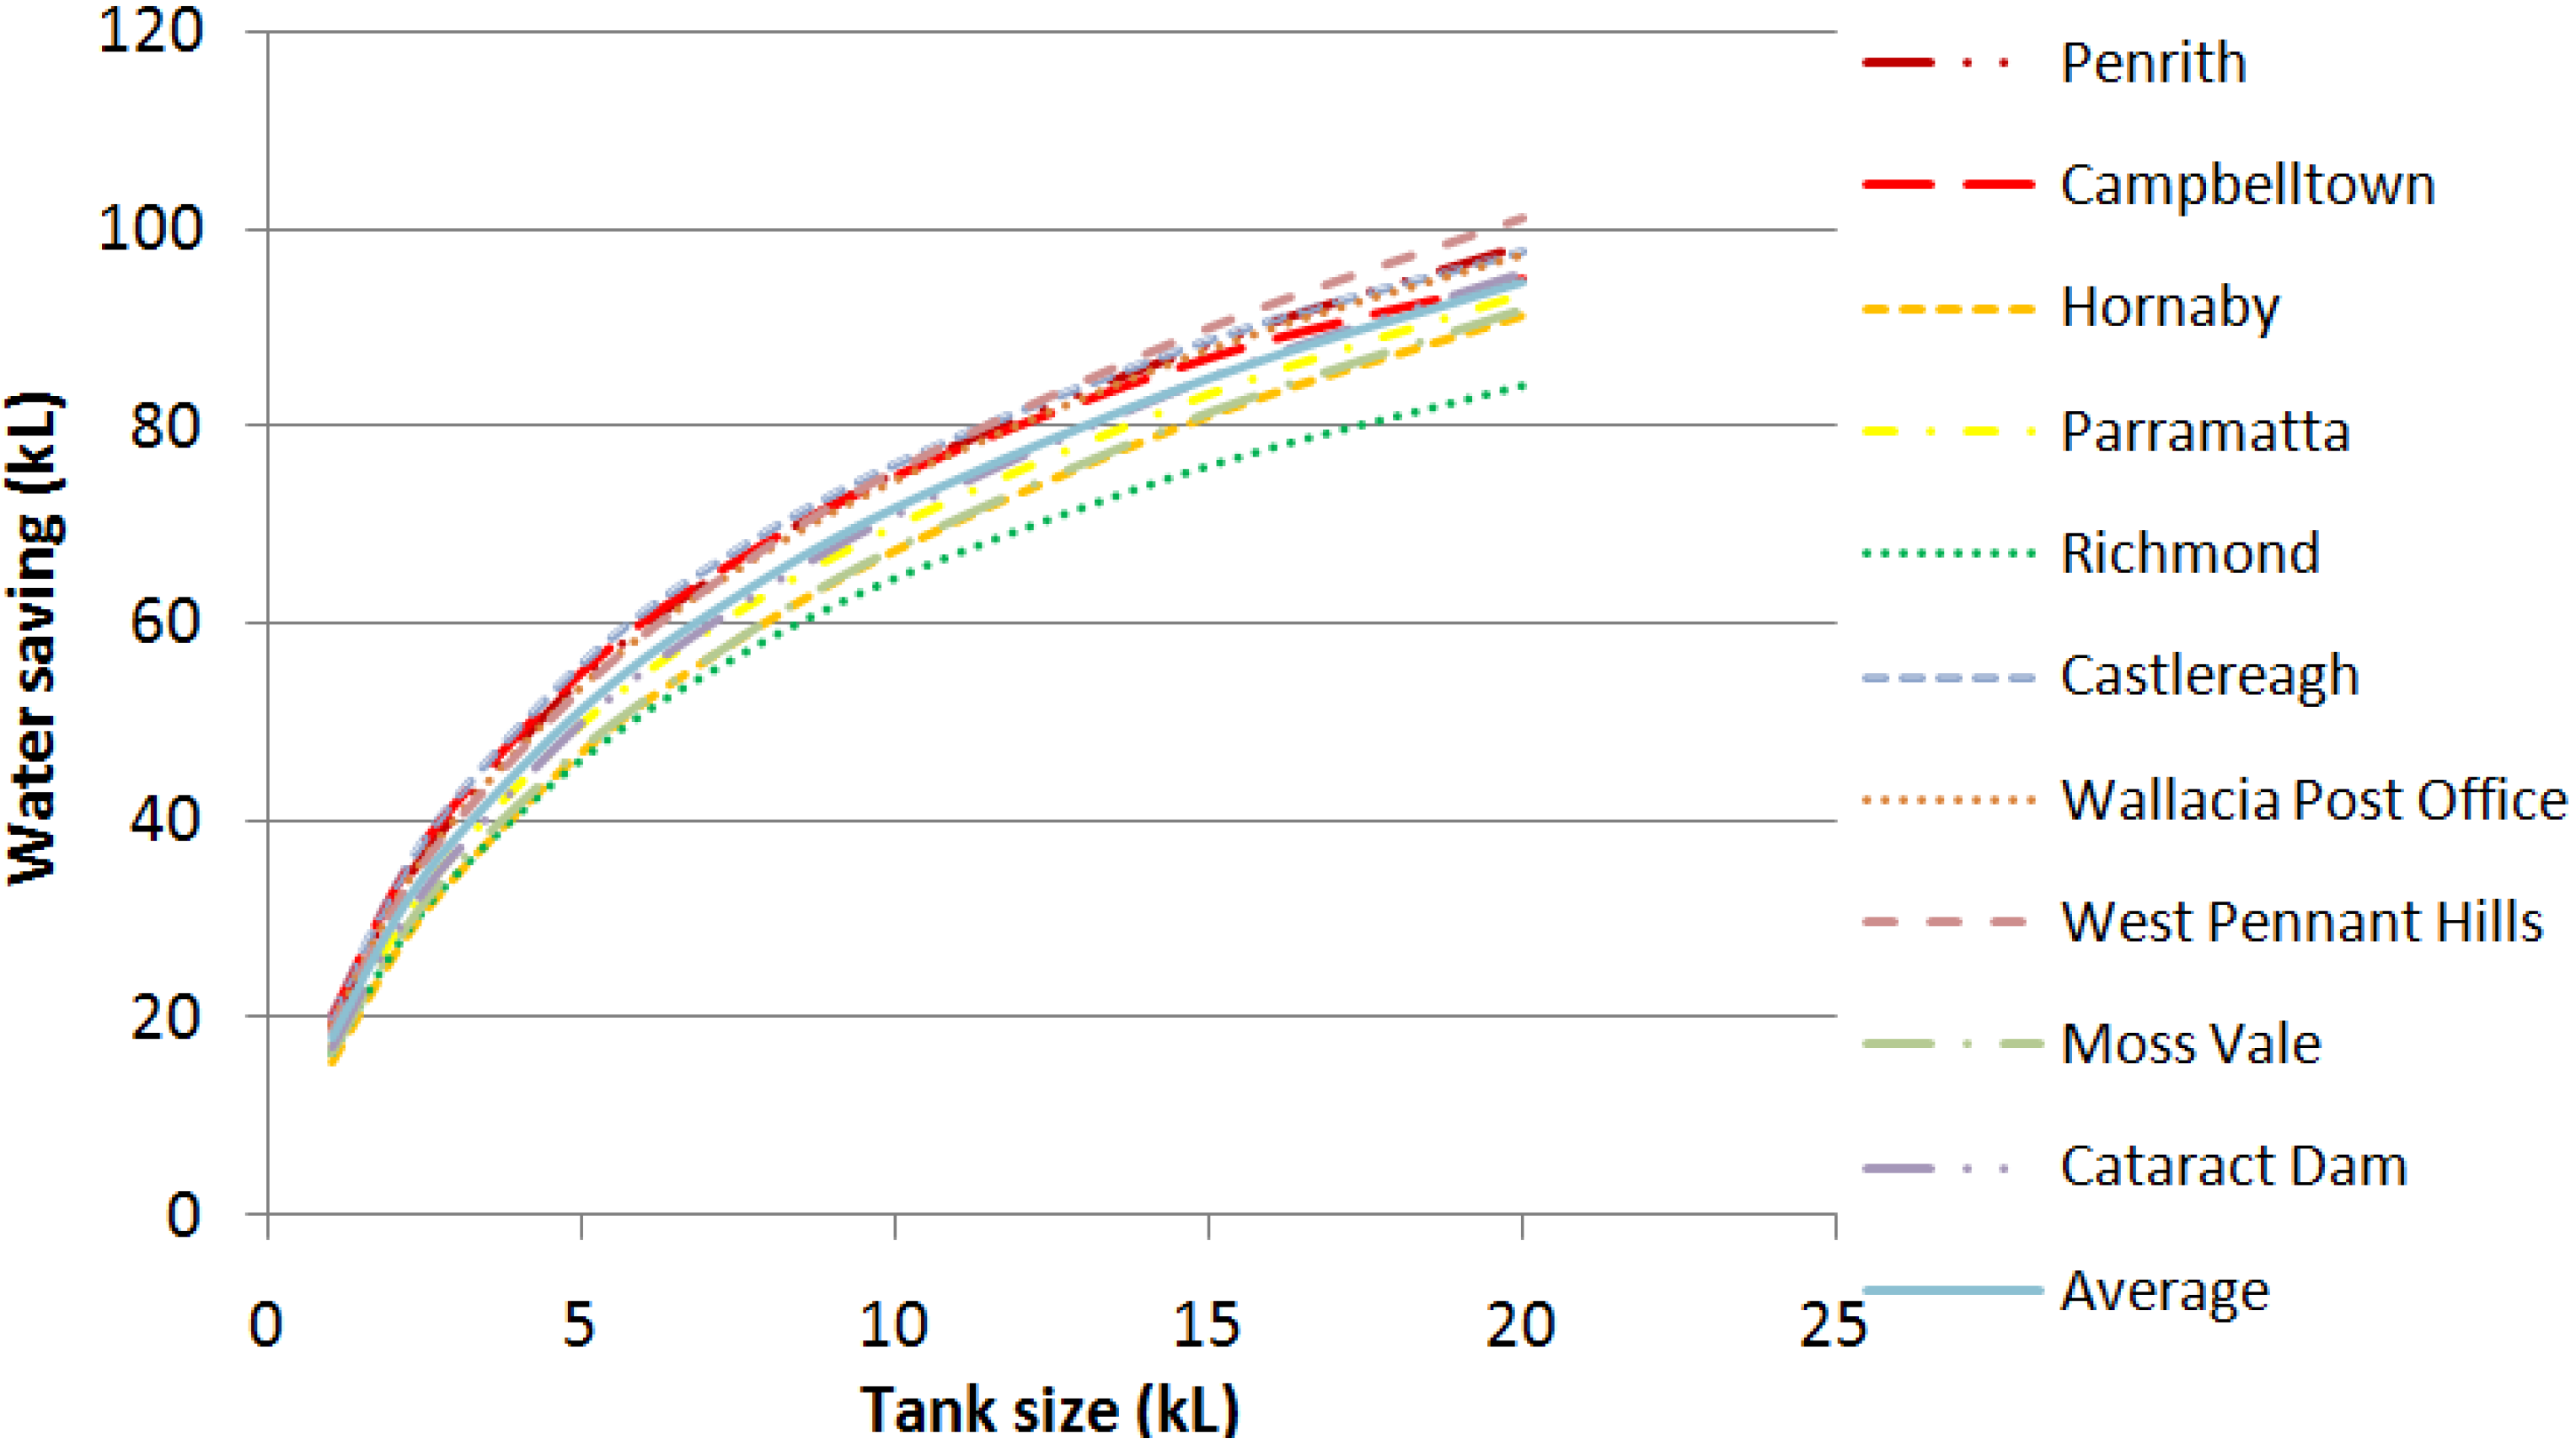
Figure 7 shows that water savings for irrigation use increase with increasing rainwater tank size as expected. For a 5 kL tank, the average annual water-savings range from 46 kL (Richmond) to 54 kL (Penrith), with the mean value for the ten locations being 51 kL.
Figure 7.
Water savings from a RWHS for irrigation use (considering the daily rainfall data of all the years on record).
Figure 7.
Water savings from a RWHS for irrigation use (considering the daily rainfall data of all the years on record).
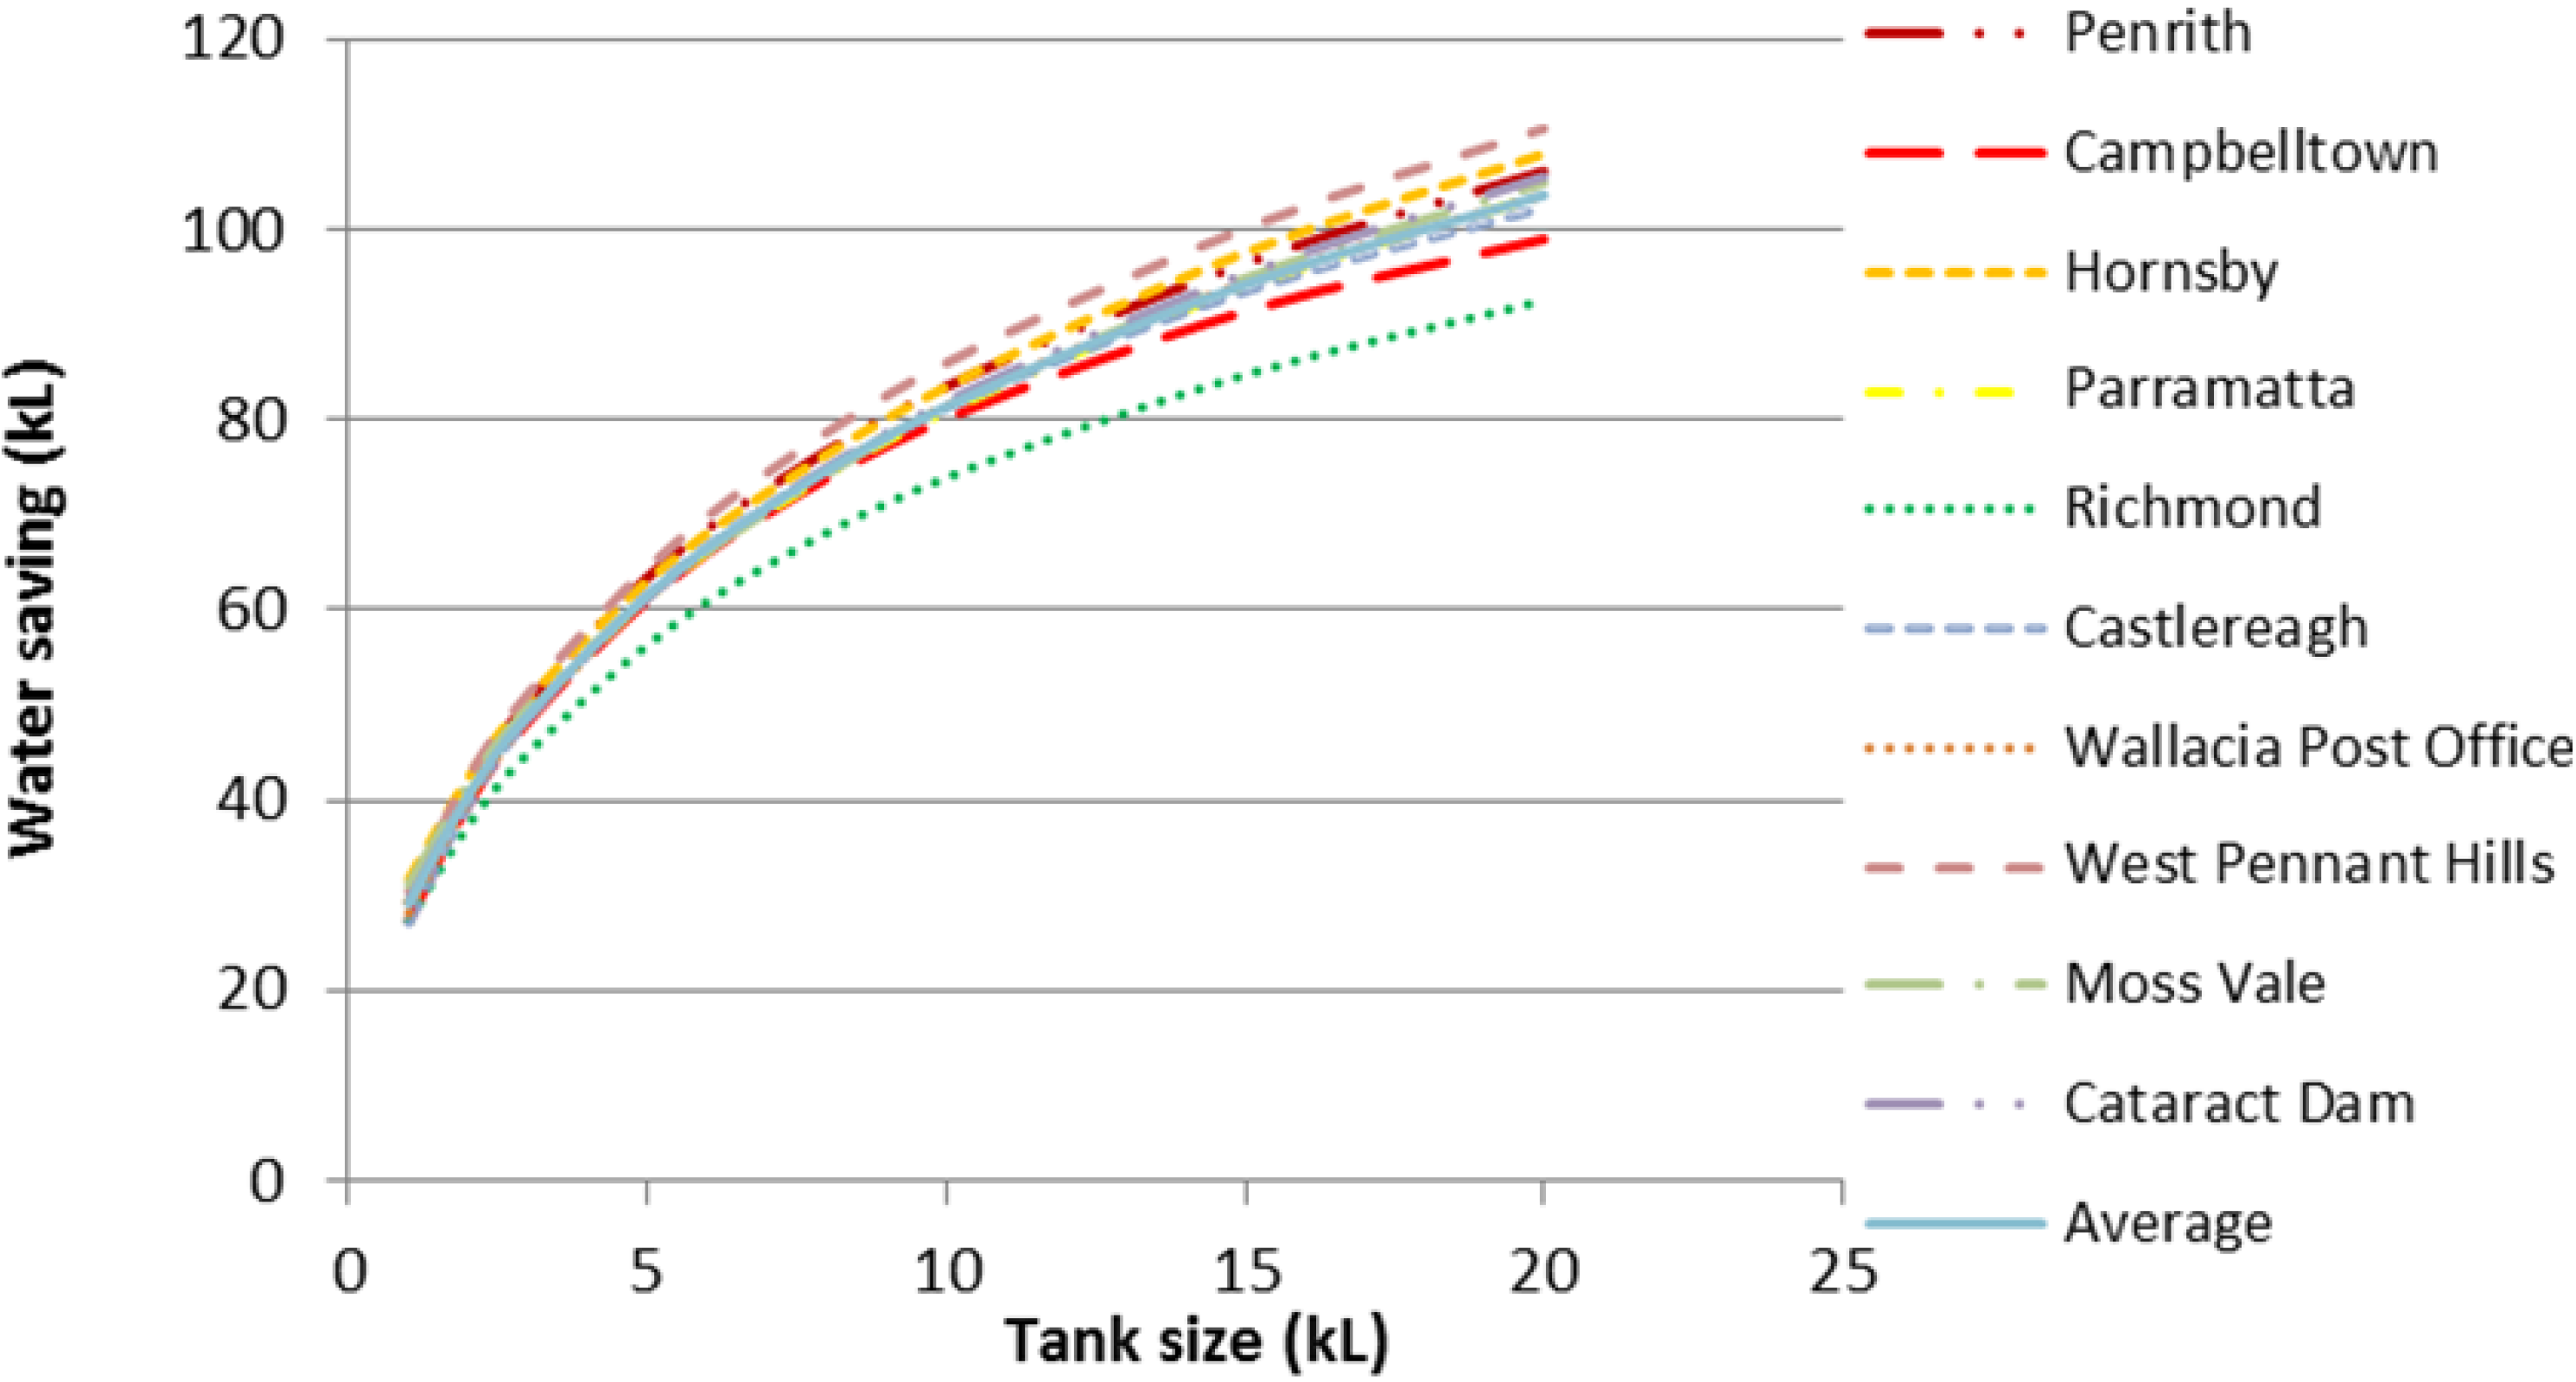
Figure 8 shows that the differences in water savings for combined use for the ten different locations reduce as the size of rainwater tank decreases. The water saving increases with the increasing rainwater tank size as expected. For a 5 kL tank, Penrith has the highest average annual water savings (62 kL), Richmond has the lowest annual water savings (56 kL) and Parramatta corresponds very well to the average annual water savings over the ten locations (61 kL).
Figure 8.
Water savings from a RWHS for combined use (considering the daily rainfall data of all the years on record).
Figure 8.
Water savings from a RWHS for combined use (considering the daily rainfall data of all the years on record).
Table 2 shows the correlation coefficients of the relation between (i) reliability
vs. tank size; and (ii) water savings
vs. tank size.
Table 2 shows that Hornsby and Campbelltown have the lowest and highest correlation coefficients for toilet and laundry use, and irrigation use. Moreover, the combined use over all the ten locations exhibits a strong correlation between the reliability and tank size, and water savings and tank size.
Table 2.
Correlation coefficients between (i) reliability vs. tank size and (ii) water saving vs. tank size.
Table 2.
Correlation coefficients between (i) reliability vs. tank size and (ii) water saving vs. tank size.
| Locations | Toilet and laundry | Irrigation | Combined use |
|---|
| Reliability | Water savings | Reliability | Water savings | Reliability | Water savings |
|---|
| Campbelltown | 0.91 | 0.91 | 0.99 | 0.99 | 0.98 | 0.99 |
| Hornsby | 0.93 | 0.91 | 0.99 | 0.99 | 0.99 | 0.99 |
| Parramatta | 0.83 | 0.83 | 0.98 | 0.99 | 0.99 | 0.99 |
| Penrith | 0.87 | 0.87 | 0.98 | 0.99 | 0.99 | 0.99 |
| Richmond | 0.90 | 0.91 | 0.99 | 0.99 | 0.99 | 0.99 |
| Castlereagh | 0.93 | 0.93 | 0.99 | 0.99 | 0.99 | 0.99 |
| Wallacia Post Office | 0.91 | 0.91 | 0.99 | 0.99 | 0.98 | 0.99 |
| West Pennant Hills | 0.88 | 0.88 | 0.98 | 0.99 | 0.98 | 0.99 |
| Moss Vale | 0.84 | 0.84 | 0.98 | 0.99 | 0.99 | 0.99 |
| Cataract Dam | 0.88 | 0.88 | 0.98 | 0.99 | 0.99 | 0.99 |
For a 5 kL rainwater tank in the ten selected locations in Greater Sydney regions, the reliability of a RWHS was found to be moderately correlated with the average annual rainfall (AAR) as shown by the following equations:
where
R1,
R2,
R3 are reliabilities (%) for (i) toilet and laundry (ii) irrigation and (iii) combined use, respectively, and AAR is average annual rainfall (mm) and
R2 is the coefficient of determination.
Figure 9 and
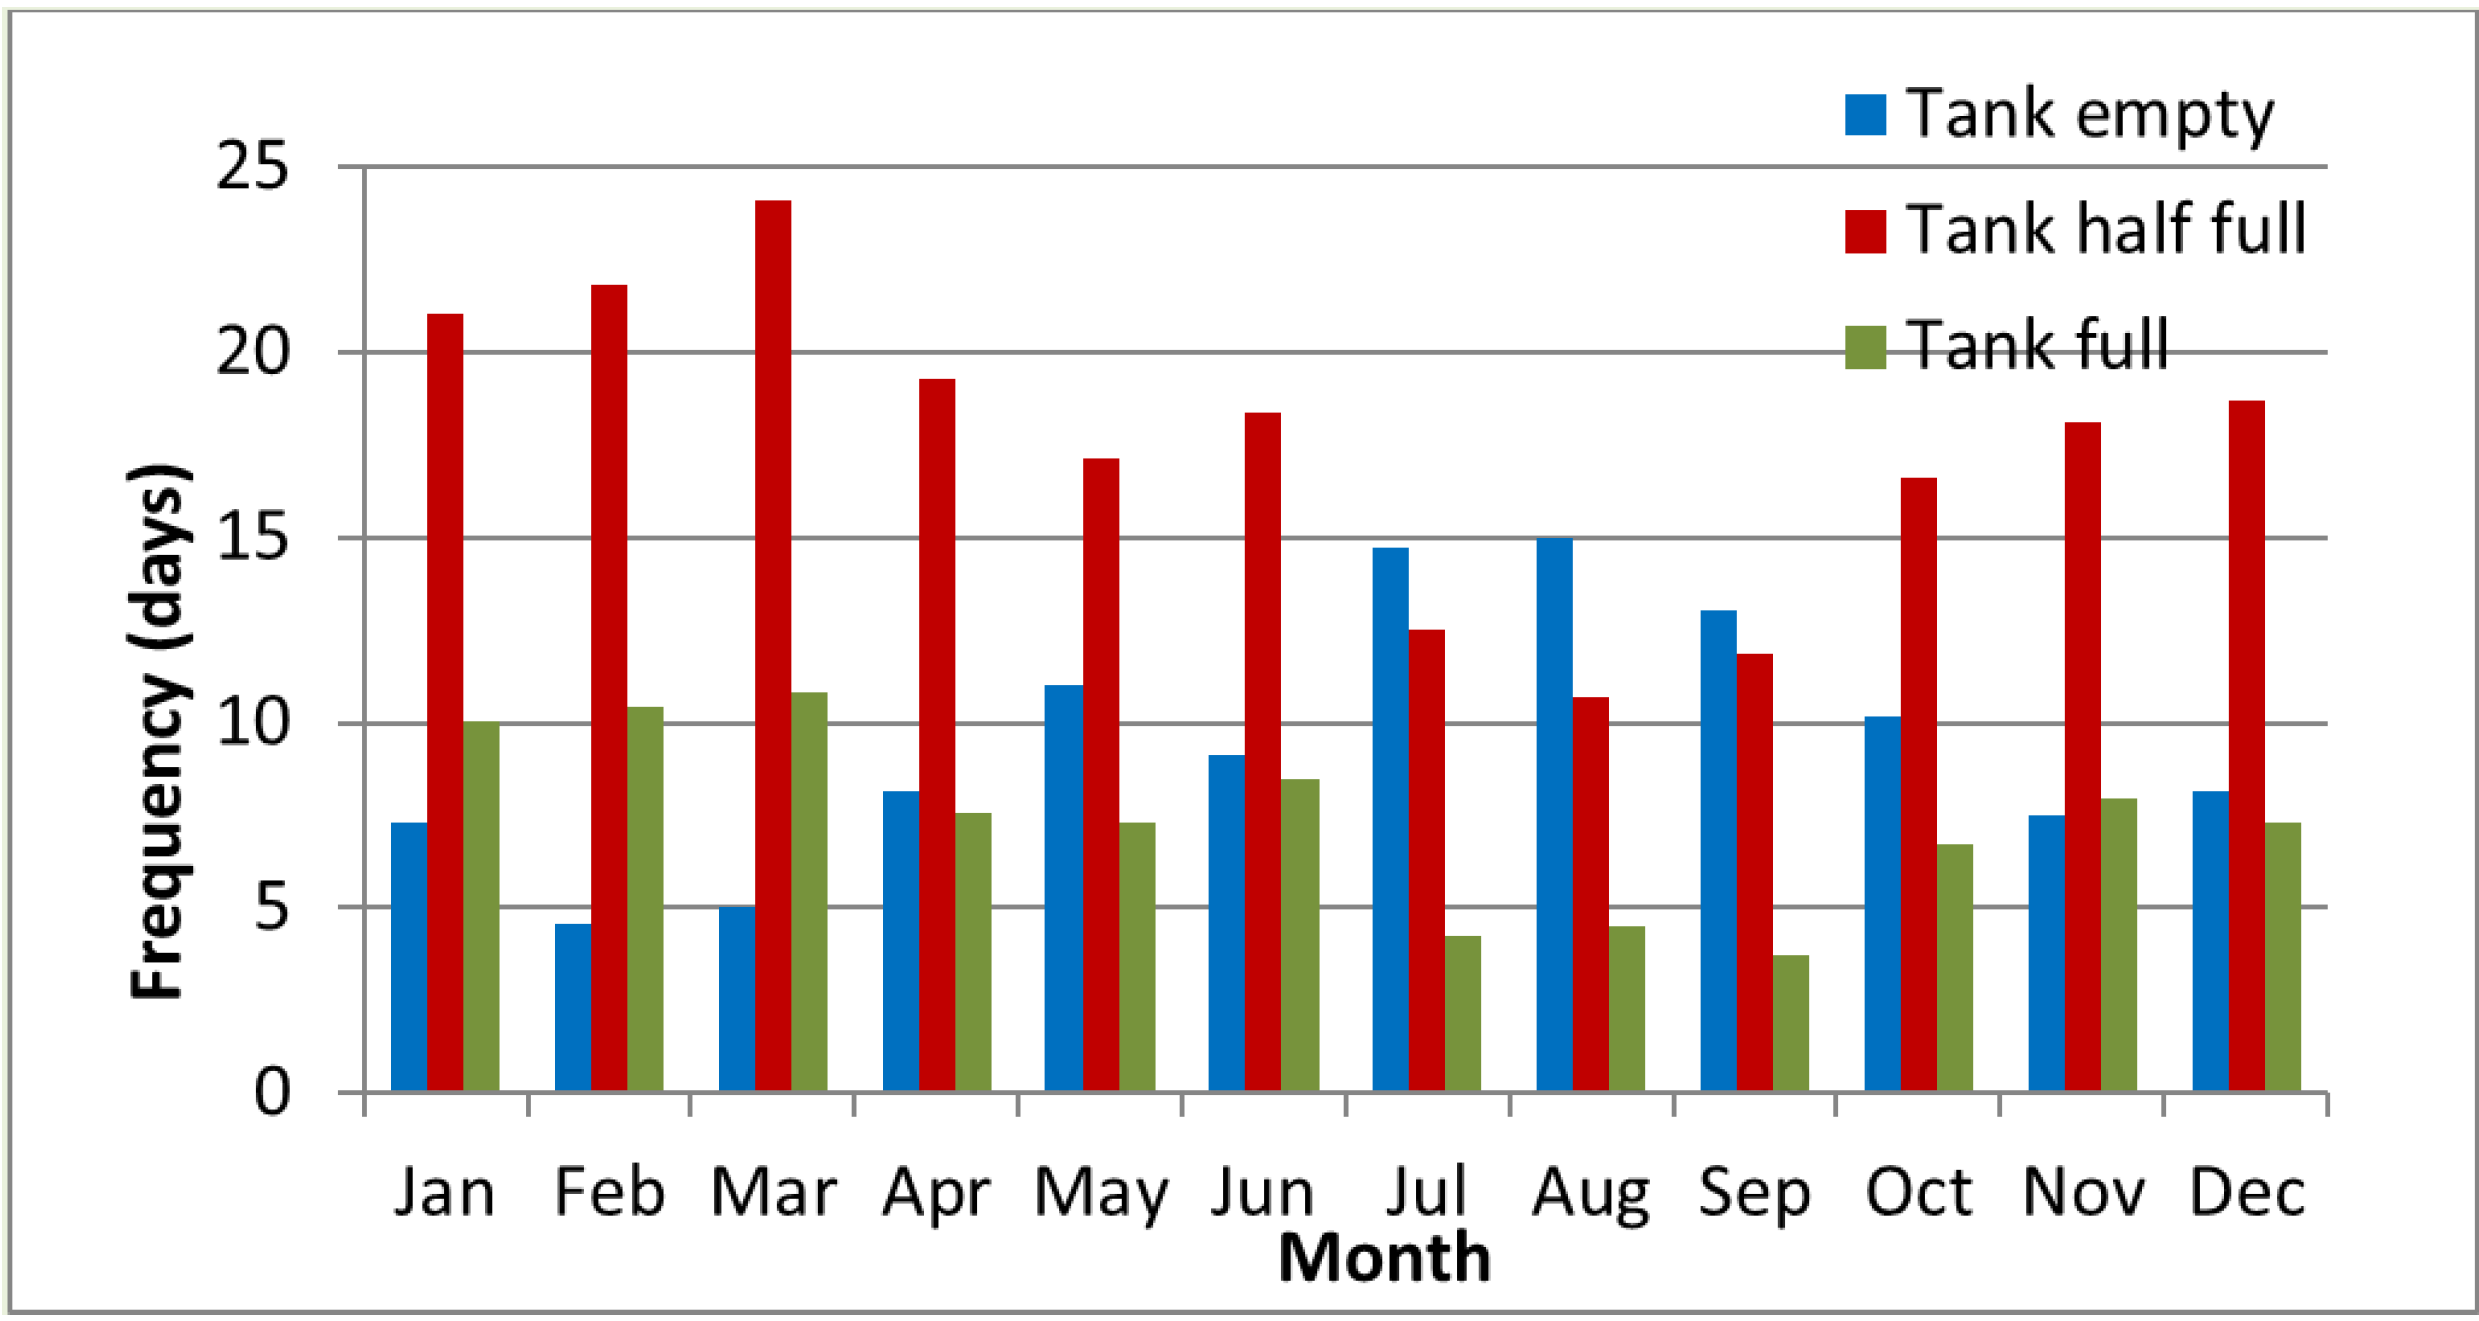
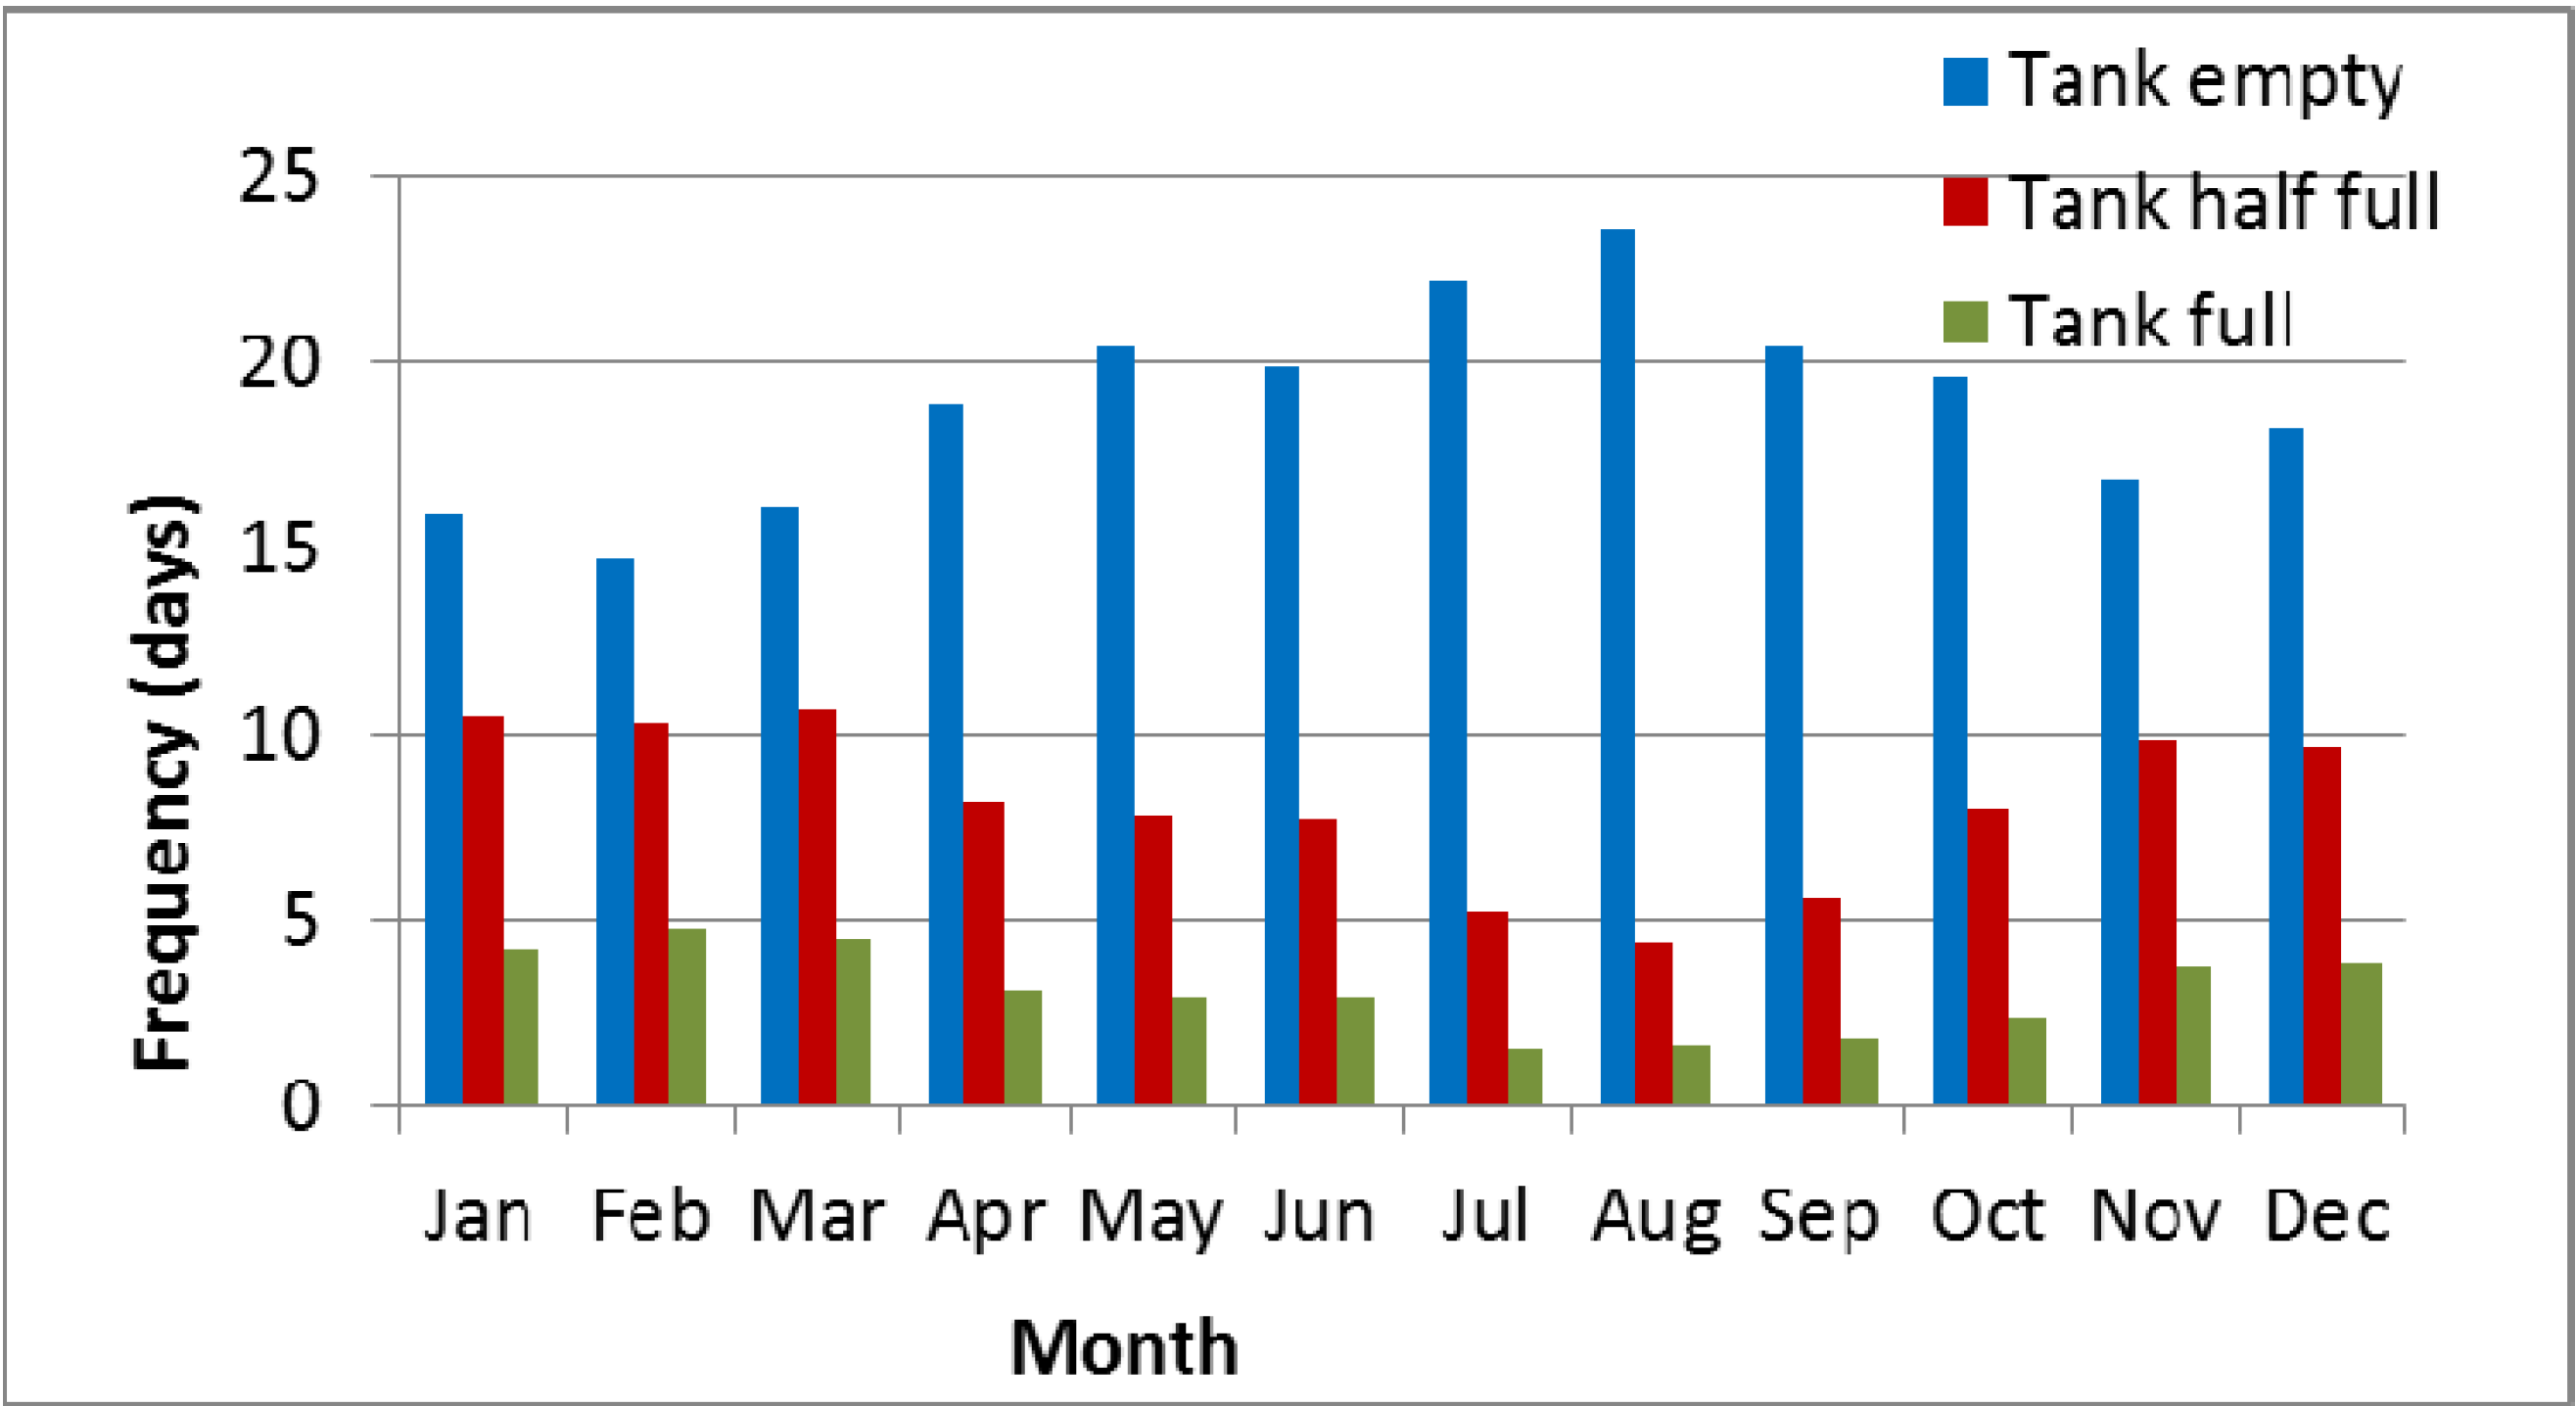
Figure 10 give a summary of the monthly performance of a 5 kL rainwater tank in Hornsby and Campbelltown locations, which have the highest and lowest average annual rainfalls among the ten selected locations. From
Figure 9 it can be seen that a 5 kL rainwater tank in Hornsby remains empty, more than half-full, and full for 114, 211 and 88 days of the year on average, respectively.
Figure 10 shows that a 5 kL rainwater tank at Campbelltown location remains empty for 227 days per year and full for only 38 days per year on average. A comparison of
Figure 9 and
Figure 10 highlights the differences in the effectiveness of a RWHS over different months of the year, with tanks remaining full and half-full at Hornsby on a greater number of days (1.5 to 2 times higher) than that of Campbelltown. At both the locations, rainwater tanks remain empty on the highest number of days during July to September
i.
e., during winter. At Hornsby, during October to June, the tank remains half full 15 to 24 days per month on average, which is only 7 to 11 days in the case of Campbelltown.
Figure 9.
Frequency of tank being full, half-full and empty at Hornsby (considering the daily rainfall data of all the years on record).
Figure 9.
Frequency of tank being full, half-full and empty at Hornsby (considering the daily rainfall data of all the years on record).
Figure 10.
Frequency of tank being full, half-full and empty at Campbelltown (considering the daily rainfall data of all the years on record).
Figure 10.
Frequency of tank being full, half-full and empty at Campbelltown (considering the daily rainfall data of all the years on record).
The reliability and water savings of the wettest, driest and average years on record were then determined. The wettest and driest years on record were identified as the years having the lowest and highest total yearly rainfall values during the period of data availability at the selected location as noted in
Table 1. The average year at a given location was selected as the year that has the total yearly rainfall closest to the average annual rainfall value at that location.
Table 3 shows the driest, wettest and average years on record and the corresponding total yearly rainfall for the ten selected locations. Based on the daily rainfall data of the identified driest, wettest and average years on record, the reliability and water savings at three locations (Campbelltown, Hornsby and Richmond) for a 5kL RWHS were determined as shown in
Table 4,
Table 5 and
Table 6. For toilet and laundry use, the reliability is 99% in the wettest year on record for all the three locations. In contrast, for the driest year, the reliability ranges from 69% to 99%. For the average year, the reliability ranges from 90% to 97% for toilet and laundry use. For irrigation use and combined use, reliability values for the driest year were quite smaller (29% to 66%). For the wettest year, reliability for irrigation use and combined use were found to be very similar at each of the three locations (ranging from 63% to 96%) as can be seen in
Table 5 and
Table 6. Among the three locations, Hornsby has the highest reliability values for all the three water uses.
Table 3.
Annual total rainfalls (ATR) in the wettest, driest and average years on record for the ten locations.
Table 3.
Annual total rainfalls (ATR) in the wettest, driest and average years on record for the ten locations.
| Location | Driest year | ATR (mm) | Wettest year | ATR (mm) | Average year | ATR (mm) |
|---|
| Campbelltown | 1907 | 320 | 1950 | 1649 | 1954 | 746 |
| Hornsby | 1941 | 758 | 1950 | 2541 | 1964 | 1323 |
| Parramatta | 1979 | 527 | 1990 | 1712 | 1970 | 962 |
| Penrith | 2006 | 525 | 1978 | 1519 | 1976 | 949 |
| Richmond | 1944 | 277 | 1950 | 1739 | 2001 | 797 |
| Castlereagh | 1944 | 230 | 1950 | 1677 | 1953 | 799 |
| Wallacia Post Office | 1944 | 355 | 1950 | 2032 | 1978 | 871 |
| West Pennant Hills | 2005 | 439 | 1950 | 2253 | 1972 | 1080 |
| Moss Vale | 1980 | 607 | 1978 | 2112 | 2001 | 1128 |
| Cataract Dam | 2008 | 197 | 1950 | 2282 | 1983 | 1103 |
Table 4.
Reliability and water savings at Campbelltown, Hornsby and Richmond for a 5 kL rainwater tank for toilet and laundry use for the driest, wettest and average years on record.
Table 4.
Reliability and water savings at Campbelltown, Hornsby and Richmond for a 5 kL rainwater tank for toilet and laundry use for the driest, wettest and average years on record.
| Location | Driest year | Wettest year | Average year |
|---|
| Reliability (%) | Water savings (kL) | Reliability (%) | Water savings (kL) | Reliability (%) | Water savings (kL) |
|---|
| Campbelltown | 83 | 29 | 100 | 34 | 90 | 31 |
| Hornsby | 100 | 34 | 100 | 34 | 97 | 33 |
| Richmond | 69 | 39 | 100 | 34 | 95 | 33 |
In the sensitivity analysis, it was found that in the case of toilet and laundry use and combined use, the case of 2 occupants increased the reliability and reduced the quantity of water savings compared with the case of 4 occupants. On the other hand, the case of 6 occupants reduced the reliability and increased the water savings compared with the 4 occupants. For example, in the case of 2 occupants, for toilet and laundry use, for a 5 kL tank, reliability and water savings were found to be 99% and 21 kL, respectively. While in the case of 6 occupants, for a 5 kL tank, reliability and water-saving values were found to be 91% and 43 kL, respectively. In the case of irrigation use, the reliability and water savings remained very similar for the number of occupants of 2, 4 and 6. The change of frequency of toilet use from 3 to 5 times per person per day resulted in a reduction of reliability by 2% to 3% for a 5 kL tank.
Table 5.
Reliability and water savings at Campbelltown, Hornsby and Richmond for a 5 kL rainwater tank for irrigation use for the driest, wettest and average years on record.
Table 5.
Reliability and water savings at Campbelltown, Hornsby and Richmond for a 5 kL rainwater tank for irrigation use for the driest, wettest and average years on record.
| Location | Driest year | Wettest year | Average year |
|---|
| Reliability (%) | Water savings (kL) | Reliability (%) | Water savings (kL) | Reliability (%) | Water savings (kL) |
|---|
| Campbelltown | 31 | 43 | 64 | 60 | 39 | 53 |
| Hornsby | 66 | 74 | 96 | 20 | 58 | 61 |
| Richmond | 31 | 37 | 83 | 54 | 74 | 37 |
Table 6.
Reliability and water savings at Campbelltown, Hornsby and Richmond for a 5kL rainwater tank for combined use for the driest, wettest and average years on record.
Table 6.
Reliability and water savings at Campbelltown, Hornsby and Richmond for a 5kL rainwater tank for combined use for the driest, wettest and average years on record.
| Location | Driest year | Wettest year | Average year |
|---|
| Reliability (%) | Water savings (kL) | Reliability (%) | Water savings (kL) | Reliability (%) | Water savings (kL) |
|---|
| Campbelltown | 29% | 46 | 63% | 73 | 39% | 60 |
| Hornsby | 63% | 82 | 95% | 51 | 56% | 68 |
| Richmond | 30% | 39 | 80% | 74 | 67% | 52 |
The impact of land size on the performance of a RWHS was investigated by increasing the block size from 450 m2 to 600 m2. For 600 m2 block size, the roof, lawn and impervious areas of 250 m2, 200 m2 and 150 m2, respectively, were considered. Here, there was a minor increase in the reliability and water-saving values for all the three types of water uses as compared to the case of total site area of 450 m2 (with a roof, lawn and impervious areas of 200 m2, 150 m2 and 100 m2, respectively). In general, for both the block sizes (450 m2 and 600 m2), for toilet and laundry use, the reliability in the case of 2 occupants reached 99% for a 5 kL tank; in the case of 4 occupants, reliability reached 99% for a 15 kL tank; and in the case of 6 occupants, it reached 99% for a 25 kL tank. This implies that as the number of occupants increases, a bigger tank is needed. However, it seems that one does not need a tank greater than 25 kL (for 6 occupants) in the peri-urban regions of Greater Sydney.

