Abstract
Stream water quality in areas of the western United States continues to be degraded by acid mine drainage (AMD), a legacy of hard-rock mining. The Rico-Argentine Mine in southwestern Colorado consists of complex multiple-level mine workings connected to a drainage tunnel discharging AMD to passive treatment ponds that discharge to the Dolores River. The mine workings are excavated into the hillslope on either side of a tributary stream with workings passing directly under the stream channel. There is a need to define hydrologic connections between surface water, groundwater, and mine workings to understand the source of both water and contaminants in the drainage tunnel discharge. Source identification will allow targeted remediation strategies to be developed. To identify hydrologic connections we employed a combination of natural and applied tracers including isotopes, ionic tracers, and fluorescent dyes. Stable water isotopes (δ18O/δD) show a well-mixed hydrological system, while tritium levels in mine waters indicate a fast flow-through system with mean residence times of years not decades or longer. Addition of multiple independent tracers indicated that water is traveling through mine workings with minimal obstructions. The results from a simultaneous salt and dye tracer application demonstrated that both tracer types can be successfully used in acidic mine water conditions.
1. Introduction
Acidic, metal-rich drainage from abandoned hard-rock mines can produce both acute and chronic environmental problems [1]. The legacy of past hard-rock mining in the United States includes more than 200,000 abandoned or inactive mines [2] with thousands of abandoned mines located near headwater regions of the Rocky Mountains of Colorado [3]. Watersheds in mineralized regions often receive drainage from a complex distribution of mine systems [4], which are gravity driven and often discharge at low points adjacent to surface waters. The combination of low pH and high concentrations of metals associated with the acid mine drainage (AMD) can then create severe toxicological effects on local and downstream aquatic ecosystems [5]. Traditionally, an end of the pipe (e.g., at the mine discharge point) treatment strategy has been employed to handle AMD prior to mixing with local surface waters. However, this strategy is very expensive and treatment must occur in perpetuity, which does not represent a permanent solution to the problem. A more recent approach to controlling AMD involves developing targeted remediation strategies that address the feasibility of actually reducing or shutting off the AMD at its source [1]. Targeted remediation can be thought of as a source and pathway control measure and may refer to the source of the acid producing minerals themselves, the source of the water that mobilizes contaminants, or both. In most mine settings it is impractical to isolate or remove the mineralized rock itself. Therefore, remediation efforts may be most successful when the source of water producing the AMD can be targeted and separated, isolated, or removed from the area of a mine most prone to AMD production.
A major challenge in using a targeted remediation approach to control AMD is that many hard-rock mine settings are located in mountainous areas of high mineralization that are commonly associated with fracturing and structurally deformed rocks. The result is high secondary porosity, which combined with the diverse spatial scales of man-made mining excavations, creates a highly complex hydrogeologic setting where water flow paths are particularly difficult to quantify [6]. Steep slopes and large amounts of snowfall add to the complexity of understanding the hydrology of these sites. In addition, many of the hard-rock mining sites in the Western U.S. have been abandoned for many decades leading to varying degrees of degradation to the originally engineered designs for mine drainage control. Information on the mine sites is often incomplete because mine maps may be unavailable, incomplete, or inaccurate. Therefore, the hydrologic connectivity of abandoned mines is often unknown or poorly understood. The complexities of flow paths in flooded mines are often comparable to flow paths found in karstic aquifers [7], where flow may be concentrated in subsurface conduits, making a Darcy’s law approach inapplicable for evaluation of subsurface flow regimes in flooded mines [8]. A reasonable approach to understanding the hydrology of these systems involves applying ground-water tracing techniques to abandoned mine sites that generate empirical data while measuring properties in-situ to minimize assumptions about hydrogeological conditions [9].
In recent years, surface water and groundwater tracing techniques have been used in a variety of complex hydrogeologic settings to aid in characterizing groundwater flow systems [10,11,12]. Tracers have been used in various combinations of natural tracers, injected tracers, and chemical perturbations to identify and quantify transport processes in mountain streams impacted by AMD [13,14,15]. Fluorescent dyes are often used as an applied tracer [16,17,18], with the use of fluorescent dye to trace groundwater dating back to at least 1877 when sodium fluorescein (uranine) was used to evaluate the connection between the Danube River and the Aach spring [19]. Fluorescent dyes are commonly chosen as applied tracers for groundwater studies in areas with low clay content, and recent studies have found dye tracers to work well in both karst and fractured crystalline rock settings [8]. However, the use of such dyes is problematic in AMD waters, because below a pH of 6 the sorptivity of uranine increases and its fluorescence intensity diminishes [20]; Smart and Laidlaw [16] demonstrated that the fluorescence of uranine can be reduced by as much as 50% below a pH of 5. An additional difficulty in dye tracer application in groundwater and mine systems is accurately quantifying the mixing reservoir. The reservoir represents all waters (mine pools and inflows of surface or groundwater) that the tracer could mix with between the injection point and the sampling point and will influence the mass of tracer applied in order to produce appropriate dye concentrations in collected samples [9]. If the mixing reservoir is overestimated then resulting dye concentrations may become toxic or exceed the dynamic range of the instruments, whereas an underestimated reservoir will result in low dye concentrations, possibly below analytical detection. Therefore, a multiple tracer approach is often recommended for complex hydrologic settings with limited access points and unknown flow-through times, especially when field-work time and logistical support are limited [9,21,22].
The Rico-Argentine Mine Site near Rico, Colorado (USA) provides an opportunity for the use of natural and applied tracers to understand the hydrological connectivity of a perturbed system where AMD is produced. The mine consists of multiple levels of underground workings that are interconnected by a series of tunnels that pass directly underneath a tributary creek, resulting in potential pathways for hydrologic connections between the mine and surface waters. Additionally, the mine complex is connected to a series of long drainage tunnels, which transport AMD from the mine to a discharge point adjacent to the Dolores River, a relatively pristine headwater ecosystem. At present, the AMD passively flows through a series of degraded water treatment ponds before entering the river.
The objective of this paper is to use multiple natural and applied tracers to quantitatively and qualitatively address the hydrologic connections between local inputs from precipitation, surface waters, and groundwater to interior mine workings, and resultant mine discharges. As recommended by Wolkersdorfer [9], the paper first highlights the use of synoptic and time series analyses of naturally occurring isotopic and geochemical tracers to develop a conceptual understanding of the hydrogeology of the mine system. Secondly, applied tracers (salts and fluorescent dyes) were introduced, either simultaneously or at separate discrete locations, to provide a comparative analysis of tracer approaches in an AMD setting. To expand on previous research by Naurath et al. [23], this study aims to further investigate the effectiveness of uranine as a tracer in acid mine waters by performing a dual tracer application with uranine and lithium salt.
The results of this study will help determine the feasibility of reducing the volume of water and/or the load of contaminants that discharge from the Rico-Argentine mine. Reducing the flow of water into and through the mine workings, reducing the mobilization of contaminants within the mine, and/or isolating high-concentration contaminant source water for limited smaller-scale treatment, may create alternative targeted remediation strategies for managing the AMD discharge that are not currently available.
2. Methods
2.1. Site Description
The historic Rico-Argentine mines are located in the San Juan Mountains of southwestern Colorado, USA (Figure 1a) and are situated along Silver Creek (Figure 1b), about 2.5 kilometers (km) northeast of the Town of Rico (Figure 1c). The mines were built to access sulfide replacement deposits associated with hydrothermal mineralization of faults in the Pennsylvania-age Hermosa formation. The mines were active from the 1860’s until the 1970’s with silver, zinc, and lead as the primary mining products. The mines consist of extensive underground mine workings in the ridge southeast of Silver Creek that were historically accessed by a number of entrances at and above the elevation of Silver Creek. There are also at least 7 levels (30 m of vertical separation between each) below the surface elevation of Silver Creek with historical maps indicating several levels of the mine tunnels pass directly under Silver Creek and connect to mine workings on the northwest of Silver Creek. The proximity of the mine workings adjacent to, and below, Silver Creek was hypothesized as supporting a possible hydrologic pathway (in either direction) between surface waters in the creek and the subsurface mine workings. The mine workings on the northwest side of Silver Creek are connected to the SE crosscut, which connects to the St. Louis Tunnel (Figure 1c). The crosscut and the St. Louis Tunnel extend approximately 2500 m from the mine workings to the portal adjacent to the Dolores River. The SE crosscut and the St. Louis Tunnel connect to the Rico-Argentine mine at the 500 Level (name is a reference to being about 500 ft (152 m) below Silver Creek) and were built primarily to de-water or drain the upper mine workings using gravity flow. Water with elevated levels of metals including zinc and cadmium currently discharge from the St. Louis Tunnel and flow through a series of passive treatment ponds, eventually entering the Dolores River from the pond system outfall (Figure 1b).
For safety reasons, mine access at the time of study was limited to just a few locations in the vicinity of Silver Creek. The first accessible tunnel on the southeast side of the creek was the Argentine Tunnel, located a few hundred feet upslope of the Blaine Tunnel (Figure 1b). The Argentine Tunnel was accessible for 183 m before becoming unsafe to access, at which point samples were collected from a stagnant mine pool. The mine pool was believed to have drained to lower level mine workings, as the water was not flowing out the tunnel to the surface. The second access point was the Blaine Tunnel, with a portal just 12 m from Silver Creek on the Southeast side. At the time of the study, water was flowing into the back of the Blaine tunnel, presumable as drainage from above workings (i.e., those accessed by the Argentine Tunnel), resulting in about 1 m of water on the tunnel floor behind a cofferdam located 244 m back from the tunnel portal. Water levels behind the cofferdam were relatively stable (fluctuated < 5 cm over a 6 week period) suggesting that inflows were proportionate to water movement out of the tunnel towards the lower level workings that went under Silver Creek. Samples were collected in the Blaine tunnel from both the inflow and the pooled water behind the cofferdam.
The third access point was a short tunnel on the northwest side of Silver Creek, directly across Silver Creek from the Blaine portal, which accessed the vertical 517 Shaft approximately 50 m from the portal along Silver Creek. Historical mine maps indicated that the 517 Shaft extended vertically to at least the 500 level and that several of the tunnels under Silver Creek intersected the shaft at multiple levels (Figure 1d). The water level in the 517 Shaft was approximately 146 m below the elevation of the shaft collar, which corresponds to the elevation of the SE Crosscut and St. Louis Tunnel. Water samples were collected from the shaft using a bailer and mechanical pulley system located at the collar. The final access point to sample mine water was the St. Louis Tunnel portal. The portal had collapsed preventing underground access so samples were collected at first emergence from the collapse.
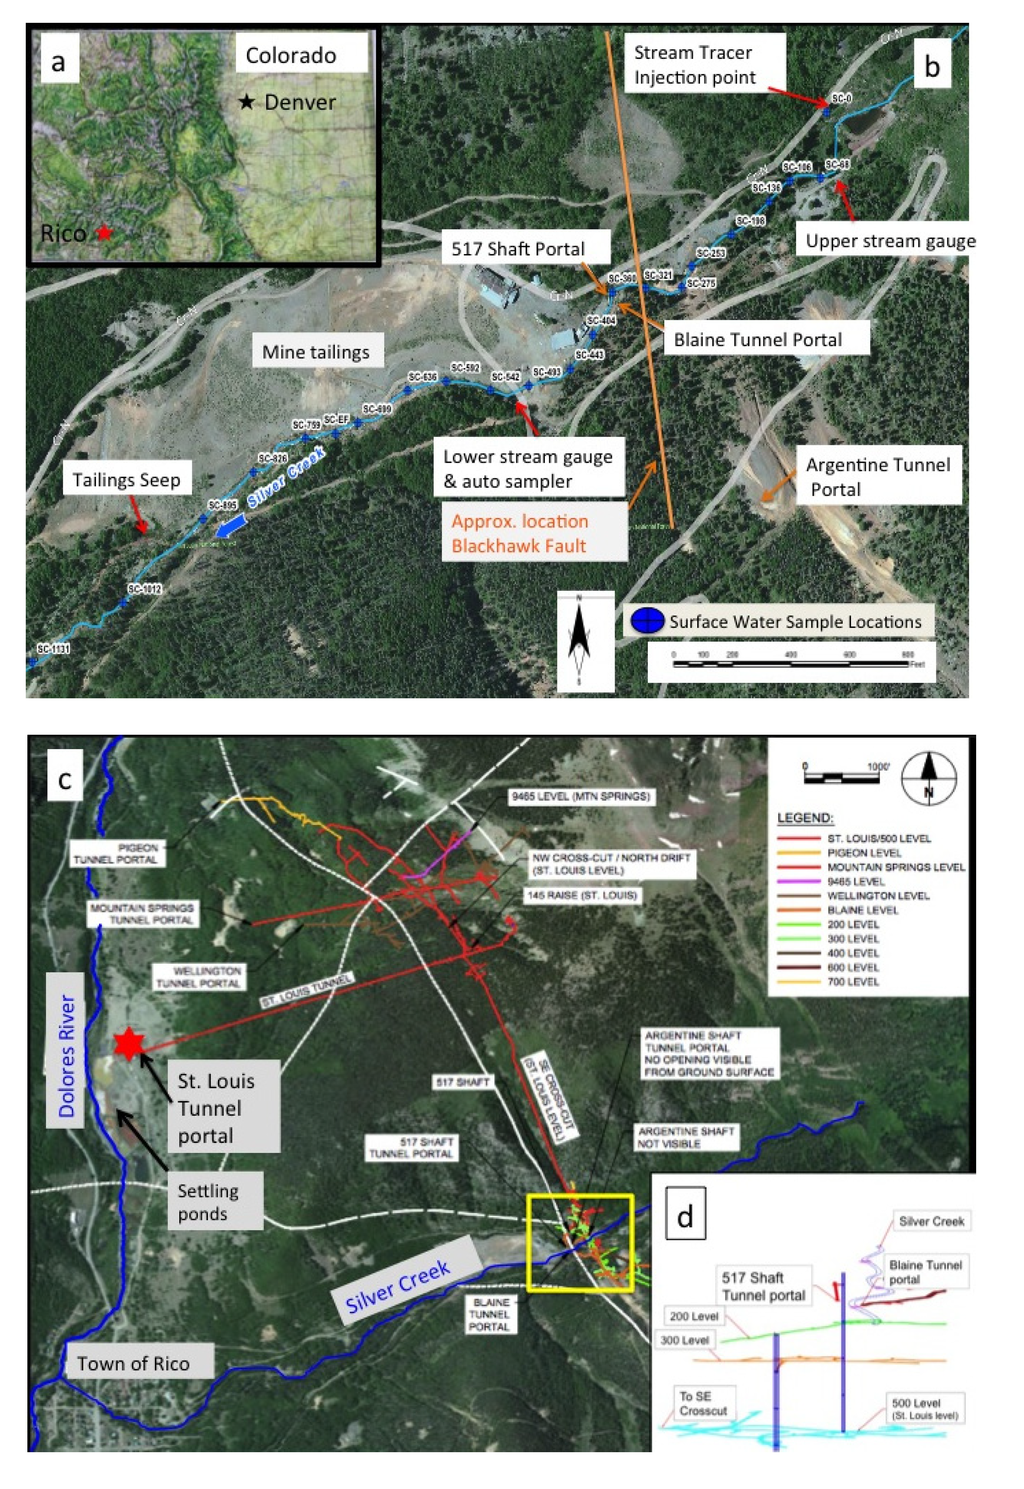
Figure 1.
(a) Map of State of Colorado with location of Town of Rico located in the San Juan Mountains of southwestern Colorado; (b) Site map of Rico-Argentine mine complex and Silver Creek. Silver Creek sampling location numbers refer to the distance downstream (m) from the tracer injection point; (c) Overview map of entire Rico-Argentine mine complex in relation to the Town of Rico and the Dolores River. Yellow box shows location of mine complex and represents extent of figure 1b. Location and extent of the subsurface workings are overlain on top of aerial imagery to demonstrate how mine workings near Silver Creek are connected to the St. Louis Portal; (d) Vertical view of mine workings in relation to Silver Creek and access points. The 200 and 300 levels pass directly under Silver Creek.
2.2. Study Design
The study was designed to understand the hydrologic connections between surface water, groundwater, and mine water associated with the Rico-Argentine mine. The tracer study was performed in October 2011, when surface water flows were at low-flow conditions, to try and minimize event based influences (rain and snowmelt) on the prevailing hydrologic conditions. Much of the southwestern USA, including the San Juan Mountains, can be characterized by bimodal precipitation patterns, i.e., spring snowmelt and summer monsoon rains [24]. Previous mine drainage studies in the region have demonstrated that consistent low-flow conditions are most attainable in late summer (August–October) after monsoon rains have subsided and prior to freezing conditions during the winter months [15,25,26]. To quantitatively and qualitatively assess individual components of the hydrologic system, a series of independent environmental and applied tracers were applied and/or sampled at discrete locations within the study area. All tracers used in the study are summarized in Table 1.
To broadly understand how inputs to the system (precipitation) contribute to the surface and mine waters, the naturally occurring stable (δ18O/δD) and radioactive (3H) water isotopes were measured in precipitation and at all other sampling locations. The stable isotopes provide information on source water contributions whereas the radioactive isotopes provide insight on mean residence time of waters in the mine system. The second objective of the study was to determine if Silver Creek is losing water to the mine workings. Silver Creek flow was measured using several different measurement techniques to evaluate the presence, magnitude, and timing of stream flows on Silver Creek around the area of the Rico-Argentine mine. Additionally, the mine waters (517 Shaft and St. Louis Tunnel) and mine tailings seep were analyzed for detection of tracers used in Silver Creek to look for direct hydrologic connections between the creek and the mine waters. The third objective was to determine the hydrologic connection between the Blaine tunnel mine water and mine water in the 517 Shaft. The approach was a slug injection (Table 1) into the Blaine tunnel mine pool and sampling for the breakthrough of that tracer in the 517 Shaft. The surface water in Silver Creek was concurrently monitored for Blaine tunnel tracer to check for movement of Blaine mine water towards surface flows. Finally, the study addressed the hydrologic connection between the mine water in the 517 Shaft and mine water discharging from the St. Louis Tunnel. The approach involved simultaneous slug additions of two independent tracers (Lithium salt and uranine dye; Table 1) in the 517 Shaft, which were analyzed for in samples continuously collected at the St. Louis Tunnel portal. A dual tracer approach was chosen at this location to have unique data sets to compare tracer functionality in an AMD setting.

Table 1.
Summary of natural and applied tracers including the amount of tracer used and the application method. Silver Creek locations are marked in Figure 1b. Detection limits for stable isotopes reported as twice the precision. (TU, tritium units)
| Tracer | Amount of tracer applied | Detection Limit | Type of Application; Location; Date | Sampling Location; Date | Objective |
|---|---|---|---|---|---|
| Oxygen (18O) | NA | 0.056 (‰) | Natural, Local Precipitation, 2011 | All | Source water identification |
| Deuterium (2H) | NA | 0.296 (‰) | Natural, Local Precipitation, 2011 | All | Source water identification |
| Tritium (3H) | NA | 0.3 (TU) | Natural, Local Precipitation, 2011 | All | Source water identification; water apparent age |
| Sulfate (SO4−) | NA | 0.0022 (mg/L) | Naturally occurring in mine impacted waters | Silver Creek (0–1131 m) | Hydrologic connectivity;mine water ↔ surface water |
| Sodium Bromide (NaBr) | 75 kg NaBr | 0.0031 (mg/L) | Constant injection (from 189 L reservoir); Silver Creek (0); 5 October to 7 October 2011 | Silver Creek (0–1131 m) | Identify changes in streamflow |
| Lithium (LiOH) | 9 kg LiOH | 0.0108 (mg/L) | Slug injection (227 L); 517 Shaft; 4 October 2011 | St. Louis Tunnel portal; 4 October to 16 November 2011 | Hydrologic connectivity; mine → drainage tunnel |
| Sodium Fluoride(NaF) | 6 kg NaF | 0.0057 (mg/L) | Slug injection (30 L); Blaine Tunnel; 5 October 2011 | 517 Shaft; 5 October to 6 November 2011 | Hydrologic connectivity; mine ↔ mine |
| Sodium Chloride (NaCl) | 1.4 Kg NaCl per slug | 0.0017 (mg/L) | Slug injections (8 L); Silver Creek (0,198,220, 384, 493,530); 3 October to 7 October 2011 | Silver Creek (106, 321, 493, 636);3 October to 7 October 2011 | Estimate streamflow above and below mine workings |
| Rhodamine WT (liquid) | 1.2 L | 0.006 (ppb) | Constant injection (from 189 L reservoir); Silver Creek (0); 5 October to 7 October 2011 | Silver Creek (443), Tailings Seep, 517 Shaft; 4 October to 11 November 2011 | Hydrologic connectivity; Silver Creek ↔ mine, tailings seep |
| Uranine (Sodium Fluorescein) | 13.63 kg | 0.002 (ppb) | Slug injection (227 L);517 Shaft; 4 October 2011 | St. Louis Tunnel Portal;4 October to 11 November 2011 | Hydrologic connectivity; mine → drainage tunnel |
2.3. Natural Tracers and Synoptic Sampling
Representative water samples were collected from along the study reach on Silver Creek, from the St. Louis Tunnel portal, and from the Dolores River above and below the mine treatment ponds. Prior to any disturbance from tracer applications, additional samples were collected from all mine locations described above and from a seep below the mine tailings pile along Silver Creek to establish background conditions (Figure 1b). Local snow and rain precipitation were analyzed for isotopes to characterize sources and timing of inputs to local surface water, groundwater, and mine water. The snow was a depth integrated sample collected adjacent to the mine complex in April 2011 to represent maximum snow accumulation prior to the study while rain samples were collected as weekly composites from five rain gauges located in the San Juan Mountains (within 50 km radius). Surface water and mine water samples were collected at several different times between April and October 2011 to examine both short-term (i.e., daily) and seasonal variations at different locations. All samples were analyzed for water isotopes including oxygen-18 (18O), deuterium (2H or D), and tritium (3H). Water samples were also analyzed for total and dissolved metals and solute chemistry to identify and distinguish the many contributions to metal load in Silver Creek and the St. Louis tunnel.
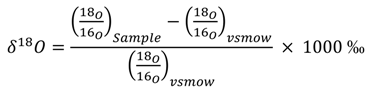
Water samples for D and 18O analysis were collected unfiltered in clean 25-mL borosilicate bottles with no-headspace lids to avoid any evaporation or fractionation. The D and 18O analyses were performed at the Kiowa Environmental Chemistry Laboratory in Boulder, Colorado, using an Picarro L1102-i Isotopic Liquid Wavelength- Scanned Cavity Ring Down Spectroscopy (WS-CRDS), a time-based measurement using near-infrared laser to quantify spectral features of molecules in a gas ratio of the sample to the Vienna Standard Mean Ocean Water (V-SMOW) standard, as shown for 18O:
The 1−σprecision of δ18O was ± 0.028 ‰ and of D was ± 0.148 ‰.
Water samples to be analyzed for tritium were collected as grab samples in high-density polyethylene (HDPE) bottles and stored at 4°C until analysis. The tritium samples were analyzed at the USGS Tritium Laboratory in Menlo Park, California, by electrolytic enrichment and Liquid Scintillation Counting. Distilled sample water was reduced electrolytically in electrolysis cells to 10 mL from an initial 200 mL in a cooling bath. The detection limit is reported as twice the precision. Tritium results reported in tritium units (TU) where 1 TU = 1 tritium atom per 1018 hydrogen atoms.
Water samples collected during synoptic sampling from along the study reach on Silver Creek, within the mine workings, and at the St. Louis Tunnel portal were analyzed for total and dissolved metals, select anions, and hardness. Onsite processing included filtration and measurement of pH. Filtration was completed using 0.45 μm capsule filters. Aliquots for cation analysis were acidified to pH < 2.5 with ultrapure nitric acid. Total recoverable and dissolved cation concentrations were determined from unfiltered and filtered samples, respectively (dissolved is used herein as an operational definition that refers to the concentration of the water after filtration; some colloidal material may pass through the 0.45 μm filter). Samples were analyzed at the U.S. EPA Region 8 Laboratory operated by the Environmental Sampling Assistance Team (ESAT) contractor for total and dissolved metals analysis using EPA 200 Series methods, for anions using EPA Method 300, and hardness was calculated using EPA method 2340B.
During synoptic sampling a subset of each unfiltered sample was also sent for chemical analysis to the Kiowa Environmental Chemistry Laboratory in Boulder, Colorado, where samples were immediately filtered through pre-combusted glass fiber filters with a nominal pore size of 0.7 μm and stored in the dark at 4 °C prior to analyses. Samples were analyzed for chloride (Cl−), nitrate (NO3−), sulfate (SO42−), bromide (Br−), and fluoride (F−), using a Metrohm 761 Compact Ion Chromatograph. The within run precision (%RSD) was < 1.1% for all solutes. Lithium (Li+) was analyzed on a Perkin Elmer AAnalyst 200 Atomic Absorption Spectrometer with a within run precision of 1.06%.
2.4. Applied Tracers
The usefulness of applied tracer test results is highly dependent on proper test design (particularly determination of injection and sampling locations), the nature of the tracer, the ability to detect the tracer at low concentrations, and correct interpretation of recovery data [9,18,27,28]. Results from initial synoptic sampling (in May and June 2011), along with background information on the mine complex design and local geology, were used to develop a basic understanding of the hydrogeologic setting allowing for design of the applied tracer study which was performed in October 2011. Additionally, due to the hypothesis that the entire system under investigation was hydrologically connected the study was designed to ensure that all applied tracers were distinctly and independently measureable from each other in the event that mixing of tracers occurred. A previous dye tracer study was conducted by Davis [29] at a separate mine site (the Atlantic Cable mine) in Rico, Colorado, at the confluence of Silver Creek and the Dolores River, approximately 2.5 km downstream from the Rico-Argentine mine complex (Figure 1). The results of the Davis [29] study indicated that water chemistry (metals analysis) alone was inconclusive with respect to identifying and separating mine waters from local surface waters. The study was also unsuccessful at identifying surface water and mine water interactions using Sulpho-Rhodamine B dye tracer (no dye was observed at any of the sampling points around the mine site) and suggested that Rhodamine WT (RWT) may be a more effective tracer for future mine water studies in the area. These results further support the use of a multiple, natural and applied tracer approach to better understand surface water and mine water interactions in the current study of the Rico-Argentine Mine.
2.4.1. Tracer Selection and Application
In the state of Colorado, the use of surface water or groundwater tracers at permitted mining sites must be approved by the state mining regulatory agency, which is the Division of Reclamation, Mining, and Safety (DRMS) [30]. The study was performed under the authority of the U.S. EPA Superfund Technical Assessment and Response Team and the DRMS, whom both approved the experimental design and provided technical assistance and oversight throughout the course of the study. All applied tracers were chosen based on suggestions from literature reviews and based on analytical capabilities and on the ability to safely use at concentrations that are distinguishable above background signals. Tracer amounts were determined following guidelines presented in Wolkersdorfer [9]. For all applied tracers the minimum detection limit (Table 1) was considered along with measured background concentrations and estimated mixing reservoir size (anticipated dilution) to ensure the tracer concentrations would be clearly identifiable at the sampling point.
There were six tracers used in the study (Table 1) including 4 salts and 2 fluorescent dyes. Tracers applied to surface waters (Silver Creek) included sodium bromide (NaBr) and sodium chloride (NaCl), which were applied to quantify streamflow and are described in further detail in Section 2.5. Additionally, the fluorescent dye Rhodamine WT (RWT; CI Acid Red 388; CAS 37299-86-8; Keystone Analine Corporation # 703-010-27, Chicago, IL, USA) was applied to Silver Creek concurrently with the continuous injection of NaBr to provide a dye that could be sampled for concurrently with the NaBr at several mine sampling points. The RWT was used because it is one of the most commonly recommended dye tracers for surface water application [18] and was recommended for future use by a previous study performed at a nearby mine interacting with Silver Creek [29]. Although RWT has been reported to have some genotoxic properties [16,18,31], the dye was found to exhibit ecological toxicity at concentrations greater than 1 milligram per liter (mg/L; 1000 parts per billion (ppb)) and human toxicity at concentrations greater than 100 mg/L (100,000 ppb) [8]. Therefore, the RWT was applied to the stream at low concentrations (<30 ppb) that were detectable but created minimal visible disturbance and remained well below concentrations of concern. The continuous injection ran from 5 October to 8 October with two rounds of synoptic sampling for bromide occurring on 5 and 7 October. Samples were also collected from the mine Tailings seep and 517 Shaft and analyzed for bromide and RWT to test for presence of Silver Creek water in the in mine workings or associated tailings pile.
The remaining 3 tracers were applied as slugs directly into mine waters with sodium fluoride (NaF) applied to the Blaine tunnel mine pool whereas lithium (as LiOH) and uranine (Uranine; C.I. Acid Yellow 73; CAS 6417-85-2; Keystone Analine Corporation 801-073042 Chicago, IL, USA) were applied concurrently to the mine pool at the bottom of the 517 shaft. The ability to easily sample and accurately quantify discharge at the St. Louis Tunnel portal motivated the application of multiple tracers at this location. By calculating the mass recovery of independent tracers the effectiveness of each tracer could be addressed. The lithium tracer was chosen because of low background signal in the mine water and because several of the other most common salt tracers (NaCl, NaBr, and NaF) had been used in the study. Uranine was chosen as the second tracer because it has long been used as a subsurface tracer due to low sorptive properties [16,32,33,34,35] and for being safe in terms of human or ecological toxicity [8,18,31]. Uranine also readily undergoes photo-degradation [16], but has shown long-term stability when not affected by sunlight [30], making it most suited for subsurface tracing. Uranine has only negative functional groups, and sorbs least onto negatively-charged media and most onto positively charged surfaces [35]. Mine waters often contain metal cations, especially iron (Fe), which can precipitate as hydroxides at higher pH values [36]. Uranine may therefore undergo adsorption onto iron hydroxides and be removed from the sample through filtration [36]. Conversely, if the collected mine samples are not filtered then fluorescence intensity may be overestimated due to scattering effects caused by increased sample turbidity. Results from the dual tracer application will therefore enable this potential complication to be addressed.
On 4 October at 12:00, a 189-L slug containing 9 kg of LiOH and 13.63 kg of uranine was injected into the 517 Shaft. The size of the mine pool (mixing reservoir) at the bottom of the 517 Shaft was unknown due to inaccessibility to the flooded lower levels of the mine. Therefore, the necessary mass of tracer was estimated using the flow rate at the St. Louis Tunnel portal (assumed mine pool discharge point), the distance between injection and sampling location, and by assuming a reasonable estimated mine water flow velocity. Additionally, background concentrations of lithium were low (0.025 mg/L) and background fluorescence in the wavelengths used to detect uranine were below detection (<0.002 ppb) at the St. Louis Tunnel portal confirming minimal background interference with tracer detection. The estimated velocity (and mass) was verified based on the authors’ experience with a similar tracer test at another mine site drainage tunnel with similar distance between injection and sampling points [37]. Additionally, the mine outflow at the St. Louis Tunnel portal flowed directly into a series of passive settling ponds and not into natural waters, which eliminated concerns for high concentrations of tracers (from over estimating tracer mass) rapidly entering local surface waters in the event of incomplete mixing of the tracer slug. The slug was mixed using acidic water (pH 2.7) from the Blaine Tunnel to simulate the water found at the bottom of the 517 Shaft (pH 2.5). The slug was mixed in two new, clean 115-L plastic tubs located adjacent to the top of the shaft and then siphoned from the tubs into the shaft using 137 m of new, clean garden hose. To avoid tracer contamination all materials used to transport and mix the tracers (including applicators clothing) were left at the injection site. The slug injection took approximately 45 minutes to complete and was then chased by approximately 189,000 L of water from Silver Creek delivered by a high capacity water pump over a 30-min period.
On 5 October at 14:15, a slug containing 6 kg of NaF was added to the Blaine Tunnel mine pool behind the cofferdam. The tracer mass was estimated based on the size of the mixing reservoir at injection and sampling points (Blaine tunnel mine pool and 517 Shaft mine pool), and information on background levels of fluoride at the injection point. The tracer mass was sufficient to increase F− concentrations to approximately three times background (from 50.2 to 143.1 mg/L) in the Blaine Tunnel. The tracer recovery point (517 Shaft) had F− background of only 1.95 mg/L. The slug was made by dissolving NaF powder into 30 L of Blaine Tunnel water using two 20-L buckets and a stirring rod made the slug. The NaF solution was slowly poured in the mine pool about 8 m behind the cofferdam. The mine pool had an estimated minimum volume of 42,500 L, but the inflow/outflow rates were not quantifiable. After the slug injection, a 7.6 cm diaphragm water pump was used to move water from the mine pool over a visible tunnel collapse (pile of rock and debris) and toward a drainage stope that extended to the lower mine levels that intersect with the 517 Shaft. The pump was able to move between 22,700 and 36,300 liters of water past the initial visible collapse in the first 2 h after injection. However, during that period no reduction in water level was observed in the mine pool and pumping was then terminated due to freezing of equipment and unsteady pump rates, so it was not possible to calculate the rate at which the entire mine pool (containing the fluoride slug) was moved past the initial blockage.
The exact pathway of the water (and tracer) leaving the Blaine Tunnel pool is unknown, but based on existing maps it was expected that water flows down a complex series of interconnected inclines, raises, winzes, stopes, tunnels, and shafts before reaching the 500 level via the 517 Shaft. Given the myriad of potential pathways, all in varying states of structural integrity, it was difficult to determine the actual distance the water and tracers would travel. Using all available information is was estimated that the shortest possible pathway from the Blaine Tunnel mine pool to the bottom of the 517 Shaft was 200 m.
2.4.2. Tracer Sampling and Analysis
Automated samplers were placed at 3 locations; SC-493, the mine Tailings seep, and the St. Louis Tunnel portal (Figure 1). The samplers in Silver Creek and at the mine Tailings seep collected samples at 1-h intervals for the duration of the constant injection of tracers in Silver Creek and then at 4-h intervals for 3 weeks following tracer application. At the St. Louis Tunnel portal water samples were collected at 1-h intervals for the first 40 h, starting 2 h before the 517 Shaft tracer injections. A Cyclops 7 field fluorometer from Turner Designs, Inc. (Sunnyvale, CA, USA), confirmed that the peak of the uranine slug occurred within the first 36 h, so sample collection was reduced to 4-h intervals on 7 October and continued for 6 weeks.
At the 517 Shaft, water samples were collected at a depth of 7.6 m below the water surface, which was 137 m below the collar of the shaft. Samples were collected manually using a stainless steel bailer lowered to the same depth for each sample using a calibrated cable reel and motorized pulley system. Samples were collected at 1-h intervals for the first 36 h after tracer injections were made in the Blaine Tunnel and then daily for 2 weeks. The last sample was collected in the 517 Shaft 690 h after tracer was injected in the Blaine Tunnel.
To provide real time confirmation of tracer emergence, the Cyclops-7 field fluorometer from Turner Designs Inc. was used to make in-situ field measurements for the presence of the two fluorescent dyes, RWT and uranine. The field fluorometer was calibrated for both dyes using a 4-point calibration with standards of 0, 1, 100, and 400 ppb solutions. The standards were prepared in the laboratory by diluting the purchased dye concentrates using water collected directly from the mine site at locations where the dyes were to be applied or measured. The RWT was mixed using water from Silver Creek (pH 8.2) and the uranine was mixed using water from the St. Louis Tunnel portal (pH 7.4). The manufacturer stated that the instrument’s dynamic range for detection of uranine dye was 0 to 500 ppb so calibration from 0 to 400 ppb was considered sufficient for the intended use of the field fluorometer. The field fluorometer was used to qualitatively provide a rapid assessment of samples for presence/absence of the dye of interest to constrain the number of field samples that would be sent to the laboratory for analysis. At the Kiowa Laboratory, a Fluoromax 2 (F2) spectrophotometer was used to analyze water samples for the concentrations of the two fluorescent dyes. The presence of each dye was analyzed using a single excitation and a single emission value and a record of the spectrum for a 100 ppb standard for both dyes was created to determine the appropriate excitation/emission values to use for analyzing the dye tracers. The RWT dye was run with 550/580 nm excitation/emission and the uranine was run with 492/512 nm excitation/emission. The excitation and emission values for both dyes were within the expected variability [19] of values previously reported for fluorescence analysis of these dyes [8,18,23]. For RWT, a 5-point calibration curve was developed using standards between 1 and 400 ppb concentration. For uranine, a 12-point calibration curve was developed with concentrations ranging from 1 to 1000 ppb. Dye concentrations were plotted against emissions values to generate calibration curves. Interestingly, for the uranine, F2 emissions peaked with the 500 ppb standard and then became inversely related to concentrations over 500 ppb. As reported in Käss [19] the intensity of the fluorescence likely decreased as a consequence of its individual light absorption and due to retrograde dissociation. To compensate for the decrease in emissions for high concentration samples, the standard power calibration curve (dye concentration in ppb (C) = 10−13 × E2.1558; where E = measured emission (nm); R2 = 0.99, N = 6) was used to calculate dye concentrations in samples with concentrations < 500 ppb and a second linear equation (dye concentration in ppb (C) = −10−4 × E + 2948; where E = measured emission (nm); R2 = 0.9, N = 6) was used to estimate dye concentrations in samples with concentrations > 500 ppb. The inflection point of 500 ppb was chosen from visual interpretation of emission/concentration plot. Additionally, when the standard curve was applied to all F2 emission results there was a false double peak in calculated uranine concentrations in the St. Louis Tunnel samples. Fortunately, the sample with the lowest uranine concentration (between the 2 false peaks) had the highest measured concentration of lithium (the second concurrently applied tracer) confirming a simultaneous arrival of the peak concentration of both tracers. The two false peaks were also at concentrations just below 500 ppb, further confirming that at concentrations over 500 ppb the F2 was unable to accurately quantify the amount of fluorescing compounds in the sample.
The fluorescence intensity of dyes is known to have a variable response to changes in pH [16,18,20,21,23,29,34,35]. To test for the effects of acidification on fluorescence, high concentration (400 ppb) standards of both uranine and RWT were acidified to a pH of 2.5 for 24 h and then filtered. The result was a 77% reduction in uranine emissions and an 11% reduction in RWT emissions. The reduction in uranine fluorescence agrees with previous research documenting considerable decrease in fluorescence intensity (up to 90% at pH 3) due to reversible ion exchange reactions caused by the acidic conditions [16,18,21]. However, as reported by Käss [18], the pH effects were reversible; when the standards were re-neutralized to the slightly alkaline conditions of the original standards (pH 8.2 and 7.4 for RWT and uranine, respectively) there was full recovery of the dye fluorescence emissions for both uranine and RWT. Although the uranine dye reaches maximum fluorescence under alkaline conditions (pH ≥ 9) [16,18,23], the dye standards (for calibration and pH response measurements) were made with the actual mine water at the sampling location, so the above mentioned results should be representative of the range of pH the dye will be exposed to in the study.
2.5. Measuring Streamflow and Mine Discharge
There are many challenges to measuring streamflow in mountains including bed surface roughness, difficult to constrain channel dimensions, and steep stream gradients with varying degrees of hyporheic zone storage [38,39]. Furthermore, Marchand et al. [40] suggest that conventional current meter measurements of discharge do not properly account for hydraulic conditions commonly found in high-gradient, shallow streams of mountain catchments. Therefore a number of streamflow measurement techniques were used to determine the magnitude and timing of flows in Silver Creek, and to evaluate potential flow losses from Silver Creek to mine workings underlying and on either side of the creek. The measurements would also identify any major inflows to Silver Creek in the vicinity of the mine. Quantification of streamflow was performed during both high flow (spring snowmelt) and low flow (fall base flow) to understand stream dynamics across the full range of the hydrograph. For this paper, only the low flow discharge will be discussed in detail, as applied tracer studies were performed during base flow.
Silver Creek flow was measured at two locations: an existing rectangular concrete weir structure with attached gauge house located upstream of the Blackhawk fault and mine workings (SC-68; Figure 1b), and at the downstream side of a road culvert just below the mine workings (SC-493; Figure 1b). Stage-discharge relationships (rating curves) were developed by correlating data from pressure transducers (stage) with discharge measurements made using an electromagnetic flow meter. Pressure transducers recorded stage every 15 min from June to August and October to November and discharge measurements were collected periodically to capture the full range of the stream hydrograph. Pressure transducers were removed in August to prevent vandalism and were re-installed in the same locations prior to the start of tracer tests in October.
Slug additions of sodium chloride (NaCl) were made to develop point estimates of streamflow at select locations above and below the mine workings along Silver Creek. Transport of the slug to a downstream observation point was monitored by a portable sonde that recorded specific conductance at 4-s intervals. Several grab samples were collected from the stream during slug tests and analyzed for Cl− concentrations, which were matched with corresponding observations of specific conductance to develop a chloride-specific conductance relationship. The relationship was then used to convert the observed increases in specific conductance to chloride concentrations with the resultant profiles integrated to provide estimates of streamflow (Q, L/s) (1) following Kilpatrick and Cobb [41]:
 where C is the mass of Cl added (in kg) (C = 0.59 × mass of NaCl) and V is the time integral of the Cl concentration (above background) at the monitoring site. The units of V are (mg/L) per second. The third approach for quantifying streamflow in Silver Creek consisted of a continuous sodium bromide (NaBr) injection to provide streamflow estimates via the tracer dilution method [41] and document any potential areas of flow loss. Once the bromide tracer concentration reached a plateau synoptic sampling provided a spatial snapshot of bromide concentration and was used to determine a flow regime. In gaining streams, dilution of bromide with respect to distance is indicative of increased streamflow. Losing or constant flow streams, in contrast, will exhibit steady bromide concentrations with distance, as water leaving the stream does not affect the in-stream concentration.
Discharge was also measured at the St. Louis tunnel portal. Flow was directed through a 9-inch (22.86 cm) Parshall flume and stage heights were measured at 3 mm resolution at 15-min intervals with an ultrasonic automated water level detector that was installed on 12 May 2011. Flow estimates (L/s) were then determined using the flume’s standardized stage-discharge relationship. Due to limited access to the interior portions of the mine, flow could not be directly measured along tracer flow paths in the mine workings.
3. Results and Discussion
3.1. Silver Creek: Streamflow and Hydrologic Connectivity to Mine
The multiple techniques used to quantify Silver Creek streamflow across the study site found that flow varied between 19.8 and 56.6 L/s during the October tracer study. Unfortunately, the high gradient mountain stream combined with unsteady streamflow (caused by two small precipitation events) produced unavoidable challenges in accurately quantifying streamflow. During the study period the discharge records from stage-discharge relationships at SC-68 (above the mine) and SC-493 (below the mine) produced “cross-over” where the largest instantaneous flow was at the upstream location during some periods of the study and at the downstream location at other times. Therefore, the two locations of measured discharge alone were inconclusive on determining if Silver Creek was only gaining or only losing water as it moved past the mine complex, and suggest that both inflows and outflows may be occurring within the study reach. The slug addition techniques also produced varying results ranging from 7% to 29% loss across the study reach during the sampling event with loss rates being smaller after precipitation events. The precipitation events likely masked some of the streamflow losses by adding small but influential surface water inflows along the study reach. The constantly injected RWT and Br− tracers were analyzed by two separate synoptic sampling events, both following precipitation events, and the Br− profiles on both sweeps suggested a gaining stream at the upstream end of the study reach (above the mine workings) and the potential for flow loss downstream of the mine workings between SC-542 and SC-759. To summarize, Silver Creek likely has some net flow loss along the study reach but high gradient stream channel and the precipitation events made it difficult to accurately quantify streamflow variations during the study period.
Concurrent with the continuous injection of Br− and RWT, the 517 Shaft and the mine Tailing seep were sampled for the presence of the injected tracers to identify if water leaving Silver Creek (as identified by discharge calculations) was interacting with the mine system or Tailings pile on the northern side of the creek. The Br and RWT tracers injected into Silver Creek were not detected at elevated concentrations in the mine workings or discharges from the Tailings seep and St. Louis Tunnel portal. At the seep Br− concentrations remained below detection (<0.003 mg/L) for the duration of the sampling. There was no detectable increase in RWT concentrations, which remained below detection (0.006 ppb) throughout the sampling period. In the 517 Shaft, background concentrations of Br (0.046, σ = 0.037 mg/L) were detected both before and during the tracer study, but concentrations remained at background levels with no evidence of an increase or breakthrough slug emerging at the 517 Shaft. There was no detection of RWT before or during the tracer study.
The results fail to confirm a hydrologic connection from Silver Creek to the Tailings seep or the mine workings directly connected with the 517 Shaft. However, results prevent positive confirmation or rejection of minor flows from Silver Creek through the mine to the 517 Shaft during low-flow conditions. One logistical constraint in the tracer design was that the RWT concentrations in Silver Creek were maintained at very low concentrations (range 16 to 28 ppb) to avoid any potential negative (toxicological or visual) impacts. Additionally, the in-stream Br− concentrations were kept at a measureable but conservative concentration (4.73, σ = 0.7 mg/L) to ensure that there were no potentially toxic effects to aquatic life. The low concentrations of stream tracers, combined with the large volumes of mine waters, made it unlikely for the tracers to be detected, especially if additional dilutions from ground water were considered. A second challenge to identifying stream tracers in the mine, was that the length of the sampling window. Tracer recovery sampling in the mine was limited by personnel availability and seasonal access, which only continued for approximately 30 days after the tracer injections. Therefore tracers may not have arrived at the sampling locations during the sampling window. Third, it is possible that some Silver Creek water (containing the applied tracers) reached the subsurface mine workings but underwent dilution from mixing with other groundwater or mine water prior to arrival at the sampling point, causing dilution to background concentrations. The use of low concentrations of tracers in Silver Creek to minimize adverse environmental impacts was likely the ultimate limiting factor preventing positive confirmation or rejection of hydrologic connection between Silver Creek and the sampled mine water locations.
3.2. Natural Tracers
3.2.1. Water Quality
Water quality varied widely across all sampling sites, with the highest concentration of contaminants generally associated with the mine pools and lowest concentrations in Silver Creek and the St. Louis Tunnel portal. The pH of samples ranged from a high of 8.7 (± 0.19 (1SD), N = 17) in Silver Creek to a low of 2.38 (± 0.06 (1SD), N = 5) in the Blaine Tunnel mine pool (Figure 2). Dissolved aluminum and zinc concentrations were highest in the mine workings to the southeast of Silver Creek and decreased prior to exiting the St. Louis Tunnel portal. Aluminum ranged from a high concentration of 654 mg/L in the Argentine Tunnel to less than 0.1 mg/L at the St. Louis Tunnel portal (Figure 3). Similarly, zinc concentrations were highest in the Argentine Tunnel pool at 24,600 mg/L and decreased to 3.8 mg/L at the St. Louis Tunnel portal. Solute loading analysis was not performed as flow rates from the Argentine Tunnel, Blaine Tunnel, and 517 Shaft mine sites were not measured during the study.
During the tracer experiment water quality along Silver Creek was synoptically sampled at the same locations as were used for the stream tracer study (Figure 1b). Sulfate (SO42−), generally considered a conservative tracer in AMD settings [27], was measured at all sampling points and showed a measureable increase from under 10 mg/L above SC-198 to over 50 mg/L at SC-1131 the furthest downstream sampling point (Figure 4). Dissolved zinc concentrations were measured at nine of the sampling points and increased from under 0.005 mg/L upstream of the mines to 570 mg/L at SC-1131. Both sulfate and zinc concentrations had the largest increases in the 200 m upstream of the mine entrances (at approximately 400 m) and then remained relatively constant until increasing again beyond 800 m.
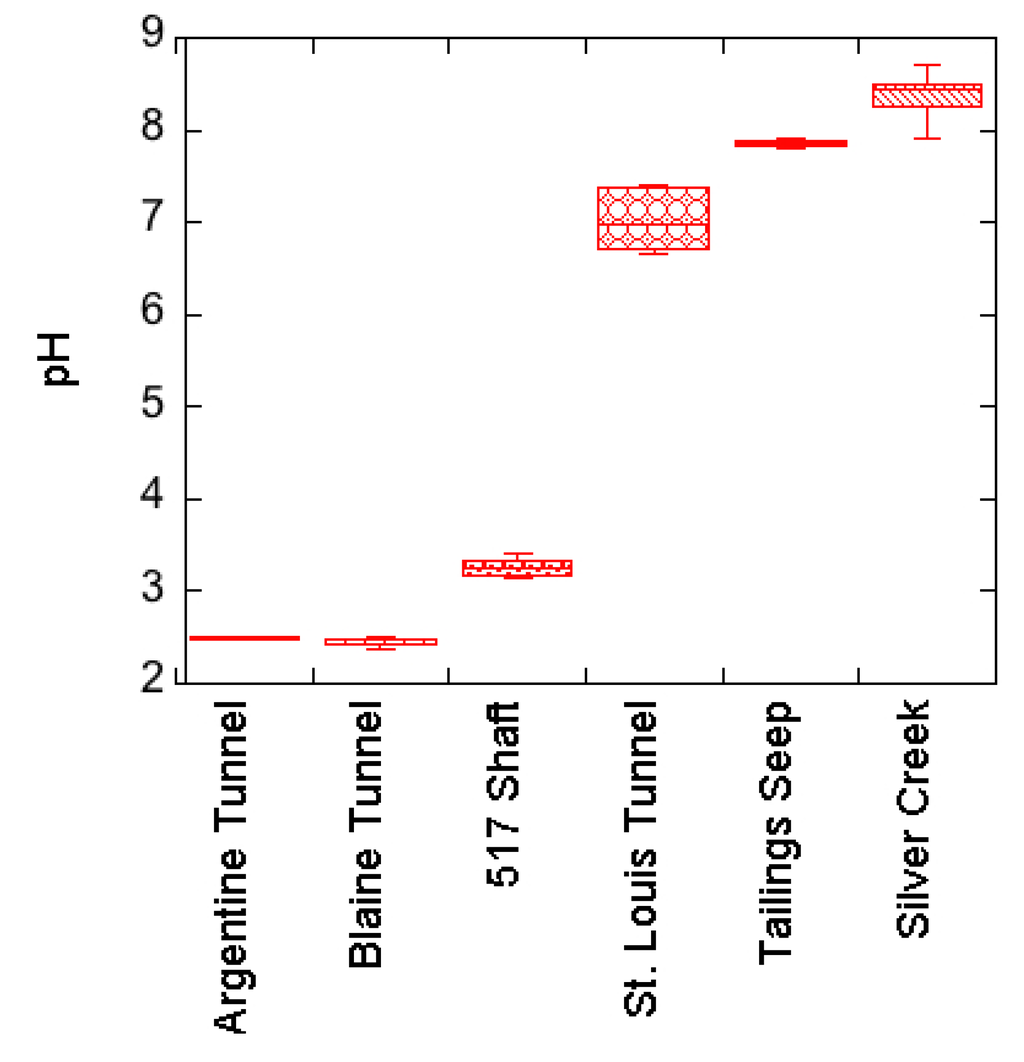
Figure 2.
Box plot of pH in the mine workings along with that of the St. Louis Tunnel portal and tailings seep discharges and of surface waters in Silver Creek.
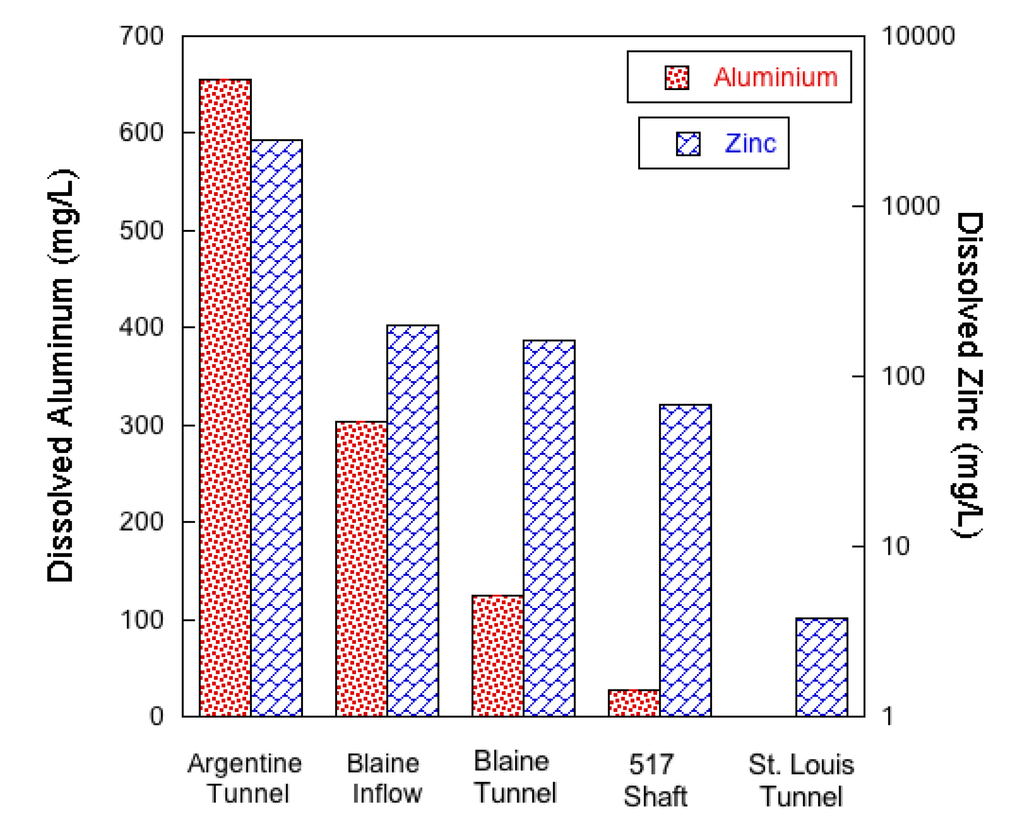
Figure 3.
Dissolved zinc and total dissolved aluminum concentrations in mine workings. The mine workings are listed from left to right in the direction of hydrologic flow towards the discharge point at the St. Louis Tunnel portal.
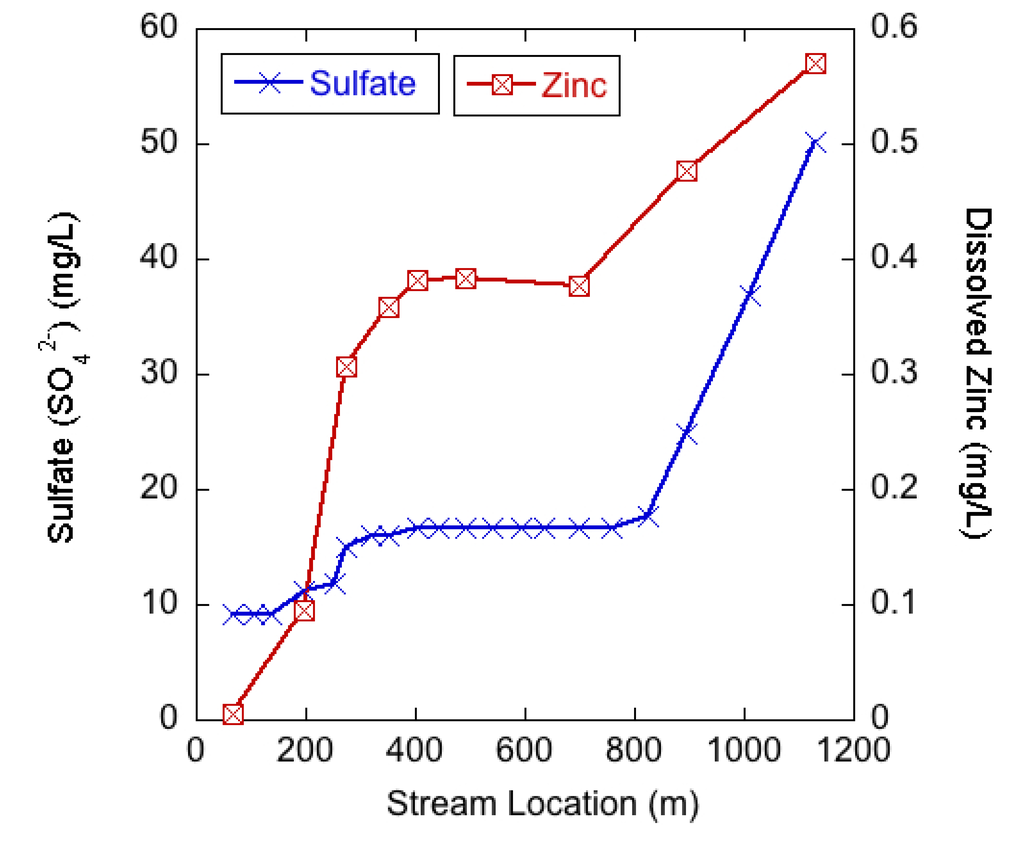
Figure 4.
Sulfate and dissolved zinc concentrations in Silver Creek from synoptic sampling during base flow conditions on 7 October 2011. Stream locations are in m downstream from the location of the stream tracer injections with the stream crossing the mine workings at approximately 400 m. There are known inflows to Silver Creek from seepage below the mine tailings entering between SC-895 and SC-1131 in Figure 1.
Silver Creek chemistry suggests that mining activities impact Silver Creek and the sources of AMD products (sulfate and zinc) are occurring in similar locations. The sulfate and mining-associated metal concentrations begin to increase in Silver Creek in the vicinity of the Rico-Argentine mines and indicate that even though there is a potential net loss of flow in the reach, there may be small inputs of mine water or other inflows that influence the stream chemistry. The first considerable increases in stream solutes occur between 200 and 300 m, which is upstream of the primary mine entrances (Figure 1b), but within the area of historical mining operations. Due to mining activities, there are considerable amounts of mine debris (mill tailings and mine waste rock) scattered along the banks of the stream channel starting at approximately 100 m (Figure 1b). Given the variable discharge (gains and losses) measured along the study reach it is likely that the Silver Creek waters are undergoing hyporheic zone mixing in areas where solute laden mine wastes are present. As a result, contaminated sediments in the hyporheic zone may be representing a long-lasting supply of contaminants to hyporheic pore water [42]. A second source of solutes is slow percolation of highly concentrated AMD water in the Blaine Tunnel mine pool into the subsurface and eventual movement towards the stream channel, which would likely occur at or just downstream of the Blaine Tunnel portal between 350 and 400 m. The relatively consistent solute concentrations between 400 and 700 m is likely because previous mine cleanup work at this site included capping the mine tailing pile (Figure 1) and reinforcing the bank between the tailings pile and Silver Creek to reduce erosion of the tailings pile into Silver Creek. As a result, the amount of surface water and hyporheic zone mixing may be decreasing along this segment creating less opportunity for mining-associated sulfate and zinc to enter Silver Creek. The increase in AMD contaminants to Silver Creek at locations below the mine entrances (below SC-826) are likely from diffuse inflows from the tailings pile seep which are visually present between SC-895 and SC-1131 in Figure 1.
The results in Figure 3 and Figure 4 therefore suggest that, when excluding the contributions from the large mine tailings pile, the sulfide deposits sourcing the AMD may be most prevalent in the mine workings and shallow subsurface on the southeastern side of Silver Creek between 200 and 400 m. As suggested by Nordstrom [6] this shallow acidic groundwater can then be mobilized by infiltration of meteoric waters, resulting in movement towards surface waters (or further into the mine complex). To elaborate, the high metals concentrations found in the mine waters to the southeast of Silver Creek may be partially explained by the mines artificial lowering of the local water table. The mine drainage tunnels were built to help dewater the mine workings but as a consequence the mine workings also exposed large amounts of sulfide minerals to air, which increased oxidation reactions. Therefore, the combined exposure to air and water (from seasonal meteoric infiltration and shallow groundwater flow) in the mine workings adjacent to, and above, Silver Creek has created an ideal situation for AMD production that is impacting the water quality in Silver Creek and at the St. Louis Tunnel.
3.2.2. Isotopes
Stable isotope results from all samples including precipitation, surface water, and mine water were plotted as the δD–δ18O relationship (Figure 5A). The δ18O value for snow of approximately −20‰ and the mean rain value of −5‰ are characteristic values for the Colorado Rocky Mountains for winter and summer precipitation [43]. Empirical results have shown that δD/δ18O values in precipitation co-vary and are generally described by the relationship [44]:
which is defined as the Global Meteoric Water Line (GMWL). The Local Meteoric Water line (LMWL) has a similar slope and y-intercept:
δD = 8δ18
δD = 7.8δ18
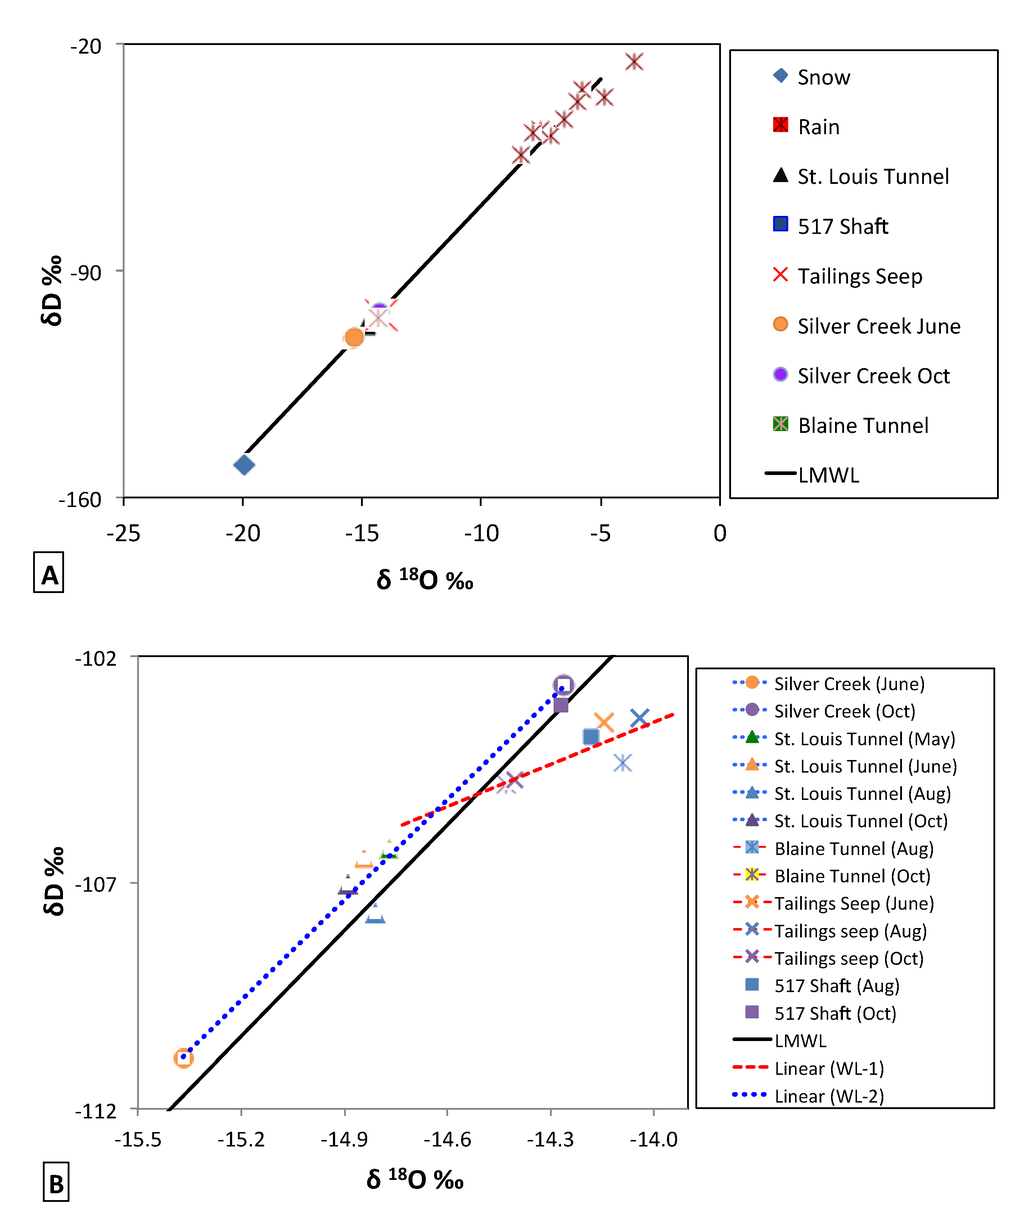
Figure 5.
(A) Plot of δ18O vs. δD for precipitation, surface waters, and mine waters. The St. Louis Tunnel, 517 shaft, Blaine tunnel, Tailings seep, and Silver Creek are the arithmetic mean from all samples collected. The Local Meteoric Water Line (LMWL) is plotted in black; (B) Seasonal variations of δ18O vs. δD for surface waters and mine waters in 2011. The LMWL is plotted with a second water line (WL1; red dash), representing samples from the Tailings seep and the Blaine Tunnel and a third water line (WL2; blue dot) representing samples from Silver Creek and the St. Louis Tunnel. The symbol shapes correspond to similar sites in (A) and (B), while colors represent similar dates for different sites in (B).
The similar values in slope between the LMWL (7.8) and the GWML (8.0) suggest an absence of complex kinetic fractionation processes affecting the δD–δ18O relationship of precipitation (inputs) in the local hydrologic system [45]. All surface water and mine water samples fell on a mixing line between the snow and rain inputs, suggesting that they were a mixture of the two precipitation types with δ18O values between −14‰ and −15‰.
To better observe the variations in surface waters and subsurface waters (relative to the LMWL) the δD–δ18O relationship was examined at a finer resolution (Figure 5B). The isotopic concentration of Silver Creek had the greatest seasonal variation with waters more depleted in δD and δ18O in June as a result of snow melt and more enriched in δD and δ18O in October from summer rains and/or groundwater contributions. All of the samples collected in or near the mine (Tailings seep, Blaine Tunnel, 517 Shaft) had an isotopic composition similar to Silver Creek in October, indicating that stream water during baseflow was of similar origin to the water moving through both the upper mine and the seep. Additionally, there was little variation in isotopic signature of the Tailings seep, which did not follow variations observed in Silver Creek, indicating that water exiting the Tailings seep was coming from a well-mixed source distinct from Silver Creek waters. However, the samples from the Tailings seep and the Blaine Tunnel all plot below the LMWL with a decreased slope and y-intercept:
δD = 3.1δ18
This linear relationship is represented by WL-1 in figure 5b and the decreased slope suggests that an evaporation trend occurred at these locations since recharge [45,46]. Conversely, samples from the St. Louis Tunnel and Silver Creek express the following δD–δ18O relationship:
δD = 7.4δ18
The linear relationship is represented by WL-2 in figure 5B, and the similar slope between WL-2 (7.4) and LMWL (7.8) again suggests an absence of fractionation processes affecting those water sources since meteoric recharge. The two samples from the 517 Shaft plot close to, and slightly below, the LWML indicative of a mixture of predominantly unfractionated waters (since recharge) with a lesser amount of fractionated waters (i.e., from the Blaine Tunnel). These results therefore suggest that the waters with evidence of evaporation (Tailings seep and Blaine Tunnel) are distinct from local precipitation (LMWL), surface water (Silver Creek), and the dominant source of water exiting the mine system (St. Louis Tunnel).
Figure 5B also indicates that the water discharging from the St. Louis Tunnel had similar isotopic concentration in May, June, and October, indicating the water was also predominantly from a well-mixed groundwater source with limited seasonal variation. The St. Louis Tunnel samples were also consistently more depleted than the samples from the 517 Shaft and Blaine Tunnel, indicating that water flowing downgradient from the 517 Shaft was mixing with water that has a distinctly different isotopic signature (more depleted) before emerging at the portal.
The stable isotope analysis provides initial insight into the hydrologic connectivity of the system, but due to the limited range (magnitude) of isotopic variability across all sites, is insufficient as a stand-alone tool for identifying the sources and relative contributions of water contributing to the AMD.
Tritium values from 21 rain and snow samples collected in the San Juan Mountain region between January 2010 and October of 2011 had a mean value of 6.2 TU with the 25th and 75th percentiles of samples being 4.6 and 6.5 TU respectively (Figure 6). The narrow range of tritium in incoming precipitation provided a strong estimate of the current meteoric inputs of tritium to the local hydrologic system under investigation. For comparison the annual mean tritium concentration in precipitation in Colorado was only 7.5 TU in 1999 [37], suggesting that tritium levels in meteoric waters have only decreased by about 1 TU in the decade preceding the current study. The tritium data provide insight as to the mean residence time of “old” versus “new” groundwater in the study. Tritium (t1/2 = 12.43 years) is naturally present only in minute quantities but was produced in large quantities during thermonuclear weapons testing from 1952 to 1963 [47]. As a consequence, without consideration for complex mixing scenarios, water with a tritium value <1 TU may be considered “old” water recharged prior to 1952 while higher values would represent “new” water being wholly or partially recharged since 1952. Additionally, if a tritium concentration is greater than the current meteoric recharge it can be considered to have some portion of water that precipitated with a “bomb spike” signal in the decades following weapons testing. No samples had <1 TU while all mine water and surface water tritium concentrations were near or within the range of recent precipitation suggesting that those waters were derived predominantly from recent (within a few years) meteoric recharge. The Argentine Tunnel sample, along with the Silver Creek and the Dolores River samples, had slightly elevated tritium concentrations relative to the current (2010–2011) meteoric inputs, suggesting that the water in those locations may have had slightly longer mean residence times than the waters emerging at the Tailings seep and moving through the mine to the St. Louis Tunnel. The tritium results provide only a qualitative estimate of water residence times, but suggest that the mean residence times of the mine waters are not distinctly different from residence times of the local and regional surface waters.
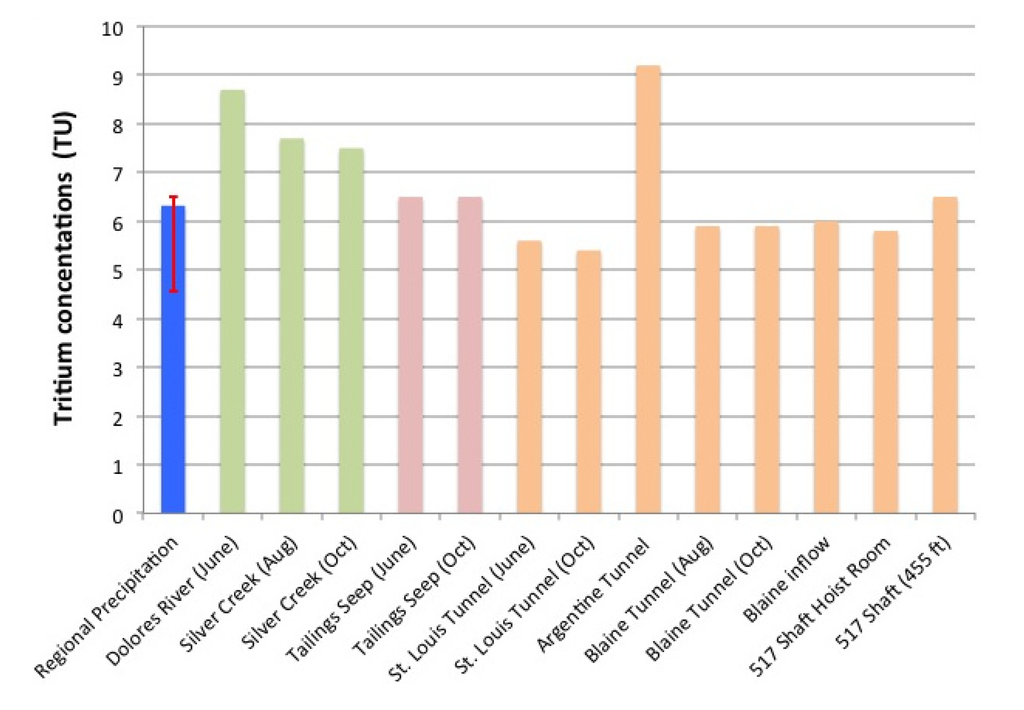
Figure 6.
Tritium (3H) values from recent (2010–2011) regional precipitation (blue), surface waters (green and pink), and mine waters (orange). The blue precipitation bar represents the mean value of all samples while the red error bar represents the 25th and 75th percentiles.
3.3. Applied Tracers
3.3.1. Blaine Tunnel to 517 Shaft
The first hydrologic connection to be investigated with applied tracers was the movement of water from the Blaine Tunnel to the 517 Shaft and the interior mine workings. There was no practical way to quantify the volume of water entering the 517 Shaft from the Blaine Tunnel area, thus quantification of tracer mass recovery was not possible. Additionally, it was estimated that only between 50% and 85% of the mine pool water (containing the fluoride tracer slug) was successfully pumped over the first debris blockage towards the drainage stope exiting the Blaine Tunnel making it unclear what percentage of the initial tracer was moved out of the Blaine Tunnel mine pool via pumping. However, positive detection of the tracer provided a qualitative assessment of hydrologic connectivity between the Blaine Tunnel and the 517 Shaft area of the mine. Figure 7 displays a time series plot of fluoride and chloride concentrations in the 517 Shaft starting on 5 October at 14:00 when the fluoride slug was added to the Blaine Tunnel behind the cofferdam. Chloride concentrations remained relatively steady (2.11, σ = 0.08 mg/L) over the first 48 h, indicating that the changes in fluoride concentrations were occurring independently from any changes in the mine water chemistry caused by previous hydrological alterations such as the water chase applied to the 517 Shaft during the uranine/lithium tracer application. Interestingly, the chloride concentrations did decrease to a mean of 1.78 (σ = 0.05) mg/L for approximately 96 h (approximately hour 48 to 144 in Figure 7), which corresponds to the period when the highest fluoride concentrations were measured in the 517 Shaft. Given that background chloride concentration was lower in the Blaine Tunnel (1.54 mg/L) than in the 517 Shaft (2.14 mg/L) it is reasonable to suggest that the Blaine Tunnel water (which was partially moved out of the Blaine Tunnel by pumping) arrived at the 517 Shaft at an increased rate relative to background flow rates creating increases and decreases in fluoride and chloride concentrations respectively.
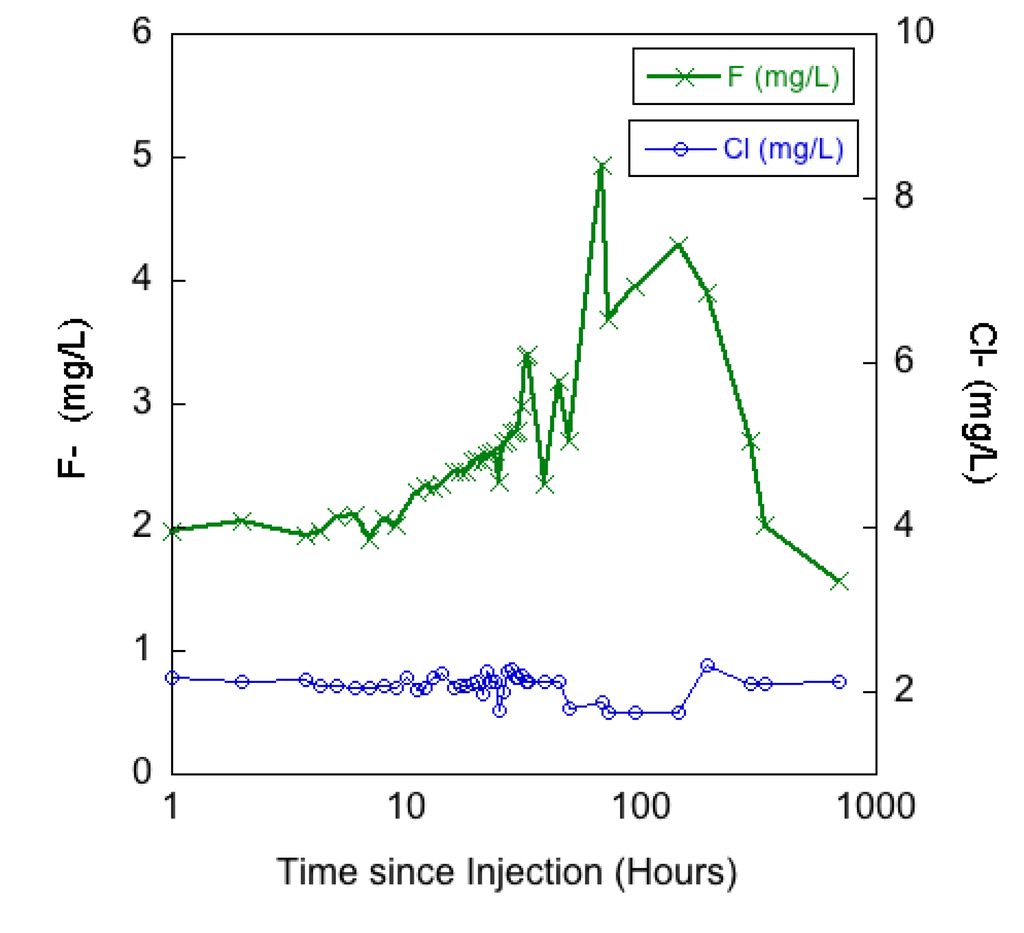
Figure 7.
Fluoride (F−) concentrations measured in the 517 Shaft. Background chloride (Cl−) concentrations are plotted over the same time period. Time (x-axis) plotted as log scale.
The initial fluoride concentration in the 517 Shaft (1.95 mg/L) indicated that there was a measureable background presence of fluoride in the system. However, the fluoride concentrations began to show a steady increase above background concentrations beginning 10 h after injection, and more than doubled to reach a peak concentration of 4.94 (mg/L) 68 h after the slug injection. The fluoride concentration then began to fall sharply approximately 8 days after the tracer injection. Given an approximate minimum distance from the Blaine Tunnel cofferdam to the base of the 517 Shaft of 200 m, the velocity of the advection front (maximal velocity) was 0.34 m/min while the average velocity of the peak fluoride concentration was just 0.05 m/min. When compared to results reported by Wolkersdorfer [9], the average velocity is considerably slower than the range of 0.3 to 1.6 m/min reported as 95% confidence interval of 42 tracer tests. From a qualitative standpoint the results suggest that the hydrologic flow paths between the Blaine Tunnel and 517 Shaft may have major obstructions and/or the water is moving slower than has been most commonly observed in previously studied mine water environments. Additionally, there is diffusion in the system because there was not a distinct breakthrough curve. One anticipated possibility is one or several obstructions at points along the tunnel/stopes that causes the water to interact with rock and sediment. The collapsed portion of the adit over which water was pumped immediately after tracer injection is one likely obstruction. As mentioned in the methods, the tracer recovery at the 517 Shaft was achieved by sampling from a mine pool of unknown volume and flow-through rates. Additionally, the precise volume and rate of water moved out of the Blaine Tunnel mine pool (injection point) was not quantified due to pumping inefficiencies and unsafe access to drainage points. The flow path of the tracer between the Blaine Tunnel and the 517 Shaft was also likely diverse (multiple interconnected tunnels, stopes, and inclines present) making quantification of tracer travel distance difficult. Therefore the tracer breakthrough rates should be considered in a qualitative manner and no quantitative transport model (e.g., [9,18,27]) was used to evaluate solute transport and dispersion.
During the Blaine Tunnel tracer injection, water samples were also collected from SC-493 (about 120 m downstream from the Blaine Tunnel adit, Figure 1b) to determine if a detectable amount of water was flowing from the Blaine Tunnel, through the subsurface, to Silver Creek. The fluoride concentrations at SC-443 after the Blaine tunnel injection remained relatively steady (0.104, σ = 0.018 mg/L) with intermittent but not sustained increases, which neither confirms nor rejects the hypothesis that water contained in the Blaine Tunnel may be directly entering Silver Creek in the vicinity of the portal.
The original tracer design included pairing a third fluorescent dye (PTSA; 1,3,6,8-Pyrenetetrasulfonic Acid Tretrasodium salt; CAS # 59592-10-0) with the fluoride salt tracer applied to the Blaine tunnel. This dye tracer has a fluorescence emission peak that is distinct from both uranine and RWT so it could be used in a multiple tracer situation when tracer mixing is possible. Additionally, the Cyclops 7 field fluorometer from Turner Designs has a submersible sensor specifically designed for detection of PTSA. However, knowing that there were potentially multiple blockages (rock collapses in-filled with sediments or AMD derived precipitates) the dye tracer was not used and thus still available for additional future studies. This is important because if a tracer is used and full recovery cannot be confirmed then that tracer would not be desirable for future use in the same location for reasons of cross contamination.
3.3.2. 517 Shaft to St. Louis Tunnel Portal
The arrival time for both uranine and lithium at the St. Louis Tunnel portal was at 03:00 on 5 October, 15 h after injection (Figure 8). After arrival, the concentration of both tracers increased rapidly with uranine reaching a peak concentration of 2900 ppb at 08:00, and the lithium tracer reaching a peak concentration of 0.258 mg/L at 09:00 on 5 October, representing 20 and 21 h to peak concentration, respectively. There was no clear increase in discharge as a result of the water chase (189,000 L in 30 min ≈ 105 L/s) added to the 517 Shaft immediately following tracer injections. The fast times for the advection front of the tracer movement from the 517 Shaft to the St. Louis Tunnel portal suggest that in general the tunnel has few obstructions and water moves through it relatively quickly as channel flow.
Figure 8 also displays field fluorometer data, which confirms the timing of tracer arrival and subsequent rapid increase in uranine concentration. Unfortunately, the upper limit of calibration for the field fluorometer was 400 ppb for this experiment so the instrument was unable to record the peak concentrations of the tracer breakthrough. The field instrument was then able to pick up the recession limb of the uranine slug. The general performance of the instrument was quantified by determining that the instrument tracked the laboratory analyses well, though with a near linear 45% reduction in concentration (r2 = 0.99) when sample concentrations were below 400 ppb. According to the information provided by the manufacturer of the field fluorometer, the uranine probe was designed to analyze samples using excitation/emission values of 485/540 nm, which is shifted from the 492/512 nm values used for laboratory analysis. Therefore the field fluorometer may have failed to accurately capture the uranine fluorescence peak, resulting in consistently lower measured concentrations of uranine dye in the St. Louis Tunnel samples.
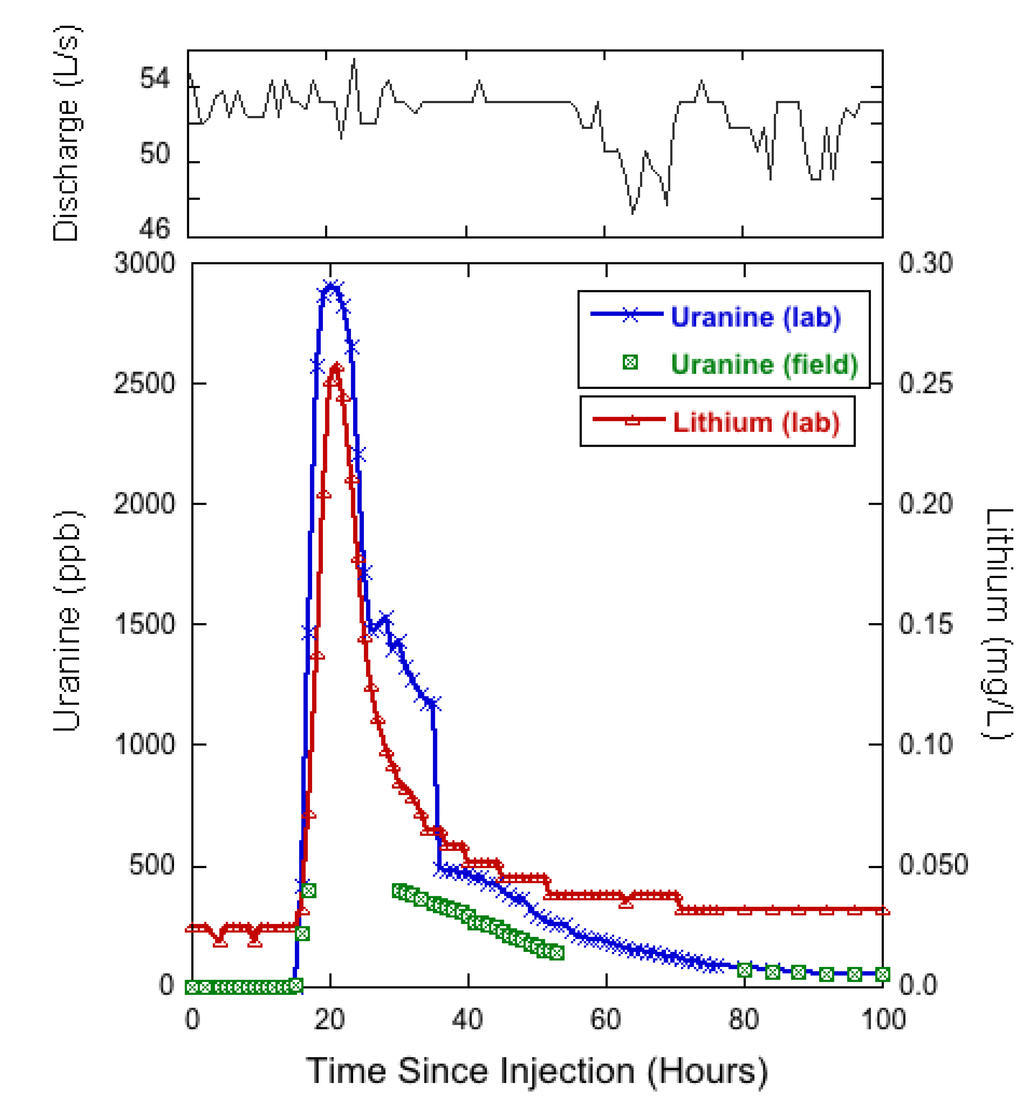
Figure 8.
Time series of hourly discharge (top) and tracer break through curves (bottom) for lithium and uranine at the St. Louis Tunnel portal. Time 0 represents 12:00 on 4 October.
Given an estimated tunnel distance of 2591 m between the 517 Shaft and the St. Louis Tunnel portal, the average velocity of the advection front (maximal flow velocity) was 2.87 m/min while the mean velocity of the lithium and uranine peaks were 2.16 m/min and 2.06 m/min, respectively. Although time elapsed between tracer injection and passage of maximal-concentration provides a good approximation of the mean velocity, it is recognized that the true effective flow velocity occurs after the passage of maximal-concentration and cannot be calculated from the breakthrough curve alone [18]. However, when a steep and narrow breakthrough curve occurs, as observed in Figure 8, the correct time for calculating effective flow velocity is only insignificantly larger than the time of passage of maximal-concentration and the difference can be practically neglected [18]. Therefore, the approximated effective flow velocity was used, and when compared to results presented by Wolkersdorfer [9] the effective flow velocity is considerably faster than the range of 0.3 to 1.6 m/min reported as 95% confidence interval of 42 mine tracer tests. The results suggest this system differs from those reviewed by Wolkersdorfer [9], or that the water chase applied behind tracer injection may have artificially increased the velocity of tracers as they moved from the 517 Shaft towards the St. Louis Tunnel. Interestingly, the discharge at the St. Louis Tunnel portal did not show a clear increase or pulse in discharge upon tracer arrival (Figure 8). Hourly mean discharges between 01:00 and 24:00 on 5 October (the breakthrough period) fluctuated between 51 L/s and 54 L/s relative to the mean of 52 L/s (σ = 26 L/s) over the first 100 h of tracer recovery. As a result, the artificial influence of the water chase on tracer velocity was not directly quantifiable, making the estimated effective flow velocity a qualitative estimate and influencing the decision not to use an established model for solute transport simulation.
The final sample, collected 6 weeks after the tracer injection, showed that lithium concentrations had returned to background levels (approximately 0.025 mg/L) while uranine concentrations were still slightly elevated (≈1.8 ppb) relative to background (<0.002 ppb). The results indicate that 6 weeks after the tracer injection the lithium tracer was no longer moving though the system at concentrations greater than background, while the fluorescent dye tracer was still arriving at the portal in detectable quantities. However, as of the last discharge measurement on 16 November, cumulative flow and concentration data were used to calculate 74% and 109% recovery of lithium and uranine respectively. This result conflicts the final instantaneous concentrations by suggesting that all of the uranine was recovered while some of the lithium remained in the mine workings, either through sorption or ending up in an immobile fluid region that was disconnected from the main discharge conduit. Assuming the mine waters flow through a karst-like conduit system, the immobile fluid regions could be conceptually described as resulting from vortices and eddies produced by conduit surface irregularities [48].
Given that the St. Louis Tunnel discharge (Figure 8) showed considerable albeit irregular fluctuations (min/max hourly discharges were 42.3 and 57.7 L/s) over the 6-week tracer recovery period, it is reasonable to suggest that short-term variations in measured discharge may have created uncertainty in quantifying tracer recovery. For short projects, such as this study, uncertainties in cumulative flow can be upwards of 14% in a low gradient flow system if conditions are non-ideal [49]. The St. Louis tunnel discharge was measured directly downstream from the collapsed adit, with flow emerging though piles of mine timber and debris before being channelized and directed through a flume for quantification. There was no way to completely eliminate turbulence in the flow prior to reaching the flume, which resulted in continuous small scale (≈1–2 cm) water surface undulations representing 5%–10% variability in total depth of flow at the flume. The variability in depth likely created uncertainties in calculated flow and in the quantification of tracer recovery. Additionally, there is inherent difficulty in calculating mass recovery of a fluorescent dye because the analytical results are an indirect measurement of the dye itself. Variable dye concentrations produce different intensities of fluorescence, which is then converted back to a mass of dye based on calibration curves that do not have perfect fit with standards. Therefore a reasonable degree of error should be expected when calculating mass recovery and results from this experiment are likely within that range. Given that uranine concentrations remained slightly elevated at the end of the study period, it was not possible to have recovered the entire tracer mass. Uranine concentrations on the final day of sampling suggested that discharge from the St. Louis Tunnel portal was only producing approximately 8.16 g of uranine per day, only 0.08% (per day) of the total mass of tracer added.
A second major concern with interpreting fluorescent dye results in a mine tracer study was the effect of low pH waters on the fluorescence properties of the dyes. The results of laboratory acidification tests (described in methods) agreed with previous work [16,18,21,23] by showing that the uranine dye had its fluorescence (spectral signature) reduced when exposed to low pH waters. However, results from the laboratory investigation showed that uranine fluorescence recovered when acidic conditions were re-neutralized to the pH values observed in samples collected at the St. Louis Tunnel portal (pH 7.34), which were likely maintained by reversible ion exchange reactions [18,23]. The study results therefore support previous recommendations from Naurath et al. [23] that uranine can be successfully used in mine tracer studies when samples analyzed for tracer recovery are alkaline.
A final consideration for uranine recovery was the influence of mine water iron (Fe) concentrations. The total recoverable Fe was approximately 66 mg/L in the 517 Shaft and only 4 mg/L at the St. Louis Tunnel portal during the study indicating that a significant portion of the iron precipitated as iron hydroxides between the uranine tracer injection and recovery locations. The Fe hydroxides can negatively influence uranine recovery rates due to dye adsorption on the hydroxide surfaces and subsequent loss by filtration [36] or settling of precipitates into immobile fluid regions of the conduit. All of the samples were filtered prior to fluorescence analysis to eliminate any fluorescence intensity overestimates due to increased turbidity in the sample. However, Naurath et al. [23] reported that good recovery can be expected in mine waters up to 100 mg/L of Fe, so it is concluded that the Fe levels in the mine waters emerging at the St. Louis Tunnel portal were not high enough to interfere with uranine results, as supported by the high recovery amounts reported previously.
3.4. The St. Louis Tunnel Portal Discharge
Mean daily discharge at the St. Louis Tunnel portal from May to November 2011 ranged from 36 to 57 L/s with the peak discharge occurring on 21 September (Figure 9). Daily discharge from the St. Louis Tunnel portal is plotted with the daily flows in Silver Creek at the downstream stream gauge site (SC-493, Figure 1). Although the Silver Creek discharge record does not begin until 17 June, it is clear that the discharge record depicts a typical snowmelt hydrograph for Silver Creek with discharge peaking in late spring (May or June) and returning to near base flow in August. For comparison, the discharge of the Dolores River at Rico (USGS station 09165000) [50] had a similar snowmelt hydrograph for 2011 with peak discharge occurring on 7 June, just 10 days before the discharge record began on Silver Creek. However, at the St. Louis Tunnel portal, there is no characteristic snowmelt pulse in the discharge. Rather, the hydrograph there has a more consistent flow over time, with peak discharge occurring more than 3 months after peak discharge was recorded in the local surface waters. This observation could be explained by a regional groundwater pulse signal, which suggests that a large portion of the St. Louis Tunnel discharge is coming from or driven by a more regional (i.e., watershed aquifer scale) groundwater reservoir.
The increase in pH and subsequent decrease in dissolved metals concentrations between the mine workings and the St. Louis Tunnel portal also suggest dilution and perhaps titration of acidity by non-AMD groundwater between the locations. The pH and metals concentrations support the notion of increasing dilution as mine waters move downgradient from the Argentine Tunnel (above the Blaine) to the Blaine Tunnel to the 517 Shaft to the St. Louis Tunnel portal, suggesting that the workings to the south of Silver Creek may be the primary source of AMD and that mine water at the 500 level becomes diluted as it moves northeast towards the SE crosscut and the St. Louis Tunnel.
Figure 9.
Mean daily discharge from the St. Louis Tunnel portal and from Silver Creek. Silver Creek discharge was not measured between 27 August and 3 October 2011 as pressure transducers had been removed from the gauging stations during this period.
Dilution along the drainage tunnels by considerable amounts of well-mixed non-AMD groundwater is further supported by stable isotope results, which indicate a steady, low variability signal at the St. Louis Tunnel portal and greater seasonal variability at the upper mine workings (Blaine Tunnel and 517 Shaft). The potential for considerable amounts of non-AMD water entering the system along the St. Louis Tunnel may also be explained by the regional hydrogeology. The drainage tunnel extends several thousand feet into the Rico dome, which is comprised of a thick series of interbedded sandstone, arkose, shale, limestone and dolomite of the Pennsylvania age Hermosa formation [51]. One of the units of this formation is the Leadville Limestone, which is locally 75 m thick and the top of the unit exhibits widespread karst and related erosional features [52]. The Leadville Limestone is also overlain by a sequence of clastic and calcareous sedimentary rocks up to 1000 m thick [52]. The widespread limestone and sedimentary units may therefore support a large regional aquifer. As a result, the St. Louis tunnel may likely be intercepting significant amounts of groundwater (with low levels of mineralization relative to mine waters) moving through the regional aquifer, leading to a dilution of the AMD water prior to emergence at the St. Louis Tunnel portal. The delay in peak discharge from the St. Louis Tunnel relative to the local surface waters would then be explained as being driven by the regional groundwater pulse which can lag seasonal surface or near-surface water runoff in mountain watersheds [53].
3.5. Targeted Remediation
Targeted remediation refers to controlling the source of water (i.e., inflow of groundwater or surface water) into underground workings or open pits and/or controlling the outflow of mine drainage from the workings [1]. From the hydrologic characteristics identified by the multiple tracer approach there are several options for future remediation. Results suggest that there is some degree of hydrologic connectivity between the mine complex and Silver Creek, but it appears that even with the creek being a no-change or losing reach across the mine complex that creek waters are not contributing large amounts of source waters to the underlying mine workings. Therefore, it does not seem necessary to artificially control streamflow in Silver Creek. Conversely, if the study found significant contributions from Silver Creek, then targeted remediation options may have included activities such as lining the stream channel with an impervious membrane or re-routing the stream channel to minimize water exchange in the vicinity of the mine.
The most likely sources of water to the mine are therefore from localized (hillslope scale) meteoric recharge into near surface mine workings to the southeast of Silver Creek. Results suggest that these inputs are seasonally variable with the greatest inputs likely deriving from snowmelt, which is highly spatially and temporally variable in mountain settings [54,55]. The variability of input, combined with the highly variable nature of surface or near-surface mine entrance points (i.e., driven by different rates of portal collapses) make it too expensive and difficult to control the most prevalent source waters. Additionally, most of the degraded mine entrance points are on steep slopes with limited access, so additional environmental impact would occur if the entrances were to be adequately shut off.
The study results further suggest that the mine discharge at the St. Louis Tunnel portal is coming from a combination of highly mineralized (and low pH) AMD waters and less mineralized, well-mixed (from stable isotope results) groundwater. The tracers suggest that the highly mineralized waters are moving in a south to north direction, or from the hillslope containing the Argentine/Blaine Tunnels under Silver Creek towards the 517 Shaft area of the mine and along the deep drainage tunnels to the St. Louis Tunnel portal. The remaining question is at what location does the highly mineralized acidic mine water mix with clean, non-mine-impacted groundwater? By untangling the “under-ground plumbing” in these instances, a source-control approach can be used to collect and segregate the mineralized AMD water, before it can mix with and contaminate larger volumes of naturally occurring groundwater flows [1].
A next step would be to perform rehabilitation of the mine workings associated with the Argentine and Blaine Tunnels to increase safe access and provide confirmation and quantification of sources and mixing points. It would also help to know the volume of mineralized AMD water leaving the mine complex via the SE crosscut prior to any additional inflows occurring along the drainage tunnels. If the contaminated water is significantly less than the volume of water exiting the St. Louis Tunnel then active treatment of the lower volume of water may be the most economically viable option. Currently, in-situ treatment to neutralize the acidity (≈3 pH) of mine water in the 517 Shaft is being performed. The results of this treatment are pending but if the water quality of the St. Louis Tunnel discharge is improved then smaller scale on-site treatment of mine waters in this area may provide the most feasible targeted remediation option.
Other targeted remediation options may include bulkheads to prevent the flow of contaminated waters from ever reaching the St. Louis Tunnel portal. This requires an in-depth understanding of both the structural integrity of host bedrock and regional groundwater elevations before mining and theoretically after bulkhead installation. Installation of a bulkhead is therefore only acceptable if the compounded waters do not back up and reemerge at unintended or uncontrollable locations.
5. Conclusions
Naturally occurring stable- and radio- isotope tracers, artificial salt and dye tracers, and synoptic sampling of water quality parameters were utilized to understand the hydrologic connectivity of the Rico-Argentine mine complex. Historical mining activities have led to the production of AMD at this location and accurate hydrological characterization may enable targeted remediation to reduce or eliminate the contaminated discharge. The natural tracer results suggest that the mine hydrology is driven by recharge of recent meteoric waters while the mine discharge appears to be dominated by a well-mixed groundwater signal. The synoptic sampling of water quality suggests that the most highly contaminated mine water resides in the upper mine workings located in the hillside to the southeast of Silver Creek and are diluted prior to discharging at the St. Louis Tunnel. Tracers applied to Silver Creek indicated that the creek may be losing some water in the vicinity of the mine, but were unable to confirm or reject that Silver Creek was directly contributing water to the mine. Tracers applied directly to the mine workings indicated that mine water was moving in a south to north direction from the workings on the Blaine Tunnel side of Silver Creek to the 517 Shaft area and then draining to the St. Louis Tunnel portal. The concurrent application of a lithium salt and uranine dye tracer to the mine workings produced similar results suggesting that both type of tracers can be successfully used in acidic mine water conditions. However, it was concluded that mass recovery of the uranine dye tracer was more difficult than mass recovery of the lithium tracer because fluorescent dye mass is indirectly measured via fluorescence signal creating greater uncertainty in recovery calculations.
In combination, this suite of natural and applied tracers can provide useful information on complex hydrologic conditions that produce AMD at abandoned hardrock mine sites. The resulting hydrologic characterization of the mine sites may ultimately reduce the impacts of AMD by supporting targeted remediation efforts.
Acknowledgments
The authors of this study would like to thank three anonymous reviewers and Jeff Writer (USGS) for greatly improving the quality of this manuscript. In addition the authors thank the following partners: The U.S. EPA Region 8 Superfund Emergency Response Program; The USGS Toxic Substance Hydrology Program; The Colorado Division of Reclamation, Mining, and Safety; Jan Christner at URS Corporation; Anderson Engineering Company Inc.; The Kiowa Environmental Laboratory of the NWT LTER program at the Institute of Arctic and Alpine Research, Boulder, CO; The Mountain Studies Institute Silverton, CO; and numerous individuals who assisted in field sampling and laboratory analysis for this project. The use of trade, product, or firm names in this publication is for descriptive purposes only and does not imply endorsement by the U.S. government.
Conflicts of Interest
The authors declare no conflict of interest.
References
- Wireman, M.; Stover, B. Hard-rock mining and water resources. Ground Water 2011, 49, 310–316. [Google Scholar] [CrossRef]
- National Hardrock Mining Framework; U.S. EPA 833-B-97-003; U.S. EPA Office of Water: Washington, DC, USA, 1997.
- Riebsame, W. Atlas of the New West: Portrait of a Changing Region; W.W. Norton & Company: New York, NY, USA, 1997; p. 192. [Google Scholar]
- Kimball, B.A.; Runkel, R.L.; Walton-Day, K.; Bencala, K.E. Assessment of metal loads in watersheds affected by acid mine drainage by using tracer injection and synoptic sampling: Cement Creek, Colorado, USA. Appl. Geochem. 2002, 17, 1183–1207. [Google Scholar] [CrossRef]
- Jarvis, A.P.; Younger, P.L. Dominating chemical factors in mine water induced impoverishment of the invertebrate fauna of two streams in the Durham coalfield, UK. Chem. Ecol. 1997, 13, 249–270. [Google Scholar] [CrossRef]
- Nordstrom, D.K. Acid rock drainage and climate change. J. Geochem. Explor. 2009, 100, 97–104. [Google Scholar] [CrossRef]
- Wolkersdorfer, C. Mine water tracing. In Mine Water Hydrogeology and Geochemistry; Younger, P.L., Robins, N.S., Eds.; Geological Society: London, UK, 2002; pp. 47–60. [Google Scholar]
- Field, M.S.; Wilhelm, R.G.; Quinlan, J.F.; Aley, T.J. An assessment of the potential adverse properties of fluorescent tracer dyes used for groundwater tracing. Environ. Monit. Assess. 1995, 38, 75–96. [Google Scholar]
- Wolkersdofer, C. Water Management at Abandoned Flooded Underground Mines—Fundamentals, Tracer Tests, Modeling, Water Treatment; Springer: Heidelberg, Germany, 2008; p. 466. [Google Scholar]
- Alvarado, J.A.C.; Purtschert, R.; Barbecot, F.; Chabault, C.; Ruedi, J.; Schneider, V.; Aeschbach-Hertig, W.; Kipfer, R.; Loosli, H.H. Constraining the age distribution of highly mixed groundwater using 39Ar: A multiple environmental tracer (3H/3He, 85Kr, 39Ar, and 14C) study in the semiconfined Fontainebleau Sands Aquifer (France). Water Resour. Res. 2007, 43, 1–16. [Google Scholar]
- Troldborg, L.; Jensen, K.H.; Engesgaard, P.; Refsgaard, J.C.; Hinsby, K. Using environmental tracers in modeling flow in a complex shallow aquifer system. J. Hydrol. Eng. 2008, 13, 1037–1084. [Google Scholar] [CrossRef]
- Lavastre, V.; La Salle, C.; Michelot, J.; Giannesini, S.; Benedetti, L.; Lancelot, J.; Lavielle, B.; Massault, M.; Thomas, B.; Gilabert, E.; et al. Establishing constraints on groundwater ages with 36Cl, 14C, 3H, and noble gases: A case study in the eastern Paris basin, France. Appl. Geochem. 2010, 25, 123–142. [Google Scholar] [CrossRef]
- McKnight, D.M.; Bencala, K.E. The chemistry of Iron, Aluminum, and dissolved organic material in three acidic, metal-enriched, mountain streams, as controlled by watershed and in-stream processes. Water Resour. Res. 1990, 26, 3087–3100. [Google Scholar]
- Bencala, E.; McKnight, D.M.; Zellweger, G.W. Evaluation of natural tracers in an acidic and metal-rich stream. Water Resour. Res. 1987, 23, 827–836. [Google Scholar] [CrossRef]
- Runkel, R.L.; Walton-Day, K.; Kimball, B.A.; Verplanck, P.L.; Nimick, D.A. Estimating instream constituent loads using replicate synoptic sampling, Peru Creek, Colorado. J. Hydrol. 2013, 489, 26–41. [Google Scholar] [CrossRef]
- Smart, P.L.; Laidlaw, I.M.S. An evaluation of some fluorescent dyes used for water tracing. Water Resour. Res. 1977, 13, 15–33. [Google Scholar] [CrossRef]
- Smart, P.L. Applications of Fluorescent Dyes in the planning and hydrologic appraisal of sanitary landfills. Q. J. Eng. Geol. 1985, 18, 275–286. [Google Scholar] [CrossRef]
- Käß, W. Tracing Technique in Geohydrology; Balkema: Rotterdam, the Netherlands, 1998; p. 581. [Google Scholar]
- Knop, A. Über die hydrographischen Beziehungen zwischen der Donau und der Aachquelle im badischen Oberlande. In Neues Jahrbuch Fur Mineralogie, Geologie und Paläontologie; Leonhard, K.C., Bronn, H.G., Leonhard, G., Geinitz, H.B., Eds.; E. Schweizerbart’sche Verlagshandlung (E. Koch): Stuttgart, Germany, 1878; pp. 350–363. [Google Scholar]
- Käß, W.A. Hydrologic tracing practice on underground contaminations. Environ. Geol. 1994, 23, 23–29. [Google Scholar] [CrossRef]
- Lyons, R.G. Identification and separation of water tracing dyes using pH response characteristics. J. Hydrol. 1993, 152, 13–29. [Google Scholar] [CrossRef]
- Geyer, T.; Birk, S.; Licha, T.; Leidl, R.; Sauter, M. Multitracer test approach to characterize reactive transport in Karst aquifers. Ground Water 2007, 45, 36–45. [Google Scholar] [CrossRef]
- Naurath, L.; Weidner, C.; Rüde, T.R.; Banning, A. A new approach to quantify na-fluorescein (uranine) in acid mine waters. Mine Water Environ. 2011, 30, 231–236. [Google Scholar] [CrossRef]
- Bales, R.C.; Cline, D. Snow hydrology and water resources (Western United States). In Handbook of Weather, Climate, and Water; Atmospheric Chemistry, Hydrology and Societal Impacts; Potter, T.D., Colman, B.R., Eds.; John While and Sons: Hoboken, NJ, USA, 2003; pp. 443–459. [Google Scholar]
- Runkel, R.L.; Kimball, B.A.; Walton-Day, K.; Verplanck, P.L. A simulation-based approach for estimating premining water quality: Red Mountain Creek, Colorado. Appl. Geochem. 2007, 22, 1899–1918. [Google Scholar] [CrossRef]
- Runkel, R.L.; Bencala, K.E.; Kimball, B.A.; Walton-Day, K.; Verplanck, P.L. A comparison of pre- and post-remediation water quality, Mineral Creek, Colorado. Hydrol. Processes 2009, 23, 3319–3333. [Google Scholar] [CrossRef]
- Field, M.S. The QTRACER2 Program for the Tracer-Breakthrough Curve Analysis for Tracer Tests in Karstic Aquifers and Other Hydrologic Systems; EPA/600/R-02/001; U.S. Environmental Protection Agency—Office of Research and Development: Washington, DC, USA, 2002; p. 179.
- Field, M.S. Tracer-Test Planning Using the Efficient Hydrologic Tracer-Test Design (EHTD) Program; EPA/600/R-03/034; U.S. Environmental Protection Agency—Office of Research and Development; National Center for Environmental Assessment: Washington, DC, USA, 2003; p. 175.
- Davis, M.W. The Use of Tracer Dyes for the Identification of a mine Flooding Problem, Rico, Dolores County, Colorado; Colorado Geological Survey Open File Report 91-2; Colorado Geological Survey: Lakewood, CO, USA, 1994; pp. 1–20. [Google Scholar]
- Wolkersdorfer, C.; LeBlanc, J. Regulations, legislation, and guidelines for artificial surface water and groundwater tracer tests in Canada. Water Qual. Res. J. Can. 2012, 47, 42–55. [Google Scholar] [CrossRef]
- Behrens, H.; Beims, U.; Dieter, H.; Dietze, G.; Eikmann, T.; Grummt, T.; Hanisch, H.; Henseling, H.; Käß, W.A.; Kerndorff, H.; et al. Toxicological and ecotoxicological assessment of water tracers. Hydrogeol. J. 2001, 9, 321–325. [Google Scholar] [CrossRef]
- Flury, M.; Wai, N.N. Dyes as tracers for vadose zone hydrology. Rev. Geophys. 2003, 41, 1–33. [Google Scholar]
- Davis, S.N.; Thompson, G.M.; Bentley, H.W.; Stiles, G. Ground-water tracers-A short review. Ground Water 1980, 18, 14–23. [Google Scholar] [CrossRef]
- Sabatini, D.A.; Austin, T.A. Characteristics of rhodamine WT and fluorescein as adsorbing ground-water tracers. Ground Water 1991, 29, 341–349. [Google Scholar] [CrossRef]
- Kasnavia, T.; Vu, D.; Sabatini, D.A. Fluorescent dye and media properties affecting sorption and tracer selection. Ground Water 1999, 37, 376–381. [Google Scholar] [CrossRef]
- Aldous, P.J.; Smart, P.L. Tracing groundwater movement in abandoned coal mined aquifers using fluorescent dyes. Ground Water 1988, 26, 172–178. [Google Scholar] [CrossRef]
- Davies, G. Results of Ground-Water Tracing Experiments in the Nelson-Wooster-Humphrey Tunnel; Cambrian Ground Water Co.: Oak Ridge, TN, USA, 2002; p. 14. [Google Scholar]
- Bencala, K.E.; McKnight, D.M.; Zellweger, G.W. Characterization of transport in an acidic and metal-rich mountain stream bed on a lithium tracer injection and simulations of Transient Storage. Water Resour. Res. 1990, 26, 989–1000. [Google Scholar] [CrossRef]
- Jarrett, R.D. Hydrologic and Hydraulic research in mountain rivers. Water Resour. Bull. 1990, 26, 419–429. [Google Scholar] [CrossRef]
- Marchand, J.P.; Jarrett, R.D.; Jones, L.L. Velocity Profile, Water-Surface Slope, and Bed-Material Size for Selected Streams in Colorado; Open-File Report 1984-733; U.S. Geological Survey: Lakewood, CO, USA, 1984; p. 82.
- Kilpatrick, F.A.; Cobb, E.D. Chapter A16. Measurement of Discharge Using Tracers; USGS Techniques of Water-Resources Investigations Reports, Book 3; U.S. Geological Survey: Reston, VA, USA, 1985.
- Palumbo-Roe, B.; Dearden, R. The hyporheic zone composition of a mining-impacted stream: Evidence by multilevel sampling and DGT measurements. Appl. Geochem. 2013, 33, 330–345. [Google Scholar] [CrossRef]
- Liu, F.J.; Williams, M.W.; Caine, N. Source waters and flow paths in an alpine catchment, Colorado Front Range, United States. Water Resour. Res. 2004, 40, 1–16. [Google Scholar]
- Michel, R.L. Tritium Deposition in the Continental United States, 1953–1989; Water-Resources Investigations Report 89-4072; U.S. Geological Survey: Reston, VA, USA, 1989. [Google Scholar]
- Craig, H. Isotopic variations in meteoric waters. Science 1961, 133, 1702–1703. [Google Scholar]
- Williams, M.W.; Knauf, M.; Caine, N.; Liu, F.J.; Verplanck, P.L. Geochemistry and source waters of rock glacier outflow, Colorado Front Range. Permafr. Periglac. Process. 2006, 17, 13–33. [Google Scholar] [CrossRef]
- Eastoe, C.J.; Rodney, R. Isotopes as tracers of water origin in and near a regional carbonate aquifer: The Southern Sacramento Mountains, New Mexico. Water 2014, 6, 301–323. [Google Scholar] [CrossRef]
- Field, M.S.; Pinsky, P.F. A two-region nonequlibrium model for solute transport in solution conduits in karstic aquifers. J. Contam. Hydrol. 2000, 44, 329–351. [Google Scholar] [CrossRef]
- Brigand, F.G.; Lellouche, G.; Appelboom, T.W. Measuring flow in non-ideal conditions for short-term projects: Uncertainties associated with the use of stage-discharge rating curves. J. Hydrol. 2013, 503, 186–195. [Google Scholar] [CrossRef]
- USGS National Water Information System. Available online: http://waterdata.usgs.gov/nwis (accessed on 1 June 2012).
- McKnight, E.T. Geology and Ore Deposits of the Rico District, Colorado; Professional Paper 723; U.S. Geological Survey: Reston, VA, USA, 1974; p. 100. [Google Scholar]
- Larson, P.B. Stable isotope and fluid inclusion investigations of epithermal vein and porphyry molybdenum mineralization in the Rico Mining District, Colorado. Econ. Geol. 1987, 82, 2142–2157. [Google Scholar]
- Hazen, J.M.; Williams, M.W.; Stover, B.; Wireman, M. Characterization of acid mine drainage using a combination of hydrometric, chemical, and isotopic analysis, Mary Murphy mine, Colorado. Environ. Geochem. Health 2002, 24, 1–22. [Google Scholar] [CrossRef]
- Williams, M.W.; Brown, A.D.; Melack, J.M. Biochemical modifications of snowmelt runoff in an alpine basin. In Hydrological Interactions between Atmosphere, Soil and Vegetation; Kienitz, G., Milly, P.C.D., van Genuchten, M.T., Rosbjerg, D., Shuttleworth, W.J., Eds.; International Association of Hydrological Sciences: Wallingford, UK, 1991; IAHS-AIHS Publication 204; pp. 457–465. [Google Scholar]
- Caine, N. Streamflow patterns in the alpine environment of North Boulder Creek, Colorado Front Range. Z. Geomorphol. 1996, 104, 27–42. [Google Scholar]
© 2014 by the authors; licensee MDPI, Basel, Switzerland. This article is an open access article distributed under the terms and conditions of the Creative Commons Attribution license (http://creativecommons.org/licenses/by/3.0/).