Article

Management of Tundra Wastewater Treatment Wetlands within a Lagoon/Wetland Hybridized Treatment System Using the SubWet 2.0 Wetland Model

1
Department of Civil Engineering, Queen's University, Kingston, ON, K7L 3N6, Canada
2
Waterloo Summit Centre for the Environment, University of Waterloo, Huntsville, ON, P1H 0B6, Canada
3
Centre for Alternative Wastewater Treatment, Fleming College, Lindsay, ON, K9V 5E6, Canada
4
WRL Aps, Langkær Vænge 9, Værløse 3500, Denmark
*
Author to whom correspondence should be addressed.
Water 2014, 6(3), 439-454; https://doi.org/10.3390/w6030439
Submission received: 30 November 2013 / Revised: 21 February 2014 / Accepted: 6 March 2014 / Published: 12 March 2014
(This article belongs to the Special Issue Wetlands and Sustainability)

Abstract

:
The benefits provided by natural (e.g., non-engineered) tundra wetlands for the treatment of municipal wastewater in the Canadian Arctic are largely under-studied and, therefore, undervalued in regard to the treatment service wetlands provide to small remote Arctic communities. In this paper we present case studies on two natural tundra systems which at the time of study had different management practices, in which one consisted of a facultative lake system continuously discharging into a tundra wetland, while the second system had wastewater discharged directly into a tundra wetland. We also examine the utility of the SubWet 2.0 wetland model and how it can be used to: (i) predict the outcomes of management options; and (ii) to assess treatment capacity within individual tundra wetlands to meet future needs associated with population growth and to help municipalities determine the appropriate actions required to achieve the desired level of treatment, both currently, and in a sustainable long-term manner. From this examination we argue that tundra wetlands can significantly augment common treatment practices which rely on waste stabilization ponds, by recognizing the services that wetlands already provide. We suggest that treatment targets could be more achievable if tundra wetlands are formally recognized as part of a hybridized treatment system that incorporates the combined benefits of both the waste stabilization pond and the tundra wetland. Under this scenario tundra wetlands would be recognized as part of the treatment process and not as the ‘receiving’ environment, which is how most tundra wetlands are currently categorized.

1. Introduction

Arctic Canada, as well as numerous other polar regions, continues to undergo rapid change resulting from increased resource extraction, increased development and changing climate which has accelerated the melting of permafrost and polar ice. One particular concern of this is that the population growth in Arctic communities may outpace the development of the municipal infrastructure required to ensure effective treatment of municipal wastewaters and protection of local source waters. Within the Canadian Arctic many communities have for a long time relied solely on waste stabilization ponds or facultative lakes as the main process for the treatment of wastewaters. Waste stabilization ponds have been applied in the Canadian Arctic for decades [1]. The original intent of many Arctic systems was focused on waste disposal as a management technique, rather than wastewater treatment [2]. The focus on waste disposal has also been common in many other Polar Regions, as described by Gunnarsdottir et al. and Ritter [3,4]. The use of ponds and facultative lakes arose primarily in response to the remote nature of these communities, harsh climates, small population sizes and the logistical and technical barriers that hinder the application of mechanical treatment systems more typical of developed regions in southern Canada. In contrast to ponds/lakes, tundra wetlands have been generally viewed as providing little to no treatment benefit, leading to concerns that the release of untreated or partially-treated wastewaters into a natural environment may pose a human health risk [5]. Wetlands located downstream of the waste stabilization ponds have, in many cases, developed in response to the release of nutrients and organic matter exiting the ponds, which has in turn provided the conditions conducive to the growth and establishment of natural vegetation [2,5]. Hence, many tundra wetlands did not arise because of any intentional design on the part of waste managers and thus cannot be considered akin to engineered (e.g., constructed) wetlands in terms of design features.
The remote setting of the Arctic communities often presents significant logistical challenges to investigating and monitoring the performance of tundra wetlands and because of this, relatively little scientific documentation exists that assesses the efficacy of these natural areas to treat domestic wastewaters. Likewise the data regarding the performance of individual waste stabilization ponds and facultative lakes has also been generally sparse or non-existent [6,7,8,9], although there is a recent trend of increasing surveillance because of the Canadian Council for the Ministers of the Environment’s new national standards. Tundra wetlands located downstream of waste stabilization ponds or those connected with facultative lakes have always been considered as part of the receiving environment and not part of the treatment process. The exploratory research by Yates et al. [10,11] has demonstrated that although tundra wetlands are not formally recognized as part of the treatment process they do in fact provide a significant additional treatment benefit [10,11]. Yates and colleagues assessed the wastewater treatment potential of several tundra wetlands located downstream of primary treatment facilities over an entire ice-free period [10,11]. Apart from these investigations there are relatively few studies that have matched the scope of this tundra specific work. Most of the previously collected information related to the predictive aspects of wetland size and anticipated cold climate treatment performance is found in the unpublished sources literature. However, most of the unpublished sources literature provides little guidance regarding treatment process reaction rates, management strategies or predictive tools for assessing the capacity of existing tundra wetlands to meet the needs of expanding populations [5].
It should be understood that tundra wetlands used for the treatment of municipal wastewaters are fundamentally different from engineered (constructed) wetlands that are used for the same purposes. The use of constructed wetlands in tropical and temperate regions is gaining recognition as a viable, low cost passive treatment system [12,13,14,15,16,17]. Constructed wetlands, as their name implies, refers to wetlands that are man-made and designed to specific dimensions, porosity, flow paths, hydraulic retention times, and related design features for the intended purpose of achieving predetermined levels of treatment [12,13,18]. The science regarding treatment processes, reaction rate constants, soil porosity, hydraulics, design options and management practices has been thoroughly investigated in the last two decades and is well documented [19,20,21,22,23,24,25,26].
In contrast, tundra wetlands are significantly different in several aspects. First, tundra wetlands have developed through natural processes and have not been specifically designed to meet a desired performance characteristic. Each tundra wetland is unique and very little is known about site specific hydrology, porosity, soil types and depth, flow paths and other key parameters influencing wastewater treatment. For example, vegetative boundaries are relatively easy to identify, however it is difficult to know the subsurface flow paths that the wastewater travels and how these may change seasonally or annually and thus it is difficult to determine what portions of the wetland are actually involved in the treatment process. Likewise, soil types and depths are not homogeneous and unlike constructed wetlands it is difficult to gather information on many of the physical parameters required to make predictions regarding treatment performance. Lastly, the scientific understanding of treatment processes has largely been generated from constructed wetlands operated in tropical or temperate regions, unlike in the harsh northern environmental conditions where tundra wetlands freeze solid for a significant portion of the year.
Climate change presents public health risk uncertainties and thus the management of wastewater in remote communities requires rational predictive models of performance comparable to southern counterparts particularly as populations continue to increase in many Arctic communities in Canada and worldwide. In this paper, we outline sizing, define reaction rate constants, and demonstrate a predictive model (SubWet 2.0) that can be used by stakeholders for the operation of tundra wetlands for the treatment of municipal wastewaters. SubWet 2.0 is applied to two existing Canadian Arctic tundra wetlands, Paulatuk, Northwest Territories and Chesterfield Inlet, Nunavut based on data collected from Yates et al. [10] and Yates et al. [11]. In this application we discuss corresponding post-design management strategies and estimate system longevity, as well as discuss the potential for the inclusion of wetlands as part of an integrated wastewater treatment strategy for cold climates in northern Canada.
Because of the logistical challenges in gathering the type of information described above, most regulatory agencies have tended to view the tundra wetlands as unknowable and unpredictable and therefore of little use as part of a formally recognized wastewater treatment strategy. The focus of this paper is to: (i) highlight the treatment benefit many tundra wetlands are currently providing; and (ii) describe how the SubWet 2.0 wetland model can provide a predictive tool to help managers and regulators in the assessment of management options.
Readers desiring to know more about the design parameters of the SubWet model are directed to Foundations of Ecological Modelling (4th Ed.) edited by Sven Erik Jørgensen and Brian D. Fath [27]. Chapter 7.6 of this edition profiles the SubWet model and provides an in-depth description of differential process equations, default parameters, forcing functions and output parameters. The SubWet model was originally designed by Sven Jørgensen and colleagues as part of the Danida project, promoting cooperation between Copenhagen and Dar es Salaan University in Tanzania. Software for this model was later developed by the United Nations Environmental Programme, International Environmental Technology Centre (UNEP-IETC), so that it could be used in developing countries to design subsurface flow constructed wetlands for the treatment of domestic wastewaters. In 2009, the SubWet model was further developed by Sven Jørgensen and the Centre for Alternative Wastewater Treatment, Fleming College, Canada for use with natural tundra wetlands of the Canadian arctic.

2. Methods

Two tundra treatment wetlands located in Arctic Canada have been chosen to demonstrate how SubWet 2.0 can be employed to simulate different scenarios in the management of municipal wastewaters. The tundra wetlands located near Chesterfield Inlet, Nunavut and Paulatuk, Northwest Territories have been selected for this purpose since both communities are similar in population size, climate and wastewater discharged per day, as well as the relatively isolated nature of their treatment tundra wetlands which makes them easier to model. The main difference between these two sites was that the raw wastewater was not pre-treated prior to being released into the Chesterfield Inlet tundra wetland, whereas in Paulatuk, the wastewater was pre-treated by first discharging the raw wastewater into a natural lake (facultative lake) which subsequently drained into the Paulatuk tundra treatment wetland.

3. Site Descriptions

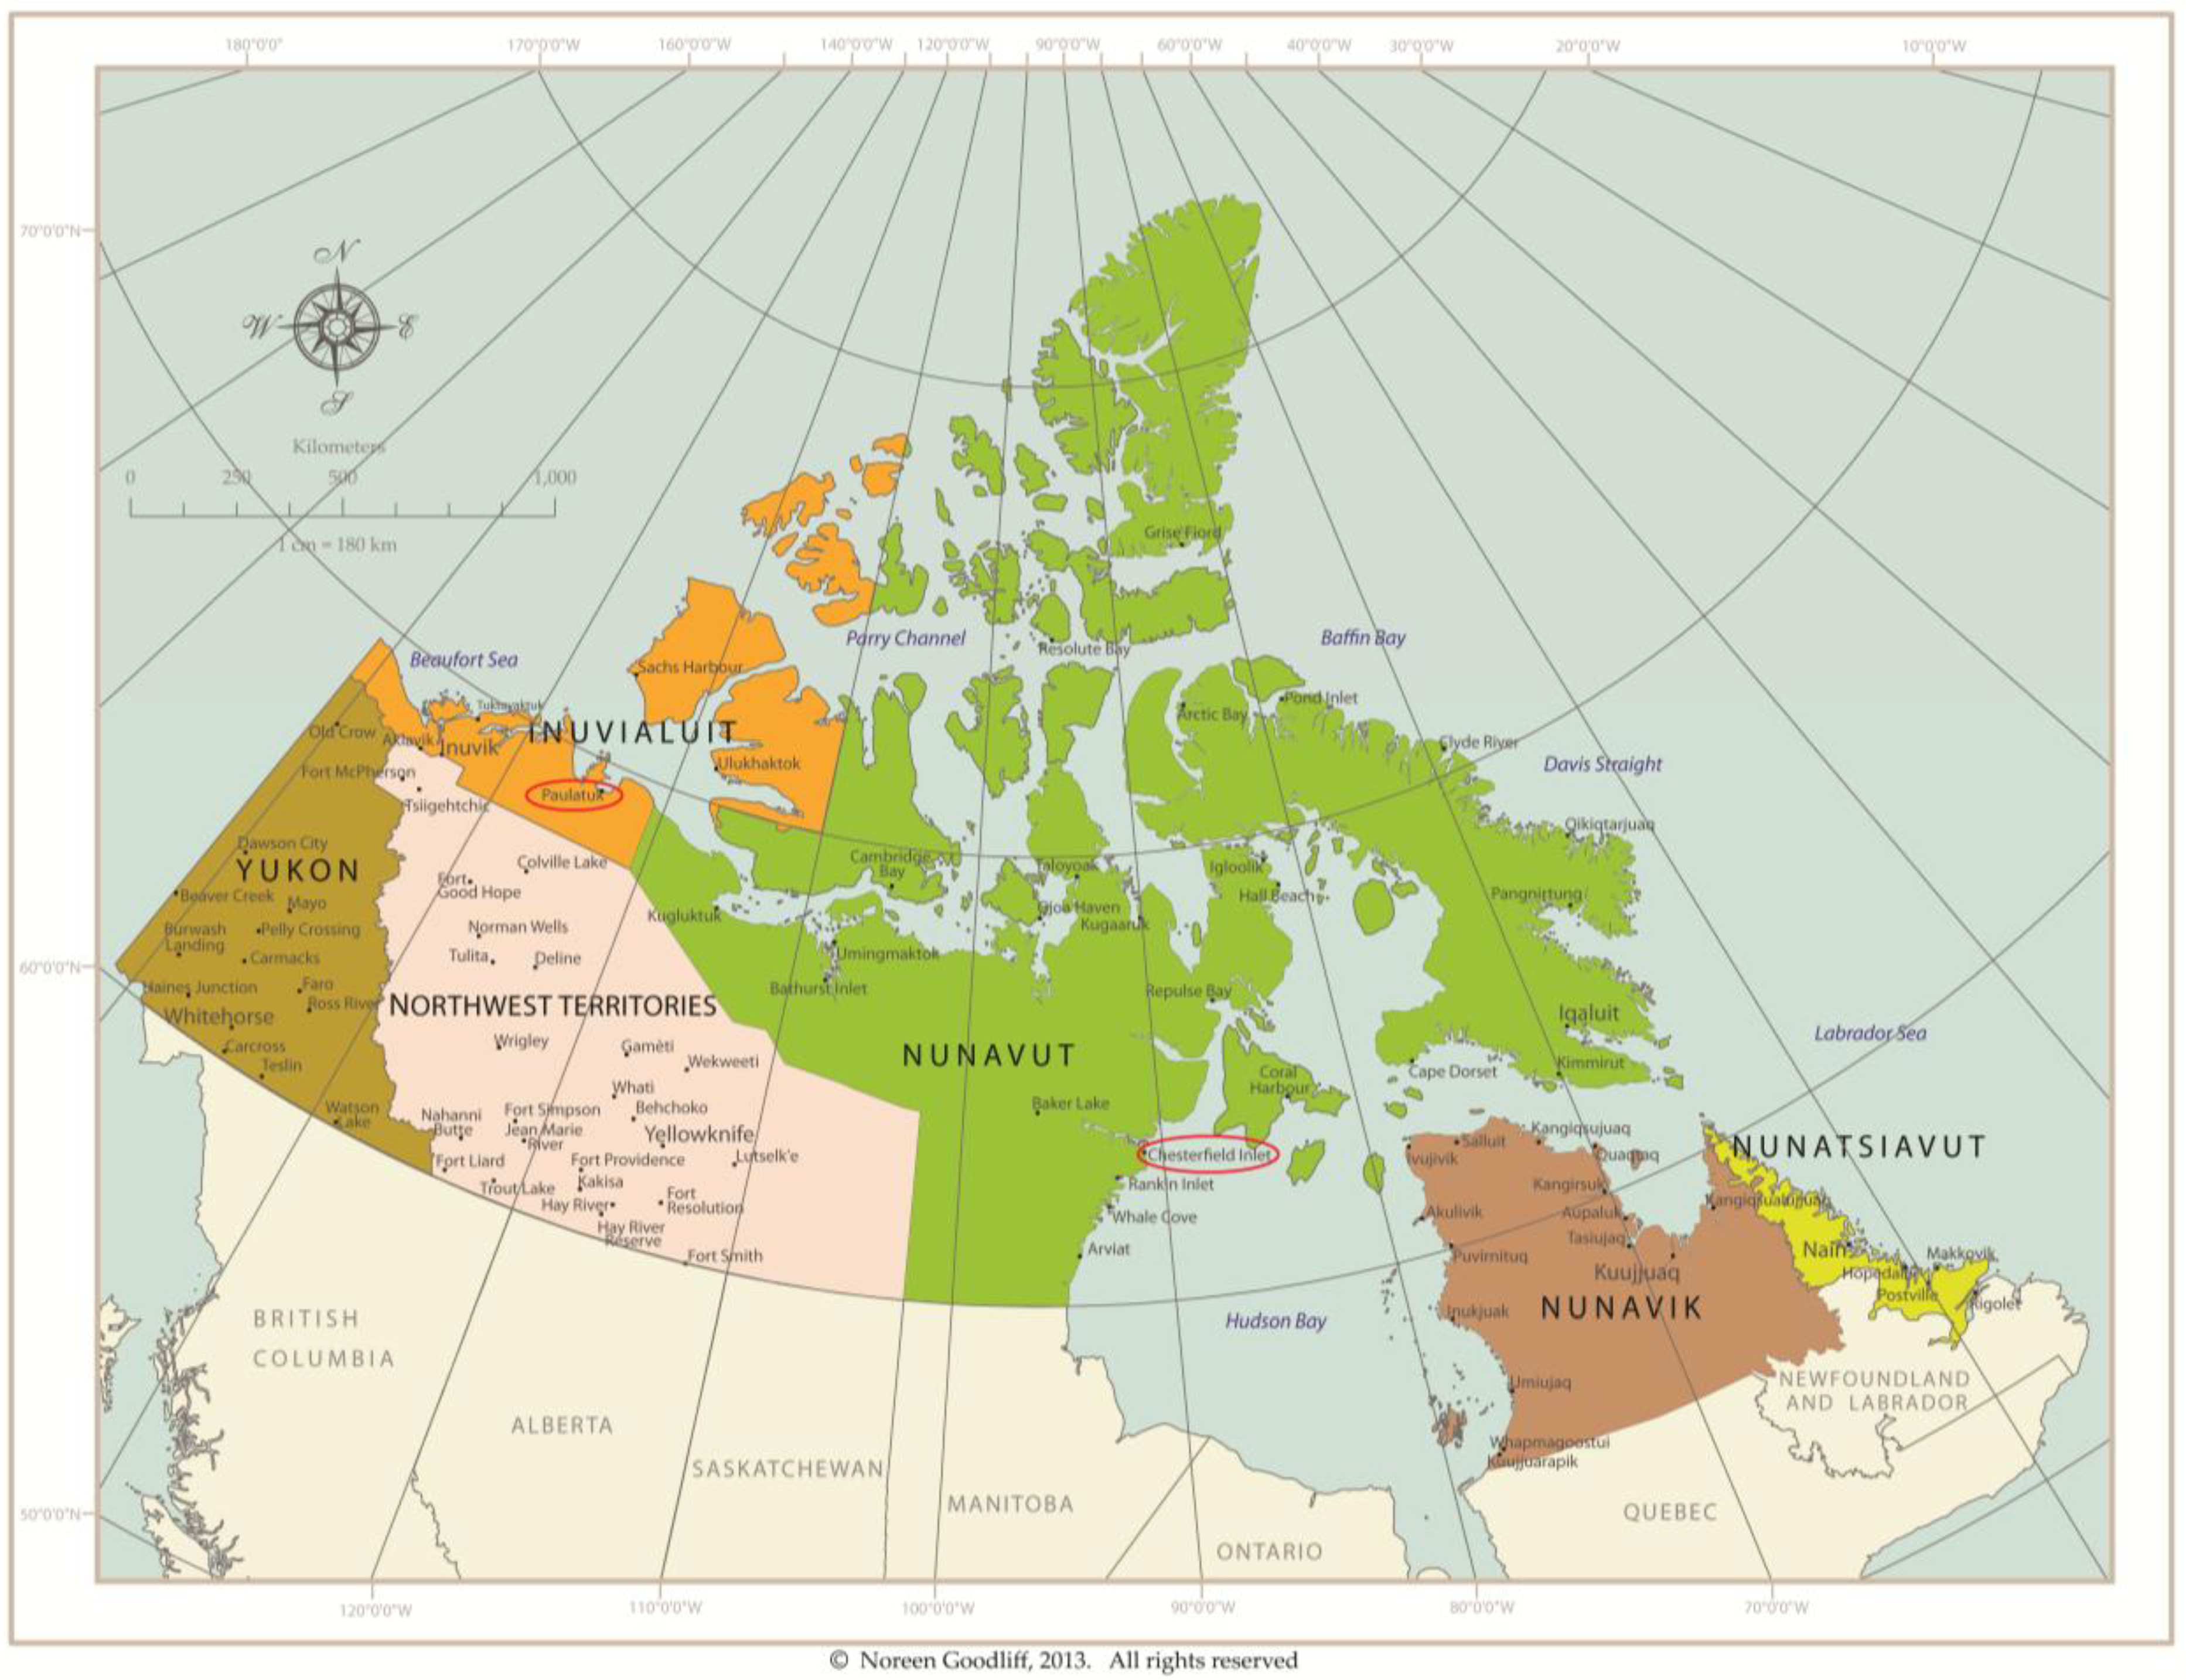
3.1. Chesterfield Inlet, Nunavut

Chesterfield Inlet, Nunavut (63°20′ N, 90°42′ W), located on the western shore of Hudson Bay, is situated on continuous permafrost and receives an average annual precipitation of 14.6 cm rainfall and 112 cm snowfall (Figure 1). At the time of study the population of the community was approximately 313 residents [10]. The annual mean ambient temperature is −11 °C, with a mean summer temperature of 9.4 °C [28]. The mean summer high is 13.1 °C with a mean low of 4.6 °C [28]. The average soil porosity in the tundra wetland has been estimated to be 27% and the dimensions to have a width ranging between 58 to 225 m and a maximum length of 720 m and an approximate size of 5 hectares [10]. Yates et al. characterized the vegetative community to be dominated by sedges, graminoids and shrubs, such as Carex aquatilis, Arctophila fulva and occasional stands of Salix arctophila lining preferential flow channels [10].
At the time of study only a shallow natural depression slowed the wastewater before it entered the Chesterfield tundra wetland, with minimal pre-treatment occurring in this small depression. Yates et al. estimated that approximately 36 m3 was discharging directly into the wetland per day [10]. Since tundra treatment wetlands are not engineered systems, no design loadings exist. A single preferential flow path exited the depression and allowed wastewater to flow down the wetland through a series of preferential paths and some sheet flow. The wastewater discharged into the ocean at one primary location. However, diffuse subsurface flow of treated wastewater was likely possible.
The 2010 water license permits the community to discharge wastewater at concentrations of 80 mg/L for cBOD5, 100 mg/L for total suspended solids, and 1 × 10⁴ cfu/100 mL for fecal coliforms [29]. Yates et al. observed a mean influent for cBOD5, NH3-N, TSS, and TP as 207 mg/L, 29.5 mg/L, 314 mg/L and 5.49 mg/L respectively, with a mean effluent of 10.5 mg/L, 1.1 mg/L, 10.3 mg/L and 0.4 mg/L [10]. Late in 2010, a waste stabilization pond was designed and built to replace the natural depression, thus providing some primary treatment with respect to sedimentation and biological activity to the wastewater prior to its entry into the tundra wetland. The data used in the case study presented here represents conditions prior to the construction of the waste stabilization pond in late 2010.
Figure 1. Communities of the Canadian arctic. Chesterfield inlet and Paulatuk are highlighted in red (Map created by: Noreen Goodliff).
Water 06 00439 g001

3.2. Paulatuk, Northwest Territories

The community of Paulatuk (69°21′05″ N 124°04′10″ W) is located on the Amundsen Gulf of the Arctic Ocean (Figure 1). At the time of study the population of the community was 311 residents [30]. The community of Paulatuk utilizes a large natural lake as a facultative lake primary treatment system followed by a tundra treatment wetland. Wastewater from households and businesses is trucked and discharged into the facultative lake. The average annual ambient air temperature for Paulatuk is −9.2 °C, The mean high and low temperatures in July are respectively 13.3 °C and 4.9 °C. In January, the mean high and low temperatures are −21.2 °C and −28.1 °C [31].
In 2007, the annual discharge of wastewater into the facultative lake was estimated to be approximately 11,200 m3 (or 31 m3/d) [11]. The facultative lake was also estimated at this time to have a volume of 103,000 m3 [32]. Yates et al. estimated the wetland size as 40–80 m in width and approximately 350 m in length with an approximate aerial size of 4.7 ha. There is a single preferential flow path and several nondescript flow channels from the facultative lake to the Arctic Ocean discharge point [11]. They also estimated that 1.3 m3/day was discharging from the wetland when primary treated wastewaters were continuously flowing into the wetland during the ice-free period. Yates et al. characterized the wetland as wet-sedge tundra, dominated by Carex and Poa spp [11]. Low lying hills from relic ocean bottoms surround the treatment area. Mineral soils underlie the wetland, composed of various coarse sands and gravels. Yates et al. found that the mean influent from the facultative lake had a concentration of cBOD5, NH3-N, TSS and TP of 40 mg/L, 3.19 mg/L, 35 mg/L and 2.42 mg/L respectively, with a mean effluent from the wetland of 2 mg/L, 0.01 mg/L, 3 mg/L and 0.04 mg/L [11].

3.3. Data

The data used to form the case study scenarios were collected by Yates et al. and Yates et al. [10,11]. Data in both study areas were collected in the summer/fall of 2009. Data consisted of both surface flow samples and subsurface samples. As per Yates et al. the research group sampled from 41 sites in the Paulatuk treatment wetland, and 34 sampling locations in Chesterfield Inlet [11].
Each sample was either shipped within 24 h to an ISO 17025 accredited laboratory and processed using Standard Methods for the Examination of Water and Wastewater [33], or processed using standard methods at a mobile laboratory operated by the author’s research team. Parameters analyzed where cBOD5, NH3-N, phosphorus and nitrate. SubWet 2.0 does not have a predictive function for solids; however, solid removal is considered within various coefficients values.

3.4. SubWet 2.0

The SubWet model is a user friendly software package designed to simulate the treatment of wastewater within subsurface horizontal flow artificial wetlands. This model was originally developed by the United-Nations Environment Programme-Division of Technology, Industry and Economics-International Environmental Technology Centre (UNEP-DTIE-IETC). The model is distributed as free-ware by the United-Nations and can be found on the home web page for UNEP-IETC. SubWet was developed for warm climate applications and after being successfully used as a design tool in 15 cases in Tanzania, it was upgraded for use within cold climates for both artificial and natural treatment wetlands. The Centre for Alternative Wastewater Treatment of Fleming College worked in collaboration with Jørgensen, the originator of the model, and UNEP-DTIE-IETC to develop SubWet 2.0 which is designed for cold climate conditions including summer Arctic and temperate winter conditions. The model simulates the removal of organic carbon (e.g., cBOD5), nitrogen (e.g., nitrogen in ammonium, nitrate and organic nitrogen), and phosphorus in milligrams per liter and the corresponding removal efficiencies in percentage. The model employs 25 differential process equations and 16 parameters (e.g., rate coefficients such as the temperature coefficient of nitrification) as described in Jørgensen and Gromiec [27]. SubWet suggests default parameters for both warm climate and cold climate scenarios; however each parameter can be modified to improve the simulation for site specific conditions. The design input values of the model are used to specify the wetland width, length, depth, slope, % particulate matter, precipitation factor, hydraulic conductivity and selected flow rate (in cubic meters per day). The forcing functions outlining the operational parameters include wetland volume, flow of wastewater, porosity, average oxygen concentration, average temperature, the input of cBOD5, ammonium, nitrate, total phosphorus, and organic nitrogen along with the fraction of cBOD5, phosphorus, and organic N as suspended matter. The model calculates the simulated output values for cBOD5, nitrate, ammonium, total phosphorus and organic nitrogen. The procedure use to calibrate SubWet 2.0 to site conditions has been outlined by Chouinard et al. [34]. In brief, the calibration is achieved by comparing wastewater effluent concentrations measured exiting the wetland site (in situ) and comparing these measured concentrations against the simulated concentrations generated by the SubWet 2.0 model. Rate coefficients (referred to as parameters in the SubWet model) are then selectively adjusted (within defined limits) to bring simulated values closer to measured values. Thus the model is calibrated to each individual wetland and calibration can take place only when measured data exists. The measured data used for the calibration of the wetlands was provided from the previous work by Yates and colleagues [10,11]. It should be noted that the cold climate default rate coefficients embedded within the cold climate operations mode of SubWet do provide simulated output values that are generally within approximately 25% of the measured values for most wetlands we have investigated. The calibration procedure as outlined by Chouinard et al. [34] generally reduces the difference between measured and simulated values to approximately 10% or less. The work by Chouinard et al. [34] also provides a step by step overview in how the SubWet model is operated.

3.5. Case Study Scenarios

The following analysis depicts a number of hypothetical scenarios that wastewater managers could be presented with during the operation of waste stabilization ponds discharging to tundra wetlands. These hypothetical scenarios are intended to illustrate the ways SubWet 2.0 can be used to simulate how tundra wetlands could be expected to respond within a hybridized treatment process that involves both the waste stabilization pond and the augmentative treatment provided by the natural tundra wetlands.
The harsh cold of Arctic Canada can slow the microbial treatment processes occurring within the waste stabilization ponds. As such, the detention times of wastewaters within these ponds are typically longer than what is required in warmer climates. With age, the holding capacity of the northern stabilization ponds can decrease from the accumulation of sludge. The accumulation of sludge and population growth (e.g., increased generation of wastewater) could mean that in some communities wastewater managers must seek new treatment strategies (e.g., alteration to wastewater holding times within stabilization ponds). SubWet 2.0 can be used to explore how the treatment wetland may respond to different scenarios involving the treatment of altered wastewater concentrations, volumes and required wetland size needed to ensure effective treatment. In this way SubWet 2.0 can help wastewater managers to identify the scenarios that provide the best practices within a hybridized (pond/wetland) treatment system.
In this paper, we present the analysis of five different hypothetical scenarios to demonstrate how SubWet 2.0 can provide Arctic municipal wastewater managers with a tool to adapt to changing treatment conditions as well as the impact to treatment when wetland systems are altered. We will test: (i) the influence of pre-treatment at the Chesterfield Inlet tundra wetland; (ii) how pre-treatment enhances the capacity of the Chesterfield Inlet tundra wetland; (iii) the influence of seasonal changes in temperature at the Chesterfield Inlet tundra wetland; (iv). assessing how land development in the Chesterfield Inlet tundra wetland may impinge upon treatment capacity; and (v) assessing the treatment response of the Paulatuk tundra wetland to short term increases in wastewater strength and flow rates.

4. Results

4.1. Scenario 1: Influence of Pre-Treatment at the Chesterfield Inlet Wetland

At the time of study the raw wastewater received no pre-treatment prior to entry into the Chesterfield tundra wetland [10]. Because of this, the strength of the wastewater could be considered high (e.g., cBOD5 = 207 mg/L); however, these concentrations have been found to be characteristic of many Arctic communities. In contrast, the wastewater generated from Paulatuk underwent primary treatment within the facultative lake prior to discharge to the wetland [11]. As such the concentration of the wastewater entering the Paulatuk tundra wetland was much lower (e.g., cBOD5 = 40 mg/L) [11] relative to the wastewater entering the Chesterfield tundra wetland.
In this scenario we examine how the installation of pre-treatment prior to the tundra wetland would impact wastewater treatment at Chesterfield Inlet. Quantifying the magnitude of enhanced performance would be helpful to managers in performing a cost-benefit analysis. In order to accomplish this assessment, SubWet 2.0 was programmed with all the physical parameters of the Chesterfield Inlet tundra wetland; however, the strength of the wastewater entering the wetland was representative of the lower concentrations of effluent found entering the Paulatuk tundra wetland after pre-treatment in the facultative lake. Table 1 summarizes the concentration of the raw wastewater entering the Chesterfield tundra wetland and the measured concentration of the treated wastewater as it exits the wetland with similar parameters also summarized for Paulatuk within Table 1. The mean measured water temperature for the Chesterfield Inlet and Paulatuk tundra wetlands are approximately 7.5 °C and 13.3 °C, respectively.
Based on the scenario of installed pre-treatment for Chesterfield Inlet, the treatment performance of the tundra wetland is enhanced. Table 2 shows that both cBOD5 and ammonium are reduced significantly from 10.5 to 5 mg/L and 1.1 to 0.1 mg/L, respectively.
Table 1. Measured influent and effluent concentrations observed at both the Chesterfield Inlet and Paulatuk tundra wetlands. The influent entering the Chesterfield Inlet was not pre-treated, while the influent entering the Paulatuk tundra wetland had undergone pre-treatment in the facultative lake immediately upstream of the wetland.
Test VariableUnitInfluent values for Chesterfield InletEffluent values for Chesterfield InletInfluent values for PaulatukEffluent values for Paulatuk
cBOD5mg O2/L20710.5402
Ammonium-Nmg N/L29.51.13.20.01
Nitrate-Nmg N/L0.190.010.170.36
Phosphorusmg P/L5.490.42.420.04
Table 2. Simulated effluent concentrations exiting the Chesterfield Inlet tundra wetland. Note, the influent concentrations of Paulatuk were used in this simulation to reflect how the Chesterfield Inlet wetland may perform if wastewater pre-treatment was installed at this site. The mean observed temperature of 7.5 °C for the Chesterfield Inlet wetland was kept in this scenario.
Test VariableUnitPre-treatment influent concentration valuesSimulated effluent concentrations results
cBOD5mg O2/L405
Ammonium-Nmg N/L3.20.1
Nitrate-Nmg N/L0.170.02
Phosphorusmg P/L2.420.5

4.2. Scenario 2: Effect of Pre-Treatment on Chesterfield Inlet Wetland

In the first scenario it was illustrated that pre-treatment of the raw wastewater prior to release into the Chesterfield wetland resulted in lower concentrations of wastewater parameters in the treated wetland effluent. In this second scenario we examine how much more wastewater (pre-treatment values) can be passed through the wetland before cBOD5 exiting the wetland becomes higher than the regulatory standards for southern Ontario. At this time standards have not been set for Canada’s Far North because of logistical and environmental issues [35]; for this reason, southern standards at 25 mg/L for the parameters cBOD5 and 1.25 mg/L for NH3-N at 15 ± 1 °C are used in this northern setting [36].
SubWet 2.0 predicts that effluent volumes entering the wetland can be tripled (from 36 m3/d to 108 m3/d) to quintupled (from 36 m3/d to 180 m3/d) and still maintain a cBOD5 effluent concentration exiting the wetland that is below 25 mg/L. Table 3 summarizes the simulated wastewater quality parameters determined from increasing the flows by 3 to 5 times the current volumes. In theory, these results suggest that if the raw wastewater entering the wetland was pre-treated to reflect the primarily treated wastewater of Paulatuk then the Chesterfield tundra wetland may be expected to accommodate a 3 to 5 fold increase in wastewater volume generated from an increase in the population of this community.

4.3. Scenario 3: Seasonal Temperature on Treatment Efficiency

SubWet 2.0 can be used by wastewater operators to simulate the influence of temperature on the wetland treatment efficiency. This hypothetical scenario examines how the Chesterfield wetland can be expected to perform in the treatment of wastewater at two different temperature regimes, namely at a temperature of 7.5 °C and at 3 °C. 7.5 °C is the mean water temperature that was measured during sampling conducted in the summer and which was used to calibrate SubWet 2.0 for these scenarios. As shown in Table 4, a decrease in temperature from 7.5 °C to 3 °C results in a poorer treatment of cBOD5, ammonium and nitrate but not phosphorus. Knowing how the wetland would perform under different seasonal temperature regimes could help managers to make more informed decisions regarding the best time for the decanting of effluents from waste stabilization ponds and what volumes the wetland could be expected to accommodate without exceeding key water quality parameter targets.
Table 3. Wastewater parameter concentrations exiting the Chesterfield Inlet tundra wetland under simulated increased effluent flows through the wetland. The mean observed temperature of 7.5 °C for the Chesterfield Inlet wetland was kept in this scenario.
Test VariableUnitPre-treatment influent values for Chesterfield InletSimulation results from tripling the flow (108 m3/d)Simulation results from quadrupling the flow (144 m3/d)Simulation results from quintupling the flow (180 m3/d)
cBOD5mg O2/L40172023
Ammonium-Nmg N/L3.20.60.81.1
Nitrate-Nmg N/L0.170.070.090.1
Phosphorusmg P/L2.411.11.2
Table 4. Simulated treatment response of the Chesterfield Inlet wetland (no pre-treatment) at the two different temperature regimes of 7.5 °C and 3 °C.
Test VariableUnitInfluent values for Chesterfield InletSimulation results at 7.5 °CSimulation results at 3 °C
cBOD5mg O2/L20710.415.3
Ammonium-Nmg N/L29.51.11.7
Nitrate-Nmg N/L0.190.060.08
Phosphorusmg P/L5.490.40.4

4.4. Scenario 4: Reduced Wetland Size

In the following scenario the SubWet model will be used to predict tundra wetland performance should land use factors alter the original size of the wetland; these factors could include the construction of a roadway through the wetland that impedes natural flow paths. In this scenario, the initial size of the Chesterfield wetland has been reduced by 35% by modifying the length of the wetland from 720 m to 468 m. In theory, this would also reduce the effluent holding capacity of the wetland from an estimated 15,000 m3 to 9750 m3 and the hydraulic retention time from 23 to 15 days (Table 5). Table 6 shows that with these changes SubWet predicts that cBOD5 will rise to 21 mg/L, while the ammonium-N, nitrate-N and phosphorus treatment remain acceptable. The phosphorus concentration remains below 1 mg P/L and the nitrate-N is also very low due to the effective denitrification.
Table 5. SubWet design values for the Chesterfield Inlet tundra wetland as they currently exist (Initial) and the modified design values if the wetland were to be reduced in size by 35%.
Design VariableInitial Design ValuesModified Design Values
Width (m)6969
Length (m)720468
Depth (m)0.30.3
Area (m2)49,90032,400
Volume (m3)15,0009,750
Flow rate (m3/24h)3636
Retention time per box2315
Table 6. Simulated treatment response of the Chesterfield Inlet tundra wetland after reducing the initial size by 35%.
Test VariableUnitInfluent values for Chesterfield InletInitial effluent concentration values before size reductionSimulation results after reducing initial size by 35%
cBOD5mg O2/L20710.521
Ammonium-Nmg N/L29.51.10.54
Nitrate-Nmg N/L0.190.010.06
Phosphorusmg P/L5.490.40.61

4.5. Scenario 5: Response of the Paulatuk Tundra Wetland to Temporary Increases in Influent Volume and Concentration

In this scenario we use SubWet to predict how the Paulatuk tundra wetland may respond to a temporary fourfold increase in the volume and concentration of influent entering the wetland. In this scenario, the volume of influent has been temporarily increased for a one week period from 31 m3/d to 124 m3/d. Likewise over the same period of time the strength of the cBOD5 has been increased from 40 mg/L to 160 mg/L and ammonium from 3.2 mg/L to 12.8 mg/L. SubWet predicts that during this one week period the hydraulic residency time decreases from 24 days to 6 days and that the concentration of cBOD5 exiting the wetland slow rises from 1.5 to a maximum of 12.2 mg/L after a period of 141 days from the beginning of the increased flow and concentration. The concentration of cBOD5 in the effluent gradually returns to a normal value of 1.5 in about one year after the overloading has ceased. In a similar manner, effluent ammonium peaks at 0.1 mg/L, and recovery to the pre-overloading value of 0.03 mg/L is achieved in 292 days. In this manner, SubWet can be used by managers to predict the impact on treatment performance that short term overloading may evoke if effluents from stabilization ponds need to be decanted prematurely to provide extra storage space for wastewater.

5. Discussion

Treatment Potential of Tundra Wetlands

The work by Chouinard et al. [34], Balch et al. [37] and Yates and colleagues [10,11,38] have all clearly demonstrated the treatment benefits provided by tundra wetlands. Wastewaters intentionally released from waste stabilization ponds (e.g., decanted), unintentionally released as leakage from the detention berms of the ponds (exfiltration) or the natural releases from facultative lakes typically exhibited levels of carbonaceous biochemical oxygen demand (cBOD), total ammonia nitrogen (TAN) and microbial indicator organism E. coli and fecal coliforms that were higher than desired by territorial regulatory authorities [10,11,34,35,37,38,39].
The existing performance data from lagoon systems often does not meet municipal wastewater effluent standards set for southern Canada at 25 mg/L for both BOD and TSS [36]. It should be noted that the performance standards for Arctic Canada have yet to be determined. Treatment efficiencies associated with current strategies in northern settings (e.g., waste stabilization ponds, facultative lakes) can be variable. The facultative lagoon in Pond Inlet showed a minimum of 71 mg/L of BOD discharged during the decant into a wetland [39]. Data from a facultative lake in Paulatuk showed cBOD5 as 27 mg/L being discharged into a wetland [32]. Miyamoto and Heinke reported reductions of biochemical oxygen demand (BOD) and total suspended solids (TSS) in lagoon effluent in an Arctic community [6]. In their study they summarized the treatment of BOD, TSS and fecal coliforms during the summer and winter of 1971. Summer median influent was reported at 195 ± 68 mg/L and effluent 40 ± 20 mg/L and winter median lagoon effluent at 51 ± 28 mg/L for BOD, TSS and fecal coliforms; a percent reduction of 80% and 71% respectively. Similar reductions were observed for TSS. Johnson and Wilson examined Northwest Territories and Nunavut lagoons and facultative lakes and reported percent reduction of BOD at 87% to 96%, and TSS in the range of 90% to 93% [40].
Duko and Heinke have identified wetlands as a low-cost and energy-efficient treatment option for municipal wastewater in the Northwest Territories, Canada [5]. They suggested at the time that wetlands had not been used much for wastewater treatment in the Canadian Arctic because of the lack of adequate design criteria and performance data. Yet despite the apparent inadequacy of lagoon systems, wetlands still are not considered part of the treatment chain, and only a few sources from non-peer-reviewed literature exists describing design criteria [41].
Management of infrastructure is often problematic in the Canadian Arctic; extreme temperatures, permafrost, and the remote nature of many of the communities severely limit many technologies [4]. However, a number of socio-economic factors also inhibit the use of these technologies as well. The socio-economic challenges are often related to a small pool of trained personnel coupled with high turnover rates, as well as a small tax base [3,28,29]. Given these apparent constraints, we believe that tools need to be available to on-site managers as well as consulting engineers, regulatory agencies, municipal planners and territorial water boards to allow them the ability to validate a technology and predict future needs as communities grow and regulations change. Natural tundra wetlands have been a reliable technology to manage wastewater to-date, despite a lack of detailed knowledge of their performance, or acceptance as part of the regulated treatment chain. As we have shown with the various scenarios tested through SubWet 2.0, wetlands provide the treatment potential required to meet potential stringent guidelines set by CCME in the near future for Arctic communities. In all scenarios, the current wetland systems tested show that they were all able to accommodate a reduction in wetland length, increases in flow, and various temperature regimes. The simulations also show that designs of new systems can include shorter wetland lengths when paired with appropriately sized facultative lakes and long-term retention lagoons to avoid spring freshets laden with semi-frozen untreated wastes. Evidence from other natural wetland systems outside of the arctic demonstrates that these natural systems have an ability to treat municipal wastewater and effluents and thus corroborate our findings [42,43,44,45,46,47,48]. Even in Arctic environments where nutrient and carbon cycling proceed at a slow pace for much of the year, assimilation and even treatment through natural processes are evident. Evidence of ecosystem response to nutrients in the Arctic wet tundra provides further detail that these systems can quickly assimilate small additions of nutrients and organic matter [49,50,51,52].

6. Conclusions

SubWet 2.0 has been calibrated for the extreme cold climate conditions of the Canadian Arctic. Simulated scenarios show that despite reducing wetland size, or increasing discharge volumes, as well as reducing temperature regimes, the tundra wetlands provide excellent treatment potential, both on their own, or as a integrated/hybridized system with either a lagoon or facultative lake. Early data by this research group also verifies that tundra wetlands have the ability to act as a low-cost solution to wastewater management in Arctic conditions. Most importantly, having tools such as SubWet 2.0 employed by managers allows them to make theoretically sound decisions by predicting future responses of the treatment system to increases in wastewater volume, or in designing the best system.

References

  1. Dawson, R.N.; Grainge, J.W. Proposed design criteria for waste-water lagoons in arctic and sub-arctic regions. J. Water Pollut. Control Fed. 1969, 41, 237–244. [Google Scholar]
  2. Yates, C.N. A review of wastewater treatment in the Canadian arctic: Comments and recommendations for new municipal effluent performance standards. Arctic 2014. submitted for publication. [Google Scholar]
  3. Gunnarsdottir, R.; Jenssen, P.D.; Jensen, P.E.; Villumsen, A.; Kallenborn, R. A review of wastewater handling in the arctic with special reference to pharmaceuticals and personal care products (PPCPs) and microbial pollution. Ecol. Eng. 2013, 50, 76–85. [Google Scholar] [CrossRef]
  4. Ritter, T.L. Sharing environmental health practice in the north american arctic: A focus on water and wastewater service. J. Environ. Health 2007, 69, 50–55. [Google Scholar]
  5. Doku, I.A.; Heinke, G.W. Potential for greater use of wetlands for waste treatment in northern canada. J. Cold Regions Eng. 1995, 9, 75–88. [Google Scholar] [CrossRef]
  6. Miyamoto, H.K.; Heinke, G.W. Performance evaluation of an arctic sewage lagoon. Can. J. Civ. Eng. 1979, 6, 324–328. [Google Scholar] [CrossRef]
  7. Environment Canada. Sewage Lagoons in Cold Climates. Ottawa; Report EPS 4/NR/1; Technical Services Branch, Environment Canada: Ottawa, Canada, 1985. [Google Scholar]
  8. Tilsworth, T.; Smith, D.W. Cold climate facultative lagoons. Can. J. Civ. Eng. 1984, 11, 542–555. [Google Scholar] [CrossRef]
  9. Johnson, K.; Sarson, K. Aerated lagoons in the Canadian north-fort nelson facility. J. North. Territ. Water Waste Assoc. 2007, 9, 20–23. [Google Scholar]
  10. Yates, C.N.; Wootton, B.C.; Murphy, S.D. Performance assessment of Arctic tundra municipal wastewater treatment wetlands through an Arctic summer. Ecol. Eng. 2012, 44, 160–173. [Google Scholar] [CrossRef]
  11. Yates, C.N.; Wootton, B.; Jørgensen, S.E.; Murphy, S.D. Use of Wetlands for Wastewater Treatment in Arctic Regions. In Encyclopedia of Environmental Management; Jørgensen, S.E., Ed.; Taylor Francis: New York, NY, USA, 2013; Volume 4. [Google Scholar]
  12. Vymazal, J. Constructed wetlands for wastewater treatment: Five decades of experience. Environ. Sci. Technol. 2011, 45, 61–69. [Google Scholar] [CrossRef]
  13. Kadlec, R.H.; Wallace, S. Treatment Wetlands, 2nd ed.; CRC Press: Boca Raton, FL, USA, 2009. [Google Scholar]
  14. Kivaisi, A.K. The potential for constructed wetlands for wastewater treatment and reuse in developing countries: A review. Ecol. Eng. 2001, 16, 545–560. [Google Scholar] [CrossRef]
  15. Zhang, D.; Gersberg, R.M.; Keat, T.S. Constructed wetlands in China. Ecol. Eng. 2009, 35, 1367–1378. [Google Scholar] [CrossRef]
  16. Lofrano, G.; Meric, S.; Belgiorno, V. Sustainable wastewater management in developing countries: Are constructed wetlands a feasible approach for wastewater reuse? Int. J. Environ. Pollut. 2008, 33, 82–92. [Google Scholar] [CrossRef]
  17. Denny, P. Implementation of constructed wetlands in developing countries. Water Sci. Technol. 1997, 35, 27–34. [Google Scholar] [CrossRef]
  18. Akratos, C.S.; Tsihrintzis, V.A. Effect of temperature, HRT, vegetation and porous media on removal efficiency of pilot-scale horizontal subsurface flow constructed wetlands. Ecol. Eng. 2007, 29, 173–191. [Google Scholar] [CrossRef]
  19. Cooper, P. The Constructed Wetland Association’s Database of Constructed Wetland Systems in the UK. In Proceedings of the 6th Workshop on Nutrient Cycling in Natural and Constructed Wetlands, Trebon, Czech Republic, 30 May–3 June 2006.
  20. O’Hogain, S. Reed Bed Sewage Treatment and Community Development/Participation. In Proceedings of the 6th Workshop on Nutrient Cycling in Natural and Constructed Wetlands, Trebon, Czech Republic, 30 May–3 June 2006.
  21. Vymazal, J. Wastewater Treatment, Plant Dynamics and Management in Constructed and Natural Wetlands; Springer: London, UK, 2008. [Google Scholar]
  22. Jenssen, P.D.; Maehlum, T.; Krogstad, T.; Vrale, L. High performance constructed wetlands for cold climates. J. Env. Sci. Hlth. Part A 2005, 40, 1343–1353. [Google Scholar] [CrossRef]
  23. Vymazal, J. Constructed wetlands for wastewater treatment. Ecol. Eng. 2005, 25, 475–477. [Google Scholar] [CrossRef]
  24. Campbell, C.S.; Ogden, M.H. Constructed Wetlands in the Sustainable Landscape; Wiley: New York, NY, USA, 1999. [Google Scholar]
  25. Hammer, D.A. Constructed Wetlands for Wastewater Treatment: Municipal, Industrial and Agricultural; Lewis: Chelsea, MA, USA, 1989. [Google Scholar]
  26. Buchberger, S.G.; Shaw, G.B. An approach toward rational design of constructed wetlands for waste-water treatment. Ecol. Eng. 1995, 4, 249–275. [Google Scholar] [CrossRef]
  27. Jørgensen, S.E.; Gromiec, M.J. Mathematical models in biological waste water treatment—Chapter 7.6. In Fundamentals of Ecological Modelling, Volume 23, 4th Edition: Applications in Environmental Management and Research; Jørgensen, S.E., Fath, B.D., Eds.; Elsevier: Amsterdam, the Netherlands, 2011; pp. 1–414. [Google Scholar]
  28. Chabot, M.; Duhaime, G. Land-use planning and participation: The case of Inuit public housing (Nunavik, Canada). Habitat Int. 1998, 22, 429–447. [Google Scholar] [CrossRef]
  29. Nunavut Water Board—Type A NWB licence No. 3BM-CHE1013–Hamlet of Chesterfield Inlet, Nunavut. 2010. Available online: http://www.nunavutwaterboard.org/en/home (accessed on 22 August 2012).
  30. Northwest Territories Bureau of Statistics. Paulatuk, NWT, Canada, Population Census. Available online: http://www.statsnwt.ca/population/population-estimates/commtotal.html (accessed on 7 March 2012).
  31. Environment Canada. Canadian Climate Normals. Available online: http://www.climate.weatheroffice.gc.ca/climate_normals/index_e.html (accessed on 16 July 2010).
  32. Dillon Consulting Ltd. Hamlet of Paulatuk: Operation and Maintenance Manual, Sewage and Solid Waste Disposal. Report 04-3332. Available online: http://www.docstoc.com/docs/45286151/Appendix-H—Operations-and-Maintenance-Manual-Sewage-and-Solid-Waste (accessed 7 March 2012).
  33. Eaton, A.D.; Franson, M.A.H. Standard Methods for the Examination of Water & Wastewater; American Public Health Association: Washington, DC, USA, 2005. [Google Scholar]
  34. Chouinard, A.; Balch, G.B.; Wootton, B.C.; Jørgensen, S.E.; Anderson, B.C. Modelling the performance of treatment wetlands in a cold climate. In Advances in the Ecological Modelling and Ecological Engineering Applied on Lakes and Wetlands; Jørgensen, S.E., Chang, N.B., Fuliu, X., Eds.; Elsevier: Amsterdam, the Netherlands, 2014; in press. [Google Scholar]
  35. Yates, C.N.; Balch, G.C.; Wootton, B.C.; Jørgensen, S.E. Practical aspects, logistical challenges, and regulatory considerations for modelling and managing treatment wetlands in the Canadian Arctic. In Advances in the Ecological Modelling and Ecological Engineering Applied on Lakes and Wetlands; Jørgensen, S.E., Chang, N.B., Fuliu, X., Eds.; Elsevier: Amsterdam, the Netherlands, 2014; in press. [Google Scholar]
  36. Canadian Council of Ministers of the Environment. Canada-wide Strategy for the Management of Municipal Wastewater Effluent. Whitehorse, Yukon, 2009. Available online: http://www.ccme.ca/assets/pdf/cda_wide_strategy_mwwe_final_e.pdf (accessed on 1 October 2013).
  37. Balch, G.C.; Wootton, B.C.; Yates, C.N. Treatment Wetlands in Canada’s Arctic: Final Report; Centre for Alternative Wastewater Treatment, Fleming College for Environment Canada and Department of National Defense: Lindsay, Canada, 2013; pp. 1–308. [Google Scholar]
  38. Yates, C.N.; Wootton, B.C.; Balch, G.C. Framing the need or application of ecological engineering in Arctic environments. In Advances in the Ecological Modelling and Ecological Engineering Applied on Lakes and Wetlands; Jørgensen, S.E., Chang, N.B., Fuliu, X., Eds.; Elsevier: Amsterdam, the Netherlands, 2014; in press. [Google Scholar]
  39. Challen-Urbanic, J. Pond Inlet and Community Lab Report—Environment Canada. Available online: http://www.mvlwb.ca/Boards/NRWG/Shared%20Documents/REPORTS%20AND%20STUDIES/AWWG%20Sampling%20Reports/Detailed%20Community%20Report-%20Pond%20Inlet%20(2009).pdf (accessed on 1 October 2013).
  40. Johnson, K.; Wilson, A. Sewage treatment systems in communities and camps of the Northwest Territories and Nunavut. In Proceedings of 1st Cold Regions Specialty Conference of the Canadian Society for Civil Engineering, Edmonton, Alberta, Canada, 2 June 1999.
  41. Kadlec, R.H.; Johnson, K. Cambridge bay, Nunavut, wetland planning study. J. North. Territ. Water Waste Assoc. 2008, 9, 30–33. [Google Scholar]
  42. Kadlec, R.H. The Houghton lake wetland treatment project. Ecol. Eng. 2009, 35, 1285–1286. [Google Scholar] [CrossRef]
  43. Kadlec, R.H. Wastewater treatment at the Houghton lake wetland: Hydrology and water quality. Ecol. Eng. 2009, 35, 1287–1311. [Google Scholar] [CrossRef]
  44. Kadlec, R.H. Wastewater treatment at the Houghton lake wetland: Soils and sediments. Ecol. Eng. 2009, 35, 1333–1348. [Google Scholar] [CrossRef]
  45. Knox, A.K.; Dahgren, R.A.; Tate, K.W.; Atwill, E.R. Efficacy of natural wetlands to retain nutrient, sediment and microbial pollutants. J. Environ. Qual. 2008, 37, 1837–1846. [Google Scholar] [CrossRef]
  46. Alberta Environment. Guidelines for the approval and design of natural and constructed treatment wetlands for water quality improvements; Report No. t/518; Municipal Program Development Branch, Environmental Sciences Division: Edmonton, Canada, 2000. [Google Scholar]
  47. Cooke, J.G. Nutrient transformations in a natural wetland receiving sewage effluent and the implications for waste treatment. Water Sci. Tech. 1994, 29, 209–217. [Google Scholar]
  48. Hammer, D.A.; Bastian, R.K. Wetland Ecosystems: Natural Water Purifers? Lewis Publishers: Chelsea, MI, USA, 1989. [Google Scholar]
  49. Mack, M.C.; Schuur, E.A.G.; Bret-Harte, M.S.; Shaver, G.R.; Chapin, F.S. Ecosystem carbon storage in arctic tundra reduced by long-term nutrient fertilization. Nature 2004, 431, 440–443. [Google Scholar]
  50. Shaver, G.R.; Chapin, F.S. Response to fertilization by various plant-growth forms in an Alaskan tundra—Nutrient accumulation and growth. Ecology 1980, 61, 662–675. [Google Scholar]
  51. Shaver, G.R.; Chapin, F.S. Long-term responses to factorial, NPK fertilizer treatment by Alaskan wet and moist tundra sedge species. Ecography 1995, 18, 259–275. [Google Scholar]
  52. Gough, L.; Wookey, P.A.; Shaver, G.R. Dry heath arctic tundra responses to long-term nutrient and light manipulation. Arct. Antarct. Alp. Res. 2002, 34, 211–218. [Google Scholar] [CrossRef]

