1. Introduction
Rainwater harvesting is the process of capturing, conveying, and storing rainwater for future use. The concept of rainwater harvesting can be dated back over 4000 years. Ancient societies have developed various rainwater harvesting technologies and constructions such as agricultural dams, runoff control methods, and reservoir or cistern construction in urbanized areas [
1]. Water captured by rainwater harvesting systems provides a main source of portable water, supplement source of potable water, and a supplement source of non-portable water (
i.e., toilet flushing, irrigation and car washing). The use of rainwater harvesting systems occurs mainly for non-portable water supplies but it has recently become an important alternative water resource to address the water shortage in urban and sub-urban areas among developed countries [
2,
3]. Rainwater harvesting systems can be easily implemented at the home, commercial, and community levels [
4,
5]. The application of rainwater harvesting in both rural and urban areas of developing countries is well documented [
6,
7,
8].
Taiwan is an island located near the south eastern side of mainland China. The average annual rainfall in Taiwan is 2457 mm, which is 2.6 times the global average. Because of the dense population (640 persons per km
2), the average amount of water available per capita per year in Taiwan is only 4074 m
3, which is approximately one fifth of the world average [
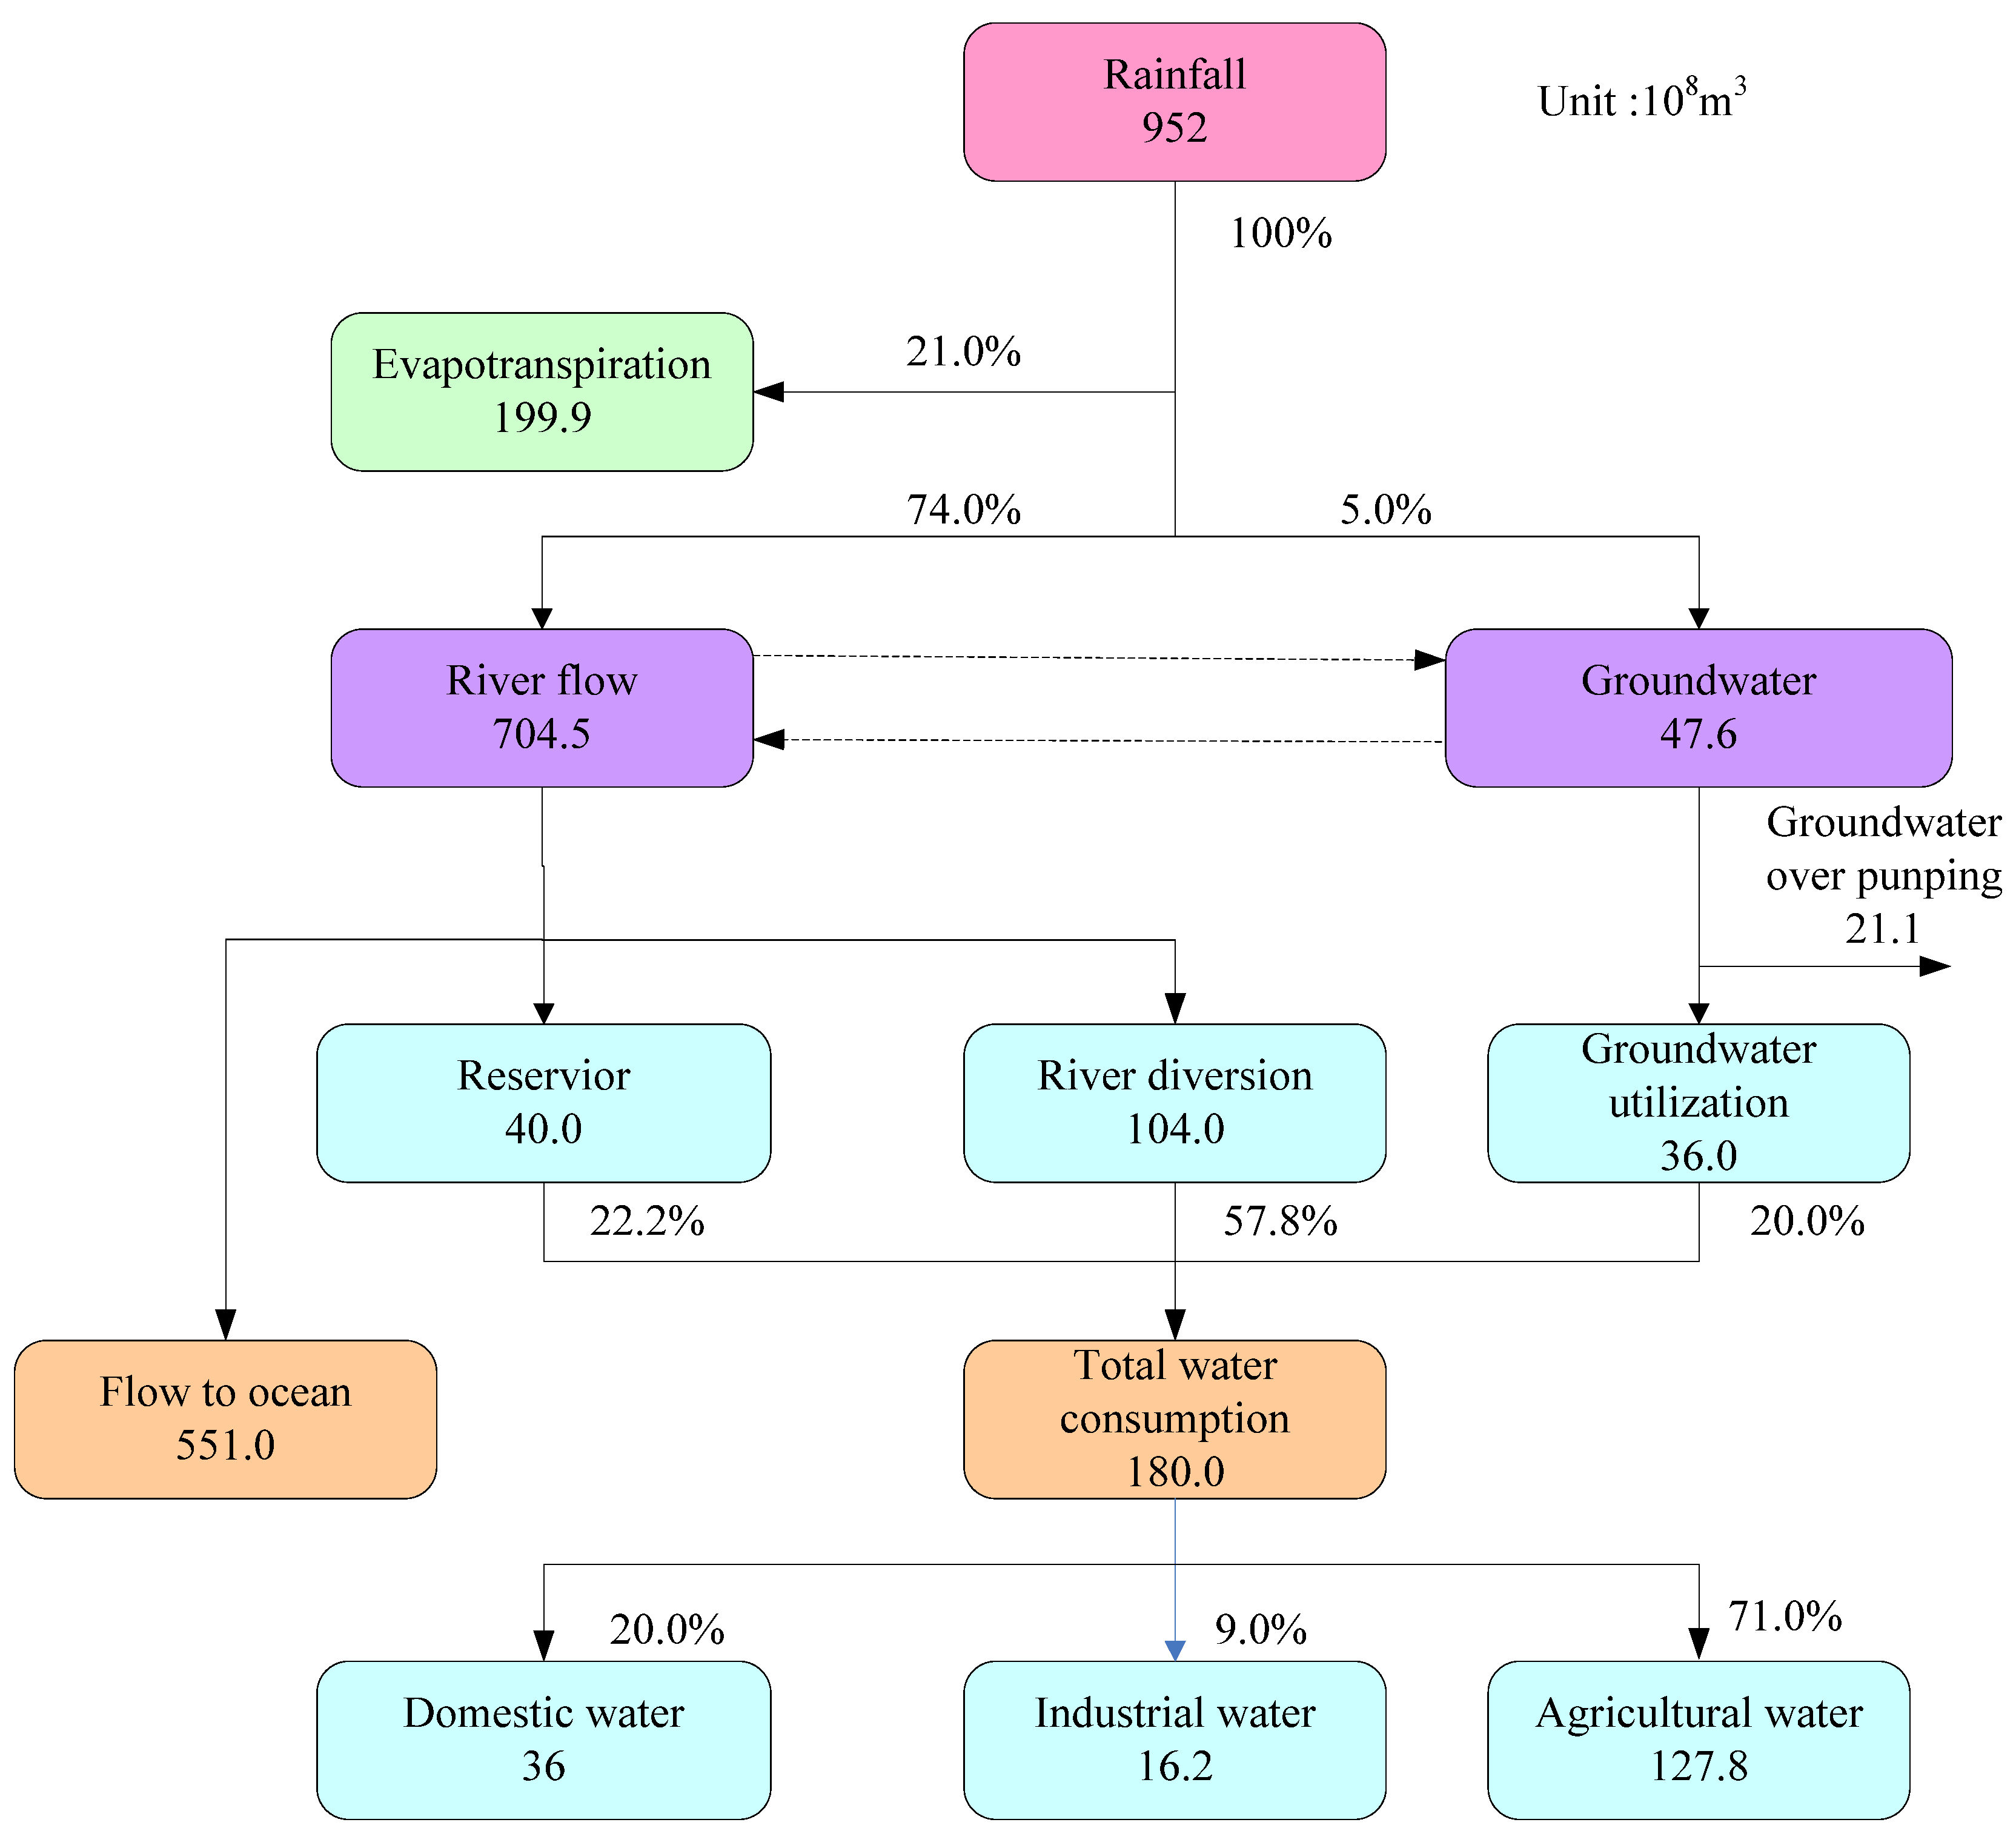
9]. Therefore, Taiwan is ranked as the 18th most water scarce country in the world. This means that the country may face water shortages in the future. The Taiwanese government has tried to increase water resources by using traditional methods, such as dam construction and groundwater development. The schematic diagram of the water balance in Taiwan in
Figure 1 shows that 21% of rainfall evaporates, 74% of rainfall flows into rivers (of which 78% flows into the ocean), and only 5% of rainfall returns to the groundwater. However, because the steep slopes of rivers cause severe sedimentation problems, the effective storage volume of the reservoirs is decreasing at a rate of 1.5 million m
3 per year. In addition, geographic conditions, the non-uniform distribution of rainfall during a year, and increasing consciousness of environmental protection prevent construction of new dams at suitable locations. Recent over-pumping of groundwater has resulted in serious land subsidence in coastal areas. Therefore, groundwater development is not an appropriate solution.
Hence, developing alternative water sources has become a critical issue for sustainable development in Taiwan. In 2009, the Taiwan Water Resources Agency in the Ministry of Economic Affairs initiated new water resource development regulations, which included wastewater reuse, seawater desalination, and rainwater harvesting as alternative water resources for domestic water supply. These regulations are listed in the Taiwanese Water Law. A green building policy has been developed, which has included rooftop rainwater harvesting as a water resource indicator for green buildings since 2003 [
10]. The policy requires that all new buildings with a total floor area greater than 10,000 m
2 must install domestic rainwater harvesting (DRWH) equipment to supply at least 5% of the total water required by the building. Therefore, to assist water authorities and urban designers to integrate DRWH systems into water resources planning, estimation of DRWH potential on the residential sector at regional a/o national levels is needed.
Figure 1.
Schematic diagram of water balance in Taiwan.
Figure 1.
Schematic diagram of water balance in Taiwan.
DRWH systems are mainly implemented at a building scale. Various methods exist for calculating water savings and for designing the storage capacity of buildings by setting up DRWH systems [
7,
11,
12,
13,
14,
15,
16,
17,
18,
19,
20,
21,
22,
23].
Few studies have evaluated rainwater potential at an urban or regional scale [
5,
24,
25,
26,
27]. Ghisi
et al. [
25] investigated five areas (including 62 cities) with different geographical conditions in southern Brazil. Rainwater potential was evaluated by considering the types of building, population, and water replacement rate. The Texas Rainwater Harvesting Evaluation Committee [
26] investigated the rainwater potential of the state of Texas by investigating the total useable roof area of houses and apartments and the annual average rainfall of Texan districts. They only accounted for rainwater collection by using a single indicator, rainwater harvesting potential (RHP), which is calculated from the total roof area, runoff coefficient, and average annual rainfall of a district. Belmeziti
et al. [
5] proposed a novel method that entailed grouping buildings in a municipality into several building types. Each type comprised a set of buildings with the same rainwater use scenario. The rainwater potential for a type of building was then calculated for an equivalent building.
The RHP calculation tends to overestimate the amount of available rainwater because it only considers the rainfall component and neglects other key components of a rainwater harvesting system, namely, storage, usage, economics, and the environment [
28,
29,
30,
31]. Because of these components, the actual amount of available rainwater only represents a fraction of the RHP.
The purpose of this study is to develop a set of universal definitions for potential DRWH that can be used to quantify rainwater as a new obtainable water resource at national/regional levels. This set of definitions covers more primary influencing factors including hydrology, building, economy and ecology. Base on this new set of definitions, a methodology aims to measure the national DRWH potential in the residential sector is also developed by adopting national land use databases and an existing model that assesses the DRWH potential of a single building.
2. Classification and Definition of Domestic Rainwater Harvesting Potential
In order to calculate the potential RWH at a household level, previous scholars have proposed different definitions to explain the potential DRWH. In addition, various methodologies have been established to measure potential water savings [
5,
6,
29,
32]. While these definitions and methodologies often were used to explain similar concepts, the lack of universal agreement on the terminologies can be quite confusing. Moreover, with the exceptions of Belmeziti
et al. [
5] and Ghisi
et al. [
25], most of these definitions and methodologies concern more about the potential for potable water saving within a building. While Belmeziti
et al. [
5] and Ghisi
et al. [
25] stressed on the urban and regional scales, there is no universal agreement on the terminology.
To avoid confusion, we adopt a universal definition of potential DRWH and the methodology for estimating the potential DRWH. This differs with Belmeziti’s approach, as our calculation concerns only the residential sector. In this paper, rainwater harvesting is recognized as a new alternative water resource and the definition of potential DRWH should have different definition from the view point of supply-side management. To assess the potential DRWH at national level, the definition of potential DRHW and the methodology for estimating the potential DRWH in the residential sector should focus more on regional scale as opposed to on a household level.
Factors that influence DRWH potential can be grouped into the following categories: climatic, building characteristic, economic, and ecological factors. The quantity of precipitation is the most crucial of all the climatic factors. The roof area, runoff coefficient, and storage capacity, which determine the amount of rainwater collected, are building characteristics. Several factors are related to the economic and ecological aspects, such as the investment cost of rainwater systems, rainwater demand, water collection efficiency, and downstream impact on the ecosystem. More resources and effort are required to consider more factors. For practical purposes, we only considered the precipitation quantity, runoff coefficient, type of building, roof area, storage capacity, number of residents, rainwater collection efficiency, and impact on downstream river flow. Three concepts are relevant to the quantification of DRWH potential, namely, the theoretical, available, and environmental bearable potential. These types of potential are defined in the following sections.
2.1. Theoretical Potential of Domestic Rainwater Harvesting
Theoretical potential refers to the maximal amount of total collectable rainwater in a DRWH system. All rainwater cannot be harvested, only the precipitation that can be collected on a roof can be harvested. Hence, the climatic and building characteristic aspects of the factors that influence DRWH were considered without the economic and ecological aspects. Theoretical potential can be considered and defined using the following formula:
where
Vt is the DRWH theoretical potential (m
3);
Rij is the average annual rainfall in region
i and zone
j (mm);
Aij is the roof area in region
i and zone
j (m
2);
C is the average runoff coefficient; and
n and
k are the total numbers of region and zone, respectively.
2.2. Available Potential of Domestic Rainwater Harvesting
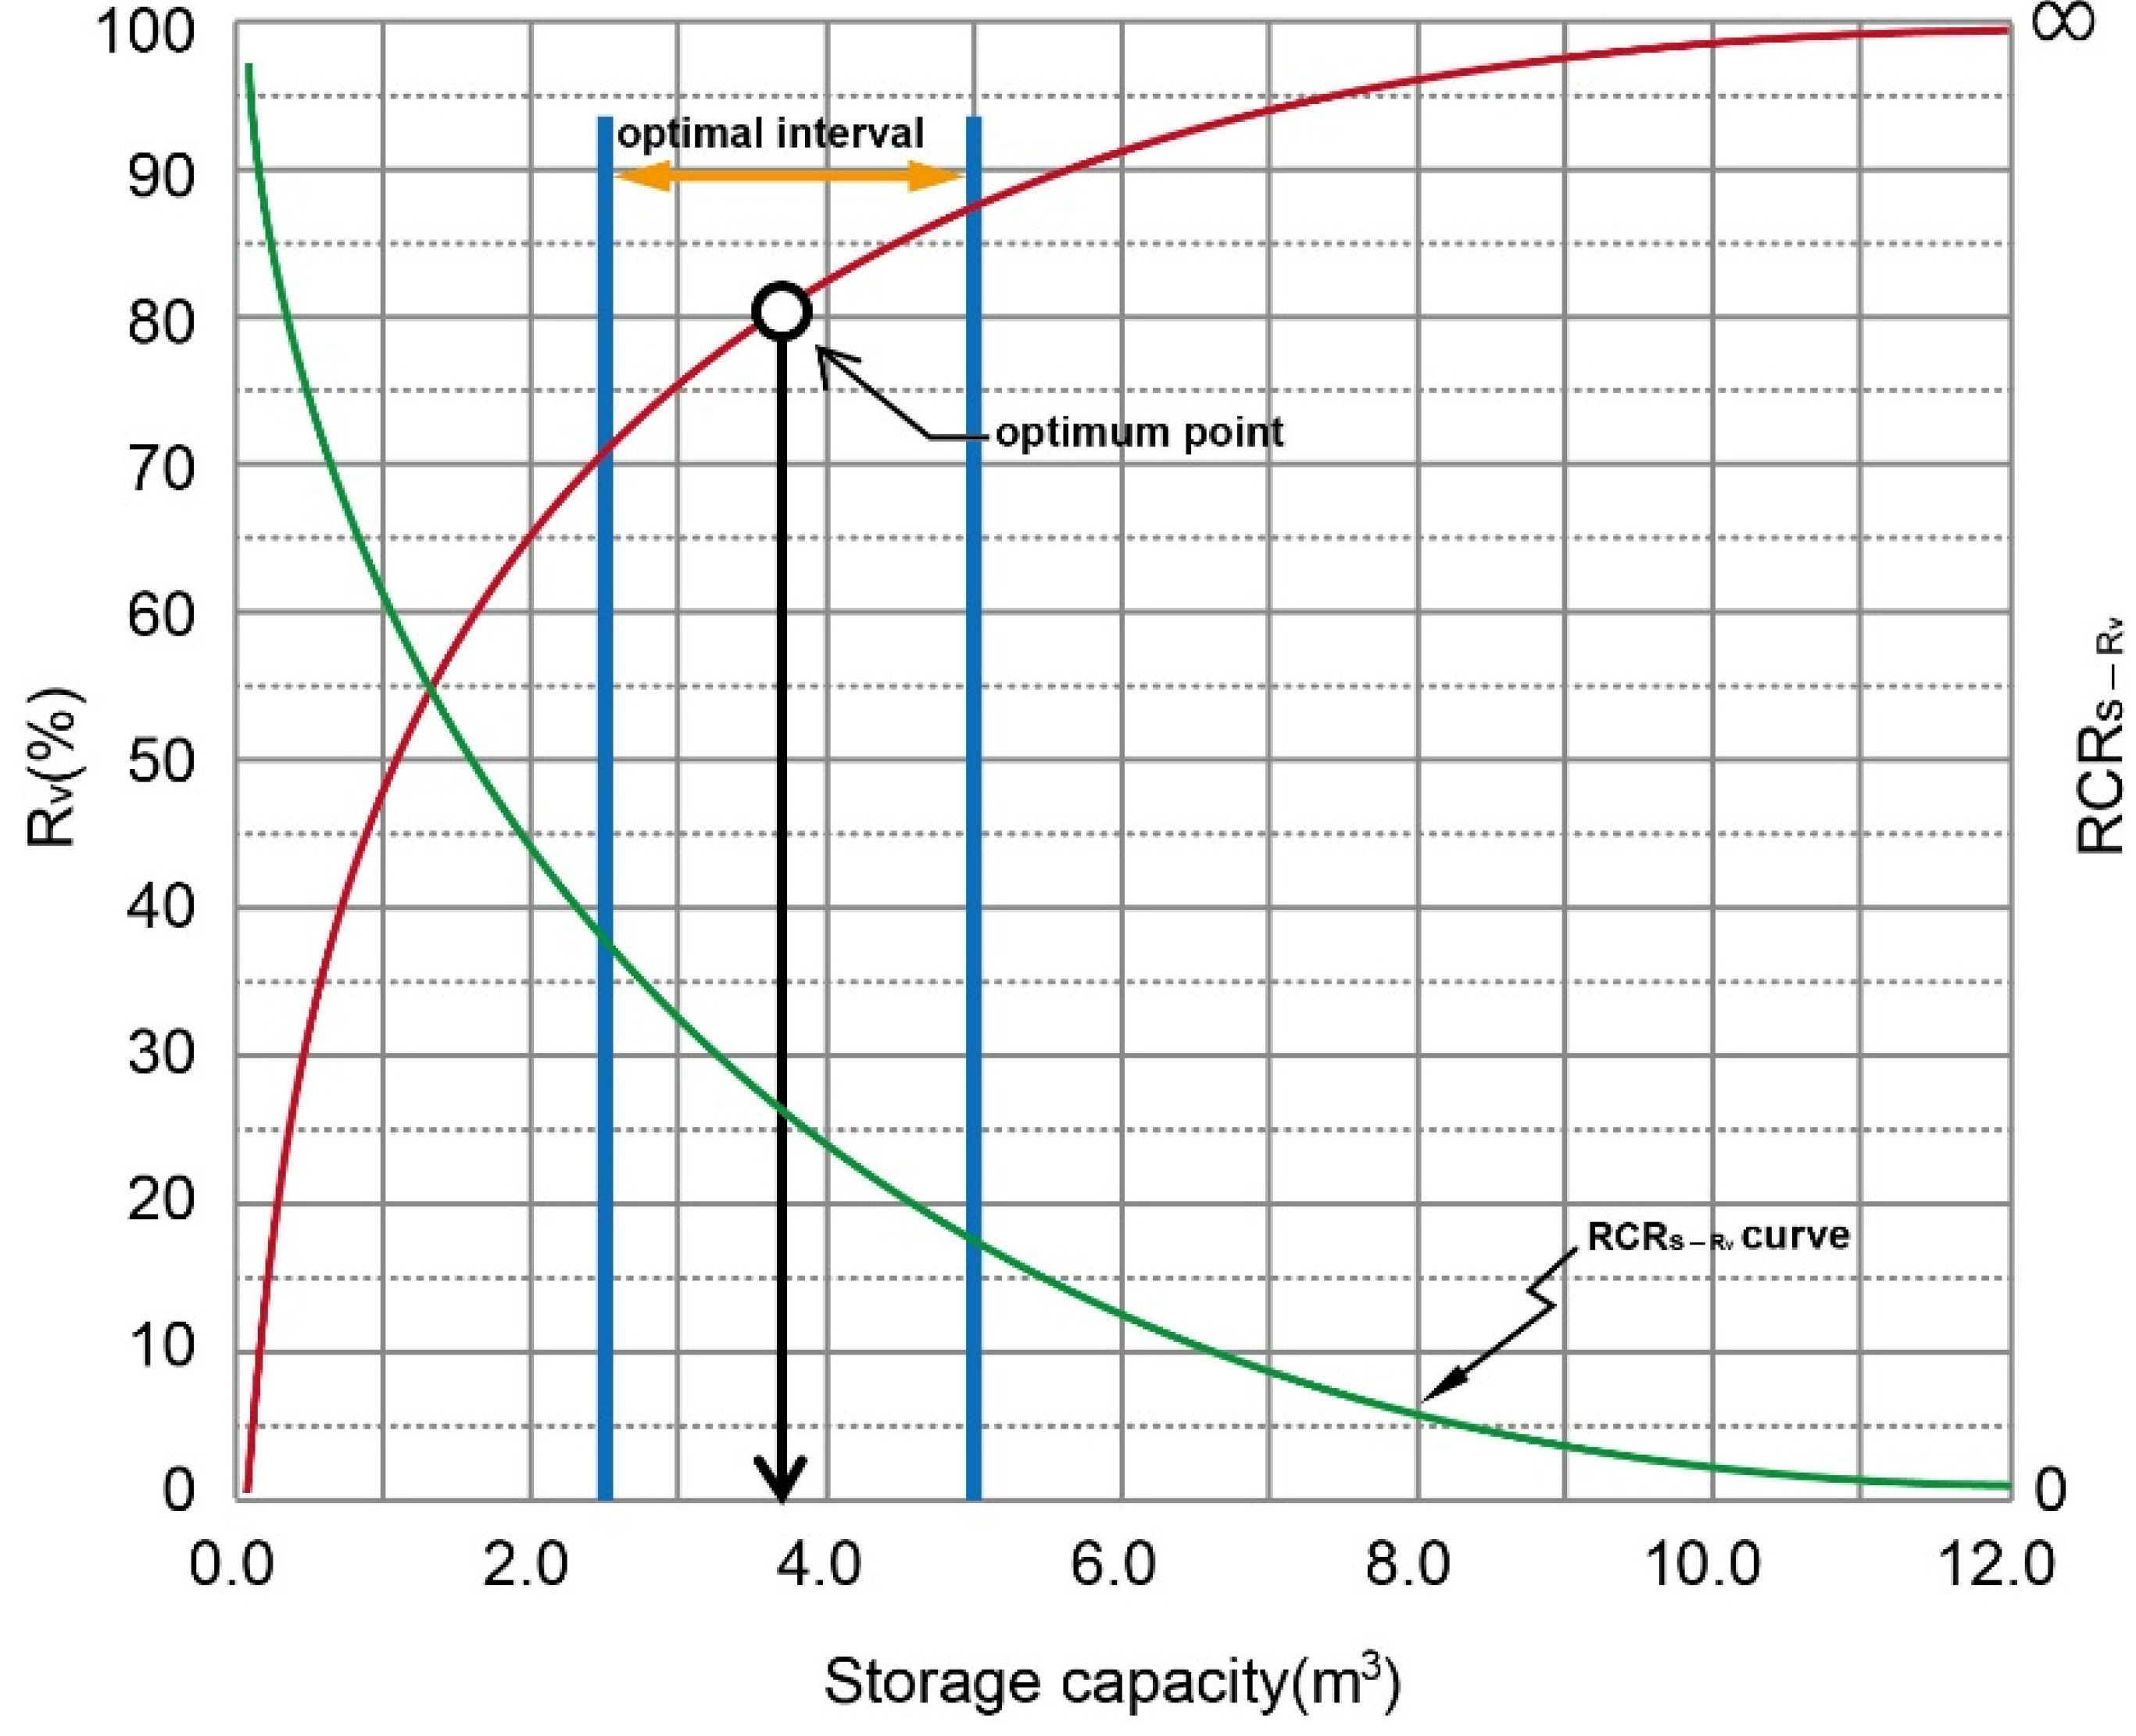
Not all harvested rainwater can be used because of storage capacity limitations, rainwater demand, and rainwater collection efficiency. Inadequate storage volume also allows water to be wasted. Rainwater that is collected in a storage tank for consumption under optimal efficiency of rainwater use conditions is referred to as the DRWH available potential. The curve, R
v (volumetric reliability = the ratio of actual rainwater supply to demand) compared to the storage capacity of selected typical buildings, was used to determine the optimal efficiency of rainwater use. Therefore, available potential is calculated using the following formulae:
where
Va is the DRWH available potential (m
3) and ϕ
ij is the percentage of total rainwater use at optimal point R
v compared to the storage capacity curve in region
i and zone
j.
2.3. Environmental Bearable Potential of Domestic Rainwater Harvesting
Both the theoretical and available potential of a DRWH system are mainly considered at a building scale. Harvested rainwater is owned and used by homeowners. However, when DRWH systems are installed at a regional or national scale, surface runoff is reduced downstream, which affects the ecological system and water downstream of the systems. Therefore, the impact of DRWH on water resource systems requires broader considerations. The environmental bearable potential of DRWH combines the total roof area percentage with available potential DRWH. The environmental bearable potential of DRWH is defined as:
where
Vp is the environmental bearable potential of DRWH (m
3) and
rij is the percentage of the total roof area used in region
i and zone
j.
3. Methodology for Assessing the Potential of Domestic Rainwater Harvesting
To assess the potential of DRWH, the average annual rainfall, roof area, percentage of rainwater use at the maximal point of R
v compared to the storage capacity curve, and percentage of total roof area in each zone and region must be determined. Taiwan has four administrative regions: the northern, central, southern, and eastern administrative regions. For practical purposes, each region was classified into several zones according to rainfall level characteristics and administrative districts. The acquired rainfall level classification represents homogeneous rainfall intensities and durations. The average annual rainfall for each zone and region was then estimated. To estimate the roof area in each zone and region, the available data, required manpower, and accuracy of the calculation must be considered. Three methods were selected and compared at the sample site. The most favorable method was chosen and applied to estimate the national roof area. The runoff coefficient obtained from the experimental results was used. The average ratio of the percentage of rainwater use to the total rainwater harvested at the optimal point for selecting buildings typical to each zone and region was obtained by comparing the R
v curve to the storage capacity. The selected percentages of total roof areas and their impact on downstream streamflow were assessed.
Figure 2 shows the general framework used for estimating the DRWH potential.
Figure 2.
Framework for estimating rainwater potential of DRWH.
Figure 2.
Framework for estimating rainwater potential of DRWH.
3.1. Rainfall Zoning
Rainfall distribution in Taiwan decreases from the northeast to the southwest, and the average annual rainfall is 4800 mm on the windward side of the northeast of the country. Taiwan has an average annual rainfall of 2800 mm in the north, 1820 mm in the center, 2162 mm in the south, and 2122 mm in the east. Because of the effects of the topography of Taiwan, rainfall distribution varies significantly.
The rainfall distribution and amount exert the most significant effects on the potential of a DRWH system. Traditionally, studies on rainwater harvesting system design and water saving potential have used the point concept and focused on rainfall station records. For assessing the potential of DRWH at a national scale, rainfall station records based on the point concept must be converted to those based on the spatial concept. Regions must be further divided into smaller zones according to similar rainfall levels. However, few studies have mentioned the influence of regional rainfall levels. Huang [
33] used a non-hierarchical cluster method to classify northern Taiwan into four zones according to rainfall level characteristics by using the average annual 10-day rainfall distribution at rainfall stations, and developed a regional dimensionless curve for designing storage capacity. Cheng and Liao [
34] proposed a two-step cluster analysis method to classify northern Taiwan into several zones according to rainfall level characteristics and spatial continuity to test the efficiencies of potable water savings in an identical rainfall cluster. In this paper, the two-step cluster analysis method is used and the average annual 10-day rainfall distribution at rainfall stations is treated as a single variable.
3.2. Roof Area Estimation
All countries consist of urban and rural areas that generally include a significant number of buildings. Calculating the roof area of each of these buildings to aggregate the results to a national scale is a time-consuming and challenging task, necessitating the development of another method. The National Land Surveying and Mapping Center in the Ministry of Interior maintains land use classification database [
35] and Department of Land Administration in the Ministry of Interior maintains cadastral transcript databases [
36]. Land use classification databases, which are exported as JPG files of maps, provide information on 22 land use categories (including residential, industrial, business, agricultural, road, nature conservation, and school land) and their building coverage ratios (BCRs, defined as the ratio of the building area to the construction site area) at urban area but four land use classifications at rural area. Cadastral transcripts databases, which are exported as AutoCAD files, provide more detailed information on buildings, such as the building area, construction material, and number of floors. Recently, 3S (global positioning system (GPS), geographic information system (GIS), and remote sensing (RS)) technologies have been widely used for land use classification. For example, satellite images and LiDAR elevation data were applied to the supervised maximal likelihood method, and aerial photography combined with ERDAS IMAGINE was used for automated land utilization interpretation [
37,
38].
In this section, we attempt to select a new method for estimating the national roof area by combining GIS technology, a land use database, and aerial photography. We proposed three methods:
- ●
GIS combined with the land use classification database;
- ●
GIS combined with the cadastral transcript database; and
- ●
GIS combined with aerial photography.
These methods were examined and compared at a sample site. The most favorable method was selected and applied in this study.
3.2.1. Methods Description
Method 1. GIS Combined with the Land Use Classification Database
A GIS was used as a platform for estimating the roof area of residential areas in each region or rainfall region by using attribute and spatial data from the land use classification database. The roof area of buildings in residential areas was then simply estimated by multiplying the residential area by its BCR.
Method 2. GIS Combined with the Cadastral Transcript Database
The statistical analysis capability of a GIS was used with the cadastral transcript database to directly calculate the roof area of each building in each region and rainfall zone.
Method 3. GIS Combined with Aerial Photography
To improve the accuracy of classification, Environment for Visualizing Images (ENVI) software from ITT Exelis was used for sample training and land use classification by using supervised classification method and aerial photography. Land was classified as green land, bare land, water, a general impervious area, and the roof area of a building by using the maximal similarity method. For uncertain and shadowy areas, field investigation and judgment were required. The land utilization interpretation results were then imported to a GIS by using the subroutine developed by in this study to establish the attribute data and calculate the roof area.
Indicators of overall accuracy and a Kappa coefficient from land utilization interpretation results are commonly used to check classification accuracy. Overall accuracy is defined as the ratio of the number of correct classifications in all the land use categories to the total area at the sample site. The Kappa coefficient is defined in Equation (6). Its value ranges from −1 to 1. In this paper, the classification results are acceptable if the overall accuracy is more than 0.7 and the Kappa coefficient is greater than 0.6 [
38].
where
Po is the observed level of agreement, which represents the probability that the real land use and interpretation results are the same, and
Pc is the chance agreement, which represents the probability that the real land use and expected interpretation results are similar.
3.2.2. Comparison of the Three Methods
The steps and results were compared and analyzed by using the sample site data.
Step 1. Sample site selection
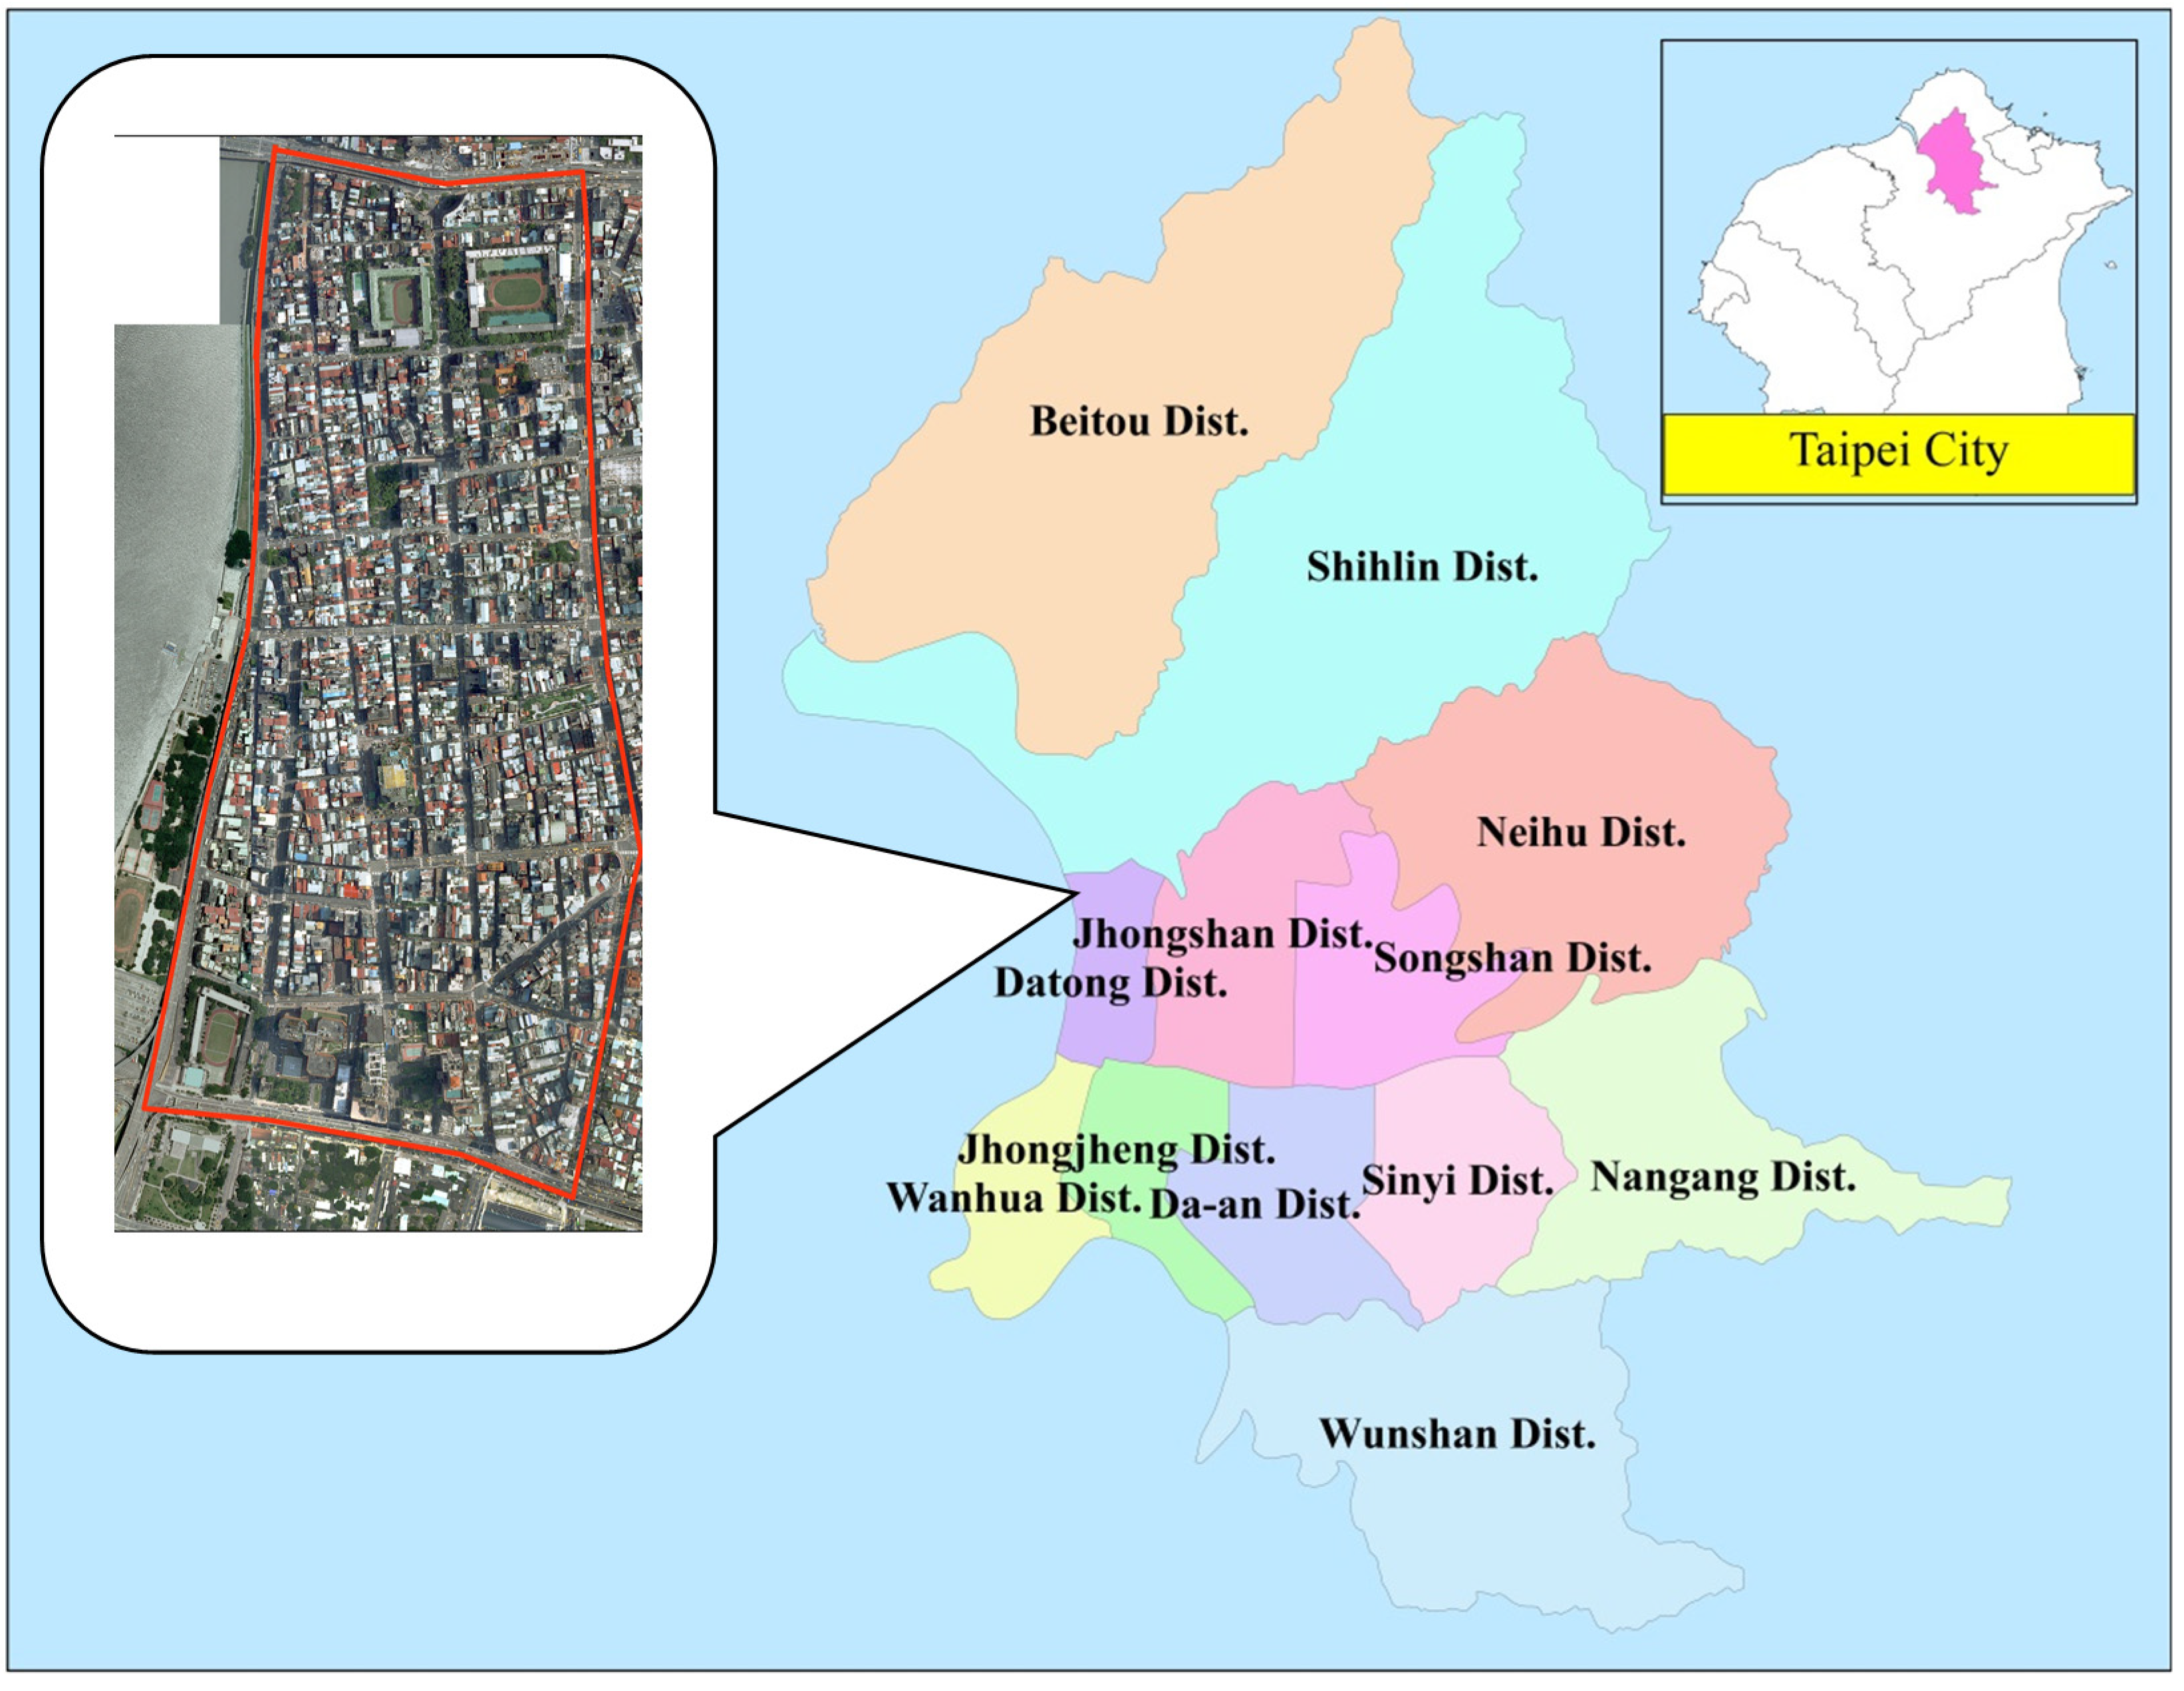
The Datong District in Taipei City, which was one of the earliest developed districts in the Taipei basin, was selected as a sample site, as shown in
Figure 3. It is located in the west of Taipei city and is a fully developed area with high population density of 127,092, according to the 2011 census data. It is classified into residential and commercial areas with a land area of 5.6815 km
2 that covers seven neighborhoods: Dayou, Yongle, Yuquan, Yanping, Nanfang, Jiengong, and Chaoyang.
Figure 3.
Map of Sample Site at Datong District, Taipei City.
Figure 3.
Map of Sample Site at Datong District, Taipei City.
Step 2. Data collection
The 2003 land use classification database with a scale of 1:5000 and the 2008 cadastral transcript database with a scale of 1:1000 were provided by the National Land Surveying and Mapping Center and Department of Land Administration, respectively; and aerial photography with a scale of 1:2500 and resolution of 20 cm published in 2010 was provided by the Department of Urban Development, Taipei City Government [
39]. Version 9.3 of a GIS system was used.
Step 3. Method selection
The roof areas estimated by the three methods were 42.05, 43.66, and 42.87 hectares, respectively. It was difficult to determine which result was the most accurate.
Table 1 shows a comparison of these methods from four aspects: data update frequency, calculation difficulty, time required, and purchasing cost of database. The land use classification database requires the longest time to update; the cadastral land use database is updated on demand; and aerial photography is updated every three years. Method 1 was the easiest method for estimating the roof area; Method 2 required complex computations based on buildings; and Method 3 required a training sample. Method 2 was the most time consuming and Method 1 had the lowest purchasing cost. Method 3 is suited to large areas with sufficient time and budgetary resources. Method 2 is appropriate when funding or manpower is low, but data are difficult and time consuming to obtain. In summary, Method 1 is superior to the other two methods based on all aspects. Therefore, we used Method 1 in the following roof area estimation.
Table 1.
Comparison among three different methods for selected items.
Table 1.
Comparison among three different methods for selected items.
| Methods | Data Update Frequency | Calculation Difficulty | Time Required | Purchasing Cost of Database |
|---|
| 1 | Land use classification database updated every 25 years | Simple | Short | Low |
| 2 | Cadastral transcripts database updated infrequent and on demand. | Complex | Long | Medium |
| 3 | Aerial photography (Remote sensing image) updated every 3 years | Need training sample | Short | High |
3.3. Runoff Coefficient (C)
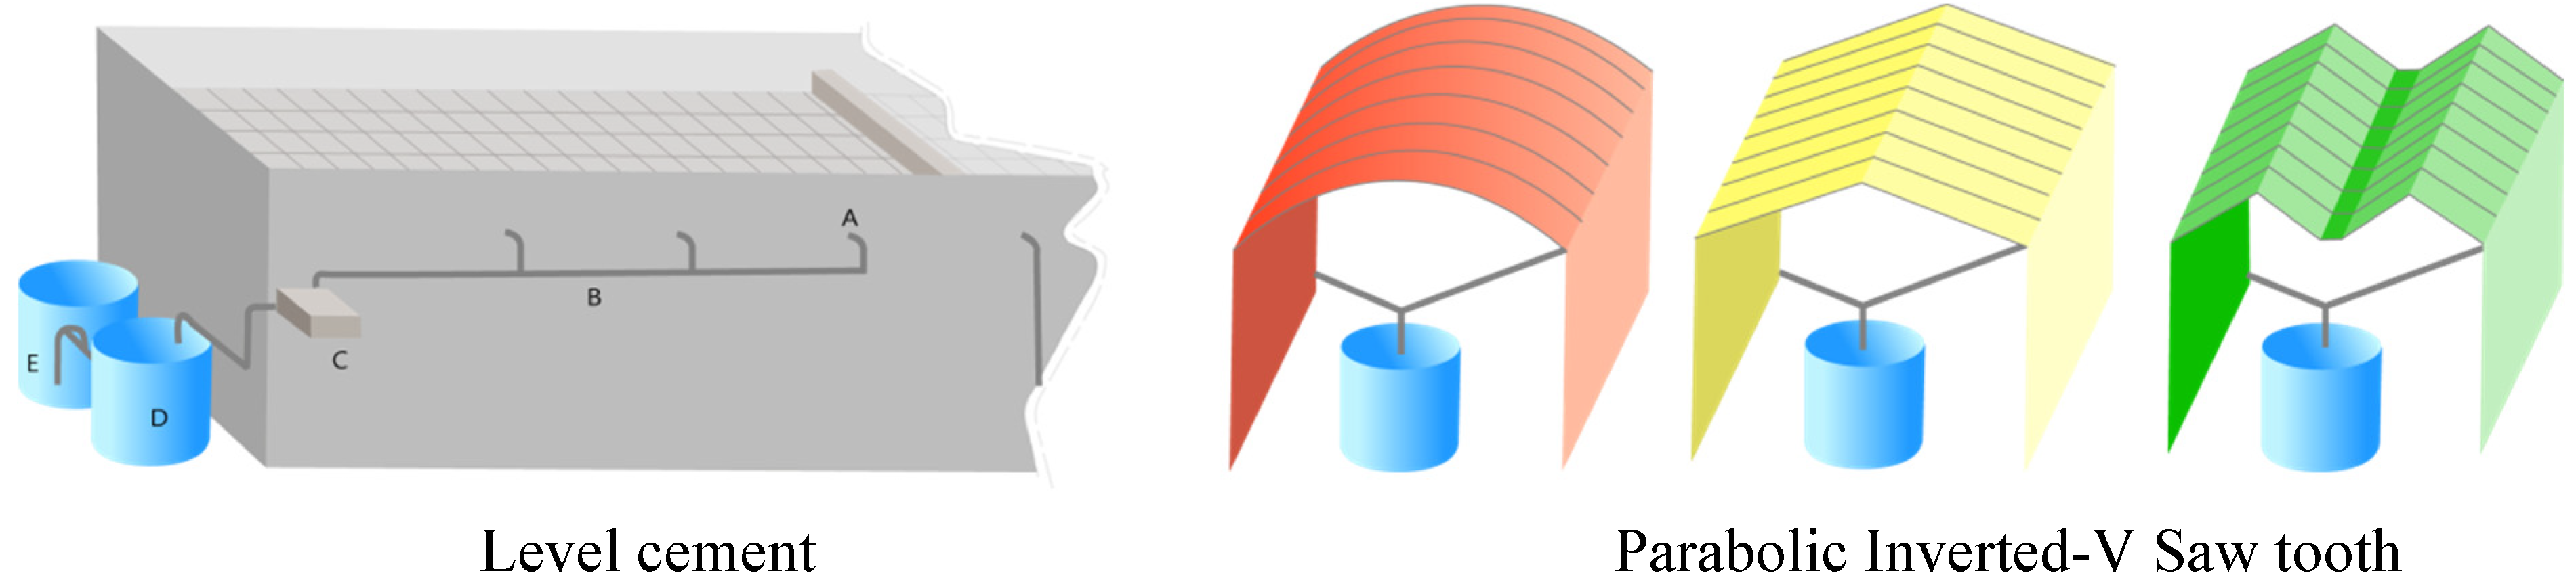
A field experiment was conducted on the campus of the National Taiwan Ocean University to more precisely determine the runoff coefficients (C) for four types of roof. The most commonly used roofs in Taiwan are the inverted-V (iron sheet and frame), level cement, parabolic, and saw tooth roof, as shown in
Figure 4.
Table 2 shows the statistical characteristics of the runoff coefficients. Runoff coefficient increases as the amount of rainfall increases. However, it turns into a constant value after the certain rainfall value for all roof types. All of the roof types exhibited similar average C values. Therefore a single value of C (0.82) is used hereafter.
Figure 4.
Four different roof types.
Figure 4.
Four different roof types.
Table 2.
Variation of C value for four types of roof.
Table 2.
Variation of C value for four types of roof.
| Roof Types | Inverted-V | Level Cement | Saw Tooth | Parabolic |
|---|
| N | 84 | 90 | 79 | 87 |
| 0.82 | 0.81 | 0.83 | 0.81 |
| 0.076 | 0.068 | 0.095 | 0.066 |
3.4. Determining the Percentage of Rainwater Used at the Optimal Point of Rv Compared to the Storage Capacity Curve
The performance of a DRWH system is generally described in terms of reliability. This can either be expressed as the total actual rainwater supply over demand (Rv) or the fraction of time during which demand is fully met (Re).
Liaw and Tsai [
14] recommended the yield before spill algorithm as a release rule for simulating a DRWH system. For small storage capacity and high water demand, R
e cannot be used to determine the reliability of a water supply. In contrast, R
v is available under all circumstances. Consequently, R
v and the daily time interval of rainfall were used in this study. Rainfall data from 50 years were considered to be satisfactory.
Figure 5.
Rv vs. storage capacity curve
Figure 5.
Rv vs. storage capacity curve
To determine the specific rainwater demand, R
v compared to the storage capacity curve was obtained using a simulation model. Technicians use this curve as a decision-making tool for selecting storage capacity and identifying the rainwater supply reliability of their projects.
Figure 5 shows the R
v and storage capacity of a hypothetical rainwater project graphically. If storage capacity is increased, R
v will at first tend to rise fast. It implies that a small change in storage capacity achieves a significant increase in the R
v and larger storage capacity is preferable. However, eventually, a point will be reached where the rate of increase begins to fall. A higher reliability, while preferred by some, costs more. Therefore, establishing a system in both the lower left-hand and upper right-hand corners is economically infeasible. What level of reliability of the rainwater supply for DRWH system should be selected? The optimal point of reliability of rainwater supply should locate on optimal interval curve [
5]. The decision maker then selects an optimal point on this optimal interval curve. Hence, the amount of rainwater used (as a percentage of the total amount of rainwater harvested) can then be estimated.
Rainwater harvesting is a production process [
40]. The basic purpose of production is to convert inputs into a more useful output. The concept of the input vector can be simplified by defining its coordinates as the intermediate products of storage capacity and roof area. Economists usually express the ability of a production process to produce an output vector from an input vector by using a production function, which can be expressed as:
where X is the total input vector and Y is the total output vector.
The criteria must assign a scalar value to each point on the production function. The objective function necessarily depends on both input and output vectors.
The goal of project optimization is to maximize the objective function, u (X, Y), by selecting the best alternative on the production function. Using
Figure 5 as an example, theoretically, an infinite number of trial output vectors produce points that cover the entire area below and to the right of the curve. Because efficient outputs reflect the maximal value for a given input value, they lie along the locus of points bounding the area on the upper left side.
Figure 5 also shows the relationship between ΔR
v (unit increase of R
v) and Δstorage (unit increase of storage), basing on the following equation:
where RCR
S-Rv is the ratio of change rate between ΔR
v and Δstorage.
To increase the efficiency of DRWH, the value of R
v and the RCRS-R
v should be higher. The purpose of decision making is to optimize these two ratios and obtain the maximal objective function of a DRWH system. This can be expressed using the following equations.
Therefore, the optimal point of R
v (or R
v, opt) can be expressed as:
For simplification, the dual objective problem can be simplified as a single objective problem if one of the objectives is treated as a constrain function. The optimal point of Rv value will be obtained when RCRS-Rv value equals to unit.
3.5. Determining the Percentage of the Total Roof Area Used
If the total roof area was used for rainwater collection, the streamflow downstream would substantially decrease, affecting the downstream ecology and environment. However, using the percentage of the total roof area to assess the environmental bearable potential of DRWH is not easy. To estimate the environmental bearable potential of DRWH, three approaches can be considered: integrated water management (IWM) method, minimum ecological water requirements method, and scenarios corresponding to different percentage of roof areas method [
41,
42]. The first two methods require additional information on the watershed and the time consumed to determine the percentage of total roof area used to measure the environmental bearable potential of DRWH. Therefore, for preliminary estimation for the percentage of total roof area used, scenario corresponding to different percentage of roof areas method is preferred and will be applied to the following analysis. Streamflow reduction is described by the percentage of the total roof area used compared with the annual rainfall or the mean annual streamflow discharged.
4. Results and Discussion
The theoretical, available, and environmental bearable potential of DRWH at a regional and rainfall zone scale were estimated and these findings are discussed in the following sections.
4.1. Theoretical DRWH Potential
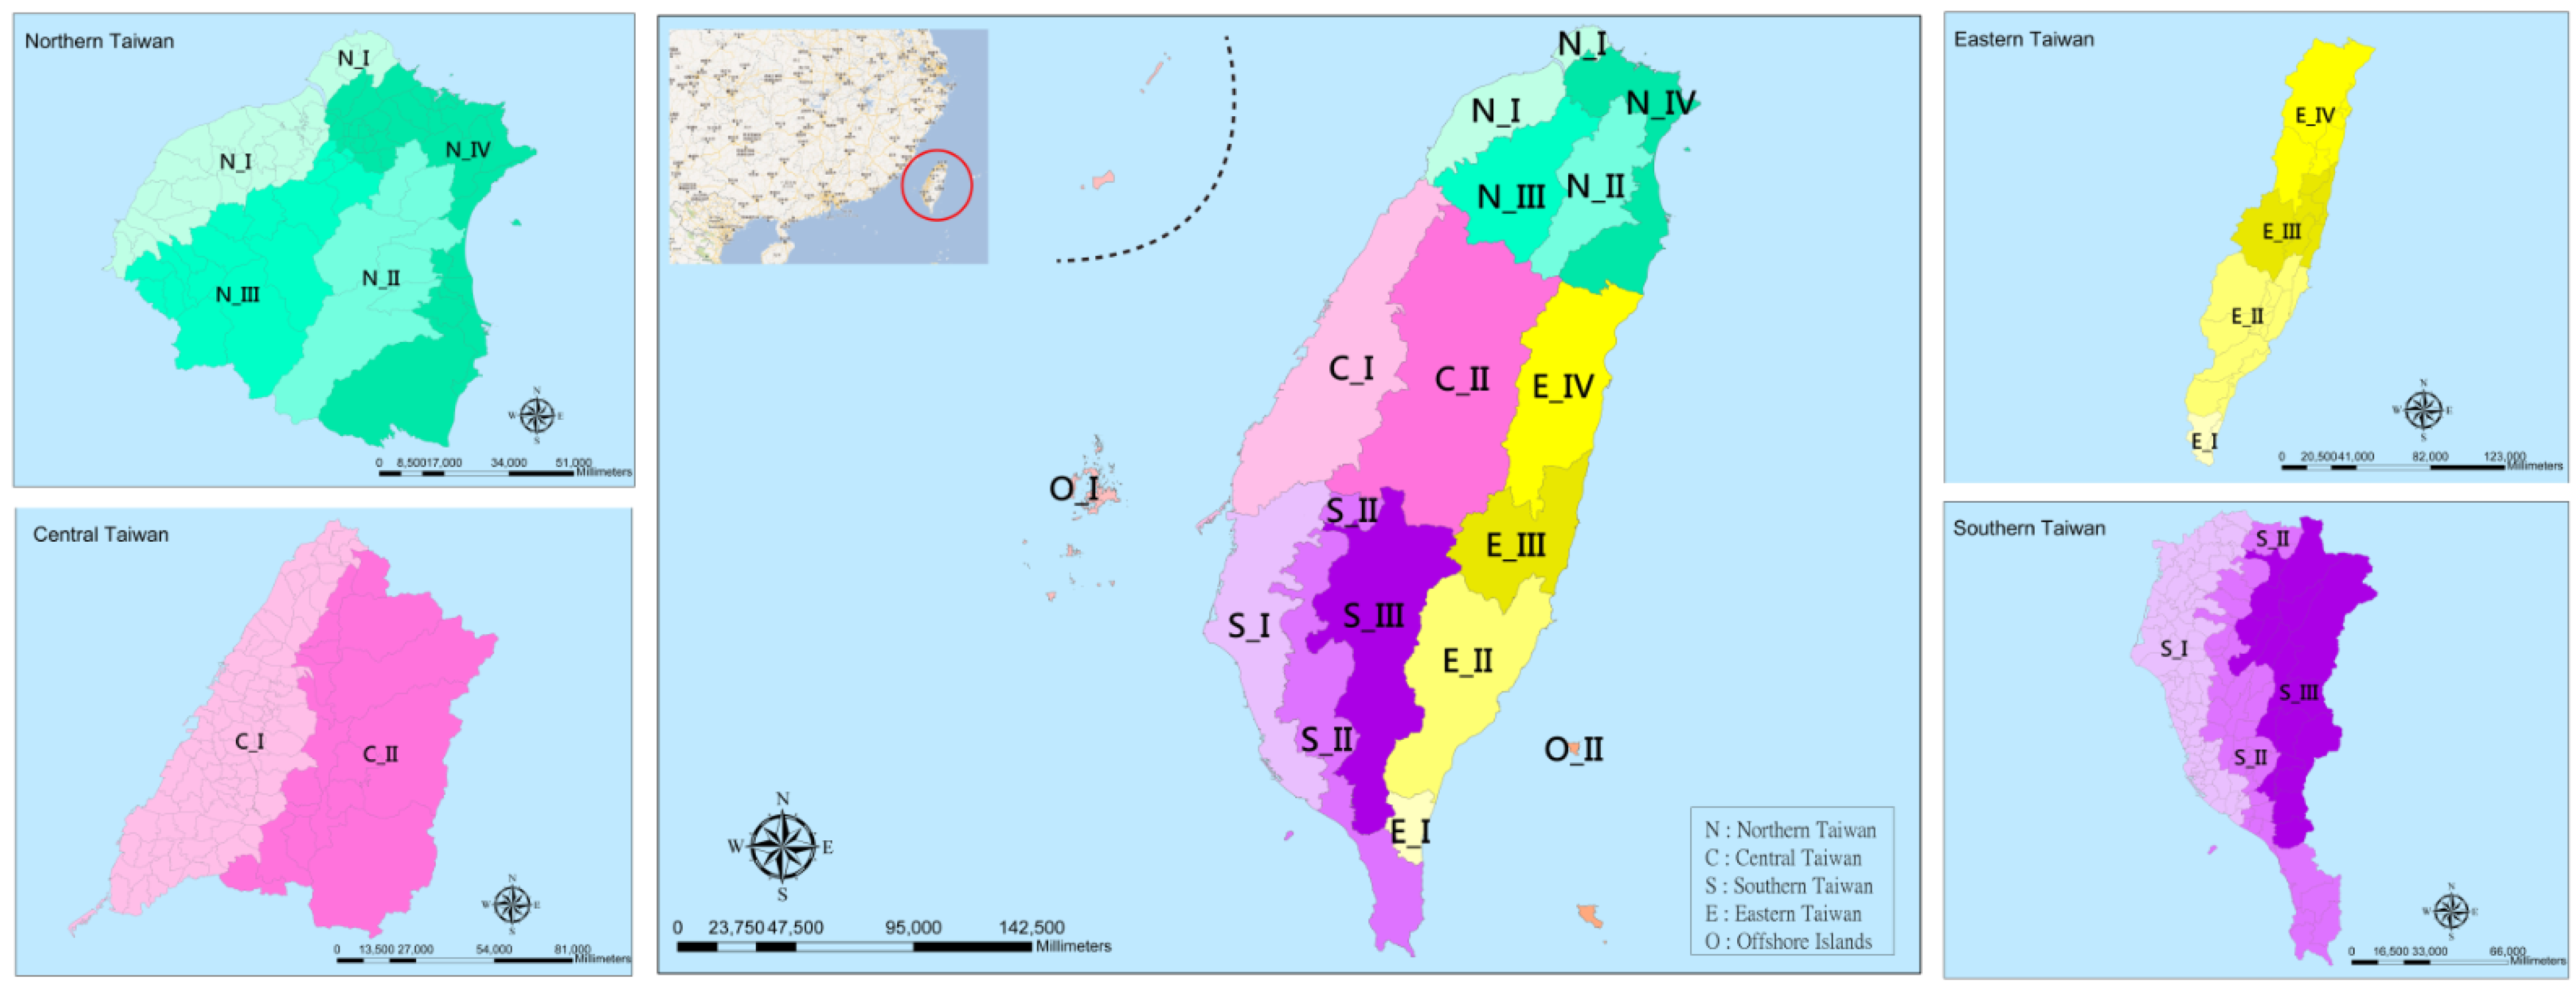
Rainfall data were obtained from the Water Resources Agency in the Ministry of Economic Affairs. Rainfall stations with records for more than 50 years were selected. Fifty-eight rainfall stations were selected from the northern Taiwan, 58 were selected from the central Taiwan, 75 were selected from the southern Taiwan, and 31 were selected from the eastern Taiwan. Taking into account the administrative districts and the average annual 10-day rainfall distribution of the rainfall stations, we divided Taiwan into 15 rainfall zones, as shown in
Figure 6. The average annual rainfall and number of administrative districts relevant to each rainfall zone are shown in
Table 3.
Table 3 shows that the average annual rainfall difference among rainfall zones is even significant in the same region. The average annual rainfall difference between zones I and IV in the northern region was 1697.1 mm, between zones I and II in the central region was 873.3 mm, between zones I and III in the southern region was 1290.4 mm, and between zones I and II in the offshore islands was 2176.8 mm. Rainfall zoning is necessary for more precise estimation of rainwater potential.
Figure 6.
Rainfall zone distribution for national-wide and four regions.
Figure 6.
Rainfall zone distribution for national-wide and four regions.
Table 3.
Average annual rainfall, roof area in urban and rural areas, and administrative districts included in different regions and rainfall zones.
Table 3.
Average annual rainfall, roof area in urban and rural areas, and administrative districts included in different regions and rainfall zones.
| Regions | Rainfall Zone | Average Annual Rainfall | Roof Area in Urban Area | Roof Area in Rural Area | Total | Administrative Districts Included |
|---|
| (mm) | (ha) | (ha) | (ha) | (No.) |
|---|
| North | I | 1792.05 | 11,613.80 | 3087.70 | 14,701.50 | 26 |
| II | 3272.10 | 770.30 | 2855.30 | 3625.60 | 7 |
| III | 2134.00 | 2888.70 | 1457.90 | 4346.60 | 18 |
| IV | 3489.15 | 8551.90 | 1116.40 | 9668.30 | 19 |
| Center | I | 1406.20 | 16,220.30 | 13,343.60 | 29,563.90 | 55 |
| II | 2279.50 | 1140.30 | 3921.60 | 5061.90 | 19 |
| South | I | 1673.80 | 21,982.50 | 3081.90 | 25,064.40 | 55 |
| II | 2328.70 | 3111.70 | 3424.80 | 6536.50 | 39 |
| III | 2964.20 | 280.10 | 3601.30 | 3881.40 | 18 |
| East | I | 2237.80 | 30.80 | 69.90 | 100.70 | 2 |
| II | 2070.90 | 1023.00 | 580.00 | 1603.00 | 12 |
| III | 2723.20 | 408.00 | 378.90 | 786.90 | 6 |
| IV | 2202.40 | 1531.50 | 551.40 | 2082.90 | 7 |
| Offshore islands | I | 927.70 | 1704.40 | 0.00 | 1704.40 | 16 |
| II | 3104.50 | 39.00 | 11.80 | 50.80 | 2 |
| Total | 71,296.30 | 37,482.50 | 108,778.80 | 301 |
Table 3 also shows the roof area of the residential buildings in urban and rural areas that was estimated using the 2003 land use classification database with a scale of 1:5000. In urban areas, the roof area in the northern region was 23,824.7 hectares, 17,360.6 hectares in the central region, 25,374.3 hectares in the southern region, 2993.3 hectares in the eastern region, and 1743.4 hectares in the offshore islands. This adds up to a total of 71,296.3 hectares. In rural areas, the roof area in the northern region was 8517.3 hectares, 17,625.2 hectares in the central region, 10,108 hectares in the southern region, 1580.2 hectares in the eastern region, and 11.8 hectares in the offshore islands. The total roof area was 108,778.8 hectares, which is approximately 3.3% of the total land area of Taiwan.
The theoretical potential of DRWH for each rainfall zone was estimated by considering the runoff coefficient, roof area, and average annual rainfall, as shown in
Table 4. The theoretical rainwater potential of Taiwan is 1763.20 × 10
6 m
3 per year. This accounted for 48.9% of domestic water demand and would satisfy the water requirements of the population of 23 × 10
6 persons at a consumption rate of 210.03 L/d per person, which is more than the toilet flushing and other non-drinking water demand. This potential only includes climatic and building characteristic aspects and neglects economic and ecological aspects, therefore it is probably overestimated.
4.2. Available DRWH Potential
To more precisely calculate the available potential of DRWH on a national scale, the value of ϕ for each zone and region must be estimated. Any region or rainfall zone generally includes a large number of buildings and different types of building. The Directorate General of Budgets, Accounts and Statistics in Executive Yuan has divided buildings into four types: single-story, two-to-five floor, six-to-twelve floor, and thirteen floor and more buildings [
43]. More than 95% of the residents of Taiwan live in apartments built by the public and private sectors. The numbers of each type of building in different regions categorized in this study are shown in
Table 5. The table shows that most people live in two-to-five floor buildings and that more people live in single-story buildings in the south and high-rise buildings in the north. Calculating the ϕ value for each building to aggregate the results to a regional or rainfall zone scale is a time-consuming and difficult task because of the number of variables that must be determined for each building. To measure the optimal R
v value at the regional level and rainfall zone, we use the concept of equivalent building to represent each type of building [
5]. In each building type, we allocate the floor that has the optimal R
v value closes to the average optimal R
v value of the type to be the equivalent building. The ϕ value for each type of building is calculated for an equivalent building. The weighted average values of ϕ for different regions and rainfall zones can then be calculated.
Table 4.
Theoretical and available rainwater potential in different regions and rainfall zones.
Table 4.
Theoretical and available rainwater potential in different regions and rainfall zones.
| Unit:(106 m3/year) |
|---|
| Regions | Rainfall Zone | Theoretical Potential | Available Potential |
|---|
| Urban Area | Rural Area | Total | Urban Area | Rural Area | Total |
|---|
| North | I | 170.66 | 45.37 | 216.04 | 131.00 | 34.83 | 165.83 |
| II | 20.67 | 76.61 | 97.28 | 14.21 | 52.67 | 66.88 |
| III | 50.55 | 25.51 | 76.06 | 35.77 | 18.05 | 53.83 |
| IV | 244.68 | 31.94 | 276.62 | 173.96 | 22.71 | 196.67 |
| Center | I | 187.03 | 153.86 | 340.90 | 125.40 | 103.16 | 228.56 |
| II | 21.31 | 73.30 | 94.62 | 13.18 | 45.31 | 58.49 |
| South | I | 301.71 | 42.30 | 344.01 | 203.61 | 28.55 | 232.16 |
| II | 59.42 | 65.40 | 124.82 | 31.18 | 34.32 | 65.50 |
| III | 6.81 | 87.53 | 94.34 | 3.00 | 38.56 | 41.56 |
| East | I | 0.57 | 1.28 | 1.85 | 0.34 | 0.77 | 1.11 |
| II | 17.37 | 9.85 | 27.22 | 11.11 | 6.30 | 17.41 |
| III | 9.11 | 8.46 | 17.57 | 5.69 | 5.29 | 10.98 |
| IV | 27.66 | 9.96 | 37.62 | 14.59 | 5.25 | 19.84 |
| Offshore islands | I | 12.97 | 0.00 | 12.97 | 9.15 | 0.00 | 9.15 |
| II | 0.99 | 0.30 | 1.29 | 0.59 | 0.18 | 0.77 |
| Total | 1131.51 | 631.69 | 1763.20 | 772.78 | 395.95 | 1168.73 |
Table 5.
Number of buildings in different regions for different building types.
Table 5.
Number of buildings in different regions for different building types.
| Regions | Total | Single-Story | 2–5 Floor | 6–12 Floor | 13 Floor and More |
|---|
| No. of Building | Ratio | No. of Building | Ratio | No. of Building | Ratio | No. of Building | Ratio | No. of Building | Ratio |
|---|
| National-wide | 8,056,901 | 100.0% | 903,081 | 11.2% | 4,831,215 | 60.0% | 1,388,094 | 17.2% | 934,511 | 11.6% |
| North | 3,784,298 | 100.0% | 272,371 | 7.2% | 2,020,876 | 53.4% | 922,661 | 24.4% | 568,390 | 15.0% |
| Center | 1,864,757 | 100.0% | 288,621 | 15.5% | 1,210,700 | 64.9% | 215,523 | 11.6% | 149,913 | 8.0% |
| South | 2,213,261 | 100.0% | 307,957 | 13.9% | 1,454,086 | 65.7% | 236,587 | 10.7% | 214,631 | 9.7% |
| East | 194,585 | 100.0% | 34,132 | 17.5% | 145,553 | 74.8% | 13,323 | 6.8% | 1577 | 0.8% |
| Offshore Islands | 17,628 | 100.0% | 5963 | 33.8% | 11,519 | 65.3% | 146 | 0.8% | 0 | 0.0% |
In this study, a four-floor terraced apartment building was selected as an equivalent building for two-to-five floor buildings; an eight-floor building was selected as an equivalent building for six-to-twelve floor buildings; and a thirteen-floor building was selected as an equivalent building for buildings with thirteen floors and more. In Taiwan, the number of persons per household ranges from 2.9 to 3.4 with an average of 3.2 persons. The floor area of a housing unit depends on the structural material, and ranges from 111.4 to 137.6 m2 with an average of 124.5 m2 per housing unit. The daily potable water demand per user is 0.25 m3, and 32% of the potable water used in the residential sector can be replaced by rainwater because it is mainly used for toilet flushing. This information case is used to estimate the daily demand for rainwater per equivalent building.
Table 6.
Average values of optimal Rv and percentages of rainwater used (ϕ) for different building types in different rainfall zones.
Table 6.
Average values of optimal Rv and percentages of rainwater used (ϕ) for different building types in different rainfall zones.
| Regions | Rainfall Zone | Single-Story | 2-5 Floor | 6-12 Floor | 13 Floor and More | Weighted Average ϕ |
|---|
| Rv | ϕ | Rv | ϕ | Rv | ϕ | Rv | ϕ |
|---|
| North | I | 97.6% | 39.0% | 49.4% | 80.4% | 24.0% | 78.0% | 15.4% | 80.0% | 76.8% |
| II | 97.3% | 29.7% | 57.1% | 70.0% | 29.4% | 73.3% | 18.6% | 75.7% | 68.8% |
| III | 96.9% | 36.1% | 54.9% | 70.0% | 26.3% | 79.7% | 17.1% | 75.7% | 70.8% |
| IV | 97.1% | 22.3% | 77.0% | 71.2% | 43.1% | 79.6% | 26.9% | 80.5% | 71.1% |
| Center | I | 88.7% | 40.6% | 38.7% | 71.4% | 19.3% | 72.4% | 12.6% | 75.3% | 67.0% |
| II | 88.7% | 33.5% | 43.8% | 65.3% | 23.8% | 71.1% | 15.1% | 74.8% | 61.8% |
| South | I | 84.0% | 42.3% | 35.6% | 70.8% | 17.9% | 72.4% | 11.7% | 75.7% | 67.5% |
| II | 80.2% | 27.6% | 39.7% | 54.4% | 21.9% | 61.8% | 14.4% | 64.9% | 52.5% |
| III | 94.6% | 17.6% | 60.3% | 45.2% | 38.5% | 57.4% | 24.5% | 59.4% | 44.1% |
| East | I | 94.0% | 35.5% | 42.3% | 65.3% | 21.7% | 67.7% | 13.6% | 69.9% | 60.3% |
| II | 90.1% | 37.6% | 41.7% | 69.5% | 20.5% | 70.0% | 13.0% | 72.4% | 64.0% |
| III | 94.6% | 35.0% | 45.4% | 68.0% | 23.8% | 70.8% | 14.3% | 72.1% | 62.5% |
| IV | 87.4% | 27.2% | 46.4% | 57.7% | 25.0% | 62.4% | 15.6% | 64.6% | 52.7% |
| Offshore islands | I | 73.2% | 73.0% | 16.3% | 69.3% | 9.2% | 72.1% | 6.2% | 77.6% | 70.5% |
| II | 98.6% | 27.3% | 68.3% | 75.4% | 35.6% | 80.4% | 22.5% | 82.0% | 59.2% |
Using these design variables for each equivalent building, the average optimal point of ϕ for each equivalent building in the different rainfall zones was determined and the weighted average optimal value of ϕ for each rainfall zone and region was calculated, as shown in
Table 6. The table shows that buildings with fewer floors exhibit larger R
v values, but a lower percentage of rainwater use. The northern region has the highest percentage of rainwater use because it experiences frequent rainfall. The available DRWH potential for each rainfall zone and region were estimated using the weighted percentage of rainwater use in each rainfall zone, as shown in
Table 4. The total available DRWH potential is 1168.73 × 10
6 m
3, which is approximately 66.28% of the theoretical potential and 32.4% of domestic water demand. If this amount of rainwater is utilized, the water shortages in Taiwan will be avoided even in 2031.
4.3. Environmental Bearable DRWH Potential
If a substantial percentage of the total roof area of Taiwan is equipped with rainwater harvesting systems, two consequences must be considered: water rights and the ecological impact on the downstream streamflow because of a reduction in surface runoff.
Currently, no regulations exist that pertain to the impact of water right at downstream of rainwater harvesting. Generally, harvested rainwater is owned and used by homeowners because most water authorities acknowledge that the small quantities of harvested rainwater exert a negligible impact on the traditional water supply system; the reliability of rainwater harvesting is low; and rainwater harvesting is difficult to operate and manage [
44]. To assess the impact to water right at downstream of rainwater harvesting, tremendous amounts of data are needed, making this assessment difficult.
Table 7.
Environmental bearable rainwater potential for selected percentages of total roof area in different regions and rainfall zones.
Table 7.
Environmental bearable rainwater potential for selected percentages of total roof area in different regions and rainfall zones.
| Unit:(106 m3/Year) |
|---|
| Regions | Rainfall Zone | Environmental Bearable Potential |
|---|
| r = 5% | r = 10% | r = 15% |
|---|
| Urban Area | Rural Area | Total | Urban Area | Rural Area | Total | Urban Area | Rural Area | Total |
|---|
| North | I | 6.55 | 1.74 | 8.29 | 13.10 | 3.48 | 16.58 | 19.65 | 5.22 | 24.87 |
| II | 0.71 | 2.63 | 3.34 | 1.42 | 5.27 | 6.69 | 2.13 | 7.90 | 10.03 |
| III | 1.79 | 0.90 | 2.69 | 3.58 | 1.81 | 5.38 | 5.37 | 2.71 | 8.07 |
| IV | 8.70 | 1.14 | 9.83 | 17.40 | 2.27 | 19.67 | 26.09 | 3.41 | 29.50 |
| Center | I | 6.27 | 5.16 | 11.43 | 12.54 | 10.32 | 22.86 | 18.81 | 15.47 | 34.28 |
| II | 0.66 | 2.27 | 2.92 | 1.32 | 4.53 | 5.85 | 1.98 | 6.80 | 8.77 |
| South | I | 10.18 | 1.43 | 11.61 | 20.36 | 2.85 | 23.22 | 30.54 | 4.28 | 34.82 |
| II | 1.56 | 1.72 | 3.27 | 3.12 | 3.43 | 6.55 | 4.68 | 5.15 | 9.82 |
| III | 0.15 | 1.93 | 2.08 | 0.30 | 3.86 | 4.16 | 0.45 | 5.78 | 6.23 |
| East | I | 0.02 | 0.04 | 0.06 | 0.03 | 0.08 | 0.11 | 0.05 | 0.12 | 0.17 |
| II | 0.56 | 0.32 | 0.87 | 1.11 | 0.63 | 1.74 | 1.67 | 0.95 | 2.61 |
| III | 0.28 | 0.26 | 0.55 | 0.57 | 0.53 | 1.10 | 0.85 | 0.79 | 1.65 |
| IV | 0.73 | 0.26 | 0.99 | 1.46 | 0.53 | 1.98 | 2.19 | 0.79 | 2.98 |
| Offshore islands | I | 0.46 | 0.00 | 0.46 | 0.91 | 0.00 | 0.91 | 1.37 | 0.00 | 1.37 |
| II | 0.03 | 0.01 | 0.04 | 0.06 | 0.02 | 0.08 | 0.09 | 0.03 | 0.11 |
| Total | 38.64 | 19.80 | 58.44 | 77.28 | 39.60 | 116.87 | 115.92 | 59.39 | 175.31 |
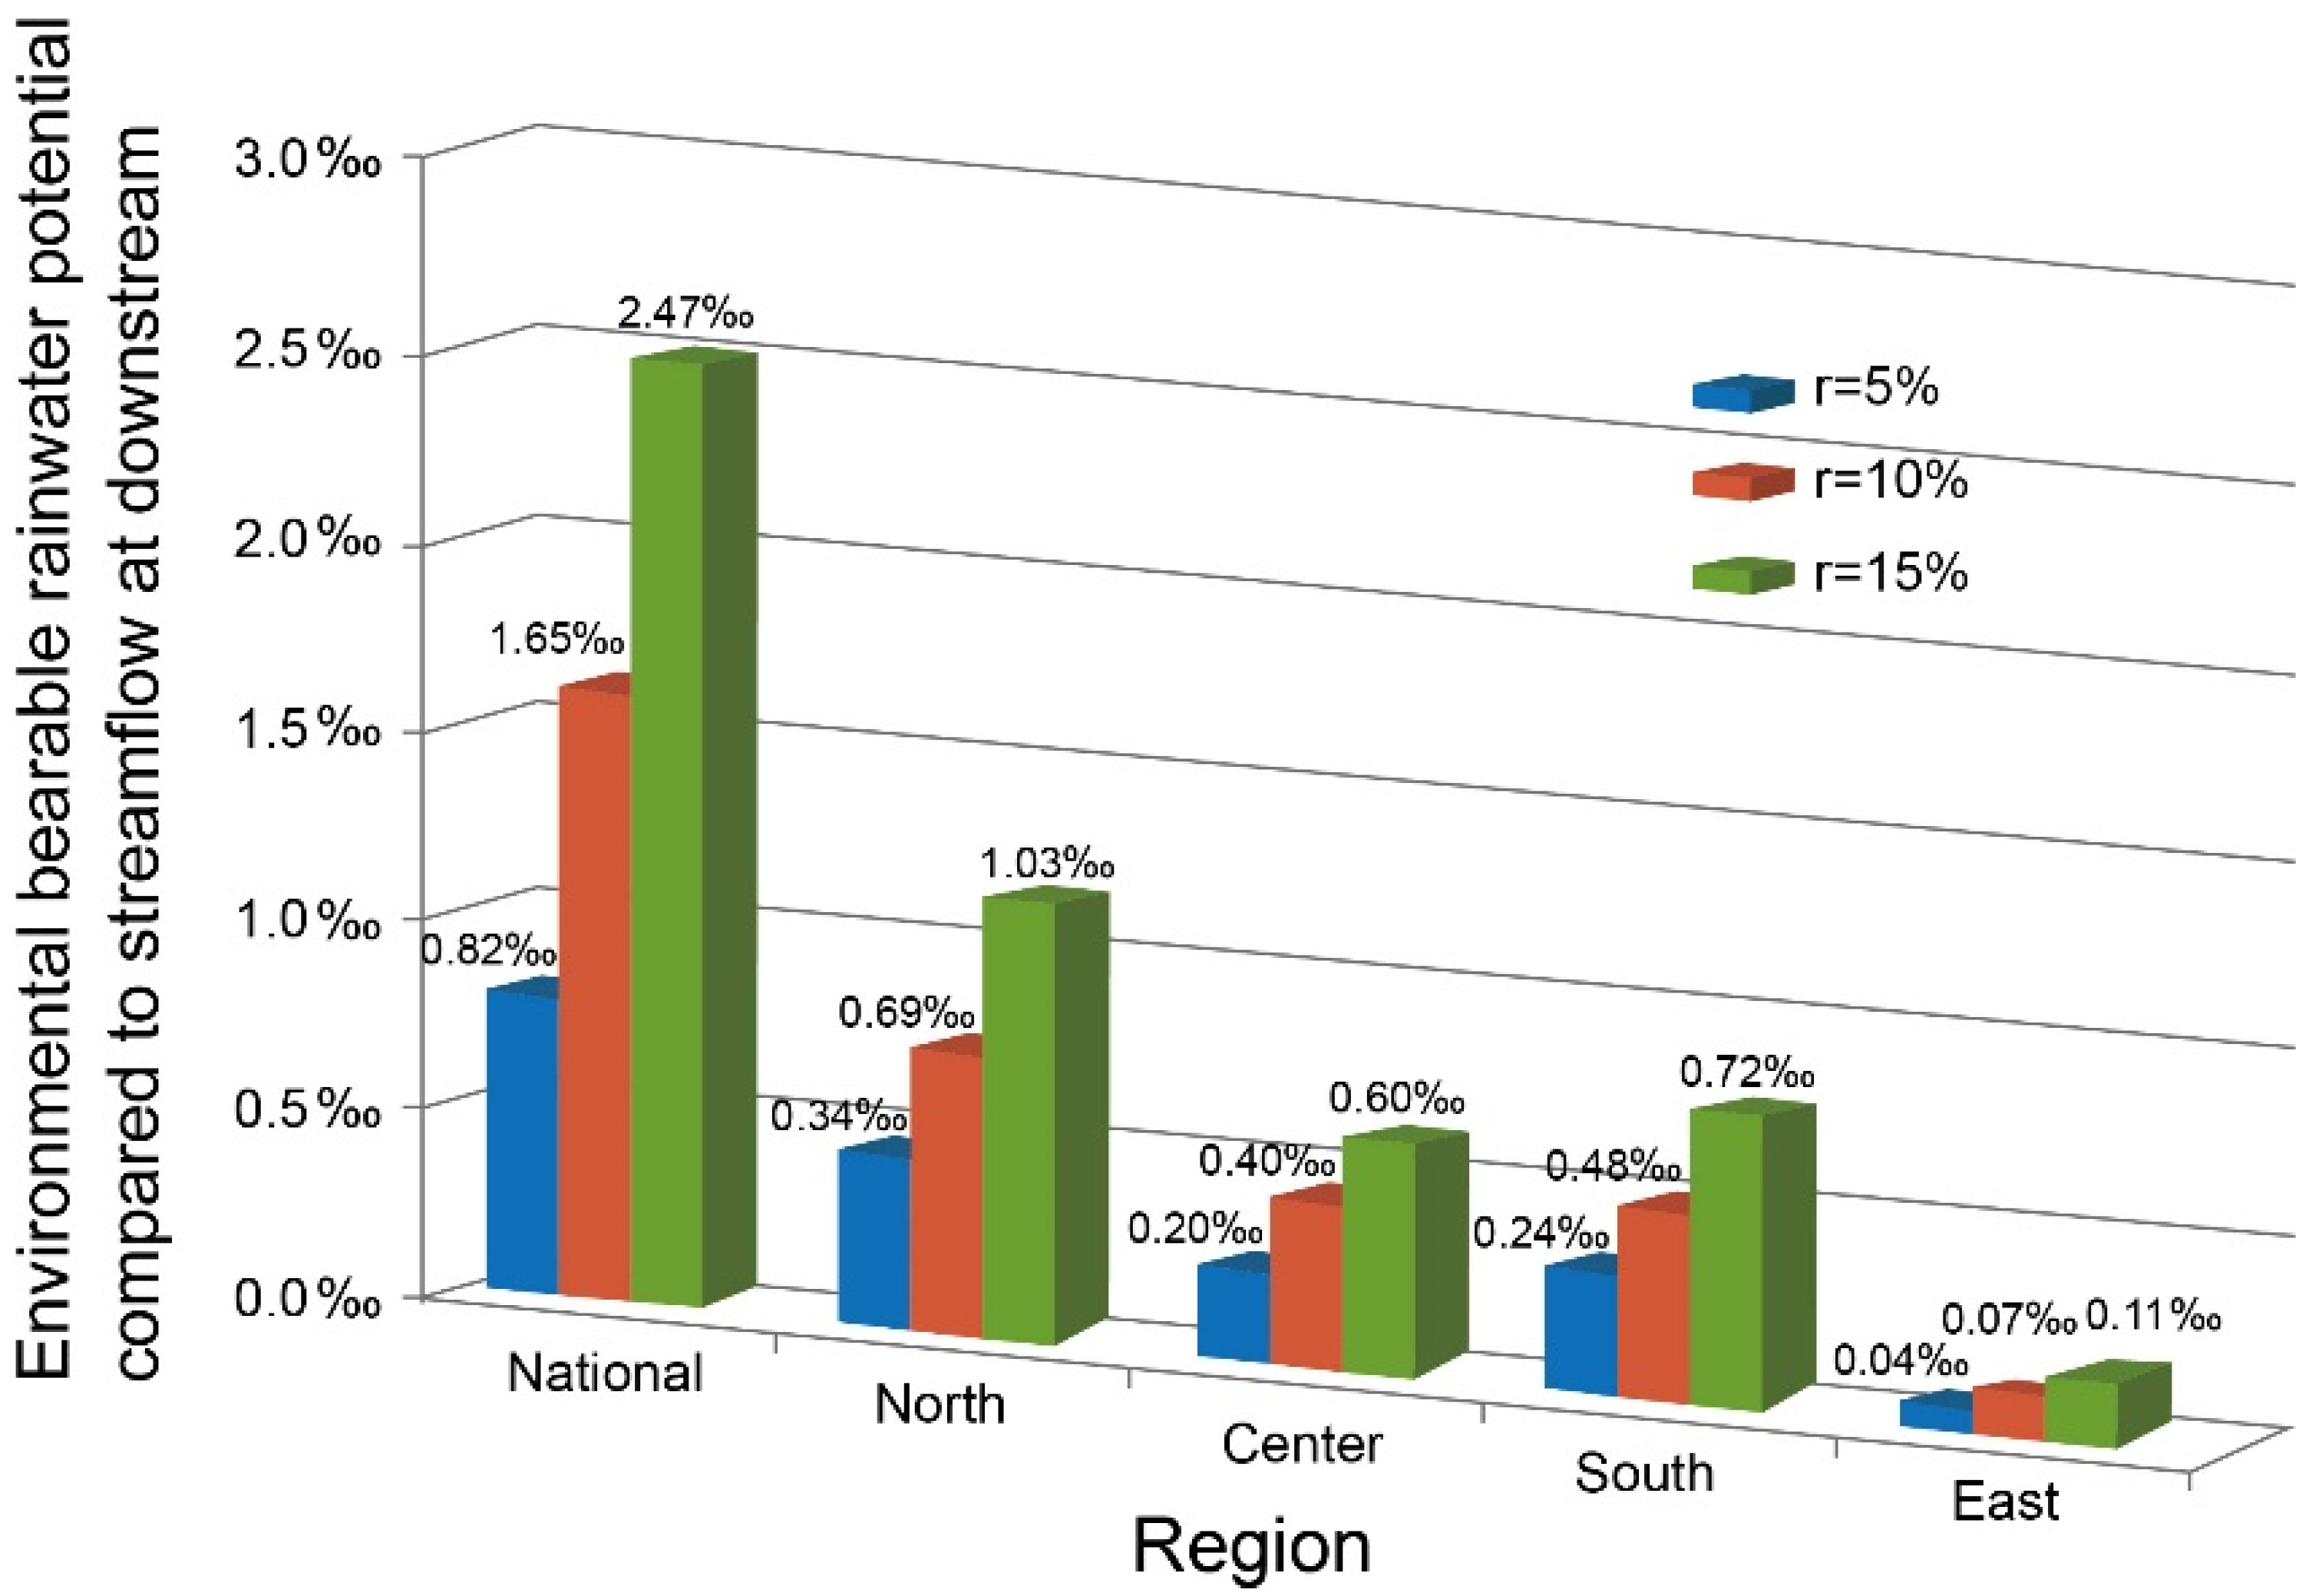
To examine the potential impact of rainwater harvesting on the downstream streamflow, the environmental bearable potential of DRWH was estimated by using various total roof area percentages and comparing these volumes with the mean annual downstream streamflow on a national and regional scale. The environmental bearable DRWH potential for each rainfall zone and region were estimated using 5%, 10%, and 15% of total roof area and shown in
Table 7. For higher total roof area percentage, there is higher environmental bearable potential and impact to downstream streamflow.
Figure 7 shows the environmental bearable rainwater potential compared to streamflow at downstream for selected percentages of total roof area for national-wide and four regions.
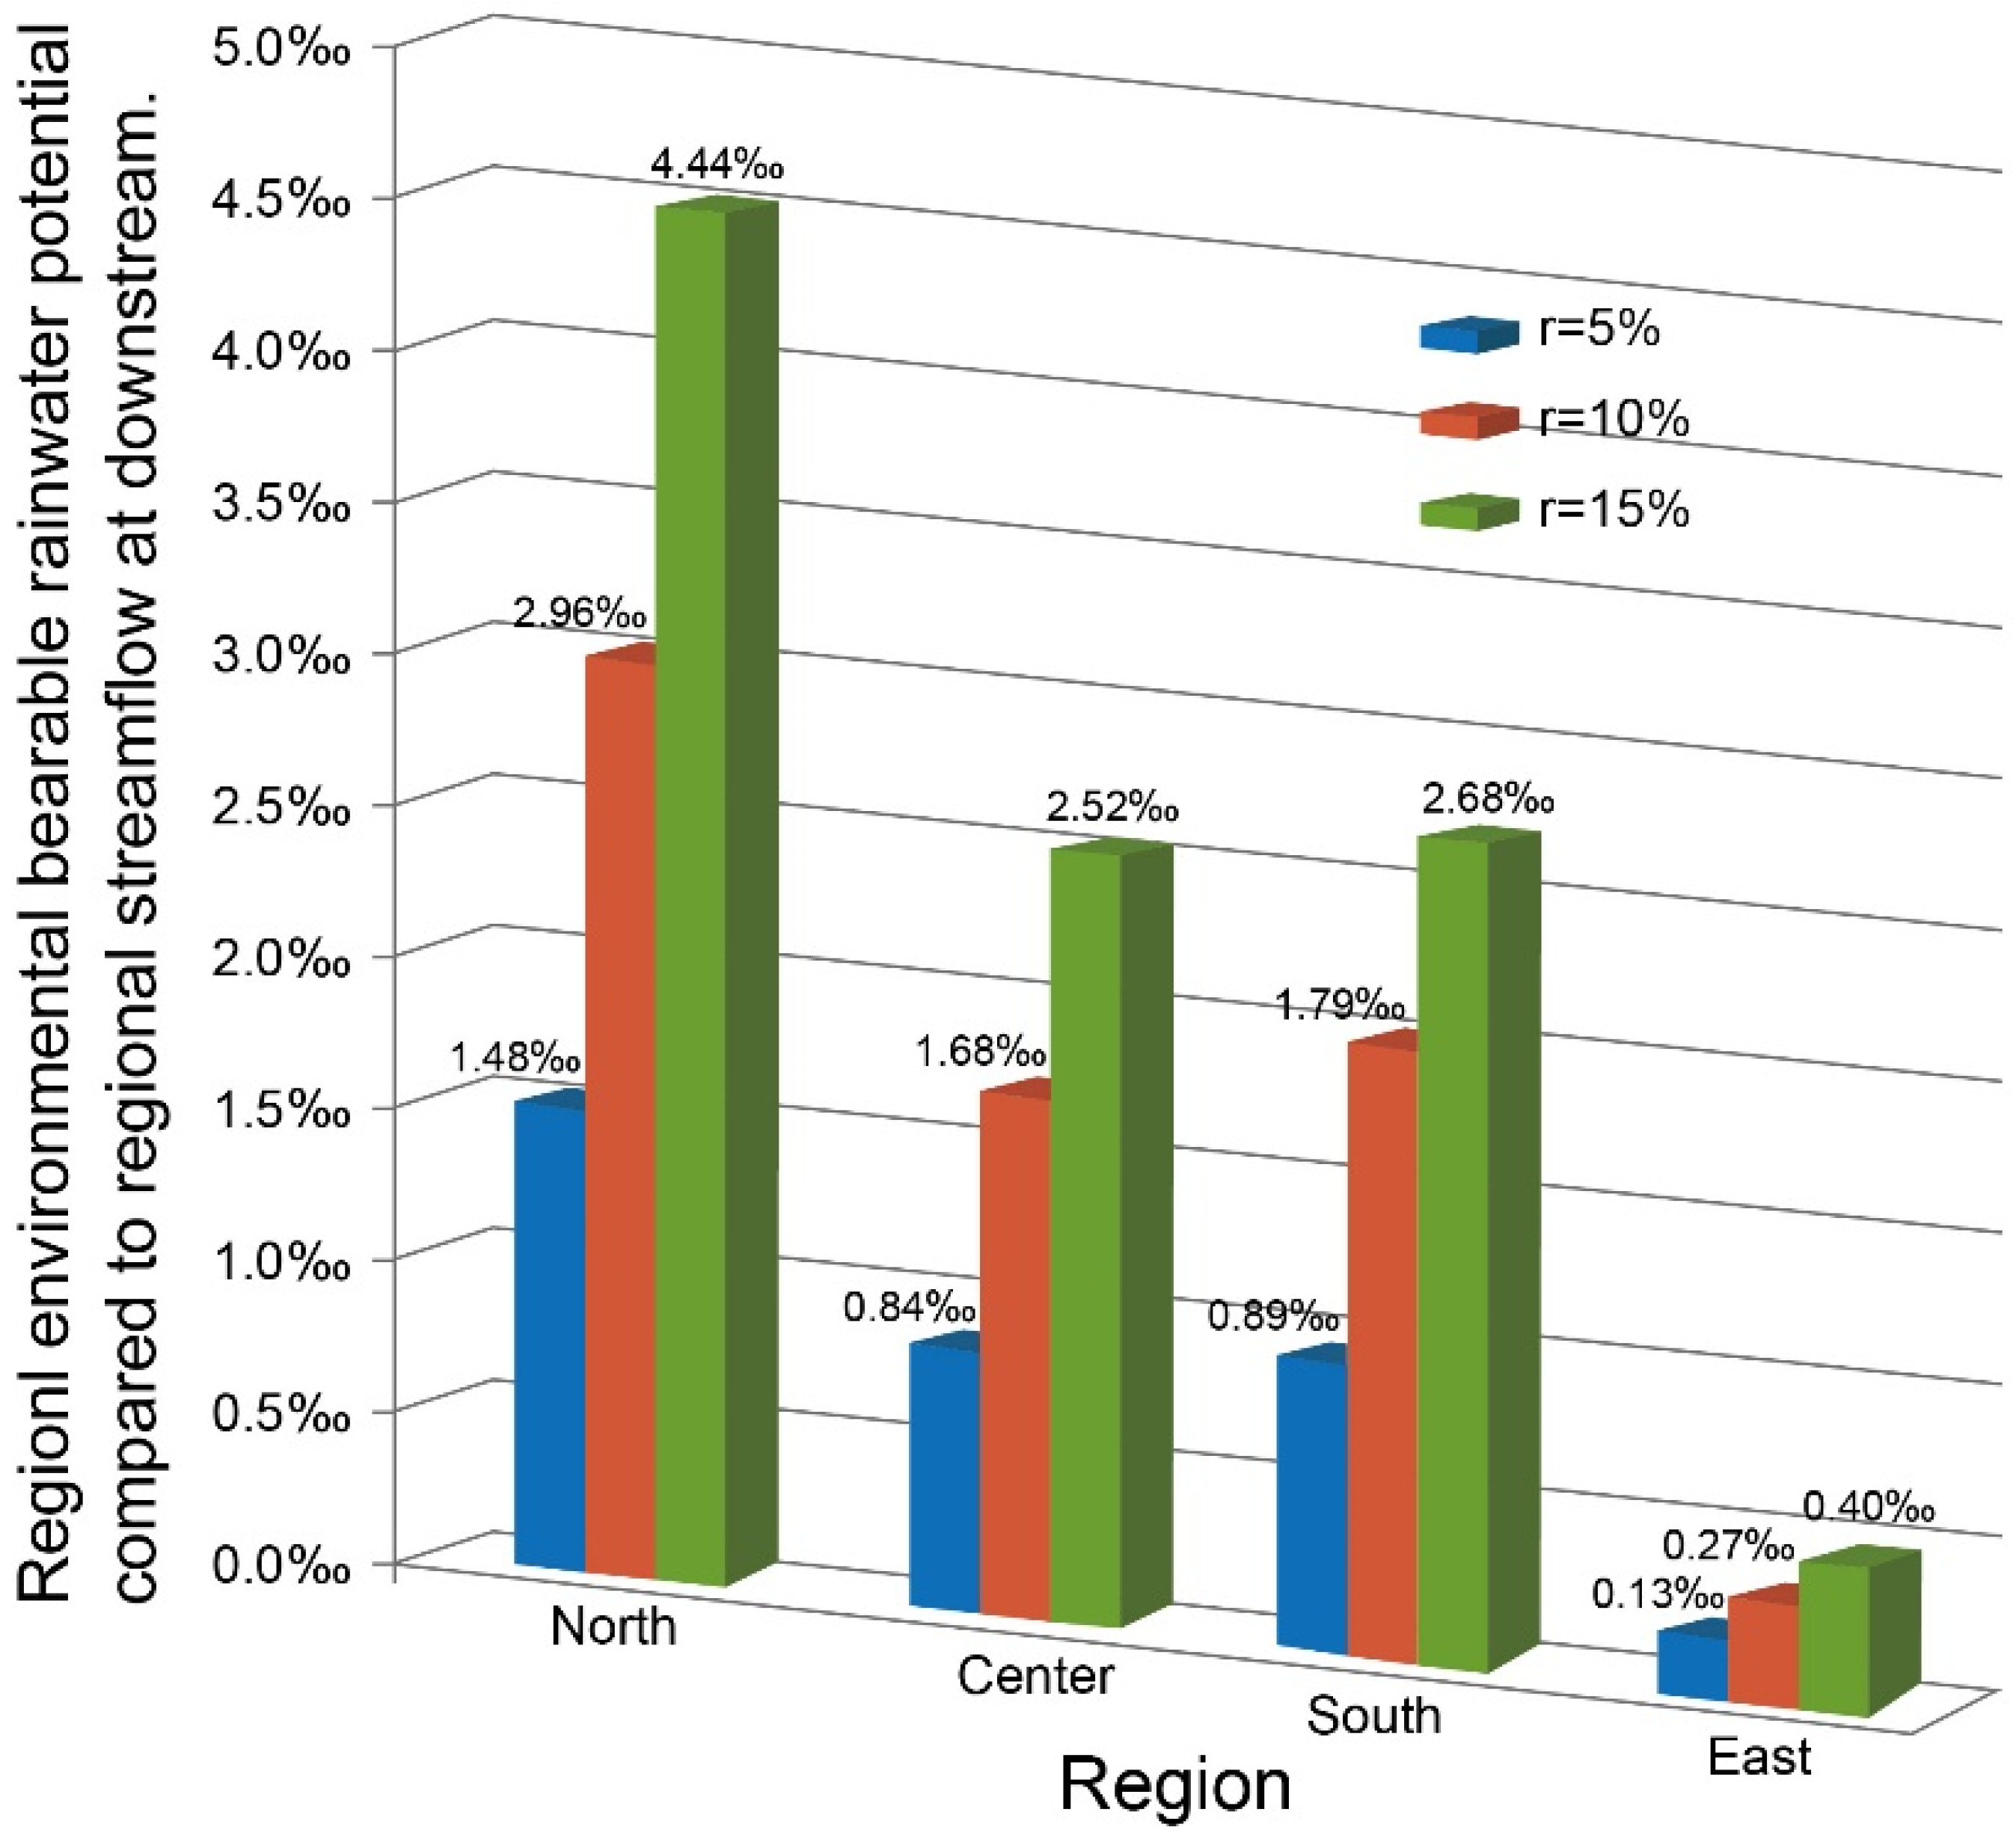
Figure 7 also shows that if 10% of the total roof area of Taiwan was used for DRWH, the environmental bearable potential would be 0.16% of the mean annual streamflow or 0.12% of the mean annual rainfall at a national scale. It has smaller impact to streamflow compared to that of reservoir storage which has 5.6% of the mean annual streamflow. Rainwater harvesting in the northern region has the most significant impact to downstream streamflow. From a regional perspective, the environmental bearable potential of different zones with various total roof area percentages were compared with the mean annual streamflows in the same region, as shown in
Figure 8.
Figure 8 shows that ratios of regional environmental bearable rainwater potential to regional streamflow at downstream are higher than that of ratios in
Figure 7 in four regions. The northern and eastern regions exhibited the highest and lowest values (based on the same roof area percentage), respectively. A comparison between our results and results from Texas indicated that even if 5% of the total roof area was used, the downstream streamflow impact would be larger than the effect in Texas. In Texas, if 10% of the total roof area was used, it would amount to only 0.03% of the total statewide rainfall. The high density of buildings and small watershed in Taiwan may explain this result. Further study is required to determine a reasonable downstream streamflow reduction. A recent climate change study [
45] stated that average annual rainfall will increase by 7% (ranging from −8% to 22%) at the end of this century under all simulation circumstances in Taiwan. In addition, the effective storage volume of reservoirs is rapidly decreasing from sedimentation. These environmental changes will encourage rainwater harvesting. For considering the factors of water shortage in short term, reservoir sedimentation, and ecological impact to downstream streamflow, we recommend that less than 10% of the total roof area of Taiwan should be used for DRWH in the short term, but the northern region should use lower percentage of this area and the eastern region may use a higher percentage. If a more accurate estimation is required, the percentage of the total roof areas that should be used during the dry and wet seasons should be assessed individually.
Figure 7.
Environmental bearable rainwater potential compared to streamflow at downstream for selected percentages of total roof area for national-wide and four regions.
Figure 7.
Environmental bearable rainwater potential compared to streamflow at downstream for selected percentages of total roof area for national-wide and four regions.
Figure 8.
Regional environmental bearable rainwater potential compared to regional streamflow at downstream for selected percentages of total roof area in four regions.
Figure 8.
Regional environmental bearable rainwater potential compared to regional streamflow at downstream for selected percentages of total roof area in four regions.
5. Conclusions
Taiwan is currently facing, and will continue to face, water shortage as a serious issue. Since DRWH is recognized as a new alternative water resource in integrated water resources planning, it is, therefore, necessary to assess the potential DRWH at national level. This study proposed to define potential DRWH on the residential sector from the view point of supply-side water management. The methodology for estimating the potential DRWH was developed based at a national/regional scale rather than a household level.
To produce a more realistic assessment of the DRWH potential, three concepts relevant to the quantification of DRWH potential, namely, the theoretical, available, and environmental bearable potential were proposed and defined based on the climatic, building characteristic, economic, and ecological aspects of DRWH in Taiwan. Theoretical potential, which represents the maximal rainwater harvest, considers only the rainfall, roof area, and runoff coefficient without considering the economic and downstream ecological impacts. Available potential reflects a more realistic assessment of rainwater potential because it considers the amount of rainwater required by various types of building. Environmental bearable potential considers the downstream ecological impact of DRWH and other factors.
To estimate rainwater potential, we proposed a general framework for evaluating the DRWH potential. The framework consisted of rainfall zoning, roof area estimation, average percentage of total rainwater use at optimal volumetric reliability determination, and the percentage of the total roof area used for each rainfall zone and region. In this paper, the two-step cluster analysis method was used for rainfall zoning. GIS combined with the land use classification database was used for roof area estimation. The optimal volumetric reliability was determined by selecting the best alternative on the production function. Scenarios corresponding to different percentage of roof areas method were used for preliminary estimation for the percentage of total roof area used.
The theoretical rainwater potential in Taiwan is 1763.2 × 106 m3 per year which can provide 48.9% of domestic water demand and 210.03 L/d per person. Available potential is estimated at 1168.73 × 106 m3 per year which is approximately 32.4% of domestic water demand. If 10% of the total roof area was adopted, the environmental bearable potential would be 116.87 × 10⁶ m3 per year. The outcomes of this study could assist water authorities and urban designers to set broad policies for future rainwater development and to integrate DRWH systems with existing water supply systems.
From the statistic data of Water Resources Agency, the average unit water production cost for desalination, wastewater reused, and DRWH ranges from NT$ 31.21 to 40.13, NT$20 to NT$30, and NT$12 to NT$18 (US$1 = NT$30), respectively. The cost of constructing DRWH systems is significantly lower than the cost of reusing wastewater and desalinating water. If such relatively cheap systems were established, they could reduce the operation and maintenance costs of the existing water supply systems in the short term, and replace proposed new conventional projects in the long term. Consequently, the size of these projects could be reduced, or they could be postponed or cancelled, delaying capital borrowing and leading to considerable savings for water authorities.


