1. Introduction
In recent years, one of the significant effects of climate change has been an increase in precipitation. In Taiwan, the most general flood disasters are storm floods when high intensive rainfall occurred in the upstream. Due to record-breaking increases in the intensity and duration of precipitation, many flood control facilities have lost the ability to prevent increases in the volume of runoff induced by development in river basin. In other words, when rainfalls last longer, the retention facilities can no longer effectively prevent flooding downstream. The phenomenon occurs mainly in western coastal areas where there are high hillside developments without efficient facilities, which could balance the runoff. Extreme weather conditions, such as typhoons or heavy precipitation, might strengthen the phenomenon.
The main goal of this paper is to examine the impacts of hillside development on downstream flood disasters and flood control mechanisms, as well as to examine the impact of the level of hillside development on downstream flood disasters. The Nan Ho Stream basin, upstream of the Hou Lung Stream in Miaoli County, i.e., the Nan Ho area, is employed as the study area. Using precipitation conditions for 25-, 50-, 100- and 200-year return periods, the researchers simulated the area’s flood potential based on the area’s current development conditions (0% increase in land development) and compared it with simulations for 10%, 20%, 40% and 60% increases in the land development over the aforementioned return periods. The results suggested that for a given return period and precipitation condition, an increase in the land development at the upstream area would lead to an increase in the overall size of the inundation area and also the depth of the floods. Although the proportion of the increase in the inundation area is not significant, floods would occur more frequently in the downstream area.
For this study, the districts of Chi-Tu and Shi-Chi, which are densely populated, well-developed urban areas in the upper and middle reaches of the Keelung River, were selected for case study. The aim was to investigate the effect of hillside development in a catchments area on the volume of runoff in downstream area. We have analyzed the results based on flood simulations and discussed relevant land-use policies. The findings from this study can be used by government agencies as a reference for the proper management of hillside development.
2. Literature Review
In the early 1950s, the hillsides in Taiwan were regarded as insignificant marginal lands. There was not much development on the hillside lands and the government adopted a laissez-faire type of attitude to the use of hillsides. Nonetheless, in the middle 1970s, with a steep increase in the need for land, resulting from a flourishing economy and a growing population [
1] and a greater awareness of environmental protection and sustainable development, the government finally started to impose regulations for hillside development [
2].
Hillside designation in Taiwan is based on related land development regulations, which stipulates that hillside lands shall be designated so by the central or municipal government according to natural topography (i.e., the elevation should be more than 100 m or the elevation below 100 m but the average slope should be greater than 5%), and conservation requirements. Once the range of the hillside land is determined, the owner (public or private) has to submit the results to the Executive Yuan for approval. According to data from the Council of Agriculture, a total of 981,464 ha of land have been designated as hillside land (until February 2010) as a result of these regulations. Nevertheless, because most of the lands with an elevation above 100 m have been developed into concentrated residential communities due to urbanization, people involved in land planning may sometimes neglect the fact that these areas should be designated as hillside lands.
According to the National Comprehensive Development Plan, applications for changing land use zoning and intensity for real estate development projects should be processed in three stages: planning permit review, development permit review and building permit review. The planning permit applications are reviewed by the central government, while the applications for the development permit and the construction permit are reviewed by the relevant local government. According to the present regulations on the control of hillside land development in Taiwan, hillside land developmental projects have to be reviewed by the following four types of departments: land development planning, building design, soil and water conservation and environmental impact evaluation. A series of laboratory experiments were performed to investigate the connection between agricultural land and the key geomorphology around the vegetation [
3].
A 1-D dynamic channel-flow routing was performed with proper parameters for main channel flows computing in Keelung River [
4], whereas a 2-D overland-flow routing was used for surface inundation simulation of the alluvial plain [
5]. A simulated inundation results carried out by Water Resources Agency (WRA) in Taiwan and SOBEK model was employed to simulate inundated area in the lowland along Keelung River due to the intensive rainfall caused by Nari Typhoon [
6,
7].
For the urban regions with detailed sewer drainage system information [
4,
5], the Storm Water Management Model (Huber, 1988) [
8] was applied for sewer flows routing. In urban areas, the storm sewer networks were commonly built for conveying runoffs caused by pluvial rainfall. Therefore, the condition of storm sewer system is highly related to its performance with respect to sewer flooding. Many models have been developed for assessing the hydraulic performance of drainage networks [
9].
3. Methodology
3.1. Analysis of the Hydrological Condition
In this study, we analyzed the flow frequency and the daily precipitation frequency of the catchments area of the Keelung River. Flow volumes of different return periods were analyzed using data from records of the maximum instantaneous flow from the flow station of the WRA. The average regional precipitation was calculated using the current precipitation data provided by the Water Resources Agency. The hourly precipitation data from the selected rainfall station were processed by the Thiessen polygon method to get the average hourly precipitation volume for a day in the catchments area. This information was then used to develop the regional design hyetograph for flood simulation [
10,
11]. Because this study focused on developments in only hillsides with a slope less than 30° in downstream areas and the study area had a valley type of topography, changes in the time of concentration would be too small to have an influence on the rainfall intensity and hydrological conditions considered in developing the design hyetograph [
12,
13].
3.2. The SOBEK Model
SOBEK model was developed by WLIDelft Hydraulic Co., a Netherlands-based company. The model is based on a one-dimensional channel calculation, and it tries to solve the de Sant Venant Equation by the explicit finite difference method.
The SOBEK model can be used to ensure that the control equations are complete dynamic wave equations when performing one-dimensional channel computation, storm sewer computation, and two-dimensional overland inundation computation. The SOBEK model comprises a one-dimensional channel flow model and a two-dimensional overland inundation model, which are described below.
3.2.1. One-Dimensional Channel Flow Model
The calculation of a river’s flow routing is based on the dynamic wave transmission theory of a one-dimensional varied unsteady flow,
i.e., the gradually varied unsteady flow equation derived from de Saint Venant for describing river flows [
14]. The nonlinear implicit difference method is applied for calculating the depth and flow of water at different times [
15,
16]. At the confluence of the main stream and its branches, the water level in the main stream and the balance between the input and output flows are treated as the confluence conditions for calculating the depth and volume of water flow at each cross-section. The flow routing of a river is derived from the one-dimensional unsteady flow equation derived by de Saint Venant. This is also a dynamic wave model that takes the continuity and motion of the water flow into consideration. The control equations are as follows:
Here,
| Q: | Discharge (m3/s); |
| g: | Acceleration of gravity (m/s2); |
| t: | Time (s); |
| x: | Distance along the flow (m); |
| h: | Water level (m); |
| R: | Hydraulic radius (m); |
| qlat: | Side-entry discharge of channel (m2/s); |
| Af: | Wetted area (m2); |
| C: | Chezy coefficient; |
| Wf: | River width (m); |
| τwi: | Shearing force of the wind (N/m2); |
| ρw: | Water density (kg/m3). |
The river discharge
Q and wetted area
Af are unknown values which will be calculated by boundary conditions by simulating the one-dimensional varied unsteady river flow. In the one dimensional overland flow calculation, a one-dimensional dynamic model can be adopted in a river. As shown above, Equation (1) is a continuous equation. Equation (2) is momentum equations along the river [
9].
3.2.2. Two-Dimensional Overland Inundation Model
The complete dynamic wave equation was used to calculate the two-dimensional overland inundation from the SOBEK model. The operations of multiple hydrological facilities were taken into account [
17] while simulating the one-dimensional varied unsteady channel flow, the two-dimensional overland inundation, and rain water sewers. In the two dimensional overland flow calculation, a two-dimensional dynamic model can be adopted as a basis. As shown below, Equation (3) is a continuous equation. Equations (4) and (5) are momentum equations along the X and Y axes [
9].
Here,
| x, y: | Cartesian coordinates for simulating area (m); |
| t: | Time (s); |
| u, v: | Average flow rate along x and y axis, respectively (m/s); |
| d: | Overland water level in the simulation area (m); |
| g: | Acceleration of gravity (m/s2); |
| h: | Overland water level h = d + z (m); |
| C: | Chezy coefficient; |
| a: | Friction coefficient for the side wall; |
| V: | ![]() Flow rate (m/s). Flow rate (m/s). |
The major parameter of concern is Manning’s roughness coefficient. Its value should be examined before applying the SOBEK model to ensure that it reflects the real physiographic conditions to which the model is to be applied. Considering the consistence of inundation area, values of Manning’s roughness coefficient which have been calibrated by typhoon Toraji and validated by typhoon Nari [
7,
18], are recommended in this paper, as well as the grid system with 40 m × 40 m to consider the accuracy and efficiency of simulation.
4. Simulation of Flood Potential for the Study Area
To effectively reduce flood disasters in the middle and lower reaches at the lower basin, various hydrological departments and agencies have initiated the construction of flood prevention structures such as embankments, drainage systems and pumping stations. Nevertheless, with the increasing development and use of the lands in the catchments area, the present flood prevention facilities can no longer adequately handle the increased water flow. Based on precipitation conditions for 25-year and 200-year return periods, flood simulations were performed in this study based on the current land development conditions at Hsi Chih and Chi Tu, which are in the middle reach of the Keelung River. Considering the limitation by land development related legislations, flood simulations were also performed for 10%, 20%, 40% and 60% increases in the land development in the upper catchments, because the proportion of hillside land use could be less than 60% in Taiwan.
4.1. Determination of the Range of the Simulated
4.1.1. Zoning the Simulated Area
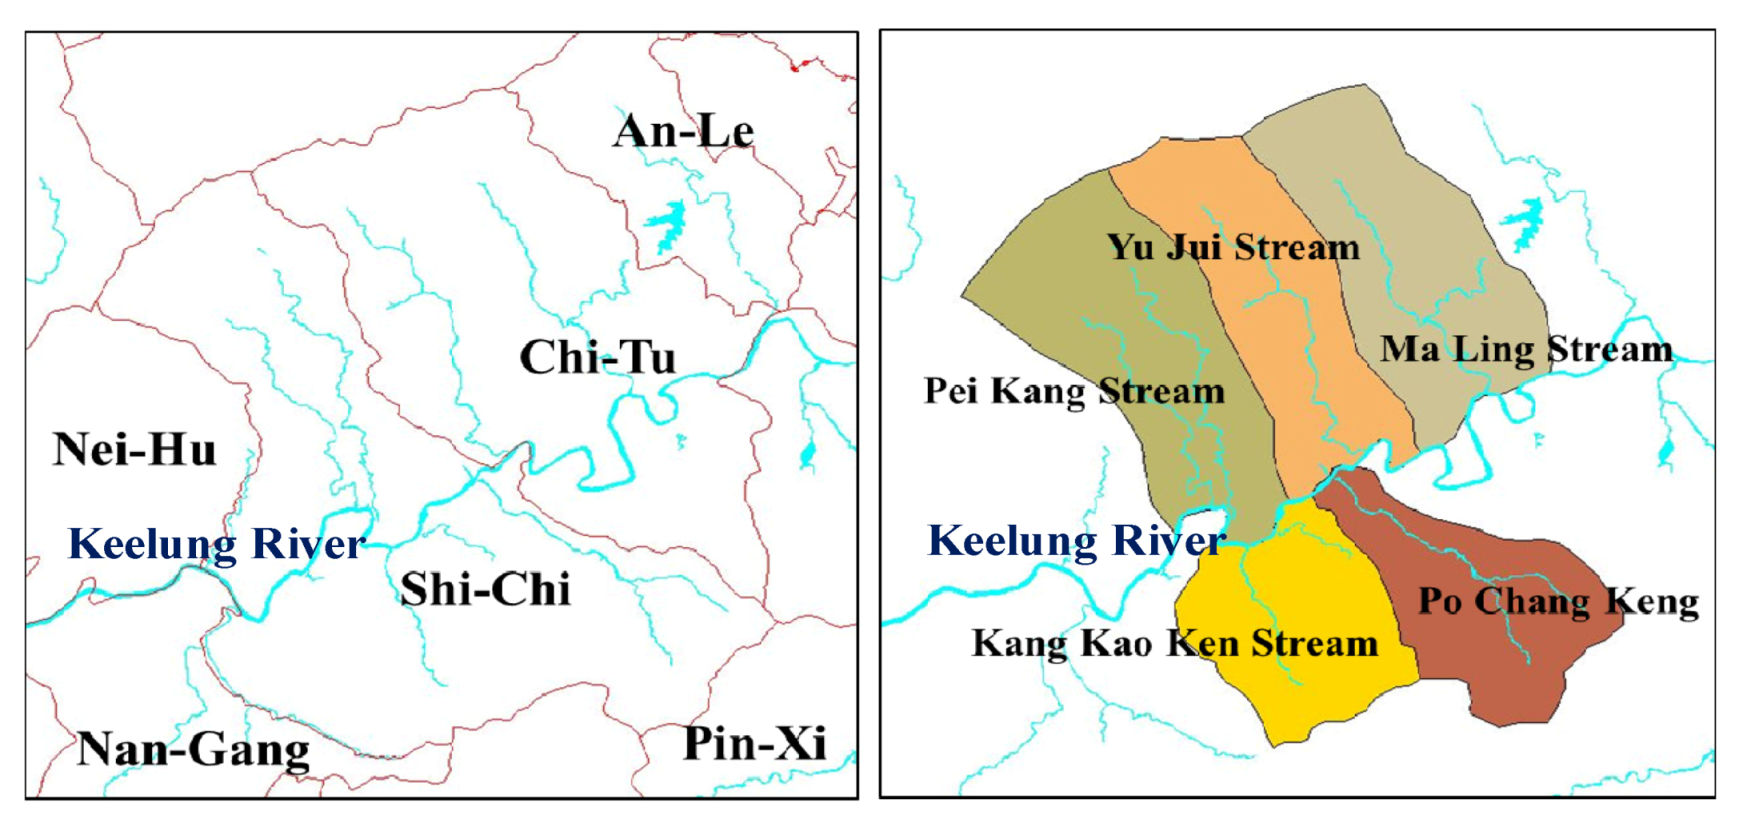
This study focuses on the middle reach of the Keelung River, which includes the Po Chang Keng Stream, the Kang Kao Keng Stream, the Pei Kang Stream, the Yu Jui Stream, and the Ma Ling Keng Stream. There are five types of land use in the upstream catchments area: agricultural, industrial, hydrological, and constructional (including public facilities). In the upstream region, the catchments area was zoned based on the features of the drainage route of the branches. The discharges were calculated for before and after land development and treated as the threshold criteria for downstream flood simulation. The catchments areas for the Po Chang Keng Stream and the Ma Ling Stream were divided into three upstream catchments zones each and the catchments areas for the Kang Kao Ken Stream, the Pei Kang Stream and the Yu Jui Stream were divided into two upstream catchments zones each (
Figure 1).
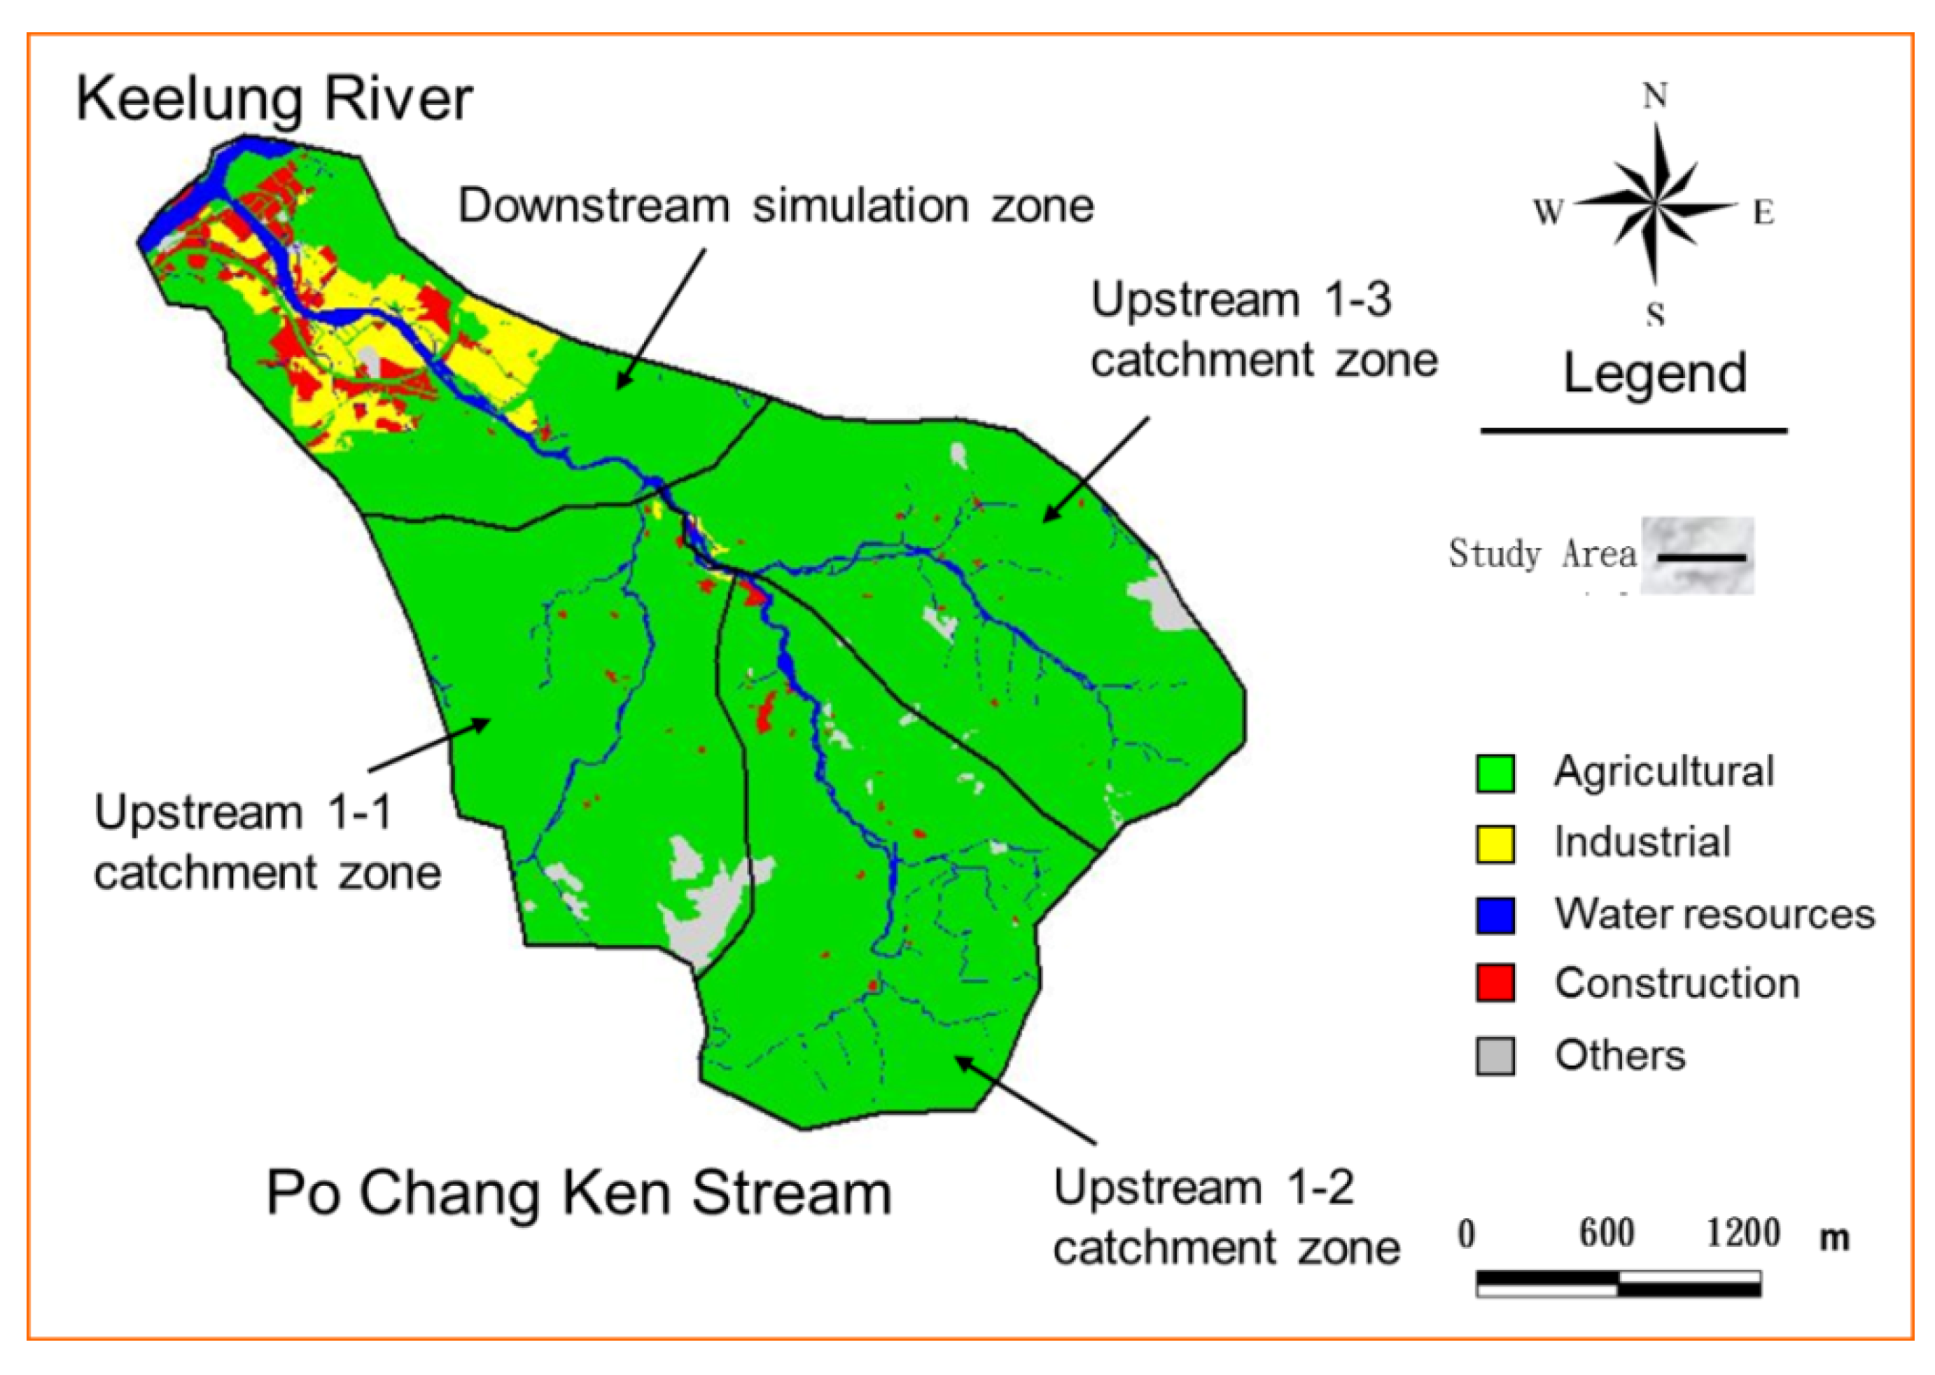
As an example,
Figure 2 illustrates that the area downstream of the Po Chang Ken Stream is more urbanized than the upstream area, which consists mostly of agricultural lands.
Figure 1.
The distribution of river branches in the middle reach of the Keelung River and the corresponding administrative districts and simulation zones.
Figure 1.
The distribution of river branches in the middle reach of the Keelung River and the corresponding administrative districts and simulation zones.
Figure 2.
The land use map of the catchments area of the Po Cheng Keng Stream in the Keelung River basin.
Figure 2.
The land use map of the catchments area of the Po Cheng Keng Stream in the Keelung River basin.
4.1.2. Surface Elevation and Simulation Area
When setting up the flood simulation model, the most recently obtained surface elevation data were used to construct the computational grid. The surface elevation of the catchments area ranged from about 1000 m in the upstream area to about 10 m in the middle reach of the Keelung River The land use data were obtained from the most recent survey conducted by the Land Use Survey of Taiwan.
The results of flood simulations for the catchments area of the Po Chang Ken Stream are given here as an example. The total catchments area is 1614.88 ha, which was divided into a two-dimensional downstream simulation zone (378.08 ha), an upstream 1-1 catchments zone (387.04 ha), an upstream 1-2 catchments zone (421.28 ha), and an upstream 1-3 catchments zone (405.60 ha). For the two-dimensional downstream simulation zone, a 40-m grid was adopted and a total of 2363 grids were used for the simulations. Flood simulation was performed for five levels of land development, namely, 0% (no change from the current land use conditions), 10%, 20%, 40% and 60% increases in land development. The land development considered herein is the conversion of agricultural lands into urban areas in the outskirts of the catchments area. Runoff coefficients were calculated for the current land use and at the various aforementioned levels of land development. The volume of flow into the downstream catchments area and its impact on floods downstream were assessed.
Table 1 shows that the two-dimensional downstream simulation zone has a significant portion of land used for industrial and constructional (including public facilities) purposes (approximately 30%), while approximately 62.89% of the zone is used for agricultural purposes. In contrast, more than 90% of the land in the upper catchments zone is used for agricultural purposes, with very little area used for industrial and constructional purposes.
Table 1.
The land use ratio and the surface area of the downstream simulation zone and the upstream catchment area of the Po Cheng Ken Stream.
Table 1.
The land use ratio and the surface area of the downstream simulation zone and the upstream catchment area of the Po Cheng Ken Stream.
| | Area | Downstream simulation zone | Upstream 1-1 catchment zone | Upstream 1-2 catchment zone | Upstream 1-3 catchment zone |
|---|
| Land Use | | Area (ha) | Ratio (%) | Area (ha) | Ratio (%) | Area (ha) | Ratio (%) | Area (ha) | Ratio (%) |
|---|
| Agricultural | 237.76 | 62.89 | 356.64 | 92.15 | 398.24 | 94.40 | 405.60 | 94.36 |
| Industrial | 71.68 | 18.96 | 1.44 | 0.37 | 0.00 | 0.00 | 0.80 | 0.20 |
| Water resources | 23.52 | 6.22 | 6.72 | 1.74 | 13.44 | 3.19 | 9.76 | 2.41 |
| Construction | 40.48 | 10.71 | 1.76 | 0.45 | 4.32 | 1.02 | 1.44 | 0.36 |
| Others | 4.64 | 1.23 | 20.48 | 5.29 | 5.28 | 1.25 | 10.88 | 2.68 |
| Total | 378.08 | 100.00 | 387.04 | 100.00 | 421.88 | 100.00 | 405.60 | 100.00 |
4.1.3. Precipitation Frequency and Threshold Criteria for the Upstream and Downstream
In this study, we analyzed the peak hourly precipitation volume for 25-year and 200-year return periods by analyzing the storm frequency data from the Wu Du precipitation station at the Keelung River basin. For the 25-year return period, the hourly precipitation is 98 mm, and for the 200-year return period, the hourly precipitation is 124 mm. In the SOBEK model, the flow data used for the upstream threshold criteria were the flow volumes from the individual river branches that converged in the catchments areas. For the downstream area, the water level data derived from the water level hydrograph for the Keelung River were used for the threshold criteria.
4.1.4. Runoff Coefficients
The runoff coefficients used in this study were obtained from Hydrologic Application. Using the runoff coefficients for various land use categories, the average runoff coefficient was calculated for 0%, 10%, 20%, 40% and 60% increases in the land development in the upstream simulation zone. The average runoff coefficients for the upstream 1-1, 1-2 and 1-3 catchments zones of the Po Chang Keng Stream are provided in
Table 2.
Table 2.
Average runoff coefficients for various levels of land development in the upstream catchment area of the Po Cheng Keng Stream.
Table 2.
Average runoff coefficients for various levels of land development in the upstream catchment area of the Po Cheng Keng Stream.
| Average runoff coefficient | Current Condition | Increase in the upstream land development |
|---|
| Subzone | | 10% | 20% | 40% | 60% |
|---|
| Upstream 1-1 catchment zone | 0.592 | 0.611 | 0.629 | 0.666 | 0.703 |
| Upstream 1-2 catchment zone | 0.611 | 0.63 | 0.649 | 0.687 | 0.724 |
| Upstream 1-3 catchment zone | 0.602 | 0.621 | 0.64 | 0.678 | 0.716 |
4.1.5. Peak Flow Volume
This study used a rationalized equation as the reference for calculating runoff volume. According to the five conditions,
i.e., 0% (the land use kept constant at the current condition), 10%, 20%, 40% and 60% increases in the land development: peak flow volumes were calculated for 25-year and 200-year return periods. A 24-hour flow based on the triangle calendar method was included in the computation.
Table 3 presents the peak flow volumes for the 25-year and 200-year return periods for the three catchments zones: upstream 1-1, 1-2 and 1-3 of the Po Chang Keng Stream.
Table 3.
Q25 and Q200 peak flow volumes for different levels of land development in the upstream catchment area of the Po Cheng Keng Stream.
Table 3.
Q25 and Q200 peak flow volumes for different levels of land development in the upstream catchment area of the Po Cheng Keng Stream.
| | Peak flow (cms) | Upstream 1-1 catchment zone | Upstream 1-2 catchment zone | Upstream 1-3 catchment zone |
|---|
| Land development | | Q25 | Q200 | Q25 | Q200 | Q25 | Q200 |
|---|
| Current Condition (0%) | 62.37 | 70.07 | 70.07 | 66.47 | 66.47 | 78.92 |
| 10% | 64.38 | 72.25 | 72.25 | 68.57 | 68.57 | 81.45 |
| 20% | 66.27 | 74.43 | 74.43 | 70.66 | 70.66 | 83.85 |
| 40% | 70.17 | 79.02 | 79.02 | 74.86 | 74.86 | 88.79 |
| 60% | 74.07 | 83.03 | 83.03 | 79.06 | 79.04 | 93.72 |
4.2. Simulation Results
A simulation was conducted according to the above-mentioned criteria. The overall flood simulation results based on the 25-year and 200-year return period precipitation conditions are presented below.
4.2.1. 25-Year Return Period
For the entire middle reach of the Keelung River, the possible inundation area at the downstream zone under the current land use conditions and the precipitation criteria is 138.08 ha. When there is a 60% increase in land development at the upper catchments area,
Table 4 shows the possible inundation area would be increased to 159.36 ha, and there would be a 21.28-hectare increase of the inundation area in the entire simulation zone (15.41% increase).
Table 4.
The entire area’s flood area vs. the level of development for the 25-year return period.
Table 4.
The entire area’s flood area vs. the level of development for the 25-year return period.
| Area | Po Cheng Keng River | Kang Kao Keng Stream | Pei Kang Stream | Yu Jui Stream | Ma Ling Keng Stream | Total |
|---|
| Condition | Current | 60% | Current | 60% | Current | 60% | Current | 60% | Current | 60% | Current | 60% |
|---|
| 0.5–1.0 | 15.04 | 14.72 | 15.52 | 16.48 | 13.76 | 13.60 | 11.52 | 12.64 | 7.52 | 8.16 | 63.36 | 65.60 |
| 1.0–2.0 | 6.08 | 8.96 | 7.2 | 7.84 | 7.52 | 9.60 | 7.68 | 10.88 | 5.92 | 6.72 | 34.4 | 44.00 |
| 2.0–3.0 | 5.76 | 7.20 | 4.32 | 4.80 | 3.52 | 4.16 | 5.28 | 5.92 | 6.56 | 7.20 | 25.44 | 29.28 |
| >3.0 | 4.32 | 5.60 | 2.72 | 4.48 | 3.20 | 3.84 | 1.44 | 2.40 | 3.20 | 4.16 | 14.88 | 20.48 |
| Total | 31.20 | 36.48 | 29.76 | 33.60 | 28.00 | 31.20 | 25.92 | 31.84 | 23.2 | 26.24 | 138.08 | 159.36 |
A statistical analysis has been carried out on the increased inundation area at the downstream urban planning zone. For the entire middle reach of the Keelung River, the current land use includes 69.04 ha of possible inundation of the urban planning zone, which is approximately 9.88% of the entire urban planning zone. When the upper catchments area has a 60% increase of land development, the inundation area would be increased to 95.62 ha, which is approximately 13.68% of the entire urban planning zone. In addition, the inundation area of the entire simulated urban planning zone would have an increase of 26.58 ha, which is approximately 38.50% and shown in
Table 5.
Table 5.
Effects of different levels of upstream development on the Percentage of the Inundation Area of the Urban Planning Zone (25-year Return Period).
Table 5.
Effects of different levels of upstream development on the Percentage of the Inundation Area of the Urban Planning Zone (25-year Return Period).
| | Area (ha) | Current Condition | Level of Increase of Upstream Land Development |
|---|
| 10% | 20% | 40% | 60% |
|---|
| Inundation Depth (m) | | Area | %* | Area | %* | Area | %* | Area | %* | Area | %* |
|---|
| 0.5–1.0 | 31.68 | 4.53 | 33.36 | 4.77 | 34.91 | 4.99 | 37.12 | 5.31 | 39.36 | 5.63 |
| 1.0–2.0 | 17.20 | 2.46 | 19.80 | 2.83 | 21.86 | 3.13 | 24.17 | 3.46 | 26.40 | 3.78 |
| 2.0–3.0 | 12.72 | 1.82 | 13.98 | 2.00 | 15.12 | 2.16 | 16.23 | 2.32 | 17.57 | 2.51 |
| >3.0 | 7.44 | 1.06 | 8.90 | 1.27 | 10.11 | 1.45 | 10.94 | 1.57 | 12.29 | 1.76 |
| Total | 69.04 | 9.88 | 76.04 | 10.88 | 81.99 | 11.73 | 88.46 | 12.66 | 95.62 | 13.68 |
4.2.2. 200-Year Return Period
In general, for the entire middle reach of the Keelung River, the possible inundation area at the downstream simulation zone under the current land use condition is approximately 293.12 ha. If there were a 60% increase in land use at the upstream catchments area, the possible inundation area at the downstream simulation zone would increase to 318.24 ha. In other words, the inundation area of the simulation zone would increase by 25.12 ha, which is an approximately 8.57% increased and shown in
Table 6.
When calculating the increase of the flood-affected surface area of the downstream urban planning zone, the possible area affected by floods at the urban planning zone is 146.56 ha under the current land use situation, which is approximately 20.97% of the urban planning zone. If there were a 60% increase in land use at the upstream catchments area, a total of 190.94 ha would be affected by floods, which is 27.32% of the urban planning zone. In other words, there would be an increase of 44.38 ha of inundation area in the simulated urban planning zone, which is an approximate increase of 30.28% and shown in
Table 7.
Table 6.
The entire area’s inundation area at different levels of development for the 200-year return period.
Table 6.
The entire area’s inundation area at different levels of development for the 200-year return period.
| Area | Po Cheng Keng River | Kang Kao Keng Stream | Pei Kang Stream | Yu Jui Stream | Ma Ling Keng Stream | Total |
|---|
| Condition | Current | 60% | Current | 60% | Current | 60% | Current | 60% | Current | 60% | Current | 60% |
|---|
| 0.5–1.0 | 9.44 | 8.32 | 13.44 | 13.92 | 6.72 | 6.40 | 7.52 | 8.48 | 5.12 | 6.08 | 42.24 | 43.20 |
| 1.0–2.0 | 9.28 | 8.00 | 15.36 | 15.84 | 10.08 | 10.72 | 7.84 | 9.92 | 5.92 | 6.72 | 48.48 | 51.20 |
| 2.0–3.0 | 11.04 | 13.12 | 32.16 | 25.92 | 22.72 | 15.20 | 9.92 | 9.12 | 6.88 | 7.36 | 82.72 | 70.72 |
| >3.0 | 18.88 | 21.76 | 29.44 | 44.96 | 46.24 | 55.52 | 12.64 | 16.48 | 12.48 | 14.44 | 119.68 | 153.12 |
| Total | 48.64 | 51.20 | 90.40 | 100.64 | 85.76 | 87.84 | 37.92 | 44.00 | 30.40 | 34.56 | 293.12 | 318.24 |
Table 7.
Effects of different levels of upstream development on the percentage of inundation area of the urban planning zone (200-year return period).
Table 7.
Effects of different levels of upstream development on the percentage of inundation area of the urban planning zone (200-year return period).
| | Area (ha) | Current Condition | Level of Increase of Upstream Land Development |
|---|
| 10% | 20% | 40% | 60% |
|---|
| Inundation Depth (m) | | Area | %* | Area | %* | Area | %* | Area | %* | Area | %* |
|---|
| 0.5-1.0 | 21.12 | 3.02 | 22.30 | 3.19 | 23.16 | 3.31 | 24.62 | 3.52 | 25.92 | 3.71 |
| 1.0-2.0 | 24.24 | 3.47 | 26.04 | 3.73 | 27.13 | 3.88 | 28.82 | 4.12 | 30.72 | 4.40 |
| 2.0-3.0 | 41.36 | 5.92 | 40.93 | 5.86 | 40.00 | 5.72 | 41.40 | 5.92 | 42.43 | 6.07 |
| >3.0 | 59.84 | 8.56 | 68.47 | 9.80 | 75.77 | 10.84 | 84.18 | 12.04 | 91.87 | 13.15 |
| Total | 146.56 | 20.97 | 157.75 | 22.57 | 166.41 | 23.81 | 179.03 | 25.62 | 190.94 | 27.32 |
5. Analysis and Application of the Simulation Results
This study adopted the SOBEK flood simulation tool for the middle reaches of the Keelung River. The simulation was conducted for two precipitation conditions: 25-year and 200-year return periods. A total of five development conditions were simulated: the current development condition at Hsi Chih and Chi Du, which are at the middle reach of Keelung River, and an increase of 10%, 20%, 40% and 60% of land development at the upstream catchments area. The results from the simulation and relevant land use policies are summarized below.
5.1. Application and Analysis of Flood Potential Simulation Results
The results of the 25-year and 200-year return period precipitation condition simulations at Hsi Chih and Chi Tu, which are at the middle stream of the Keelung River, were analyzed and are summarized as follows:
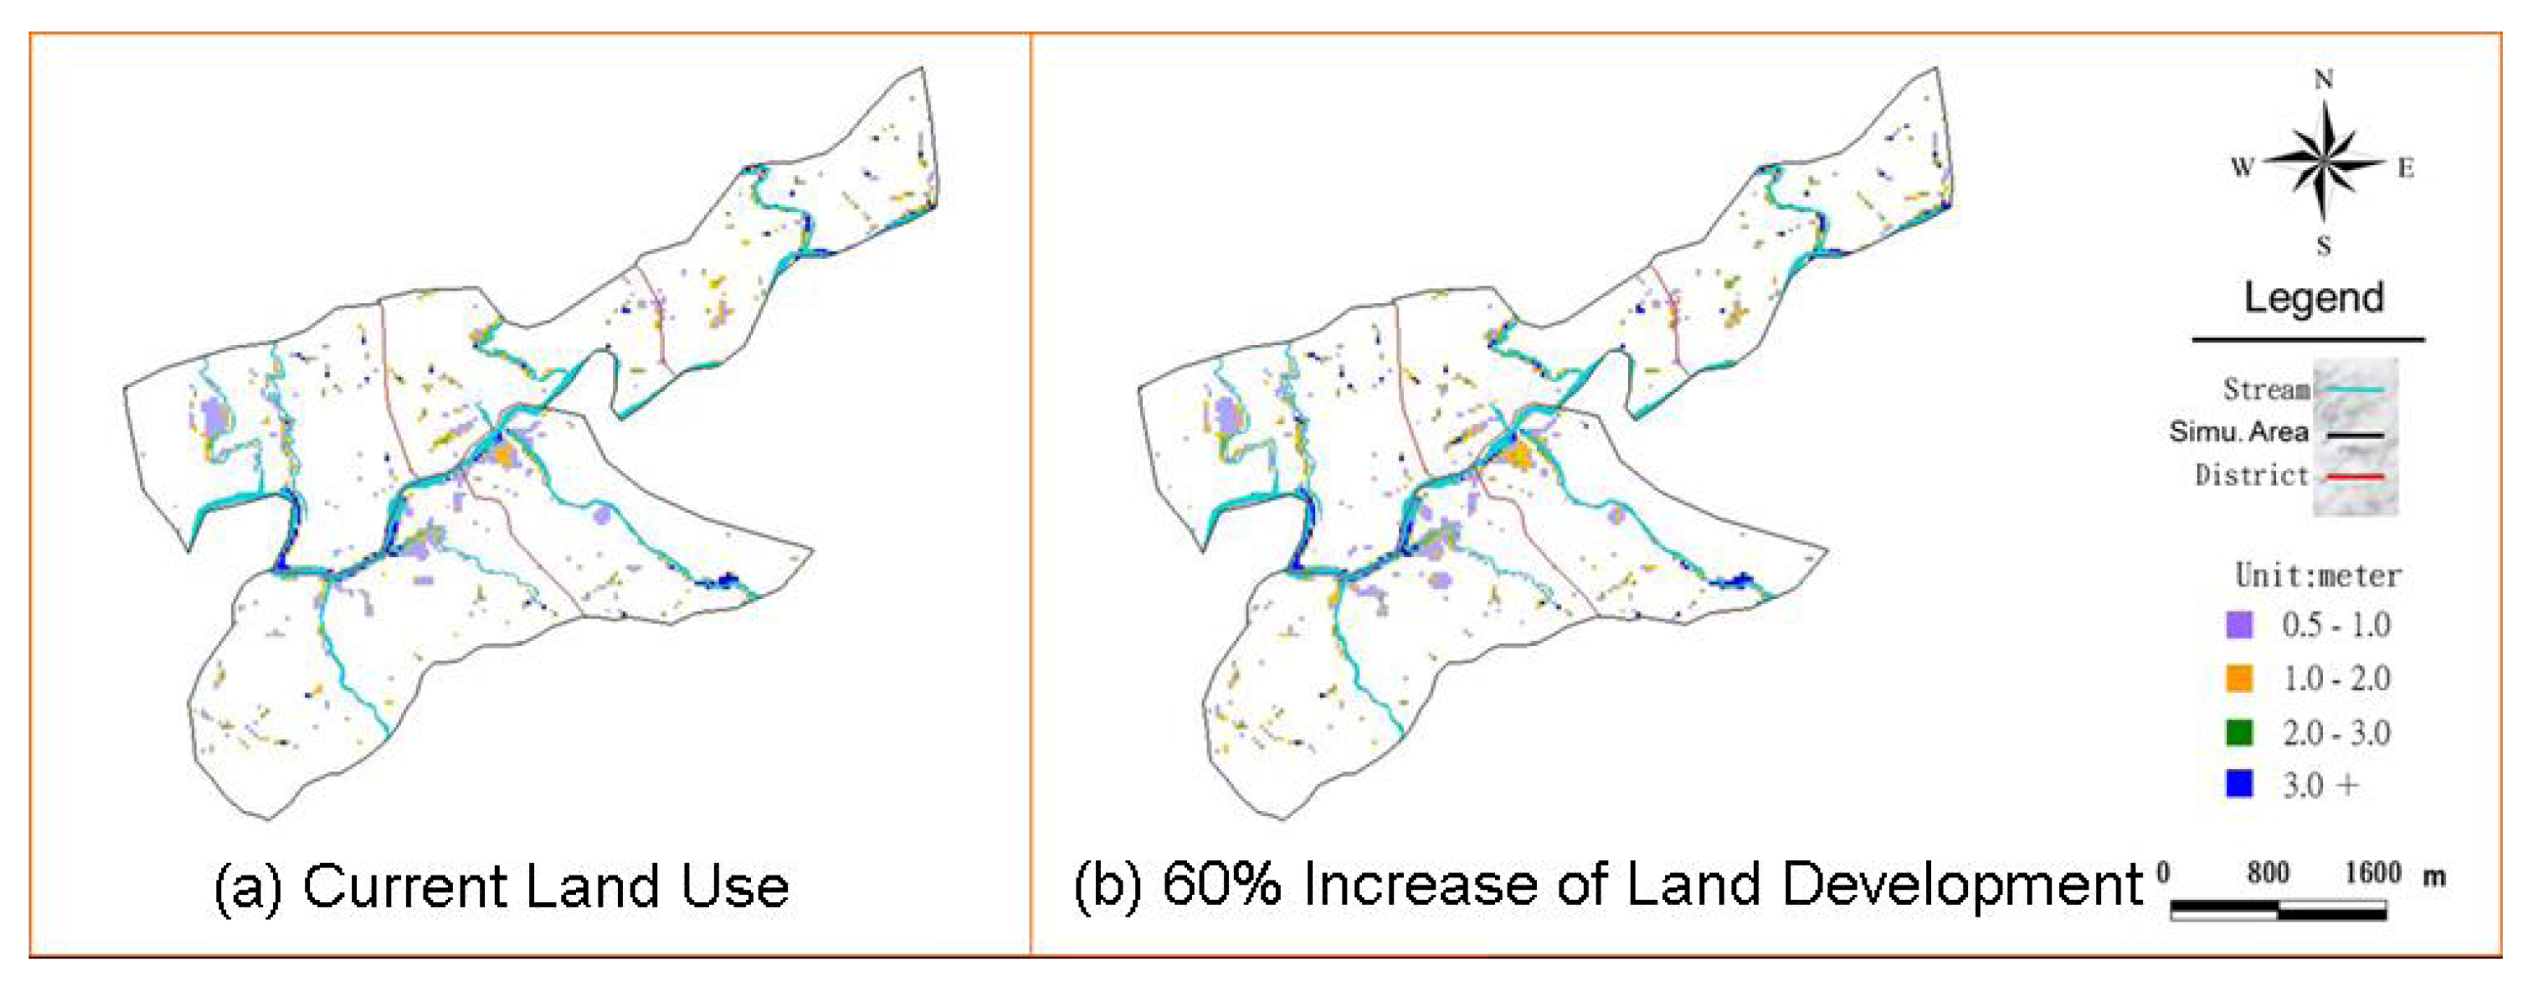
(1) Results from simulating the 25-year return period precipitation conditions at the middle reaches of the Keelung River:
The possible inundation area of the downstream simulation zone under current land use conditions is 138.08 ha and shown in
Figure 3,
Table 8. If there is a 60% increase in land use at the upstream catchments area, the area possibly affected by floods will be 159.36 ha, which is an approximate increase of 21.28 ha (15.41%) of inundation area in the simulation zone.
Figure 3.
25-year Return Period Precipitation Conditions: Flood Simulation of Current Land Use vs. 60% Increase of Land Development.
Figure 3.
25-year Return Period Precipitation Conditions: Flood Simulation of Current Land Use vs. 60% Increase of Land Development.
Table 8.
25- and 200-year return periods: Inundation area of current land use conditions vs. 60% Increase of the overall region vs. the urban planning zone.
Table 8.
25- and 200-year return periods: Inundation area of current land use conditions vs. 60% Increase of the overall region vs. the urban planning zone.
| | Area (ha) | Overall Inundation Area | Urban Planning Zone Inundation Area |
|---|
| Return Period (yr) | | Current Condition | Upstream 60% Increase of Land Development | Increase | %* | Current Condition | Upstream 60% Increase of Land Development | Increase | %* |
|---|
| 25 | 138.08 | 159.36 | 21.28 | 15.41 | 69.04 | 95.62 | 26.58 | 38.50 |
| 200 | 293.12 | 318.24 | 25.12 | 8.57 | 146.56 | 190.94 | 44.38 | 30.28 |
The possible inundation area of the urban planning zone under current land use conditions is 69.04 ha. If there is a 60% increase in land use at the upstream catchments area, the area possibly affected by floods will be 95.62 ha, which is an approximate increase of 26.58 ha (38.50%) of inundation area in the simulation zone.
The proportion of increase in the inundation area of the urban planning zone is 2.5-fold greater than that of the overall simulation zone. When an increasing proportion of upstream land is used for development, the inundation area of the simulation zone will be increased.
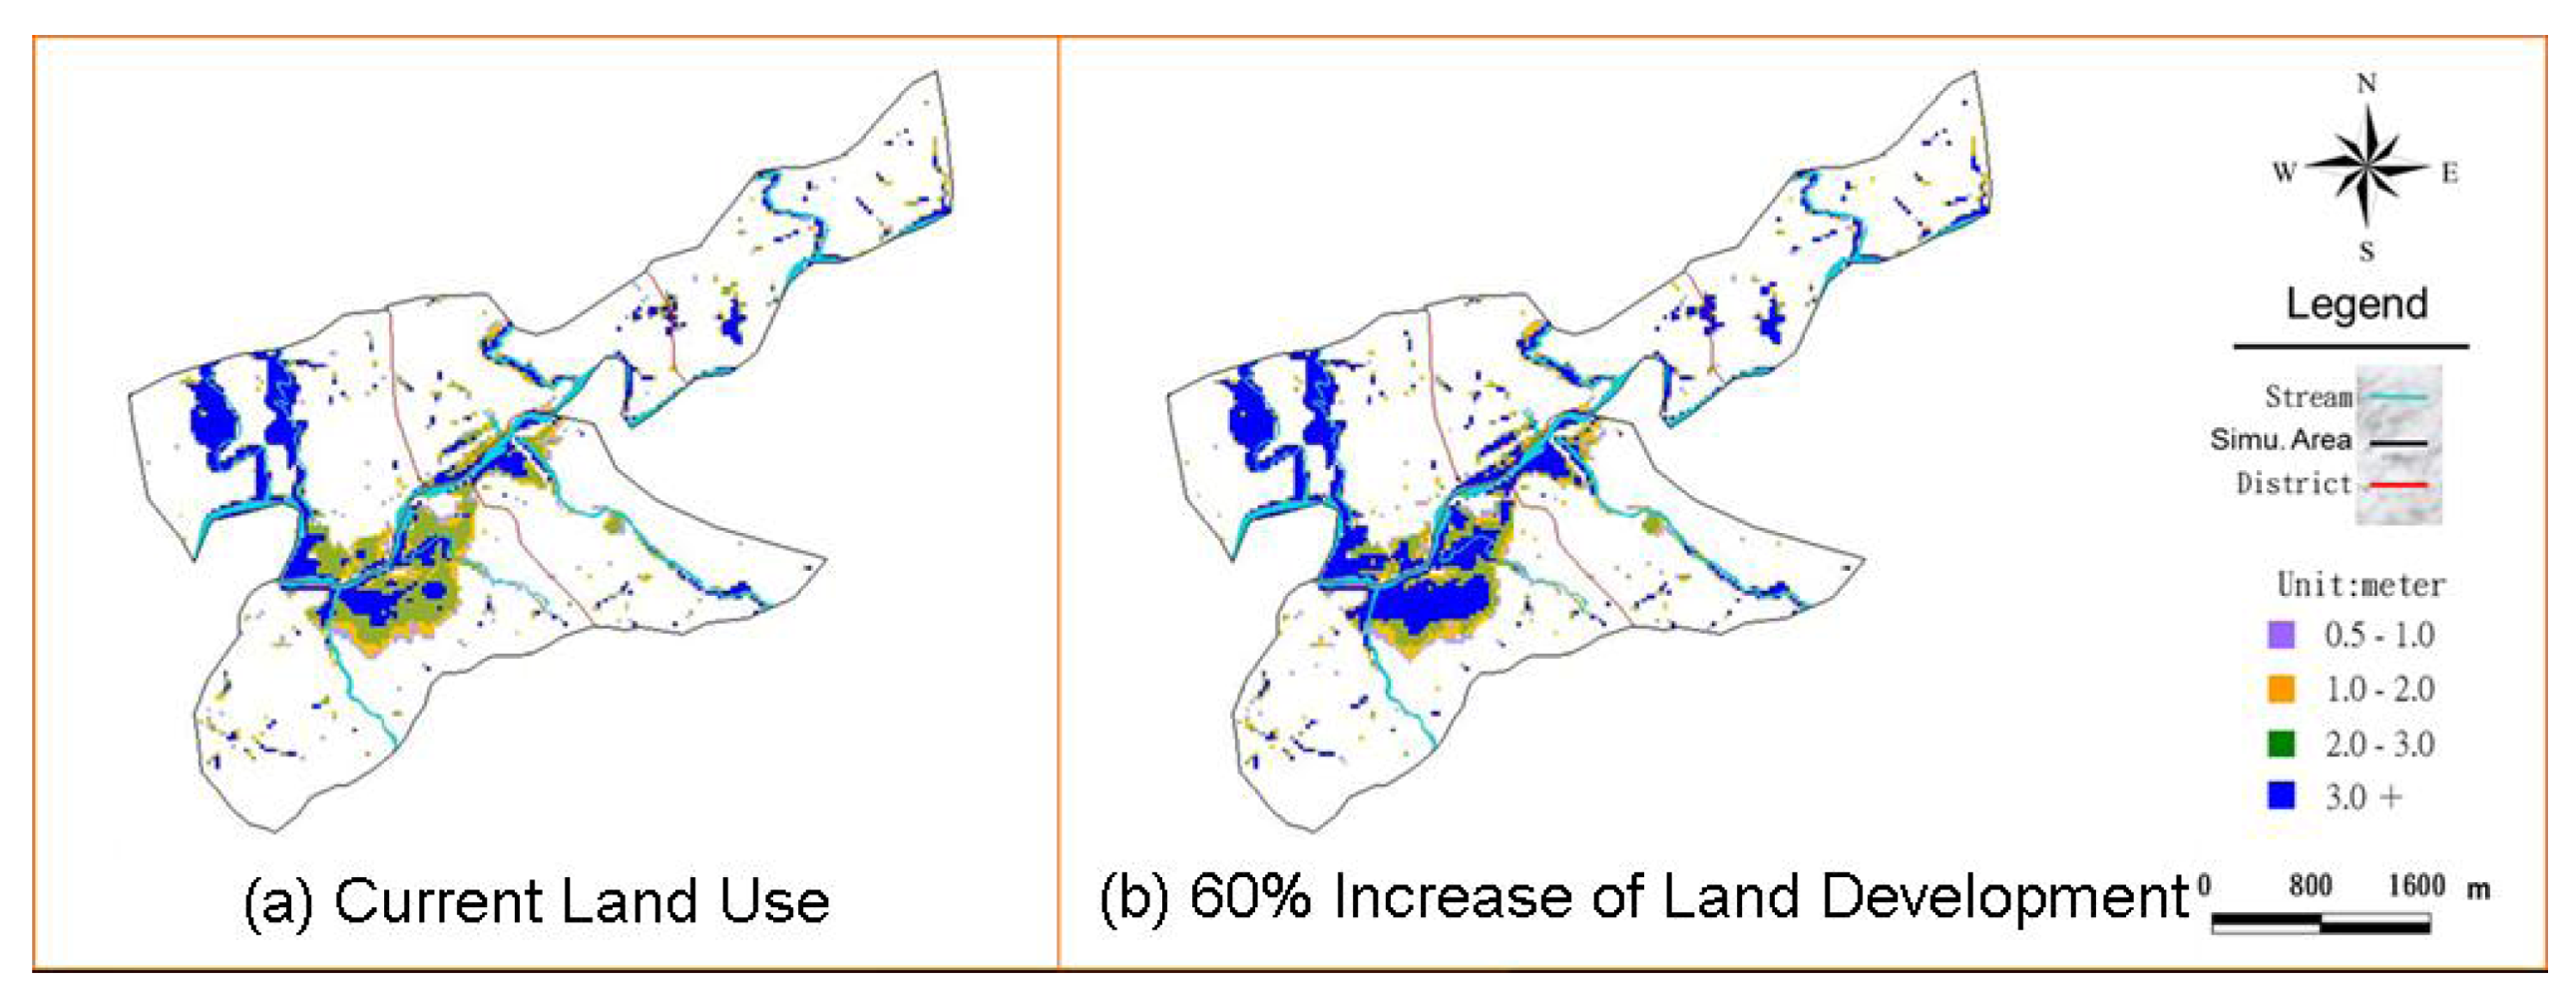
(2) Results from simulating the 200-year return period precipitation conditions at the middle reach of the Keelung River:
The possible inundation area of the downstream simulation zone under the current land use conditions is increased to 293.12 ha and shown in
Figure 4,
Table 8. If there is a 60% increase in land use at the upstream catchments area, the area possibly affected by floods will be 318.24 ha, which is an approximate increase of 25.12 ha (8.57%) of inundation area in the simulation zone.
The possible inundation area of the urban planning zone under current land use conditions is 146.56 ha. If there is a 60% increase in land use at the upstream catchments area, the area possibly affected by floods will be 190.94 ha, which is an approximate increase of 44.38 ha (30.28%) of inundation area in the simulation zone.
The proportion of increase of inundation area in the urban planning zone is 3.5-fold greater than that of the overall simulation zone. With an increased proportion of upstream land used for development, there will be an increase of flood risk to urban planning zones.
Figure 4.
200-year return period Precipitation Conditions: Flood Simulation of Current Land Use vs. 60% Increase of Land Development.
Figure 4.
200-year return period Precipitation Conditions: Flood Simulation of Current Land Use vs. 60% Increase of Land Development.
(3) According to these simulation results, an increase of land development at the upstream basin would increase the size of the area affected by floods as well as the depth of floods. Although the proportion of the increase of the inundation area is not significant, the increase happens mostly at the coastal area along the downstream of the river branches, which could increase the flood risk to areas around these downstream branches. Taking the Po Chang Ken Stream as an example, with increasing land development at the upstream, floods would mostly happen at downstream coastal areas, thus posing an increased flood risk to the downstream areas of the stream. If the development of upstream hillside land is not well planned and managed, there will be an increase of flood risk to this downstream region. Moreover, considering the limited flood tolerance of the Keelung River, there should be a total mass control for hillside land development. Moreover, the policy of suspending development greater than ten hectares should be maintained.
(4) In calculating the volume of detention ponds of large areas to be developed all at once or in series (because the base period is an hour and the time of concentration varies), the total detention volume of the two after the development is fully completed would be different, i.e., the volume of the serial development would be smaller than that of the all-at-once development. Therefore, the total development mass should be considered in the future for hillside development regulations.
6. Conclusions
(1) The inundation simulations and flood risks were carried out in Chi Tu and Hsi Chih, which are at the upper and middle reaches of the Keelung River in Taiwan. The upper reach was divided into various sub-catchments zones based on characteristics of the drainage route of the branches. The discharges of river before and after development was calculated and used as threshold criteria for the lower reach flood simulation.
(2) The entire catchments for the simulation were divided into a two-dimensional simulation zone and an upstream catchments zone. Flood simulation was conducted for five levels of development: the current land use conditions of the area and 10%, 20%, 40% and 60% increases of land development. The volume of flow into the downstream catchments area and impacts from flow on floods were assessed.
(3) The simulation results show that an increase of land development at the upstream basin would increase the size of the area affected by floods as well as the depth of floods. Although the proportion of increase of the inundation area is not significant, it could increase inundation risk for areas at the downstream branches because inundation occurs mainly at the coastal area along the downstream of river branches.
(4) Under the precipitation conditions for the 25- and 200-year return periods, the inundation area, with 60% increase in land development at the upstream catchments sub-zone, would be 21.28 ha and 25.12 ha larger (approximately 15.41% and 8.57%) than the area with the current land use in the entire simulation zone, as well as the urban planning zone would be 26.58 ha and 44.38 ha larger (approximately 38.50% and 30.28%) than the area with the current land use. With an increase of the proportion of land development in the upstream area, the urban planning zone’s inundation risk will be greater than that of other areas.
(5) If there is a 40% increase of land development at the upstream catchments area of Hsi Chih and Chi Tu, the water stages would exceed the elevation of levels in the Keelung River for some specific sections. Therefore, whether there is 10%, 20% or 40% increase of land development in the upstream, there would be an increase in flood potential risk in the downstream, adding greater loads of flood hazard mitigation to the main stream of the Keelung River.
(6) According to the above-mentioned simulation results, the hillside development regulations for Hsi Chih and Chi Tu, i.e., the areas at the middle or upper reaches, should be based on total mass control, and the threshold level for development should be 40%. To reflect the hydrological and geological features of each region in the future, flood potential analysis should be performed to determine the threshold for hillside land development.


 Flow rate (m/s).