Protecting People, Infrastructure, Economies, and Ecosystem Assets: Water Management in the Face of Climate Change

Abstract
:1. Introduction
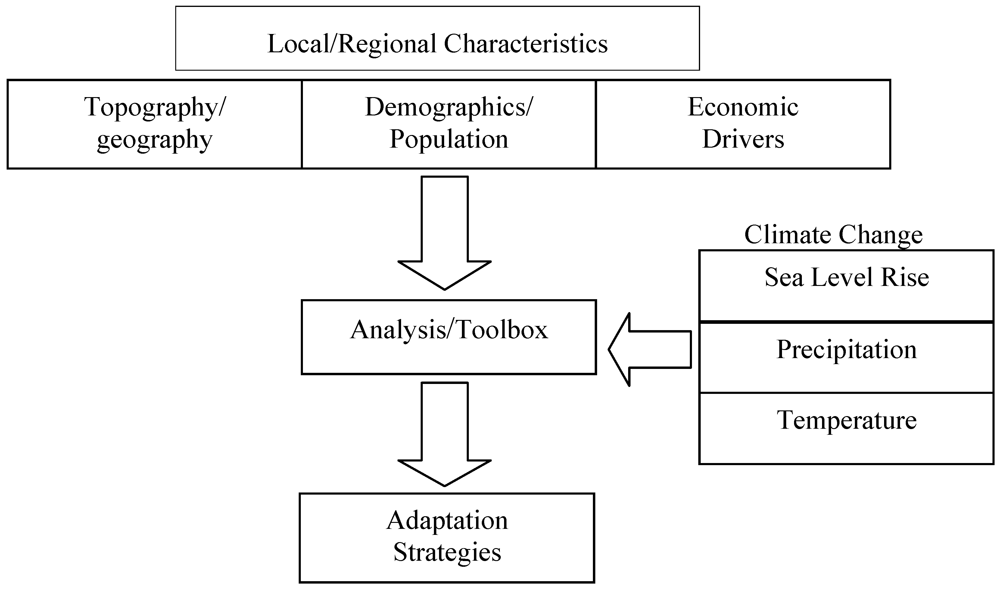
2. Methodology
3. Discussion of Florida Case Study
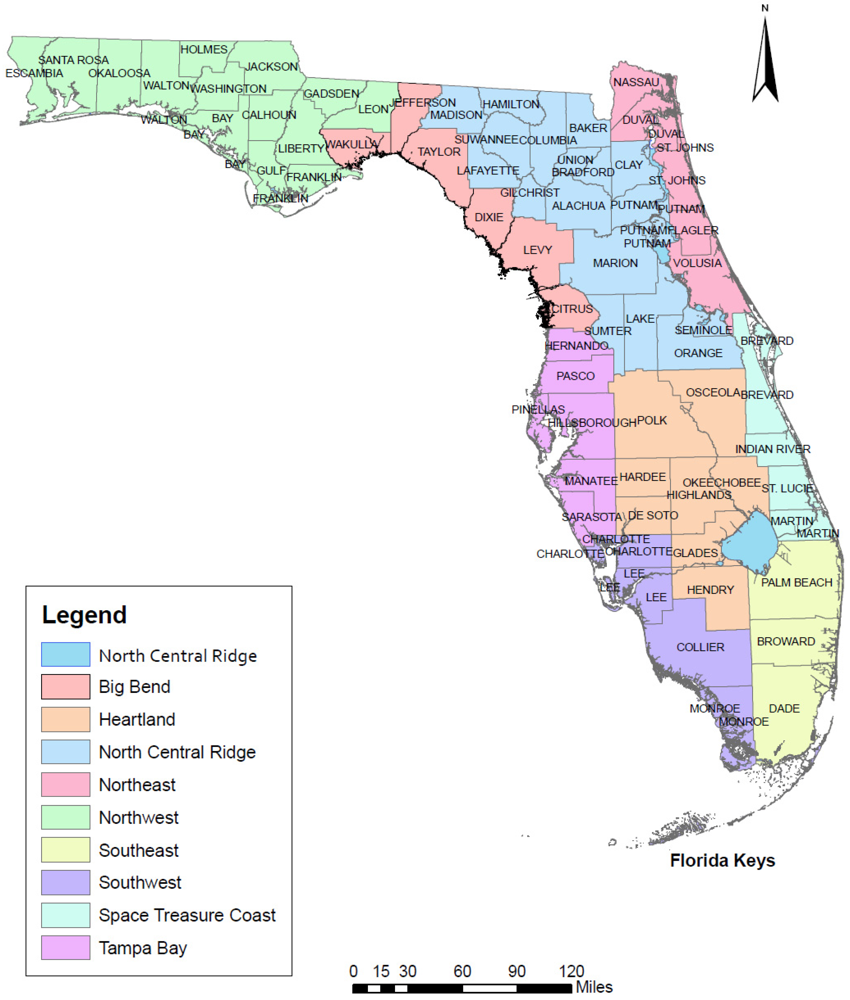
3.1. Description of the State Florida
3.2. Separating differences Across Demographics and Economics

| Region | Geography/Geology | Economic Drivers | Water Needs |
|---|---|---|---|
| SE Florida | Extremely low-relief topography, has coastal ridge, lower inland, porous, permeable limestone | Tourism, import/export to Latin America, Housing, agriculture, medical, fishing/reefs | Growing for Tourism, housing, decrease for Agriculture |
| Kissimmee River Valley | Low in Kissimmee River Valley, but contains among highest land in state on sand ridges | Agriculture, Mining | Agriculture increasing |
| Florida Keys | Flat, generally under 5 ft NAV 88 | Tourism | Low growing for Tourism |
| Southwest Coast | Slight upward incline going inland, limited relief, no coastal ridge or barrier | Tourism, Housing, some Agriculture | Growing for Tourism, housing, less for Agriculture |
| Tampa Bay | Low coast, but steady incline inland | Tourism, Housing, Fishing , limited Agriculture, import/export | Growing for Tourism, housing, decrease for Agriculture |
| Space/Treasure Coast | Low coast, but steady incline inland | Tourism, Agriculture, Housing | Growing for housing, decrease for Agriculture |
| Northwest | Significant fast increase inland, limited coastal exposure | Tourism, Agriculture | Growing for Tourism, Steady for Agriculture |
| Big Bend/Suwanee | Flat coastal plain, higher relief inland, no barrier | Agriculture | Steady |
| NE Florida/St. John’s River | Coastal ridge between St Johns River and Atlantic, slope decreases to near sea level both directions | Tourism, agriculture, some industry | Growing for housing, Agriculture |
| North Central Ridge | Higher elevation, no coastal exposure, sand and sandy clay ridge, reduced infiltration | Tourism, agriculture, Housing | Growing for Tourism, housing, Agriculture |
3.3. Projected Climate Change Impacts.
4. Results
| Region | Potential Raw Water Supply Options | Water Supply Volumes | Water Supply Challenges |
|---|---|---|---|
| SE Florida | Biscayne Aquifer Floridan Aquifer Atlantic Ocean | High, sustainable Not sustainable High, cost concern | Higher Groundwater table, Everglades intrusion of saltwater may contaminate wellfields, balance storrmwater, wastewater disposal and water supply objectives, saltwater migration, lack of storage, less summer rainfall |
| Kissimmee River Valley | Floridan Aquifer (freshwater) Lake Okeechobee Surface waters | High, may be reaching limitations Very limited Limited | Level of Lake Okeechobee, sand aquifers, limited quantities, changes in rainfall patterns |
| Florida Keys | Floridan Aquifer Gulf of Mexico | Limited High, cost concern | Inundation |
| Southwest Coast | Surface waters Various aquifers Gulf of Mexico | High, reached limit? Sustainable High, cost concern | Alternative water supply options, changes in rainfall patterns |
| Tampa Bay | Biscayne Aquifer (Mainland) Gulf of Mexico | Not sustainable High, cost concern | Higher groundwater tables, Alternative water supply options, saltwater migration, lack of storage, less summer rainfall |
| Space/Treasure Coast | Floridan Aquifer Gulf of Mexico | Currently sustainable High, cost concern | Higher groundwater tables, Alternative water supply options, lack of storage, less summer rainfall |
| Northwest | Surface waters Surficial aquifer Gulf of Mexico | High, climate sensitive Low High—limits on access, disposal options, cost | Supply, changes in rainfall patterns |
| Big Bend/Suwanee | Surface waters Floridan aquifer Atlantic Ocean | Medium, climate sensitive High—reached limits? High—limits on access, disposal options, cost | Supply, changes in rainfall patterns |
| NE Florida/St. John’s River | St John’s River/Surface waters Floridan aquifer Atlantic Ocean | Medium, climate sensitive Medium—reached limits? High—limits on access, disposal options, cost | Saltwater migration up St Johns River contaminates wellfields from west, supply, Alternative water supply objectives, changes in rainfall patterns, storage |
| North Central Ridge | Floridan Aquifer Surface waters | Limited, may be reaching limitations | Alternative water supply options, changes in rainfall patterns |
| Region | Move Wellfields | Storage | Aquifer Storage and Recovery (ASR) | Horizontal Well/Infiltration gallery potential? | Desalination | Surface water |
|---|---|---|---|---|---|---|
| SE Florida | Yes—avoid impacts form sea level rise on west in Miami Dade County | limited | Has not been demonstrated to work | Yes, need demonstration of effort combined with surface/stormwater | Yes, cost and power limitations | no |
| Kissimmee River Valley | No | limited | Has not been demonstrated to work | Limited sites available | No access | Some potential may exist |
| Florida Keys | No, need desalination or mainland | no | Has not been demonstrated to work | No | Yes, cost and power limitations | no |
| Southwest Coast | Yes, inland and to brackish water sources with Reverse osmosis plants | limited | Operational | Yes, need demonstration of effort combined with surface/stormwater | Yes, cost and power limitations | yes |
| Tampa Bay | No, Currently reducing aquifer use, desalination option | limited | Potential projects, arsenic issues | Yes, need demonstration of effort combined with surface/stormwater | Yes, cost and power limitations | yes |
| Space/Treasure Coast | Yes, but conflicts with Agricultural, ecosystem, supply limits | limited | Has not been demonstrated to work | Yes, need demonstration of effort combined with surface/stormwater | Yes, cost and power limitations | No |
| Northwest | Yes, but limited supply, conflicts with Agricultural | yes | Has not been demonstrated to work | No | Limited, cost and power limitations | Current supply |
| Big Bend/Suwanee | Yes, but limited supply, conflicts with Agricultural | Limited near coast | Has not been demonstrated to work | No | Limited, cost and power limitations | yes |
| NE Florida/St. John’s River | Yes, but conflict with St Johns River, ecosystems, limited supply | Some potential exists | Has not been demonstrated to work | Yes, need demonstration of effort combined with surface/stormwater | Yes, cost and power limitations | Partial current supply, limited availability |
| North Central Ridge | no | limited | Has not been demonstrated to work | Limited sites available | No access | Some potential may exist |
| Region | Seal Sewers | Sewer Service | Reuse | Aquifer Recharge | Recharge Water Conservation Areas s | Deep Wells | Salinity Structures | Local pumping of SW |
|---|---|---|---|---|---|---|---|---|
| SE Florida | Yes, needs to be done to protect other wastewater disposal options | 500,000 septic tanks to sewer creates major treatment and disposal need | Yes, north of Broward & Miami-Dade Co., limited sites Broward and Miami-Dade, need other options; flooding likely to prevent wholesale solution in future | Yes, need RO/AOP/UV cost and power limitations | Yes, need RO/AOP/UV cost and power limitations | Yes, limited issues | Needed, political and property rights issues in play | Yes, environmental permitting issues will arise. |
| Kissimmee River Valley | Yes not related to wastewater quality | Limited need for change | Yes, current practice | Yes, need RO/AOP/UV cost and power limitations | No | No | Not an issue | Not a major issue |
| Florida Keys | Yes, needs to be done to protect other wastewater plants | Septic conversion ongoing | No | No | No | No | Not an issue, area too vulnerable for this to matter | Not solving problem |
| Southwest Coast | Yes, needs to be done to protect other wastewater disposal options | Convert septic tanks to sewer creates major treatment and disposal | Yes, current practice | Yes, need RO/AOP/UV cost and power limitations | No | Yes | Needed, but inundation will render them useless with time | Yes, environmental permitting issues will arise; limits as sea level inundates areas |
| Tampa Bay | Yes, needs to be done to protect other wastewater disposal options | Convert septic tanks to sewer creates major treatment and disposal need along coast | Yes, current practice | Yes, need RO/AOP/UV cost and power limitations | No | No | Needed for saltwater intrusion | Yes, environmental permitting issues will arise. |
| Space/Treasure Coast | Yes, needs to be done to protect other wastewater disposal options | Convert septic tanks to sewer creates major treatment and disposal need along coast | Yes, current practice | Yes, need RO/AOP/UV cost and power limitations | No | Yes | Not a major issue | Yes, environmental permitting issues will arise. |
| Northwest | Yes, needs to be done to protect other wastewater system | Convert septic tanks to sewer creates major treatment and disposal need along coast | Yes, may require more treatment, cost, power limitation | No | No | No | Not a major issue | Not a major issue |
| Big Bend/Suwanee | Yes, needs to be done to protect other wastewater systems and disposal options | Convert septic tanks to sewer creates major treatment and disposal need along coast | Yes, may require more treatment, cost, power limitation | No | No | No | Needs more evaluation | Not a major issue |
| NE Florida/St. John’s River | Yes, needs to be done to protect other wastewater disposal options | Convert septic tanks to sewer creates major treatment and disposal need along coast | Yes | Probably not, geology limitation | No | No | Yes, needs more evaluation, political and property issues in play | Limited to coastal areas, permits may be an issue |
| North Central Ridge | Yes not related to wastewater quality | Limited need for change | Yes, current practice | Yes, need RO/AOP/UV cost and power limitations | No | No | Not an issue | Not a major issue |
| Region | Population | Sea Level Rise Risk | Surge Risk | Water Supply Availability(Excl desalination) | Available Water Treatment Options | Economic Risk of Climate Change | Opportunity to Protect Property | Cost to Protect |
|---|---|---|---|---|---|---|---|---|
| SE Florida | H | H | H | H | H | H | M | H |
| Kissimmee River Valley | L | L | L | M | M | L | H | L |
| Florida Keys | L | H | H | L | H | H | U | U |
| Southwest Coast | M | H | H | H | M | M | L | U |
| Tampa Bay | H | H | H | M | H | M | M | U |
| Space/Treasure Coast | M | L | H | M | L | L | H | L |
| Northwest | L | L | M | L | L | L | H | L |
| Big Bend/Suwanee | L | M | M | L | L | L | L | L |
| NE Florida/St. John’s River | M | M | M | M | L | M | H | L |
| North Central Ridge | L | L | L | M | L | L | H | L |
5. Conclusions
References
- IPCC. Intergovernmental panel on climate change, Climate Change 2007: The Physical Science Basis; Cambridge University Press: Cambridge, UK, 2007.
- UNEP, Climate Change Science Compendium 2009; United Nations Environmental Programme: New York, NY, USA, 2009.
- Karl, T.R.; Melillo, J.M. U.S. Global Change Research Program, Global Climate Change Impacts in the United States; Peterson, T.C., Ed.; Cambridge University Press: Cambridge, UK, 2009. Available online: http://www.globalchange.gov/publications/reports/scientific-assessments/us-impacts/full-report (accessed on 26 March 2012).
- Heimlich, B.N.; Bloetscher, F.; Meeroff, D.E.; Murley, J. Southeast Florida’s Resilient Water Resources: Adaptation to Sea Level Rise and other Climate Change Impacts; Florida Atlantic University: Boca Raton, FL, USA, 2009.
- Risk and Vulnerability Assessment Tool (RVAT). NOAA Coastal Services Center: Charleston, SC, USA, 2011. Available online: http://www.csc.noaa.gov/rvat/ (accessed on 26 March 2012).
- Freas, K.; Bailey, R.; Muneavar, A.; Butler, S. Incorporating climate change in water planning. J. Am. Water Works Ass. 2008, 100, 93–99. [Google Scholar]
- Marshall, C.H.; Pielke, R.A.; Steyaert, L.T.; Debra, A.W. The impact of anthropogenic land—Cover change on the Florida Peninsula sea breezes and warm season sensible weather. Mon. Wea. Rev. 2004, 132, 28–52. [Google Scholar]
- Backlund, P. Synthesis and Assessment Product 4.3: The Effects of Climate Change on Agriculture, Land Resources, Water Resources, and Biodiversity in the United States. 27 May 2008. Available online: http://www.climatescience.gov/Library/sap/sap4-3/final-report/default.htm#EntireReport (accessed on 22 February 2012).
- Bloetscher, F.; Heimlich, B.N.; Meeroff, D.M. Development of an adaptation toolbox to protect Southeast Florida water supplies from climate change. Environ. Rev. 2011, 19, 1–21. [Google Scholar]
- Grinsted, A.J. Reconstructing sea level from Paleo and projected temperatures 200 to 2100 AD. Clim. Dyn. 2009, 34, 461–472. [Google Scholar]
- Rahmstorf, S. A semi-empirical approach to projecting future sea-level rise. Science 2007, 315, 368–370. [Google Scholar]
- Portland Climate Change Efforts; Office of Sustainable Development: Portland, OR, USA, 2003. Available online: http://www.portlandonline.com/bps/index.cfm?a=112117&c=41917 (accessed on 26 March 2012).
- Palmer, R.N.; Hahn, M. The Impacts of Climate Change on Portland’s Water Supply: An Investigation of Potential Hydrologic and Management Impacts on the Bull Run System; Portland Water Bureau: Portland, OR, USA, 2002. Available online: http://cses.washington.edu/db/pdf/palmerhahnportland111.pdf (accessed on 26 March 2012).
- RMCO. Colorado Climate Scorecard: The Implementation Status of the Colorado Climate Action Plan and RMCO’s Climate Action Panel Recommendations; Rocky Mountain Climate Organization: Denver, CO, USA, 2009. Available online: http://www.rockymountainclimate. org/images/CO%20Scorecard%20Update.pdf (accessed on 26 March 2012).
- Bloetscher, F.; Meeroff, D.; Heimlich, B.N.; Brown, A.R.; Bayler, D.; Loucraft, M. Improving the Resilience of a Municipal Water Utility against the Likely Impacts of Climate Change—A Case Study; Florida Water Utility: Pompano beach, FL, USA, 2009. [Google Scholar]
- Murley, J. Charting the Course, Where is South Florida Heading; Florida Atlantic University: Boca Raton, FL, USA, 2006. [Google Scholar]
- 2009 California Climate Adaptation Strategy: A Report to the Governor of the State of California in Response to Executive Order; S-13-2008; California Natural Resources Agency: Sacramento, CA, USA, 2009.
- Littell, J.S.; M. McGuire, L.C.; Whitely, B. ; Whitely B. The Washington Climate Change Impacts Assessment: Evaluating Washington’s Future in a Changing Climate; Climate Impacts Group,University of Washington: Seattle, WA, USA, 2009. Available online: http:// www.cses.washington.edu/db/pdf/ wacciaexecsummary638.pdf (accessed on 26 March 2012).
- Assessment and Action Plan—A Report Based on the Ongoing Work of the DEP Climate Change Task Force; Department of Environmental Protection: New York, NY, USA, 2008.
- Nicholls, R.J. Ranking Port Cities with High Exposure and Vulnerability to Climate Extremes; OECD Environment Working Papers: Paris, France, 2008. [Google Scholar]
- Mulkey, S. Climate change and land use in Florida: Interdependencies and opportunities. Presented at Century Commission for a Sustainable Florida: Tallahassee, FL, USA, 2007. [Google Scholar]
- Bloetscher, F.; Heimlich, B.N.; Romah, T. Counteracting the effects of sea level rise in Southeast Florida. J. Environ. Sci. Eng. 2011, 5, 1507–1525. [Google Scholar]
- Pielke, R.A.; Steyaert, L.T.; Vidale, P.L.; Liston, G.E.; Lyons, W.A.; Chase, T.N. The influence of anthropogenic landscape changes on weather in south Florida. Weather Rev. 1999, 127, 1663–1673. [Google Scholar]
- Obeysakara, J.; Park, J.; Irizarry, Q.M.; Trimble, P.; Barnes, J.; van-Arman, J.; Said, W.; Gadzinski, E. Past and Projected Trends in Climate and Sea Level for South Florida, Hydrologic and Environmental Systems Modeling Technical Report. The South Florida Water Management District: West Palm Beach, FL, USA, 2011; p. 171. [Google Scholar]
- Obeysekera, J.S. Climate change and water management: Planning for sea level rise. In Presented at Broward Climate Change Task Force, Science and Technology Subcommittee, Broward County, FL, USA; 2009. [Google Scholar]
- Bloetscher, F.; Muniz, A. Climate Change Impacts on Florida Water Supplies. In Presented at America Water Works Association Annual Conference and Exposition Proceedings, Denver, CO, USA; 2009. [Google Scholar]
- Reilly, T.E.; Dennehy, K.F.; Alley, W.M.; William, L.C. Ground Water Availability in the United States; USGS: Reston, VA, USA, 2009. [Google Scholar]
- Global Insight. The role of metro areas in the US Economy; Reported for The United States Conference of Mayors, Washington, DC, USA, 1 March 2006. Available online: http://usmayors.org/metroeconomies/Top100_2006.pdf (accessed on 14 February 2012).
- Johns, G.; Leeworthy, V.R.; Bell, F.W.; Bonn, M.A. Socioeconomic Study of Reefs in Southeast Florida: Final Report; Hazen and Sawyer: Hollywood, FL, USA, 2003. [Google Scholar]
© 2012 by the authors; licensee MDPI, Basel, Switzerland. This article is an open-access article distributed under the terms and conditions of the Creative Commons Attribution license (http://creativecommons.org/licenses/by/3.0/).
Share and Cite
Bloetscher, F. Protecting People, Infrastructure, Economies, and Ecosystem Assets: Water Management in the Face of Climate Change. Water 2012, 4, 367-388. https://doi.org/10.3390/w4020367
Bloetscher F. Protecting People, Infrastructure, Economies, and Ecosystem Assets: Water Management in the Face of Climate Change. Water. 2012; 4(2):367-388. https://doi.org/10.3390/w4020367
Chicago/Turabian StyleBloetscher, Frederick. 2012. "Protecting People, Infrastructure, Economies, and Ecosystem Assets: Water Management in the Face of Climate Change" Water 4, no. 2: 367-388. https://doi.org/10.3390/w4020367
APA StyleBloetscher, F. (2012). Protecting People, Infrastructure, Economies, and Ecosystem Assets: Water Management in the Face of Climate Change. Water, 4(2), 367-388. https://doi.org/10.3390/w4020367