Atmospheric Rivers, Floods and the Water Resources of California

Abstract
:
1. Introduction
2. Data, Models and Storm Chronologies
2.1. Data
2.2. Models
2.3. Storm Chronologies

| # | WY1998 | WY1999 | WY2000 | WY2001 | WY2002 | WY2003 | WY2004 | WY2005 | WY2006 | WY2007 | WY2008 |
|---|---|---|---|---|---|---|---|---|---|---|---|
| 1 | 19971002 | 19981108 | 19991014 | 20010328 | 20011011 | 20021107 | 20031005 | 20041009 | 20051026 | 20061103 | 20071019 |
| 2 | 19971009 | 19981121 | 19991026 | 20010515 | 20011030 | 20021108 | 20031109 | 20041018 | 20051107 | 20061113 | 20071028 |
| 3 | 19971029 | 19981123 | 19991028 | 20010516 | 20011116 | 20021109 | 20031129 | 20041026 | 20051108 | 20061117 | 20071029 |
| 4 | 19971031 | 19990115 | 19991110 | 20010605 | 20011122 | 20021213 | 20031130 | 20041227 | 20051125 | 20061120 | 20071111 |
| 5 | 19971106 | 19990207 | 19991111 | 20010625 | 20011129 | 20021214 | 20031205 | 20050109 | 20051129 | 20061212 | 20071204 |
| 6 | 19971119 | 19990324 | 19991115 | 20010626 | 20011202 | 20021216 | 20031206 | 20050110 | 20051201 | 20070209 | 20080105 |
| 7 | 19971125 | 19990325 | 20000116 | 20010627 | 20011229 | 20021227 | 20031207 | 20050322 | 20051202 | 20070210 | 20080110 |
| 8 | 19971205 | 19990511 | 20000117 | 20010730 | 20020102 | 20030112 | 20031224 | 20050504 | 20051222 | 20070605 | 20080603 |
| 9 | 19971214 | 19990802 | 20000118 | 20010925 | 20020106 | 20030113 | 20040216 | 20050508 | 20051228 | 20070610 | 20080622 |
| 10 | 19980114 | 19990830 | 20000124 | 20010926 | 20020414 | 20030212 | 20040217 | 20050515 | 20051230 | 20070628 | 20080703 |
| 11 | 19980115 | 20000125 | 20020529 | 20030310 | 20040527 | 20050516 | 20051231 | 20070718 | 20080730 | ||
| 12 | 19980126 | 20000305 | 20020618 | 20030315 | 20040528 | 20050519 | 20060227 | ||||
| 13 | 19980202 | 20000417 | 20030323 | 20040911 | 20050522 | 20060306 | |||||
| 14 | 19980203 | 20000507 | 20030326 | 20040917 | 20050608 | 20060325 | |||||
| 15 | 19980205 | 20000508 | 20030908 | 20050609 | 20060328 | ||||||
| 16 | 19980322 | 20000523 | 20050617 | 20060403 | |||||||
| 17 | 19980323 | 20000612 | 20050709 | 20060404 | |||||||
| 18 | 19980525 | 20050710 | 20060412 | ||||||||
| 19 | 19980625 | 20060508 | |||||||||
| 20 | 20060519 | ||||||||||
| 21 | 20060521 | ||||||||||
| 22 | 20060531 | ||||||||||
| 23 | 20060601 | ||||||||||
| 24 | 20060602 | ||||||||||
| 25 | 20060604 |
| # | WY1998 | WY1999 | WY2000 | WY2001 | WY2002 | WY2003 | WY2004 | WY2005 | WY2006 | WY2007 | WY2008 | |||||||
|---|---|---|---|---|---|---|---|---|---|---|---|---|---|---|---|---|---|---|
| 1 | 19971001 | 19981005 | 19991008 | 20001001 | 20011010 | 20021003 | 20031006 | 20041006 | 20051010 | 20061008 | 20071007 | |||||||
| 2 | 19971015 | 19981006 | 19991013 | 20001008 | 20011104 | 20021027 | 20031016 | 20041008 | 20051013 | 20061015 | 20071009 | |||||||
| 3 | 19971016 | 19981012 | 19991017 | 20001017 | 20011109 | 20021106 | 20031017 | 20041011 | 20051014 | 20061019 | 20071019 | |||||||
| 4 | 19971026 | 19981017 | 19991030 | 20001022 | 20011114 | 20021112 | 20031018 | 20041012 | 20051021 | 20061026 | 20071022 | |||||||
| 5 | 19971029 | 19981113 | 19991103 | 20001023 | 20011115 | 20021119 | 20031019 | 20041015 | 20051022 | 20061106 | 20071028 | |||||||
| 6 | 19971030 | 19981114 | 19991106 | 20001123 | 20011119 | 20021212 | 20031020 | 20041016 | 20051025 | 20061107 | 20071107 | |||||||
| 7 | 19971031 | 19981121 | 19991111 | 20010430 | 20020106 | 20030102 | 20031021 | 20041022 | 20051031 | 20061225 | 20071116 | |||||||
| 8 | 19971102 | 19981125 | 19991112 | 20010606 | 20020107 | 20030126 | 20031022 | 20041102 | 20051101 | 20061226 | 20071117 | |||||||
| 9 | 19971103 | 19981228 | 19991113 | 20010620 | 20020221 | 20030131 | 20031027 | 20041105 | 20051109 | 20070102 | 20071118 | |||||||
| 10 | 19971105 | 19981229 | 19991114 | 20010703 | 20020413 | 20030313 | 20031129 | 20041106 | 20051110 | 20070122 | 20071203 | |||||||
| 11 | 19971216 | 19990110 | 19991125 | 20010707 | 20020604 | 20030523 | 20040122 | 20041107 | 20051113 | 20070311 | 20071223 | |||||||
| 12 | 19971228 | 19990114 | 19991215 | 20010709 | 20020625 | 20030524 | 20040526 | 20041108 | 20051224 | 20070312 | 20080102 | |||||||
| 13 | 19980123 | 19990224 | 19991216 | 20010802 | 20020626 | 20030527 | 20040706 | 20041115 | 20051230 | 20070609 | 20080513 | |||||||
| 14 | 19980322 | 19990227 | 20000521 | 20010803 | 20020627 | 20030626 | 20040712 | 20041124 | 20060117 | 20070613 | 20080518 | |||||||
| 15 | 19980609 | 19990511 | 20000522 | 20010805 | 20020706 | 20030709 | 20040717 | 20041125 | 20060531 | 20070614 | 20080627 | |||||||
| 16 | 19980614 | 19990531 | 20000523 | 20010821 | 20020710 | 20030711 | 20040718 | 20041208 | 20060616 | 20070702 | 20080705 | |||||||
| 17 | 19980615 | 19990604 | 20000527 | 20010822 | 20020715 | 20030712 | 20040729 | 20041209 | 20060708 | 20070703 | 20080708 | |||||||
| 18 | 19980624 | 19990623 | 20000607 | 20010825 | 20020716 | 20030714 | 20040803 | 20041210 | 20060709 | 20070714 | 20080720 | |||||||
| 19 | 19980706 | 19990628 | 20000612 | 20010828 | 20020717 | 20030720 | 20040804 | 20041211 | 20060714 | 20070715 | 20080721 | |||||||
| 20 | 19980712 | 19990629 | 20000614 | 20010830 | 20020718 | 20030818 | 20040817 | 20041217 | 20060720 | 20070717 | 20080726 | |||||||
| 21 | 19980713 | 19990720 | 20000617 | 20010901 | 20020723 | 20030821 | 20040820 | 20050117 | 20060726 | 20070720 | 20080729 | |||||||
| 22 | 19980714 | 19990726 | 20000630 | 20010903 | 20020725 | 20030825 | 20040821 | 20050118 | 20060805 | 20070721 | 20080801 | |||||||
| 23 | 19980715 | 19990728 | 20000718 | 20010910 | 20020728 | 20030831 | 20040828 | 20050119 | 20060808 | 20070722 | 20080812 | |||||||
| 24 | 19980716 | 19990729 | 20000719 | 20010912 | 20020729 | 20030903 | 20040829 | 20050122 | 20060828 | 20070723 | 20080823 | |||||||
| 25 | 19980717 | 19990802 | 20000720 | 20010921 | 20020730 | 20030904 | 20040830 | 20050123 | 20060908 | 20070728 | 20080824 | |||||||
| 26 | 19980723 | 19990817 | 20000727 | 20010922 | 20020808 | 20030905 | 20040831 | 20050327 | 20060911 | 20070812 | 20080828 | |||||||
| 27 | 19980724 | 19990818 | 20000728 | 20010923 | 20020809 | 20030906 | 20040910 | 20050416 | 20060917 | 20070813 | 20080829 | |||||||
| 28 | 19980809 | 19990819 | 20000729 | 20020822 | 20030911 | 20040911 | 20050514 | 20060918 | 20070825 | 20080905 | ||||||||
| 29 | 19980812 | 19990821 | 20000730 | 20020823 | 20030914 | 20040915 | 20050515 | 20070828 | ||||||||||
| 30 | 19980813 | 19990822 | 20000731 | 20020828 | 20030918 | 20040922 | 20050629 | 20070829 | ||||||||||
| 31 | 19980827 | 19990823 | 20000817 | 20020829 | 20030922 | 20040925 | 20050704 | 20070903 | ||||||||||
| 32 | 19980830 | 19990824 | 20000818 | 20020901 | 20030923 | 20050705 | 20070930 | |||||||||||
| 33 | 19980901 | 19990825 | 20000823 | 20020902 | 20030925 | 20050708 | ||||||||||||
| 34 | 19980902 | 19990826 | 20000824 | 20020910 | 20050716 | |||||||||||||
| 35 | 19980903 | 19990827 | 20000825 | 20020911 | 20050727 | |||||||||||||
| 36 | 19980907 | 19990828 | 20000829 | 20020912 | 20050728 | |||||||||||||
| 37 | 19980908 | 19990829 | 20000907 | 20020916 | 20050730 | |||||||||||||
| 38 | 19980911 | 19990904 | 20000910 | 20050731 | ||||||||||||||
| 39 | 19980913 | 19990905 | 20000917 | 20050801 | ||||||||||||||
| 40 | 19980924 | 19990923 | 20000918 | 20050805 | ||||||||||||||
| 41 | 19990929 | 20000920 | 20050817 | |||||||||||||||
| 42 | 20000929 | 20050820 | ||||||||||||||||
| 43 | 20000930 | 20050821 | ||||||||||||||||
| 44 | 20050822 | |||||||||||||||||
| 45 | 20050826 | |||||||||||||||||
| 46 | 20050827 | |||||||||||||||||
| 47 | 20050908 | |||||||||||||||||
| 48 | 20050929 | |||||||||||||||||
| 49 | 20050930 | |||||||||||||||||
| WY1948 | WY1949 | WY1950 | WY1951 | WY1952 | WY1953 | ||||||||
| Date | Landfall Latitude | Date | Landfall Latitude | Date | Landfall Latitude | Date | Landfall Latitude | Date | Landfall Latitude | Date | Landfall Latitude | ||
| 19480120 | 52.5° N | 19490116 | 52.5° N | 19491029 | 52.5° N | 19501101 | 40.0° N | 19511228 | 35.0° N | 19521212 | 50.0° N | ||
| 19491123 | 52.5° N | 19501117 | 35.0° N | 19520123 | 50.0° N | 19530101 | 40.0° N | ||||||
| 19501120 | 37.5° N | 19520323 | 52.5° N | 19530108 | 42.5° N | ||||||||
| 19501202 | 42.5° N | 19530109 | 40.0° N | ||||||||||
| 19501203 | 37.5° N | 19530116 | 40.0° N | ||||||||||
| 19501205 | 52.5° N | 19530122 | 42.5° N | ||||||||||
| 19501206 | 42.5° N | 19530130 | 45.0° N | ||||||||||
| 19501210 | 50.0° N | ||||||||||||
| 19510205 | 37.5° N | ||||||||||||
| 19510208 | 50.0° N | ||||||||||||
| WY1954 | WY1955 | WY1956 | WY1957 | WY1958 | WY1959 | ||||||||
| Date | Landfall Latitude | Date | Landfall Latitude | Date | Landfall Latitude | Date | Landfall Latitude | Date | Landfall Latitude | Date | Landfall Latitude | ||
| 19531219 | 40.0° N | 19541104 | 52.5° N | 19551107 | 52.5° N | 19561102 | 52.5° N | 19580121 | 52.5° N | 19581201 | 45.0° N | ||
| 19540307 | 35.0° N | 19541113 | 50.0° N | 19551126 | 42.5° N | 19561209 | 47.5° N | 19580122 | 52.5° N | 19590115 | 45.0° N | ||
| 19540308 | 37.5° N | 19541120 | 52.5° N | 19551219 | 37.5° N | 19561215 | 50.0° N | 19580217 | 50.0° N | 19590116 | 45.0° N | ||
| 19551220 | 45.0° N | 19561225 | 52.5° N | 19580218 | 35.0° N | 19590214 | 40.0° N | ||||||
| 19551221 | 45.0° N | 19561226 | 52.5° N | 19580221 | 50.0° N | 19590215 | 42.5° N | ||||||
| 19560113 | 42.5° N | 19570112 | 32.5° N | 19580320 | 40.0° N | 19590216 | 30.0° N | ||||||
| 19560114 | 37.5° N | 19570222 | 42.5° N | 19580321 | 30.0° N | ||||||||
| 19560118 | 52.5° N | 19570224 | 40.0° N | ||||||||||
| 19560119 | 40.0° N | 19570225 | 42.5° N | ||||||||||
| 19560120 | 52.5° N | 19570226 | 40.0° N | ||||||||||
| 19570610 | 52.5° N | ||||||||||||
| WY1960 | WY1961 | WY1962 | WY1963 | WY1964 | WY1965 | ||||||||
| Date | Landfall Latitude | Date | Landfall Latitude | Date | Landfall Latitude | Date | Landfall Latitude | Date | Landfall Latitude | Date | Landfall Latitude | ||
| 19591122 | 45.0° N | 19601212 | 47.5° N | 19611013 | 52.5° N | 19621027 | 52.5° N | 19631124 | 52.5° N | 19641221 | 42.5° N | ||
| 19600128 | 42.5° N | 19610110 | 47.5° N | 19611125 | 32.5° N | 19630130 | 37.5° N | 19631125 | 45.0° N | 19641222 | 35.0° N | ||
| 19600129 | 45.0° N | 19610115 | 50.0° N | 19620104 | 52.5° N | 19630131 | 37.5° N | 19631222 | 52.5° N | 19650112 | 52.5° N | ||
| 19600205 | 50.0° N | 19610201 | 47.5° N | 19620107 | 52.5° N | 19630201 | 35.0° N | 19631224 | 47.5° N | ||||
| 19600206 | 45.0° N | 19610204 | 50.0° N | 19620209 | 35.0° N | 19630202 | 42.5° N | ||||||
| 19610205 | 47.5° N | 19630203 | 47.5° N | ||||||||||
| 19630204 | 50.0° N | ||||||||||||
| 19630206 | 50.0° N | ||||||||||||
| 19630327 | 35.0° N | ||||||||||||
| WY1966 | WY1967 | WY1968 | WY1969 | WY1970 | WY1971 | ||||||||
| Date | Landfall Latitude | Date | Landfall Latitude | Date | Landfall Latitude | Date | Landfall Latitude | Date | Landfall Latitude | Date | Landfall Latitude | ||
| 19651020 | 52.5° N | 19661204 | 32.5° N | 19680113 | 50.0° N | 19681107 | 45.0° N | 19691220 | 42.5° N | 19701122 | 42.5° N | ||
| 19651112 | 42.5° N | 19670126 | 40.0° N | 19680114 | 40.0° N | 19681108 | 45.0° N | 19700108 | 37.5° N | 19701123 | 42.5° N | ||
| 19651115 | 32.5° N | 19670202 | 47.5° N | 19680117 | 50.0° N | 19690103 | 52.5° N | 19700113 | 45.0° N | 19701124 | 42.5° N | ||
| 19651122 | 30.0° N | 19670208 | 52.5° N | 19680118 | 47.5° N | 19690104 | 45.0° N | 19700114 | 35.0° N | 19710115 | 42.5° N | ||
| 19651123 | 32.5° N | 19630316 | 35.0)N | 19680119 | 47.5° N | 19690111 | 35.0° N | 19700115 | 40.0° N | 19710116 | 47.5° N | ||
| 19660329 | 52.5° N | 19680120 | 50.0° N | 19690112 | 35.0° N | 19700117 | 37.5° N | 19710117 | 45.0° N | ||||
| 19680121 | 50.0° N | 19690113 | 32.5° N | 19700118 | 47.5° N | 19710118 | 42.5° N | ||||||
| 19680122 | 52.5° N | 19690118 | 35.0° N | 19700121 | 45.0° N | 19710129 | 52.5° N | ||||||
| 19680217 | 42.5° N | 19690124 | 35.0° N | 19700122 | 45.0° N | 19710130 | 50.0° N | ||||||
| 19680218 | 40.0° N | 19690125 | 32.5° N | 19700215 | 42.5° N | 19710322 | 40.0° N | ||||||
| 19680220 | 40.0° N | 19690601 | 52.5° N | ||||||||||
| 19680221 | 42.5° N | ||||||||||||
| WY1972 | WY1973 | WY1974 | WY1975 | WY1976 | WY1977 | ||||||||
| Date | Landfall Latitude | Date | Landfall Latitude | Date | Landfall Latitude | Date | Landfall Latitude | Date | Landfall Latitude | Date | Landfall Latitude | ||
| 19720309 | 50.0° N | 19721031 | 50.0° N | 19731108 | 40.0° N | 19750117 | 47.5° N | 19751223 | 45.0° N | 19770116 | 52.5° N | ||
| 19720314 | 52.5° N | 19721216 | 42.5° N | 19731111 | 37.5° N | 19751225 | 50.0° N | 19770117 | 52.5° N | ||||
| 19721219 | 40.0° N | 19731215 | 45.0° N | 19751227 | 52.5° N | 19770210 | 47.5° N | ||||||
| 19721220 | 42.5° N | 19740114 | 45.0° N | 19760126 | 52.5° N | ||||||||
| 19730215 | 50.0° N | 19740115 | 42.5° N | 19760127 | 50.0° N | ||||||||
| 19740116 | 37.5° N | ||||||||||||
| 19740117 | 35.0° N | ||||||||||||
| 19740314 | 40.0° N | ||||||||||||
| WY1978 | WY1979 | WY1980 | WY1981 | WY1982 | WY1983 | ||||||||
| Date | Landfall Latitude | Date | Landfall Latitude | Date | Landfall Latitude | Date | Landfall Latitude | Date | Landfall Latitude | Date | Landfall Latitude | ||
| 19771123 | 42.5° N | 19781127 | 52.5° N | 19791216 | 45.0° N | 19801103 | 50.0° N | 19811115 | 40.0° N | 19821028 | 50.0° N | ||
| 19771124 | 42.5° N | 19790109 | 40.0° N | 19791217 | 45.0° N | 19801210 | 52.5° N | 19820107 | 50.0° N | 19830102 | 42.5° N | ||
| 19771125 | 47.5° N | 19790110 | 40.0° N | 19800111 | 32.5° N | 19801224 | 45.0° N | 19820108 | 52.5° N | 19830106 | 40.0° N | ||
| 19771127 | 45.0° N | 19790212 | 40.0° N | 19800201 | 45.0° N | 19801225 | 45.0° N | 19820124 | 42.5° N | 19830125 | 42.5° N | ||
| 19771226 | 32.5° N | 19790213 | 35.0° N | 19800214 | 30.0° N | 19810118 | 50.0° N | 19820212 | 47.5° N | 19830126 | 40.0° N | ||
| 19771227 | 32.5° N | 19790305 | 50.0° N | 19800215 | 35.0° N | 19810119 | 50.0° N | 19820213 | 45.0° N | 19830210 | 50.0° N | ||
| 19780107 | 50.0° N | 19790425 | 35.0° N | 19810121 | 40.0° N | 19820217 | 50.0° N | 19830211 | 52.5° N | ||||
| 19810212 | 45.0° N | 19820218 | 47.5° N | 19830217 | 45.0° N | ||||||||
| 19810213 | 40.0° N | 19820219 | 40.0° N | 19820228 | 35.0° N | ||||||||
| 19810214 | 42.5° N | 19820409 | 35.0° N | 19830301 | 35.0° N | ||||||||
| 19810215 | 47.5° N | 19820410 | 35.0° N | 19830308 | 35.0° N | ||||||||
| 19810217 | 42.5° N | 19820411 | 32.5° N | ||||||||||
| 19810218 | 42.5° N | ||||||||||||
| WY1984 | WY1985 | WY1986 | WY1987 | WY1988 | WY1989 | ||||||||
| Date | Landfall Latitude | Date | Landfall Latitude | Date | Landfall Latitude | Date | Landfall Latitude | Date | Landfall Latitude | Date | Landfall Latitude | ||
| 19831223 | 37.5° N | 19851201 | 37.5° N | 19870201 | 42.5° N | 19880103 | 37.5° N | 19881210 | 52.5° N | ||||
| 19831224 | 40.0° N | 19860117 | 45.0° N | 19870303 | 45.0° N | 19880114 | 45.0° N | 19890305 | 40.0° N | ||||
| 19831228 | 45.0° N | 19860118 | 47.5° N | 19870304 | 50.0° N | ||||||||
| 19831229 | 45.0° N | 19860129 | 40.0° N | 19870305 | 35.0° N | ||||||||
| 19831231 | 50.0° N | 19860213 | 37.5° N | ||||||||||
| 19840101 | 52.5° N | 19860214 | 40.0° N | ||||||||||
| 19840102 | 52.5° N | 19860216 | 35.0° N | ||||||||||
| 19840103 | 52.5° N | 19860217 | 37.5° N | ||||||||||
| 19840104 | 47.5° N | 19860218 | 35.0° N | ||||||||||
| 19840126 | 52.5° N | 19860222 | 45.0° N | ||||||||||
| 19840127 | 50.0° N | 19860223 | 45.0° N | ||||||||||
| 19840324 | 52.5° N | ||||||||||||
| WY1990 | WY1991 | WY1992 | WY1993 | WY1994 | WY1995 | ||||||||
| Date | Landfall Latitude | Date | Landfall Latitude | Date | Landfall Latitude | Date | Landfall Latitude | Date | Landfall Latitude | Date | Landfall Latitude | ||
| 19891204 | 47.5° N | 19901109 | 45.0° N | 19911018 | 52.5° N | 19930105 | 32.5° N | 19940111 | 52.5° N | 19950109 | 42.5° N | ||
| 19901111 | 50.0° N | 19920123 | 50.0° N | 19930107 | 30.0° N | 19950113 | 40.0° N | ||||||
| 19901112 | 47.5° N | 19920129 | 47.5° N | 19930226 | 52.5° N | 19950127 | 37.5° N | ||||||
| 19910201 | 52.5° N | 19920130 | 45.0° N | 19930316 | 40.0° N | 19950128 | 42.5° N | ||||||
| 19910203 | 45.0° N | 19950129 | 42.5° N | ||||||||||
| 19910212 | 45.0° N | 19950130 | 52.5° N | ||||||||||
| 19910218 | 50.0° N | 19950131 | 45.0° N | ||||||||||
| 19910227 | 30.0° N | 19950217 | 47.5° N | ||||||||||
| WY1990 | WY1991 | WY1992 | WY1993 | WY1994 | WY1995 | ||||||||
| Date | Landfall Latitude | Date | Landfall Latitude | Date | Landfall Latitude | Date | Landfall Latitude | Date | Landfall Latitude | Date | Landfall Latitude | ||
| 19910303 | 40.0° N | 19950218 | 50.0° N | ||||||||||
| 19910304 | 37.5° N | 19950219 | 47.5° N | ||||||||||
| 19950309 | 35.0° N | ||||||||||||
| 19950310 | 35.0° N | ||||||||||||
| 19950430 | 35.0° N | ||||||||||||
| WY1996 | WY1997 | WY1998 | WY1999 | WY2000 | WY2001 | ||||||||
| Date | Landfall Latitude | Date | Landfall Latitude | Date | Landfall Latitude | Date | Landfall Latitude | Date | Landfall Latitude | Date | Landfall Latitude | ||
| 19951209 | 47.5° N | 19961110 | 52.5° N | 19971213 | 52.5° N | 19981112 | 45.0° N | 19991111 | 42.5° N | 20001102 | 52.5° N | ||
| 19951229 | 40.0° N | 19961118 | 40.0° N | 19971228 | 50.0° N | 19981228 | 42.5° N | 19991112 | 45.0° N | ||||
| 19960106 | 47.5° N | 19961119 | 40.0° N | 19980117 | 40.0° N | 19991214 | 45.0° N | ||||||
| 19960130 | 35.0° N | 19961126 | 52.5° N | 19980122 | 40.0° N | 20000118 | 35.0° N | ||||||
| 19960202 | 35.0° N | 19961209 | 35.0° N | 19980202 | 35.0° N | 20000123 | 37.5° N | ||||||
| 19960203 | 40.0° N | 19961224 | 45.0° N | 19980205 | 37.5° N | 20000124 | 35.0° N | ||||||
| 19960205 | 47.5° N | 19961228 | 42.5° N | 19980211 | 40.0° N | 20000929 | 45.0° N | ||||||
| 19960206 | 45.0° N | 19961229 | 40.0° N | 19980322 | 40.0° N | ||||||||
| 19960405 | 52.5° N | 19961230 | 35.0° N | ||||||||||
| 19961231 | 40.0° N | ||||||||||||
| 19970101 | 40.0° N | ||||||||||||
| 19970117 | 45.0° N | ||||||||||||
| 19970128 | 47.5° N | ||||||||||||
| 19970129 | 52.5° N | ||||||||||||
| 19970130 | 50.0° N | ||||||||||||
| 19970319 | 42.5° N | ||||||||||||
| WY2002 | WY2003 | WY2004 | WY2005 | WY2006 | WY2007 | WY2008 | |||||||
| Date | Landfall Latitude | Date | Landfall Latitude | Date | Landfall Latitude | Date | Landfall Latitude | Date | Landfall Latitude | Date | Landfall Latitude | Date | Landfall Latitude |
| 20011114 | 47.5° N | 20030101 | 50.0° N | 20031017 | 47.5° N | 20041011 | 50.0° N | 20051219 | 42.5° N | 20061105 | 47.5° N | 20071202 | 47.5° N |
| 20011229 | 30.0° N | 20030102 | 45.0° N | 20031020 | 45.0° N | 20041106 | 47.5° N | 20051220 | 50.0° N | 20061106 | 50.0° N | 20071203 | 45.0° N |
| 20011231 | 40.0° N | 20030122 | 42.5° N | 20031204 | 40.0° N | 20041113 | 52.5° N | 20051223 | 47.5° N | 20061115 | 47.5° N | 20071204 | 40.0° N |
| 20020101 | 40.0° N | 20030124 | 47.5° N | 20040105 | 45.0° N | 20041114 | 47.5° N | 20060226 | 47.5° N | 20061225 | 42.5° N | ||
| 20020106 | 42.5° N | 20030125 | 50.0° N | 20040215 | 42.5° N | 20041209 | 40.0° N | 20060227 | 40.0° N | 20061231 | 50.0° N | ||
| 20020107 | 42.5° N | 20030126 | 45.0° N | 20040216 | 37.5° N | 20041210 | 47.5° N | 20070101 | 50.0° N | ||||
| 20020409 | 37.5° N | 20030130 | 42.5° N | 20050116 | 50.0° N | 20070122 | 52.5° N | ||||||
| 20020412 | 42.5° N | 20050117 | 50.0° N | 20070214 | 52.5° N | ||||||||
| 20050118 | 47.5° N | 20070215 | 45.0° N | ||||||||||
| 20050119 | 47.5° N | 20070310 | 45.0° N | ||||||||||
| 20050122 | 52.5° N | 20070311 | 47.5° N | ||||||||||
| 20050123 | 52.5° N | 20070505 | 52.5° N | ||||||||||
| 20050305 | 50.0° N | ||||||||||||
| 20050326 | 47.5° N | ||||||||||||
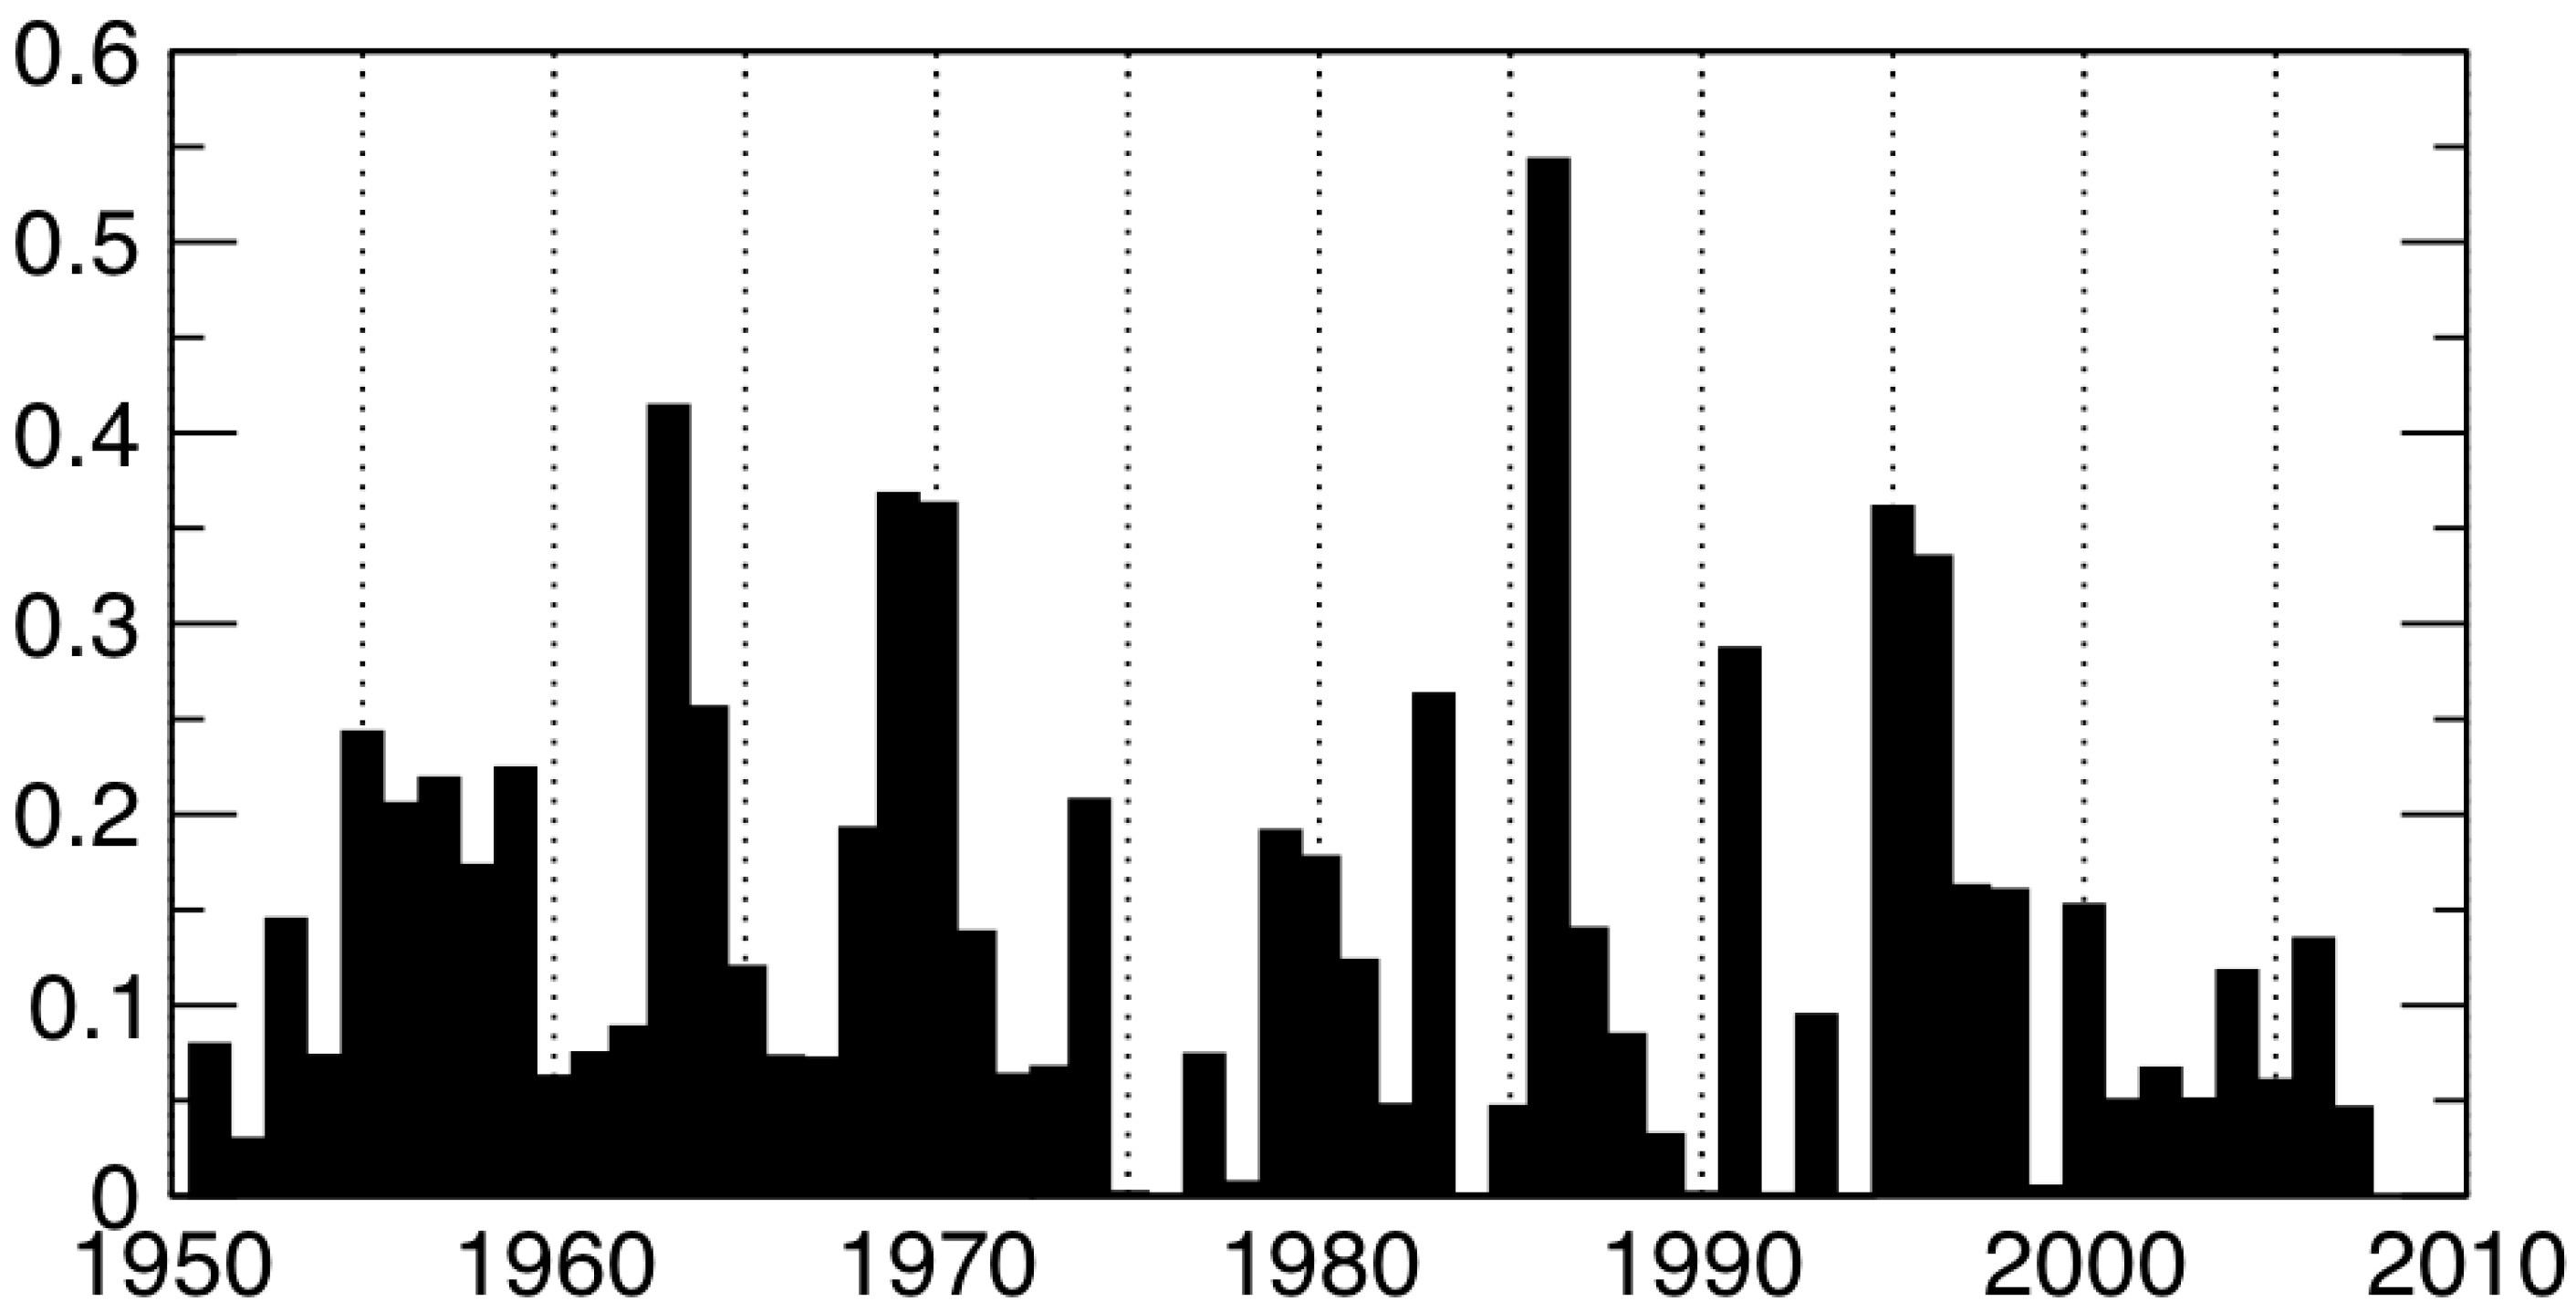
3. Precipitation Variability in California
4. AR Precipitation and Floods

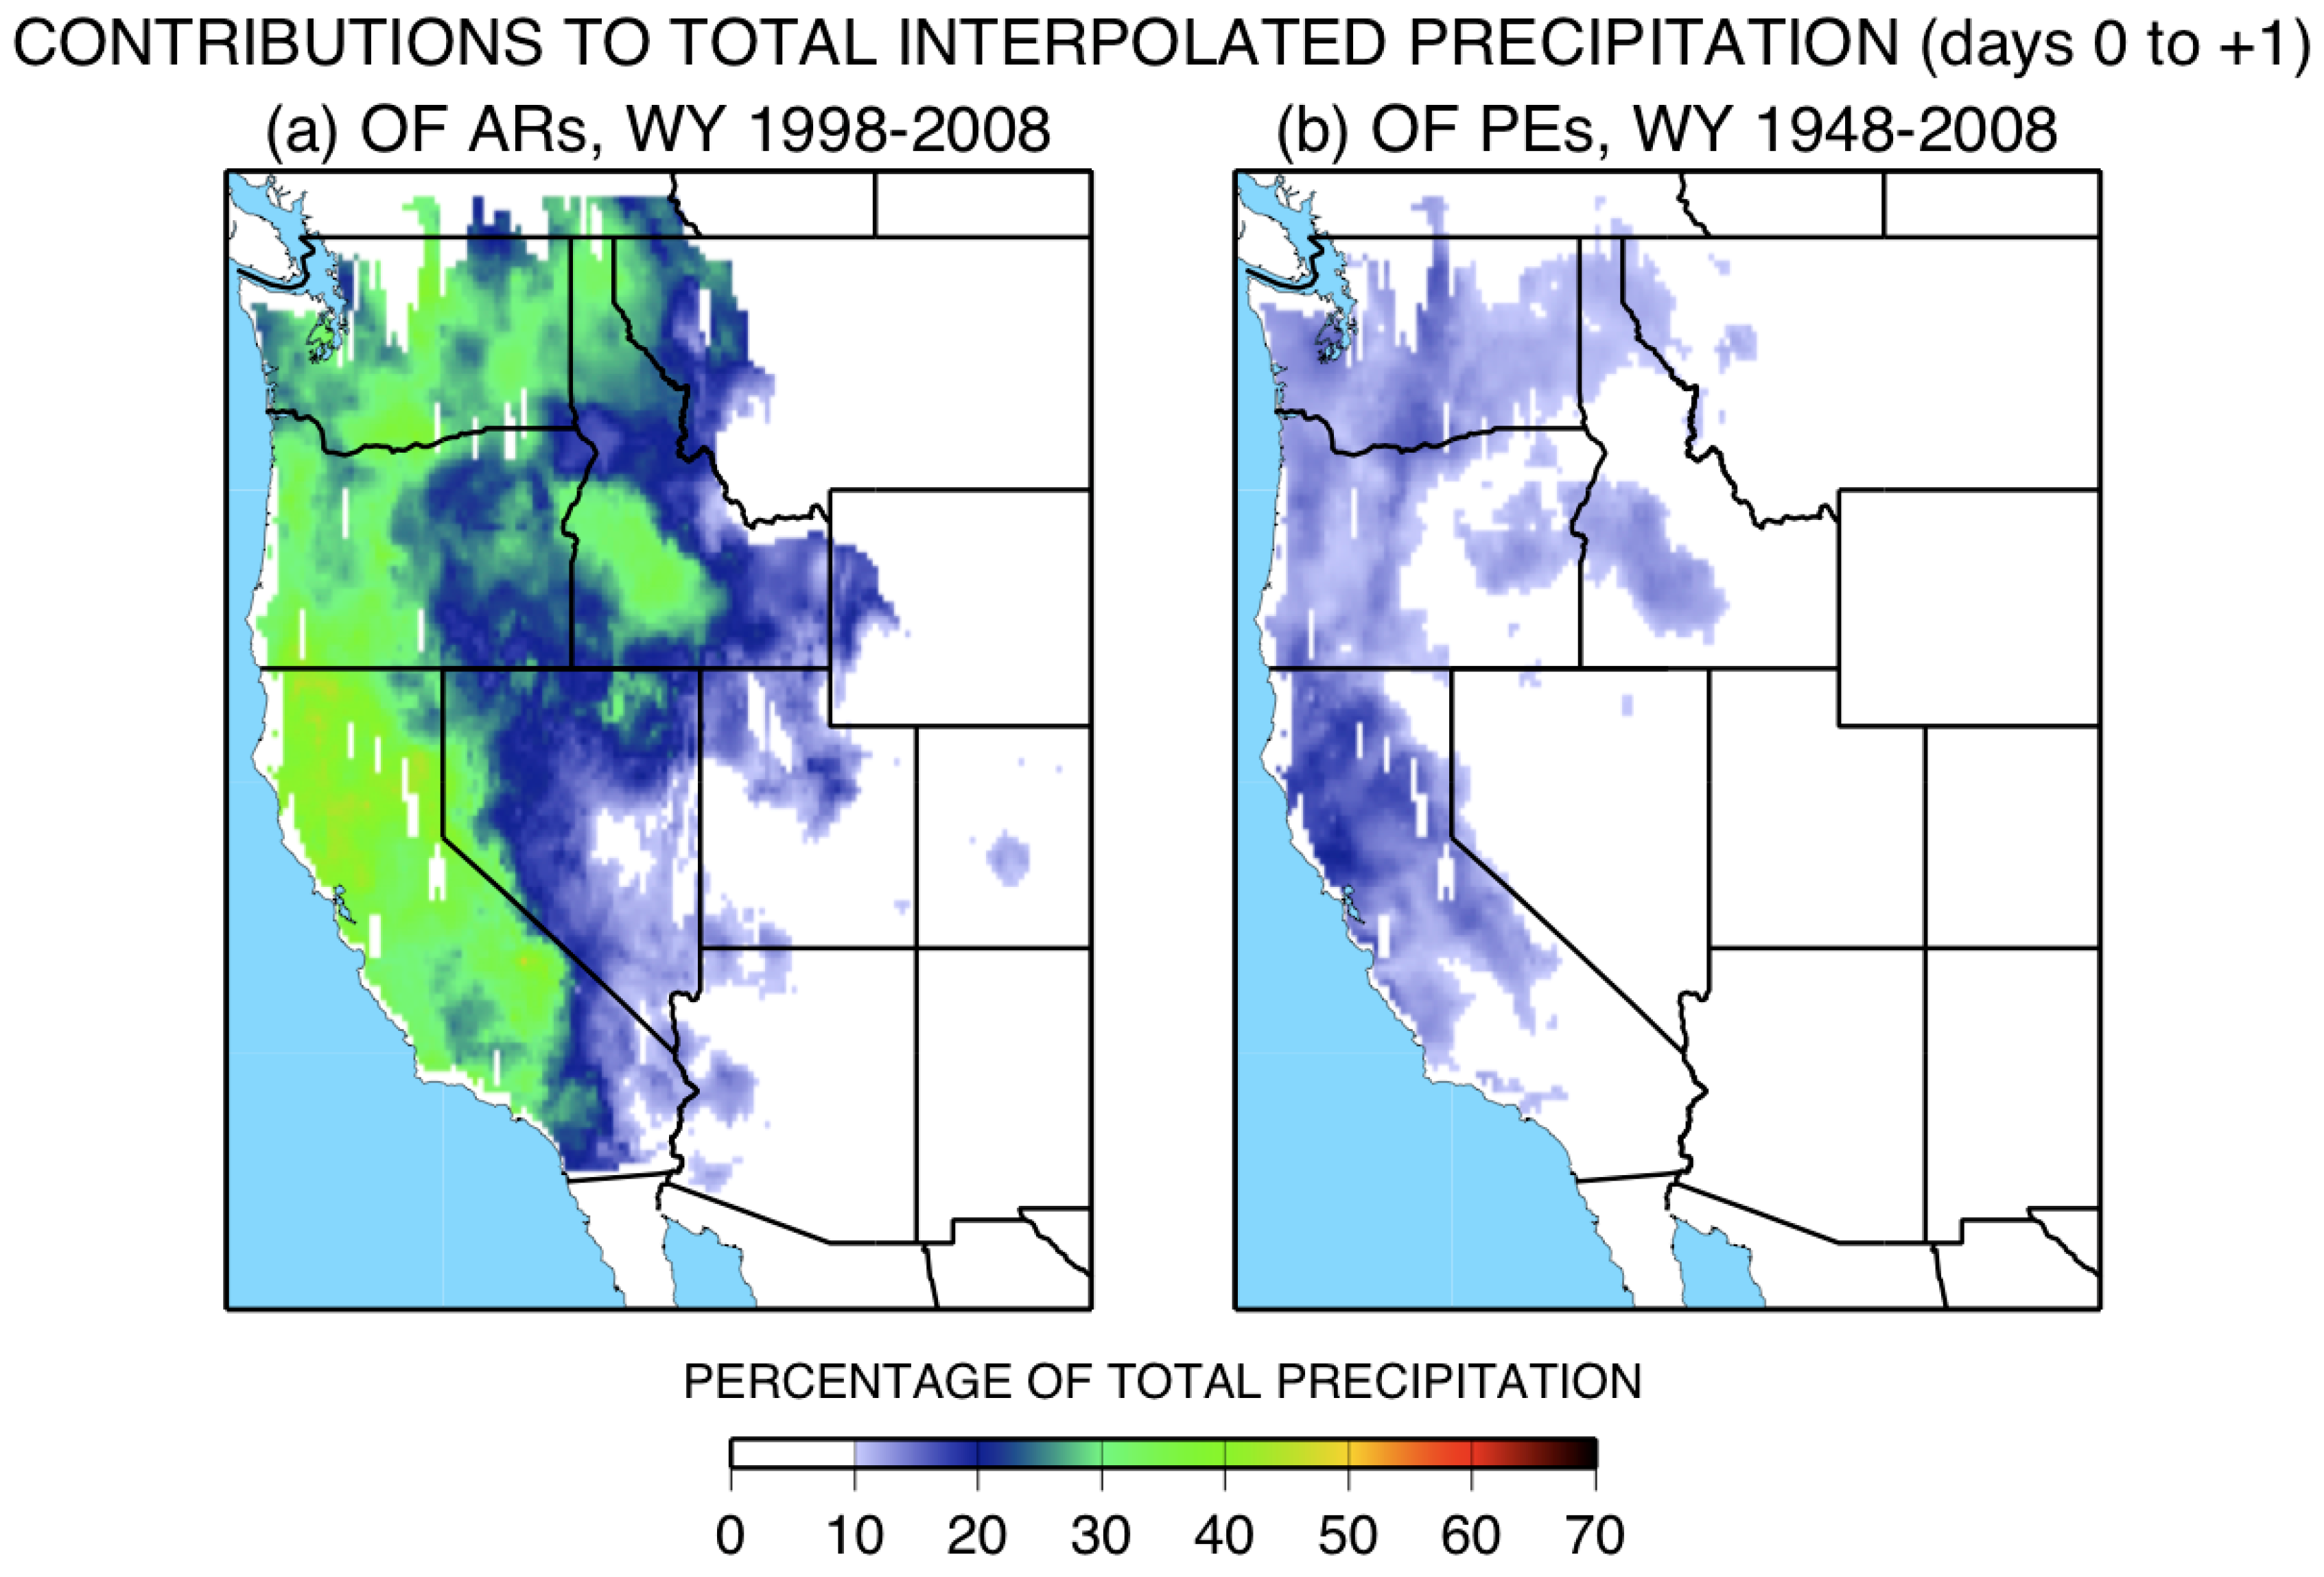
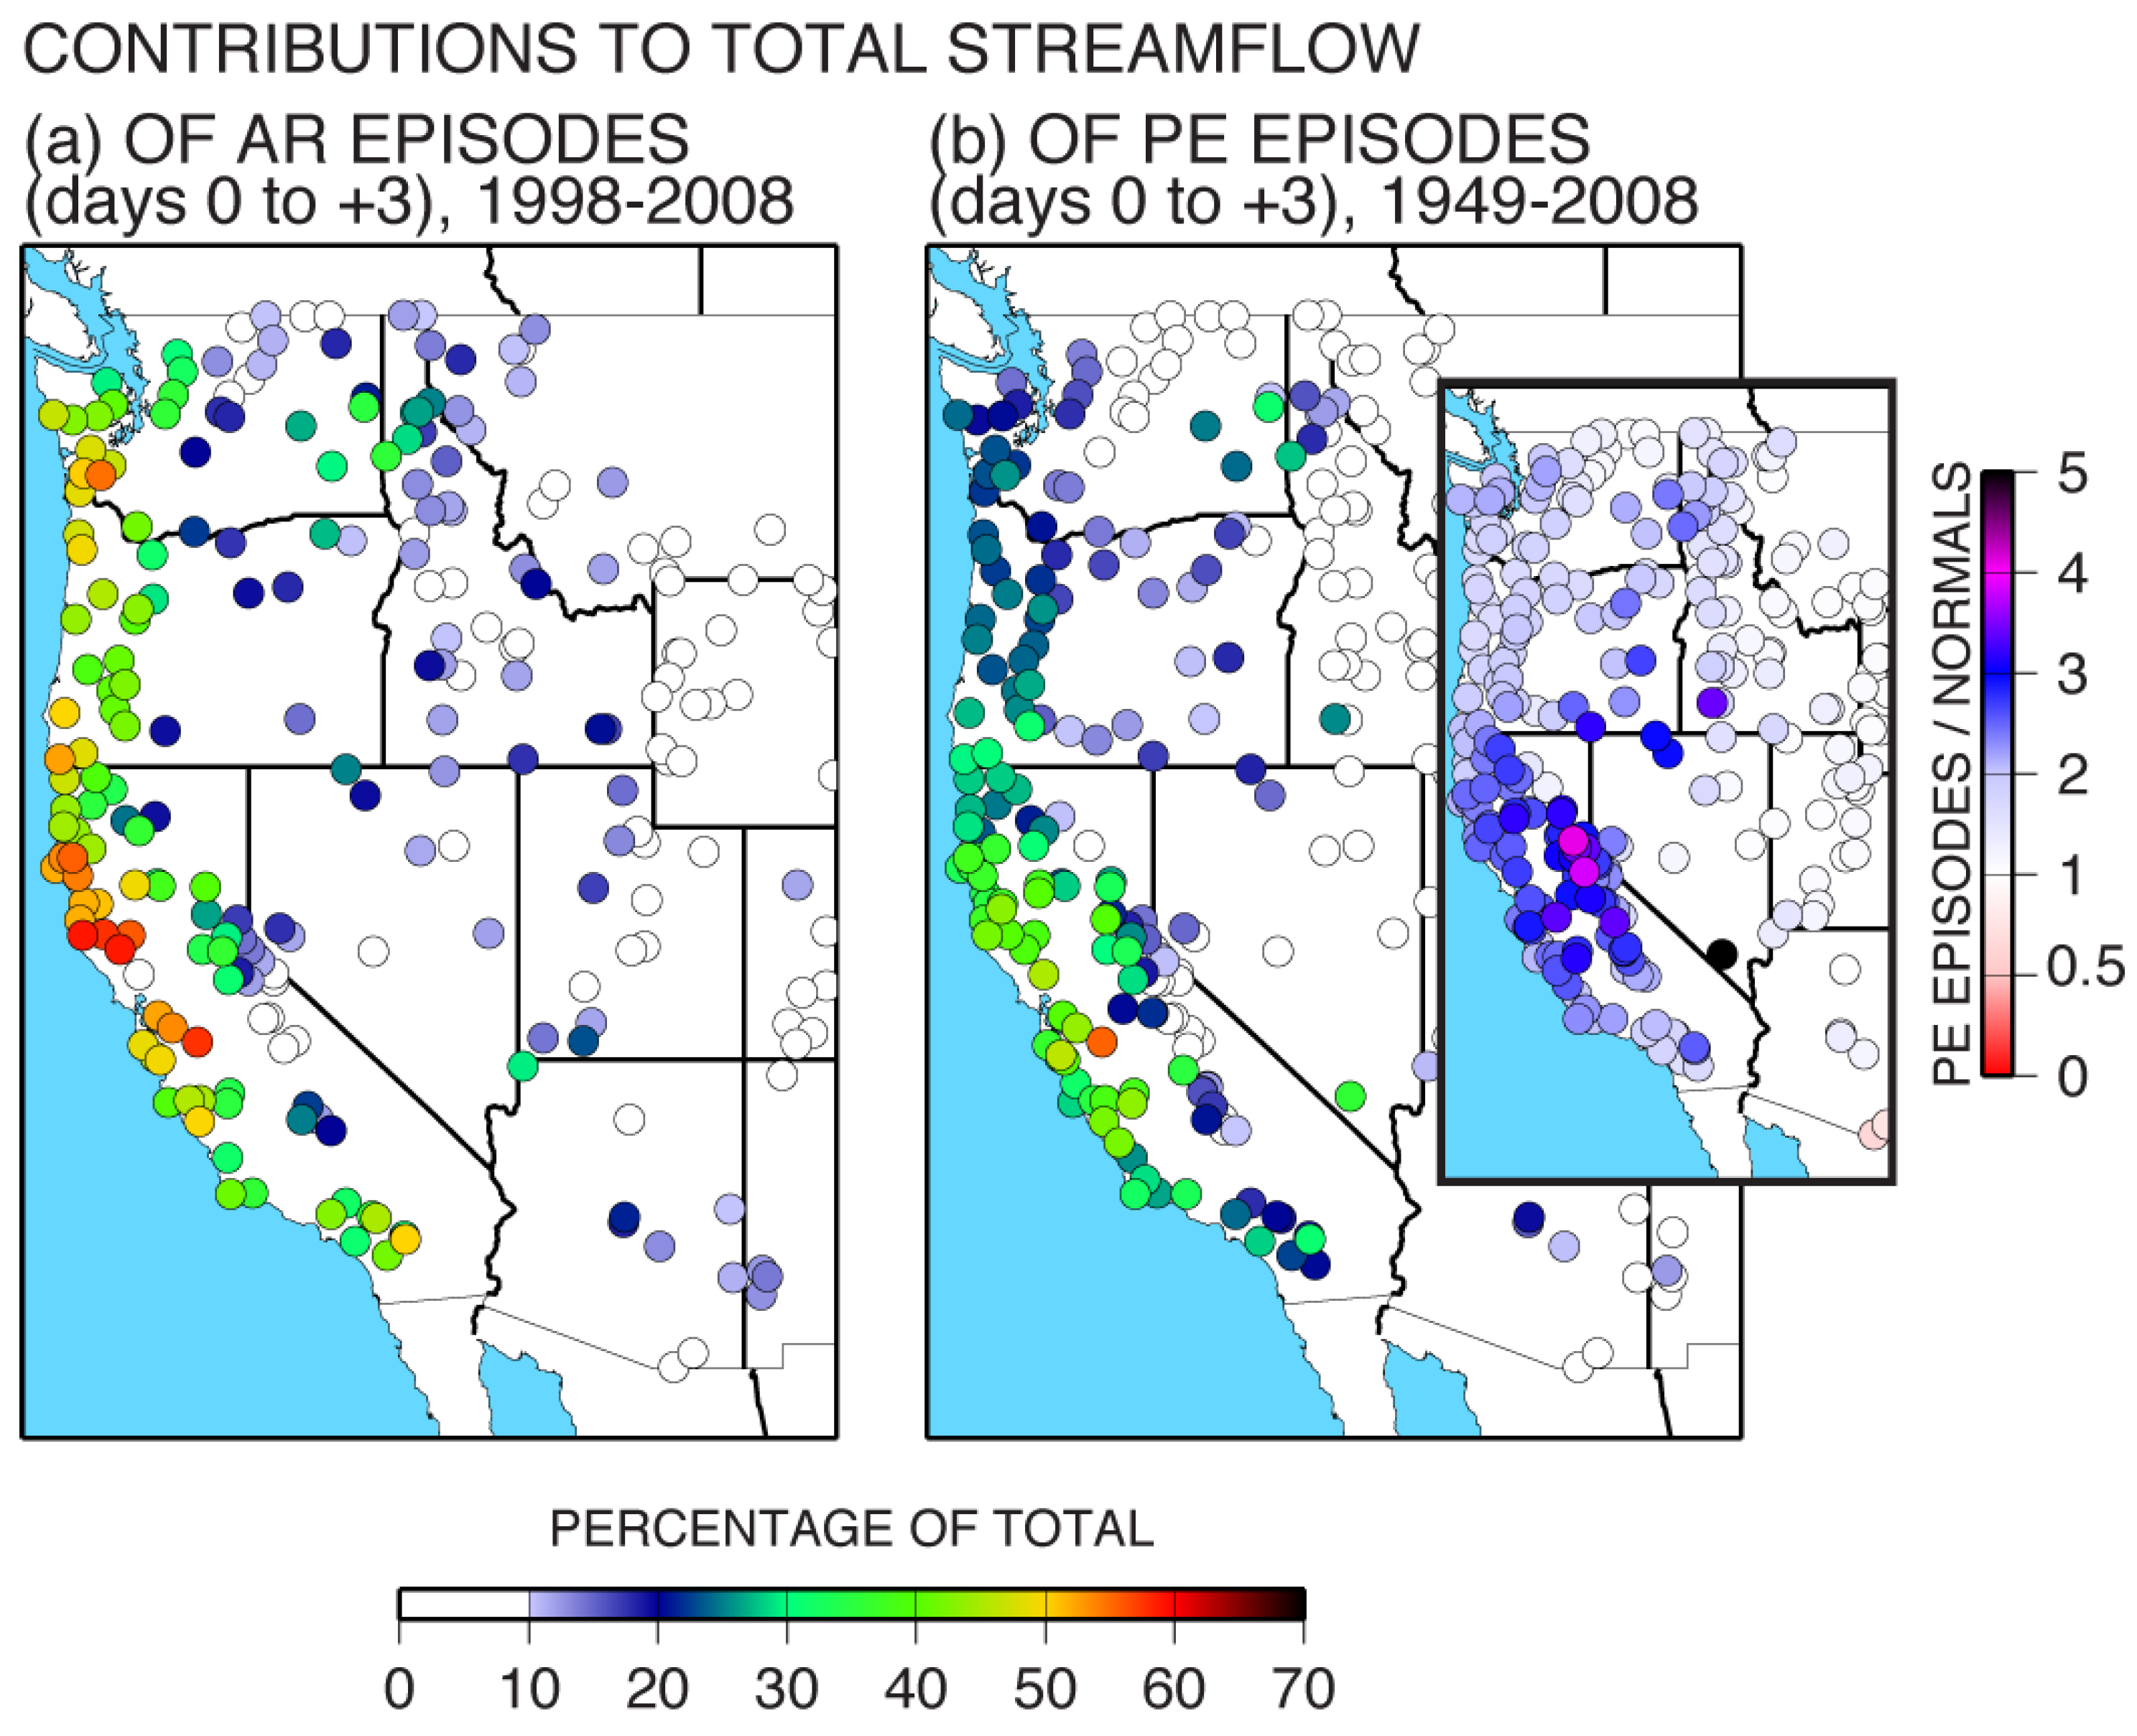
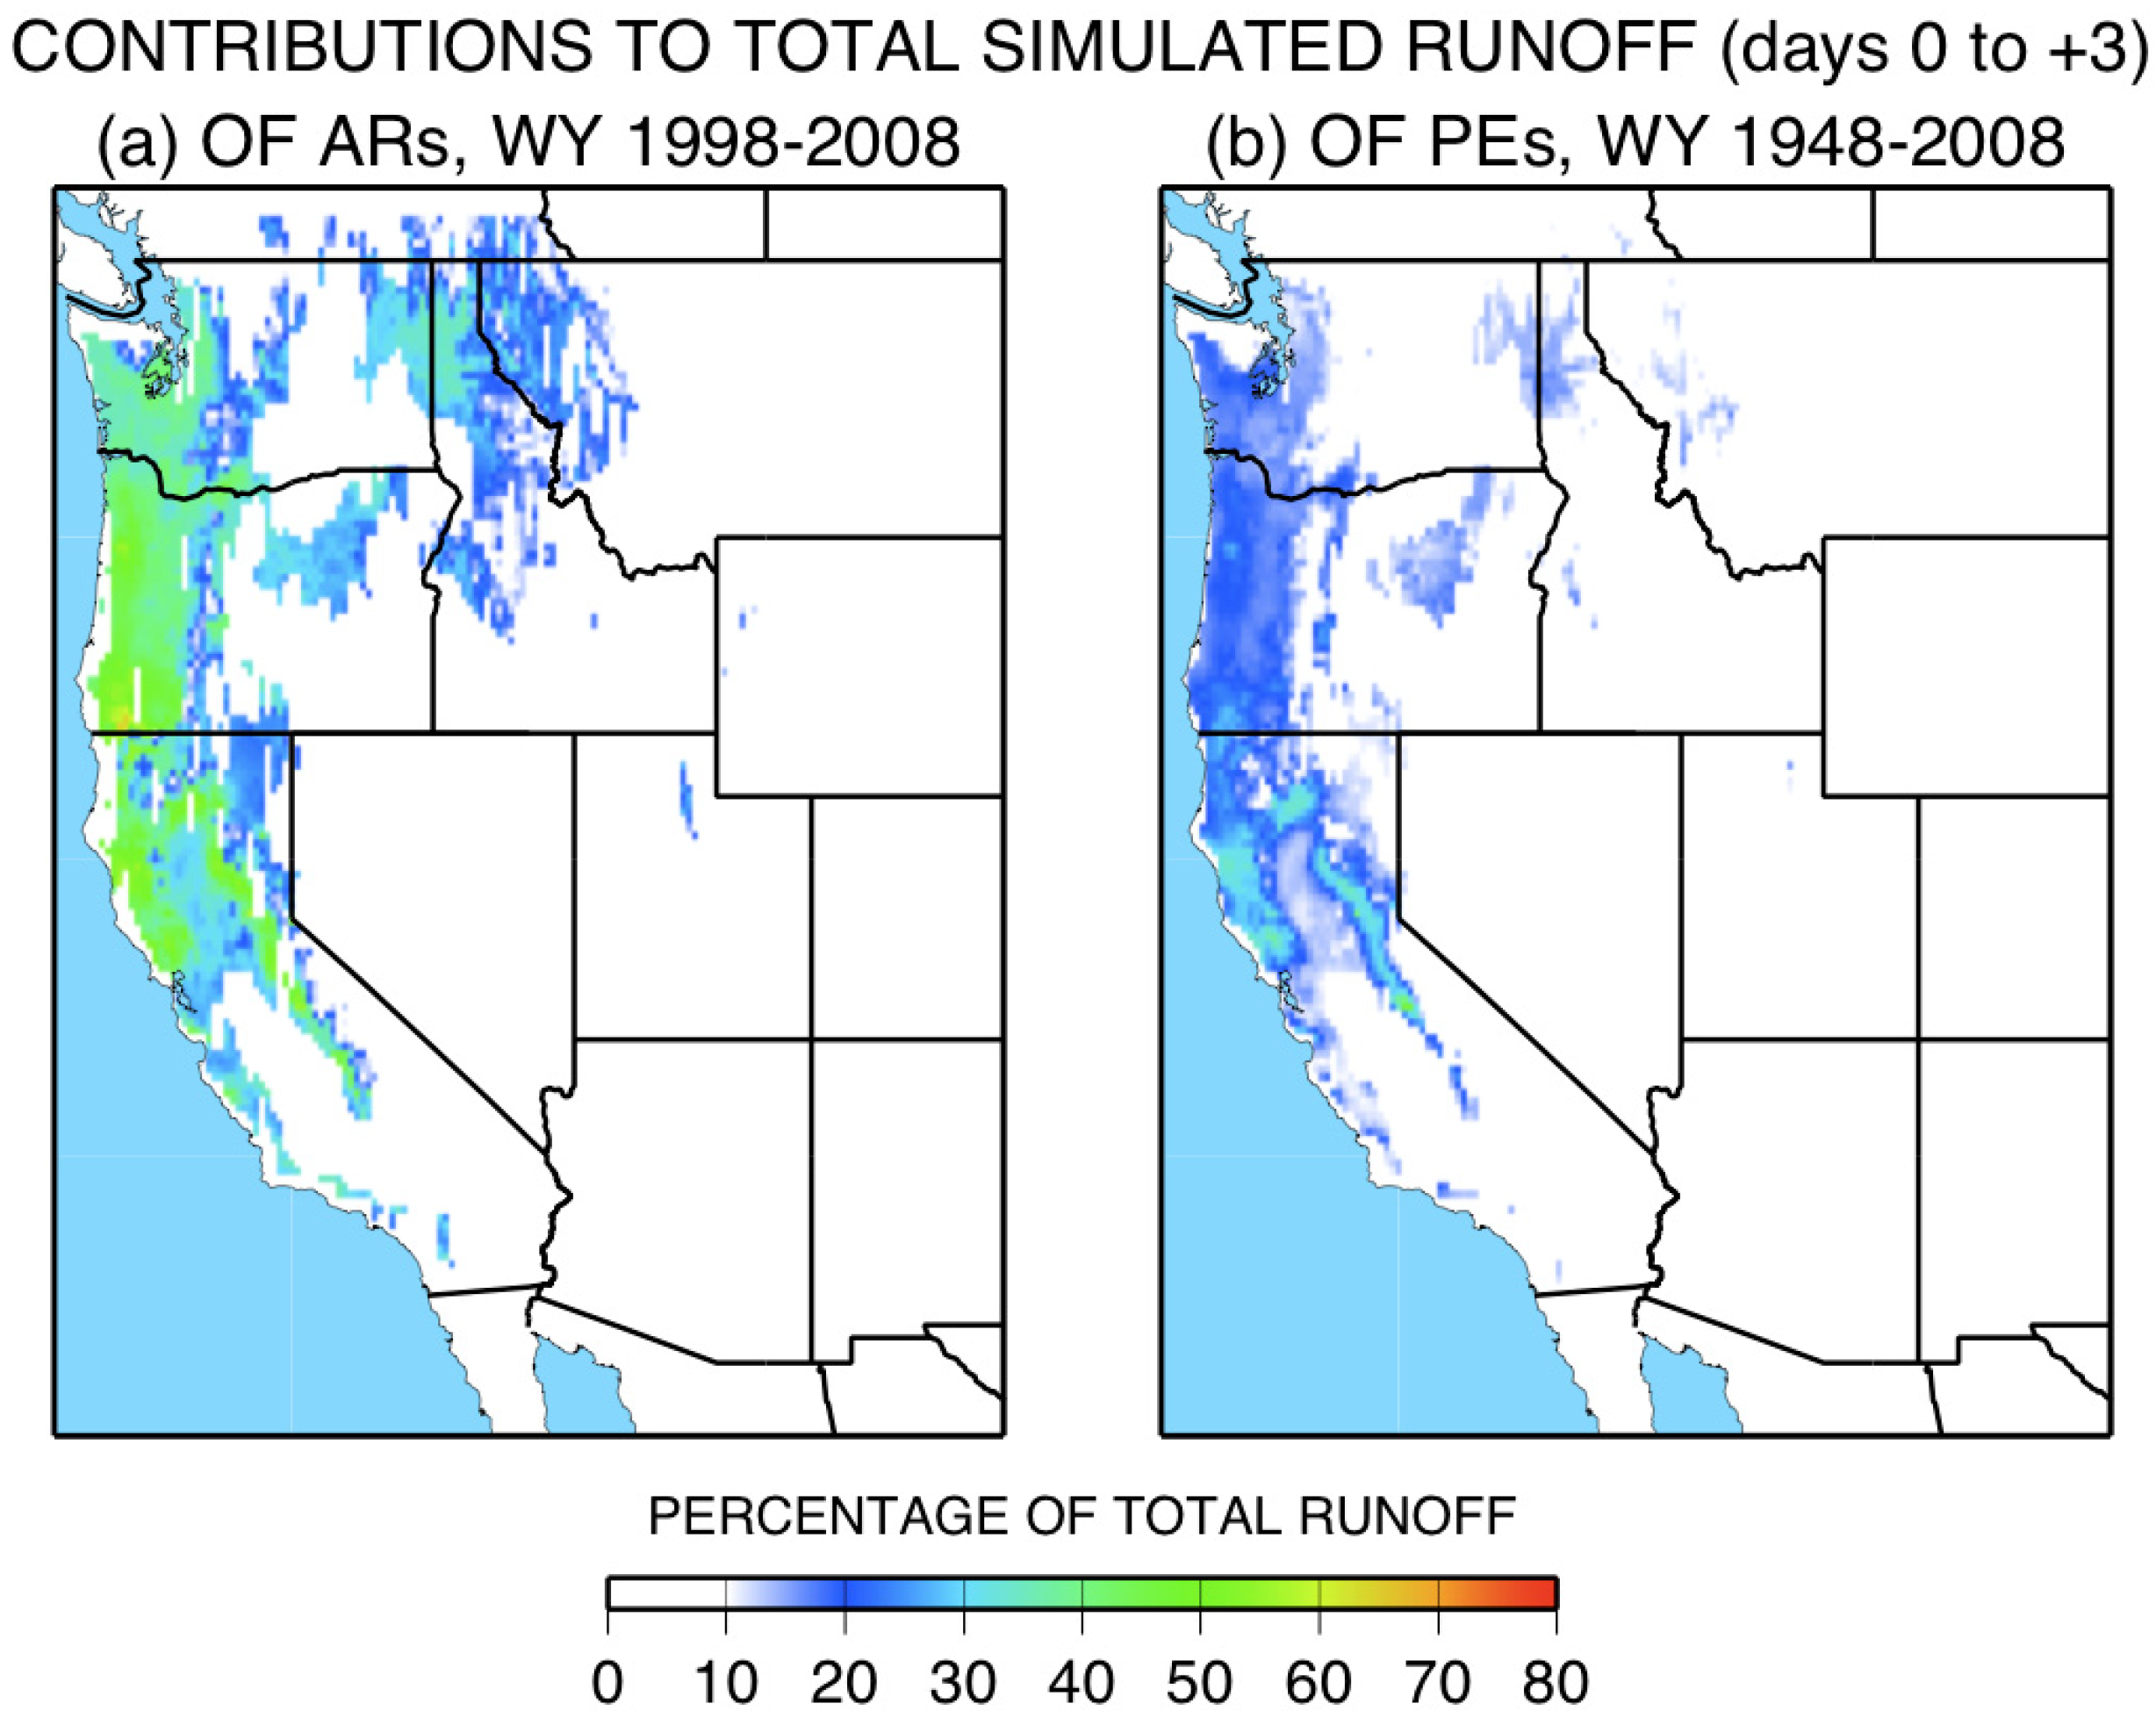
5. Contributions of ARs to Overall Precipitation and Streamflow
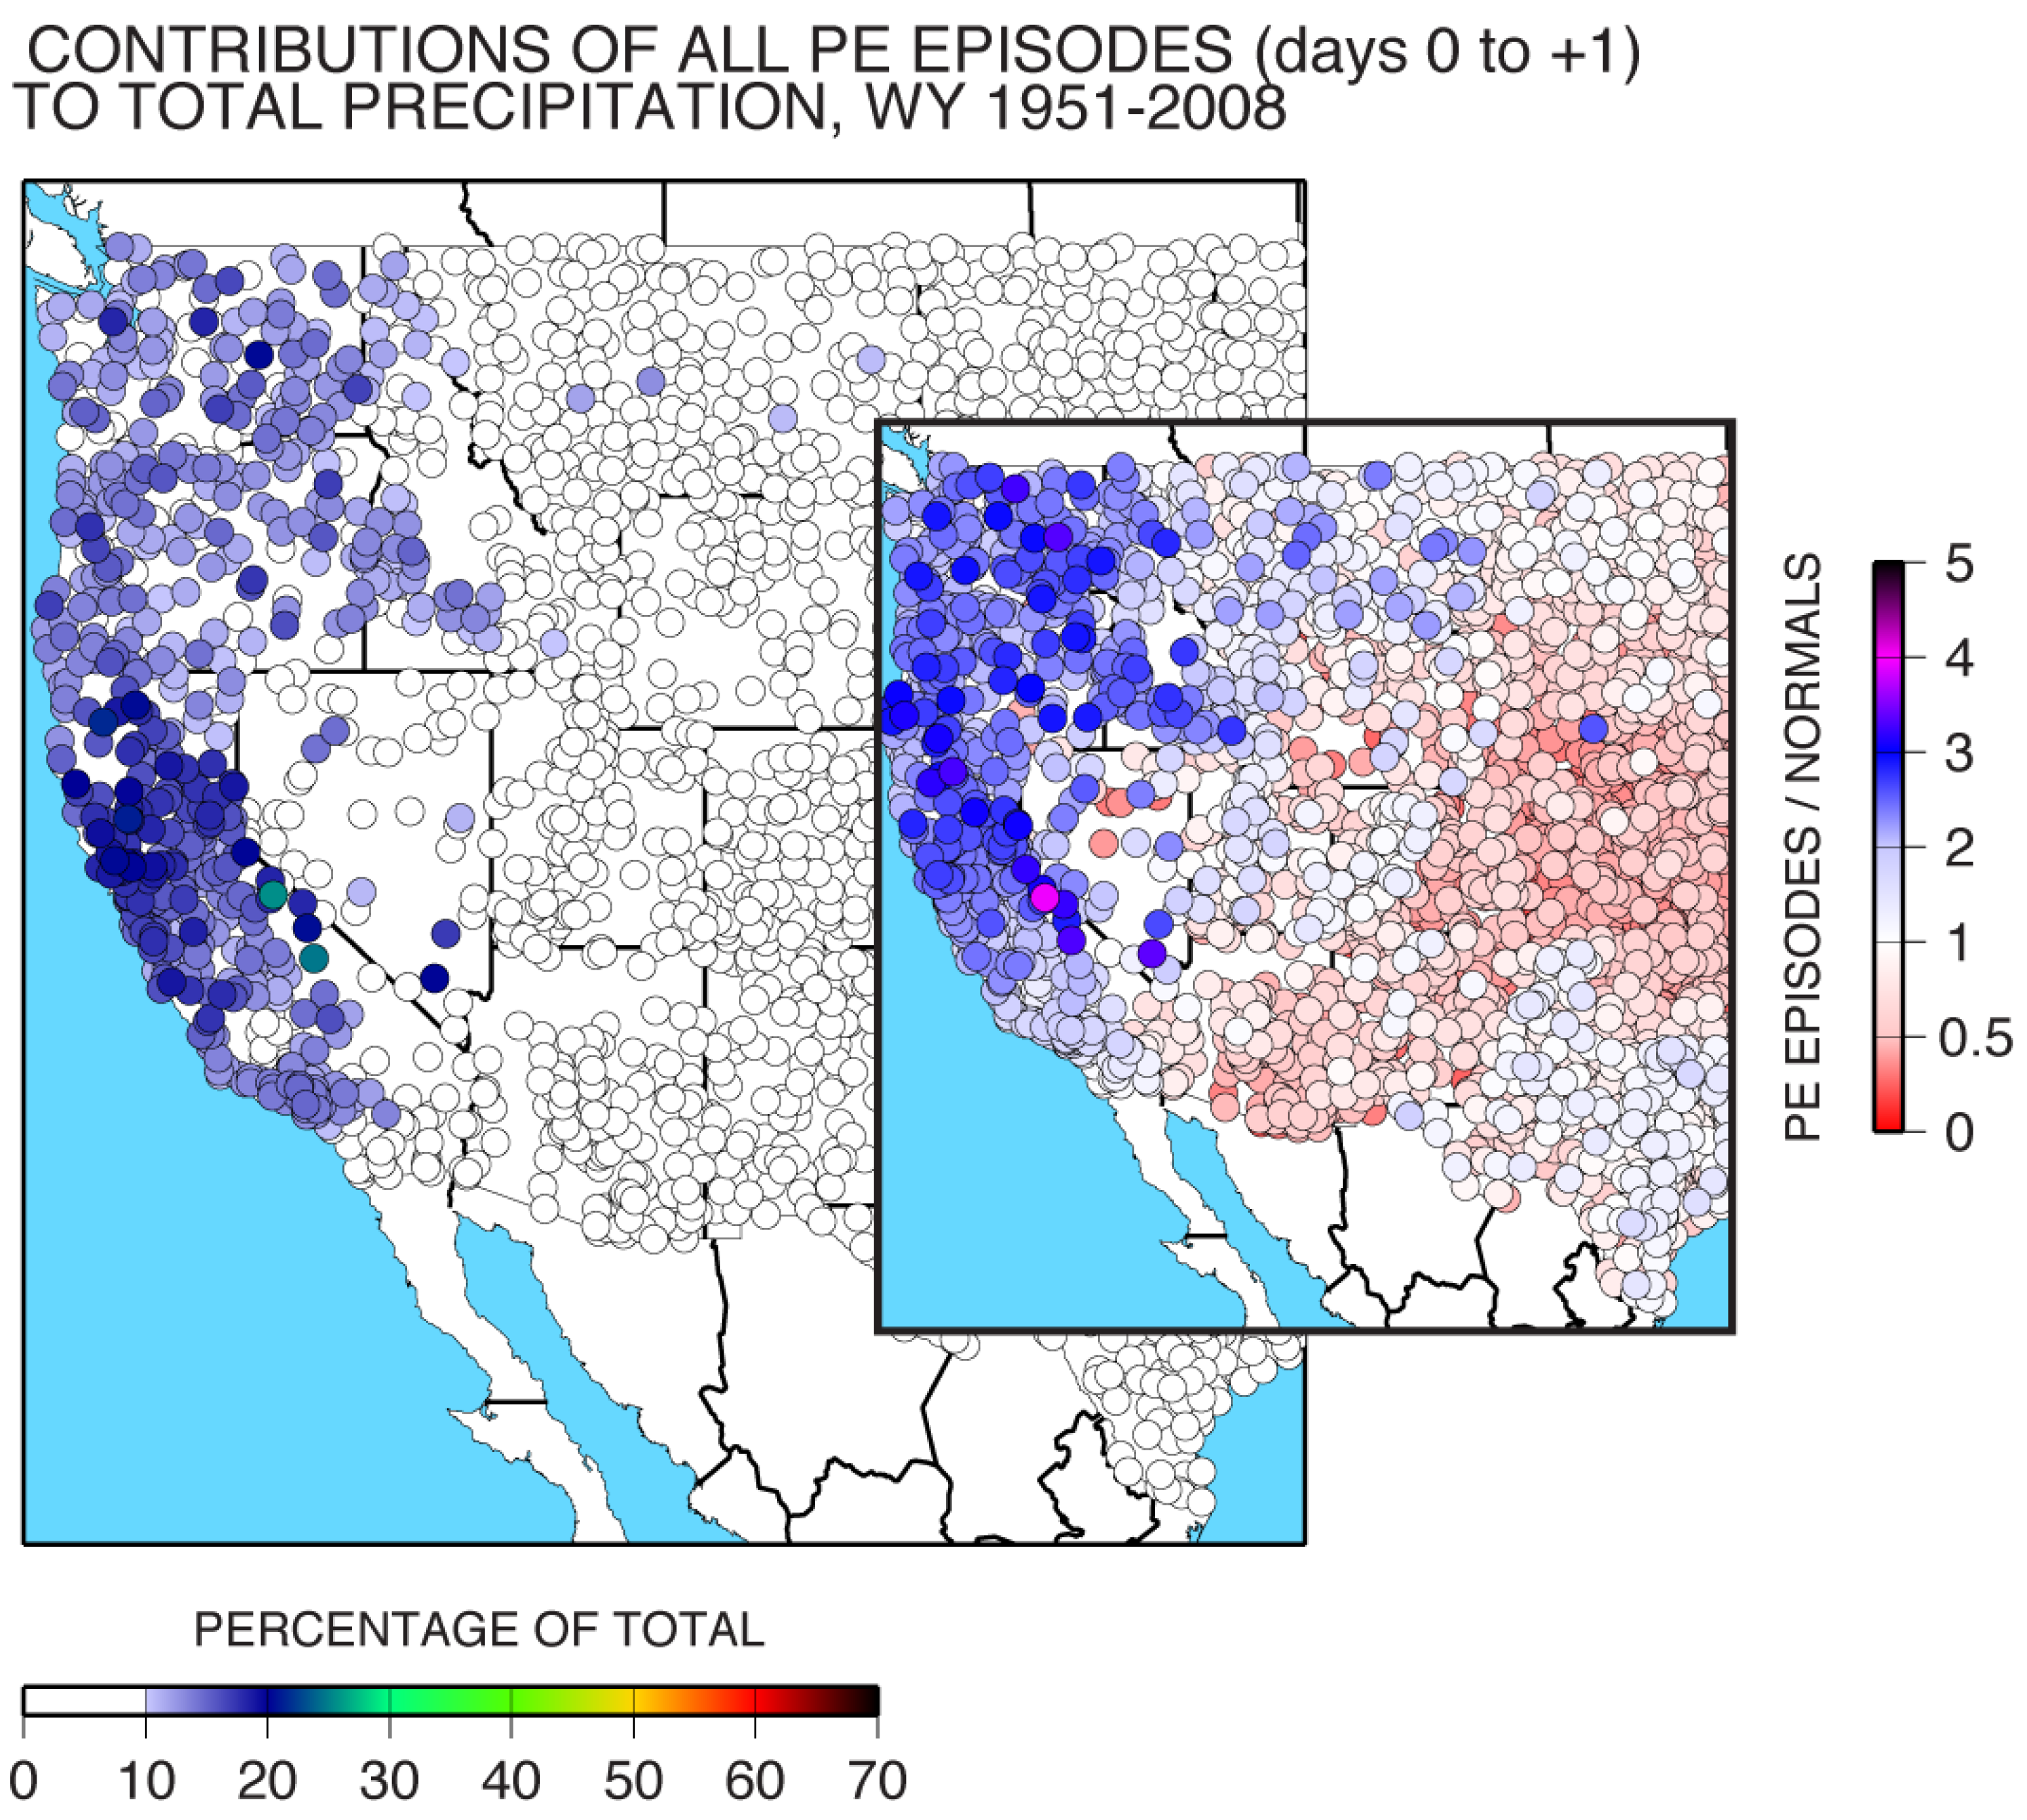
5.1. Long-Term Contributions
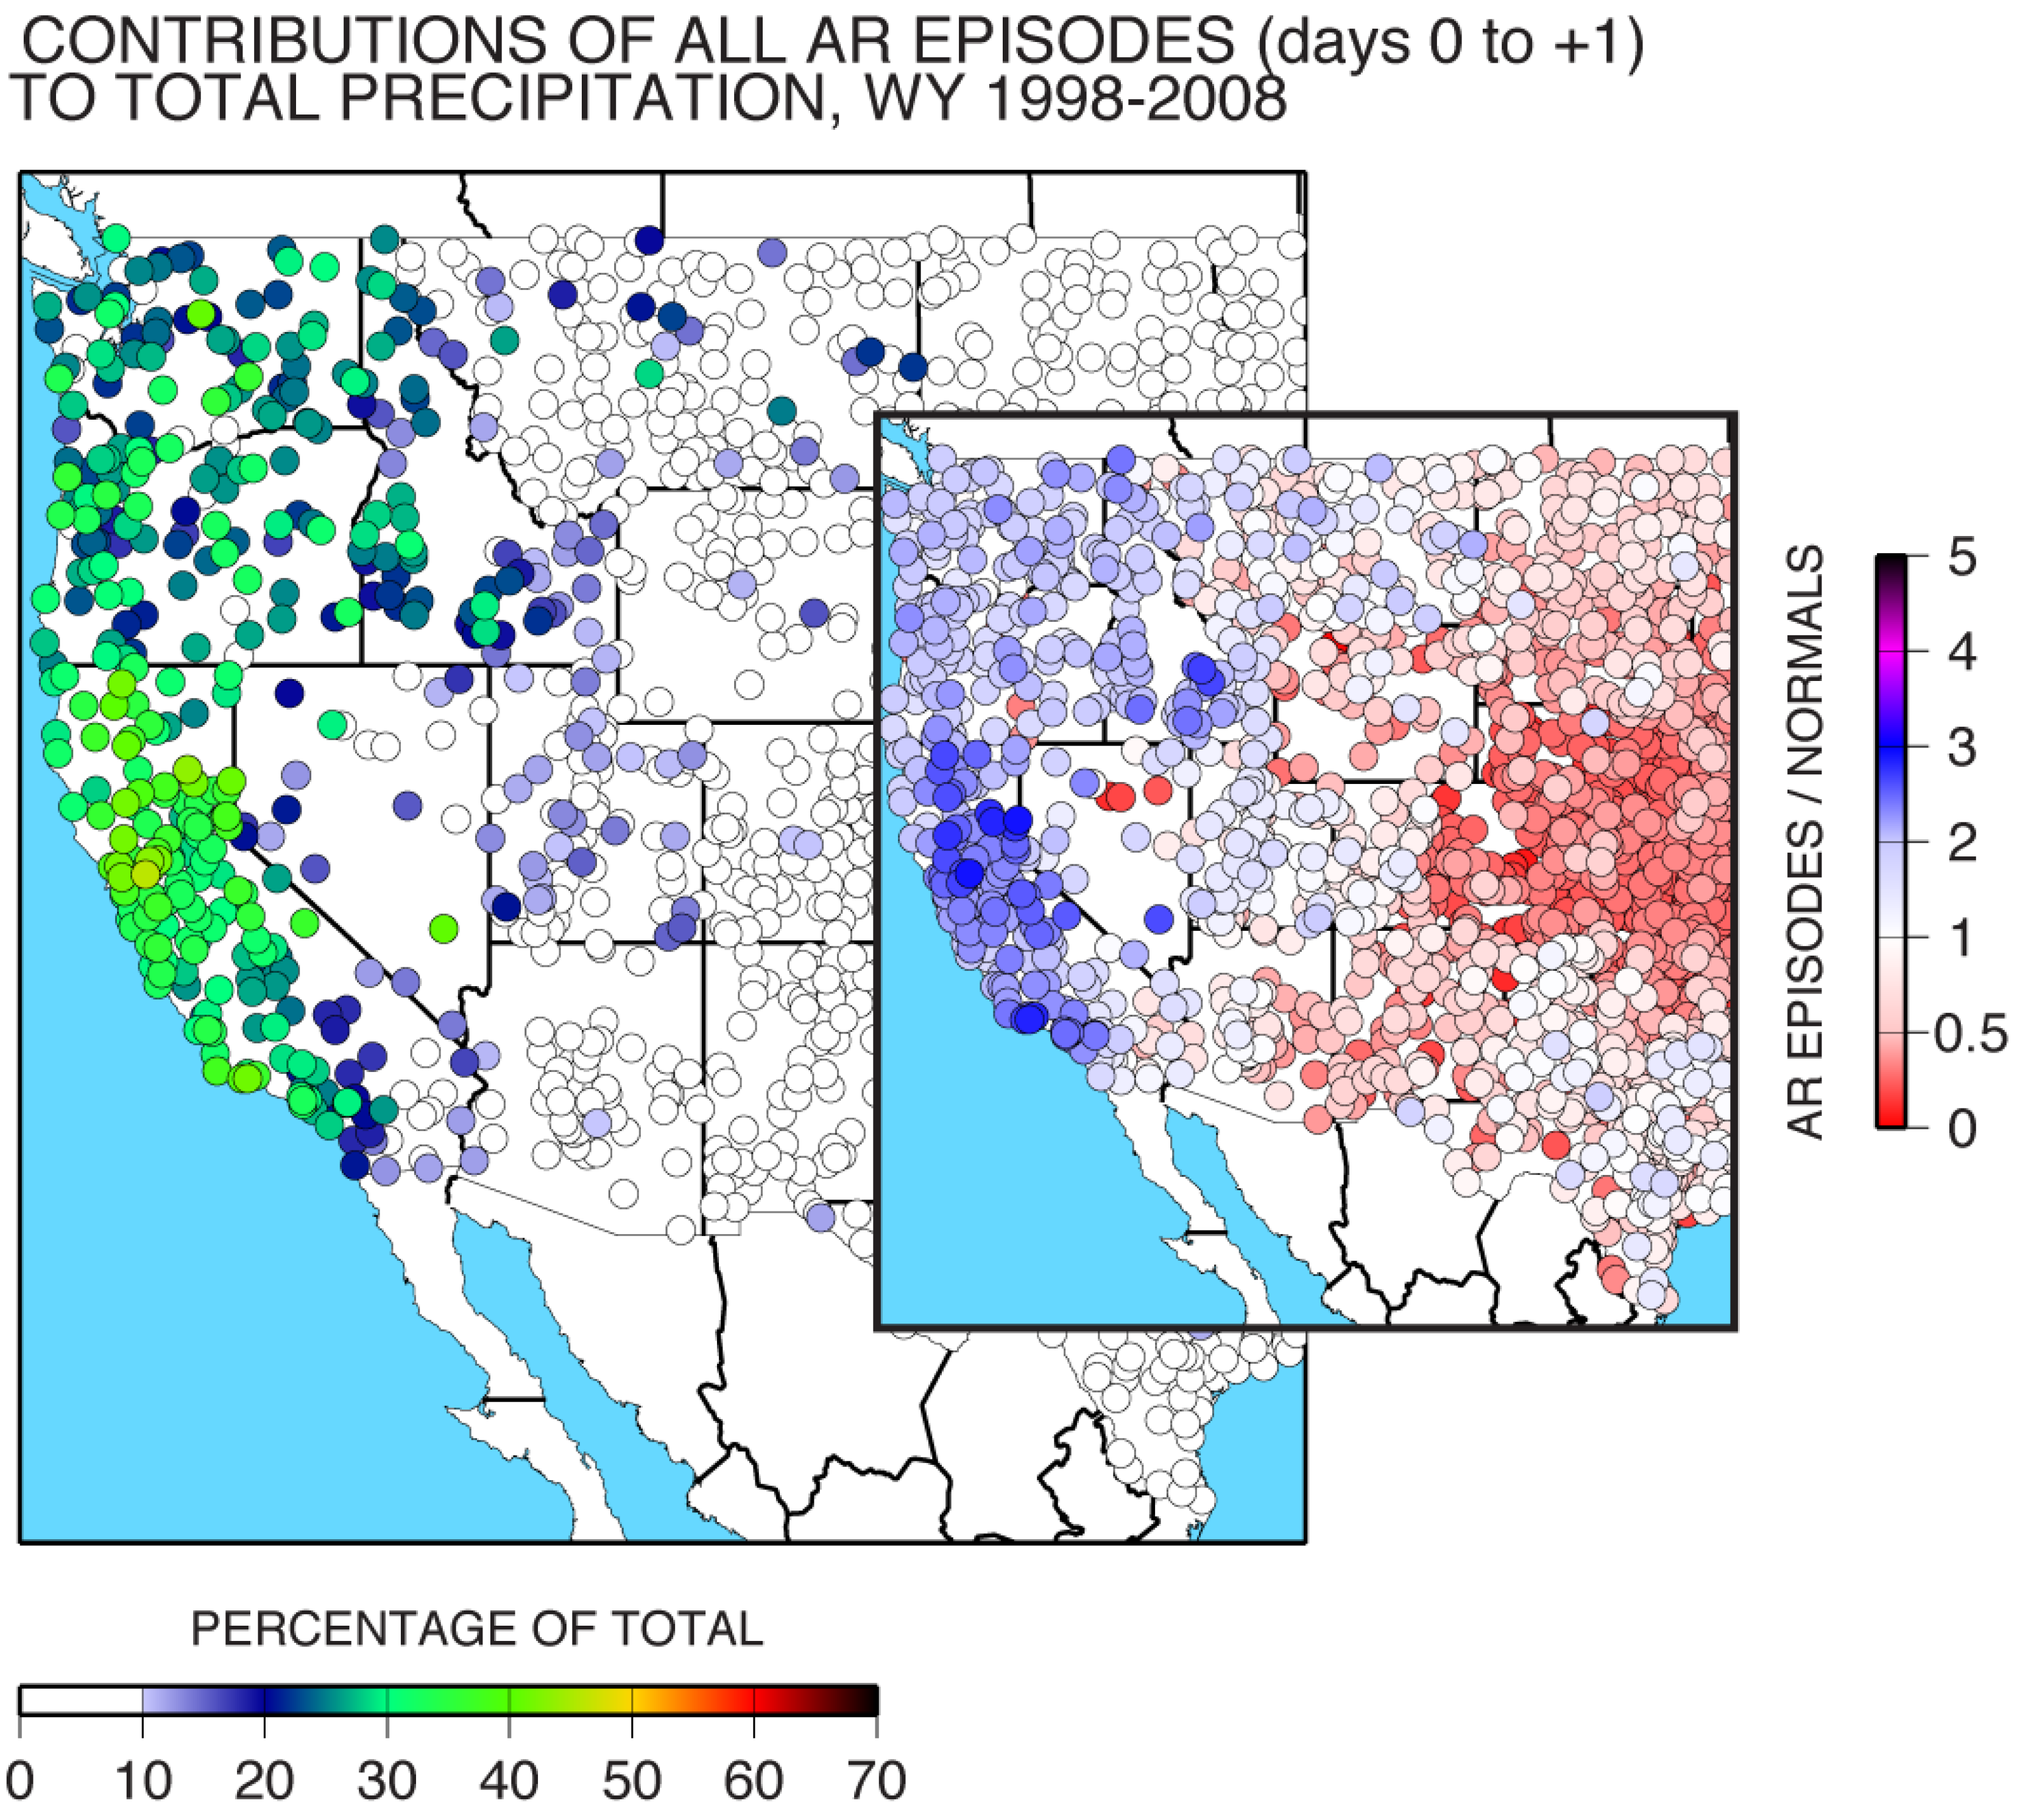
| Maximum ratio among central and northern California sites and grid cells shown in Figure 6, Figure 7 and Figure 8 | 75th-percentile ratio among central and northern California sites and grid cells shown in Figure 9 and Figure 10 | 25th-percentile ratio among central and northern California sites and grid cells shown in Figure 9 and Figure 10 | ||||
| AR events | PE events | AR events | PE events | AR events | PE events | |
| Precipitation (days 0 and +1) | ||||||
| Cooperative precipitation observations | 46% | 22% | 36% | 17% | 31% | 13% |
| VIC-gridded precipitation | 45% | 21% | 40% | 16% | 33% | 12% |
| Streamflow or Runoff (days 0 to +3 days) | ||||||
| HCDN streamflow | 71% | 55% | 52% | 38% | 34% | 25% |
| VIC-simulated runoff | 61% | 40% | 43% | 24% | 26% | 12% |
5.2. Year-To-Year Contributions

6. Summary and Conclusions
Acknowledgments
References
- California Department of Water Resources (DWR). California Water Plan Update—A Framework for Action—DWR Bulletin 160-05; DWR: Sacramento, CA, USA, 2005; p. 24. Available online: http://www.waterplan.water.ca.gov/docs/cwpu2005/cwphighlights/highlights.pdf (accessed on 2 January 2011).
- Kelley, R. Battling the Inland Sea—Floods, Public Policy and the Sacramento Valley; University of California Press: Berkeley, CA, USA, 1998; p. 420. [Google Scholar]
- Weaver, R.L. Meteorology of Hydrologically Critical Storms in California; U.S. Department of Commerce Hydrometeorology Report No. 37; Department of Commerce Hydrometeorology: Washington, DC, USA, 1962; p. 207.
- Higgins, R.W.; Schemm, J.K.E.; Shi, W.; Leetmaa, A. Extreme precipitation events in the western United States related to tropical forcing. J. Climate 2000, 13, 793–820. [Google Scholar] [CrossRef]
- Dettinger, M.D. Fifty-Two Years of Pineapple-Express Storms across the West Coast of North America; California Energy Commission PIER Energy-Related Environmental Research Report CEC-500-2005-004; California Energy Commission: Sacramento, CA, USA, 2004; p. 15.
- Zhu, Y.; Newell, R.E. A proposed algorithm for moisture fluxes from atmospheric rivers. Mon. Wea. Rev. 1998, 126, 725–735. [Google Scholar] [CrossRef]
- Ralph, F.M.; Neiman, P.J.; Wick, G.A. Satellite and CALJET aircraft observations of atmospheric rivers over the eastern North-Pacific Ocean during the winter of 1997/98. Mon. Wea. Rev. 2004, 132, 1721–1745. [Google Scholar] [CrossRef]
- Neiman, P.J.; Ralph, F.M.; Wick, G.A.; Kuo, Y.H.; Wee, T.K.; Ma, Z.; Taylor, G.H.; Dettinger, M.D. Diagnosis of an intense atmospheric river impacting the Pacific Northwest—Storm summary and offshore vertical structure observed with COSMIC satellite retrievals. Mon. Wea. Rev. 2008, 136, 4398–4420. [Google Scholar] [CrossRef]
- Ralph, F.M.; Neiman, P.J.; Rotunno, R. Dropsonde observations in low-level jets over the northeastern Pacific Ocean from CALJET-1998 and PACJET-2001: Mean vertical-profile and atmospheric-river characteristics. Mon. Wea. Rev. 2005, 133, 889–910. [Google Scholar] [CrossRef]
- Ralph, F.M.; Neiman, P.J.; Wick, G.A.; Gutman, S.; Dettinger, M.; Cayan, D.; White, A.B. Flooding on California’s Russian River—Role of atmospheric rivers. Geophys. Res. Lett. 2006, 33, 5. [Google Scholar]
- Bao, J.W.; Michelson, S.A.; Neiman, P.J.; Ralph, F.M.; Wilczak, J.M. Interpretation of enhanced integrated water vapor bands associated with extratropical cyclones: Their formation and connection to tropical moisture. Mon. Wea. Rev. 2006, 134, 1063–1080. [Google Scholar] [CrossRef]
- Kalnay, E.; Kanamitsu, M.; Kistler, R.; Collins, W.; Deaven, D.; Gandin, L.; Iredell, M.; Saha, S.; White, G.; Woollen, J.; Zhu, Y.; Chelliah, M.; Ebisuzaki, W.; Higgins, W.; Janowiak, J.; Mo, K.C.; Ropelewski, C.; Wang, J.; Leetmaa, A.; Reynolds, R.; Jenne, R.; Joseph, D. The NCEP/NCAR 40-year reanalysis project. Bull. Amer. Meteor. Soc. 1996, 77, 437–471. [Google Scholar] [CrossRef]
- National Weather Service (NWS). National Weather Service Observing Handbook Number 2. Cooperative Station Observations. Observing Systems Branch, Office of Systems Operations: Washington, DC, USA, 1989; p. 94. Available online: http://www.nws.noaa.gov/om/coop/Publications/coophandbook2.pdf (accessed on 3 February 2010).
- Slack, J.R.; Landwehr, J.M. Hydro-climatic Data Network (HCDN): A U.S. Geological Survey Streamflow Data Set of the United States for the Study of Climate Variations,1874-1988; USGS Open-File Report 92-129; U.S. Geological Survey (USGS): Reston, VA, USA, 1992; p. 193. [Google Scholar]
- Liang, X.; Lettenmaier, D.P.; Wood, E.F.; Burges, S.J. A simple hydrologically based model of land surface water and energy fluxes for GSMs. J. Geophys. Res. 1994, 99, 14415–14428. [Google Scholar] [CrossRef]
- Hamlet, A.F.; Lettenmaier, D.P. Production of temporally consistent gridded precipitation and temperature fields for the continental U.S. J. Hydrometeor. 2005, 6, 330–336. Available online: http://www.hydro.washington.edu (accessed on 12 November 2010). [Google Scholar] [CrossRef]
- Daly, C.; Neilson, R.P.; Phillips, D.L. A statistical-topographic model for mapping climatological precipitation over mountainous terrain. J. Appl. Meteor. 1994, 33, 140–158. [Google Scholar] [CrossRef]
- Durrre, I.; Menne, M.J.; Gleason, B.E.; Houston, T.G.; Vose, R.S. Comprehensive automated quality assurance of daily surface observations. J. Appl. Meteorol. Clim. 2010, 49, 1615–1633. [Google Scholar] [CrossRef]
- Wood, A.W.; Lettenmaier, D.P. A testbed for new seasonal hydrologic forecasting approaches in the western US. Bull. Amer. Meteorol. Soc. 2006, 87, 1699–1712. [Google Scholar] [CrossRef]
- Maurer, E.P.; Wood, A.W.; Adam, J.C.; Lettenmaier, D.P.; Nijssen, B. A long-term hydrologically-based data set of land surface fluxes and states for the conterminous United States. J. Climate 2002, 15, 3237–3251. [Google Scholar] [CrossRef]
- Wood, E.F.; Lettenmaier, D.P.; Zartarian, V.G. A land-surface hydrology parameterization with subgrid variability for general circulation models. J. Geophys. Res. 1992, 97, 2717–2728. [Google Scholar] [CrossRef]
- Neiman, P.J.; Ralph, F.M.; Wick, G.A.; Lundquist, J.; Dettinger, M.D. Meteorological characteristics and overland precipitation impacts of atmospheric rivers affecting the West Coast of North America based on eight years of SSM/I satellite observations. J. Hydrometeor. 2008, 9, 22–47. [Google Scholar] [CrossRef]
- Hollinger, J.P.; Peirce, J.L.; Poe, G.A. SSM/I instrument evaluation. IEEE Transactions on Geosci. Remote Sens. 1990, 28, 781–790. [Google Scholar] [CrossRef]
- Wentz, F.J. The Intercomparison of 53 SSM/I Water Vapor Algorithms; Remote Sensing Systems Technical Report on WetNet Water Vapor Intercomparison Project (VIP); Remote Sensing Systems: Santa Rosa, CA, USA, 1995; p. 19. [Google Scholar]
- Cayan, D.R.; Dettinger, M.D.; Redmond, K.T.; McCabe, G.J.; Knowles, N.; Peterson, D.H. The transboundary setting of California’s water and hydropower systems—Linkages between the Sierra Nevada, Columbia River, and Colorado River hydroclimates. In Climate and Water—Transboundary Challenges in the Americas; Diaz, H.F., Morehouse, B.J., Eds.; Kluwer Academic: Dordrecht, The Netherlands, 2003; pp. 237–262. [Google Scholar]
- Ralph, F.M.; Dettinger, M.D. Extreme precipitation patterns across the contiguous United States documented using 3-day rainfall categories. Bull. Am. Meteor. Soc. Submitted.
- Jeton, A.E. US Geological Survey Fact Sheet 2006-3102; Flood Chronology of the Carson River Basin, California and Nevada Web Site: Carson City, NV, USA, 2006; p. 2. [Google Scholar]
- Guan, B.; Molotch, N.P.; Waliser, D.E.; Fetzer, E.J.; Neiman, P.J. Extreme snowfall events linked to atmospheric rivers and surface air temperature via satellite measurements. Geophys. Res. Lett. 2010, 37, L20401. [Google Scholar] [CrossRef]
- Ralph, F.M.; Neiman, P.J.; Kiladis, G.N.; Weickmann, K.M.; Reynolds, D.W. A multi-scale observational case study of a Pacific atmospheric river exhibiting tropical-extratropical connections and a mesoscale frontal wave. Mon. Wea. Rev. 2010, in press.. [Google Scholar]
- McCabe, G.J.; Dettinger, M.D. Primary modes and predictability of year-to-year snowpack variations in the western United States from teleconnections with Pacific Ocean climate. J. Hydrometeor. 2002, 3, 13–25. [Google Scholar] [CrossRef]
- Trenberth, K.E. The definition of El Niño. Bull. Am. Met. Soc. 1997, 78, 2771–2777. [Google Scholar] [CrossRef]
- Mantua, N.J.; Hare, S.R.; Zhang, Y.; Wallace, J.M.; Francis, R.C. A Pacific interdecadal climate oscillation with impacts on salmon production. Bull. Am. Met. Soc. 1997, 78, 1069–1079. [Google Scholar] [CrossRef]
- Redmond, K.T.; Koch, R.W. Surface climate and streamflow variability in the western United States and their relationship to large-scale circulation indices. Water Resour. Res. 1991, 27, 2381–2399. [Google Scholar] [CrossRef]
- Cayan, D.R.; Webb, R.H. El Nino/Southern Oscillation and streamflow in the western United States. In El Nino: Historical and Paleoclimatic Aspects of the Southern Oscillation; Diaz, H.F., Markgraf, V., Eds.; Cambridge University Press: Cambridge, UK, 1992; pp. 29–68. [Google Scholar]
- Wang, H.; Mehta, V.M. Decadal variability of the Indo-Pacific warm pool and its association with atmospheric and oceanic variability in the NCEP-NCAR and SODA Reanalysis. J. Climate 2008, 21, 5545–5565. [Google Scholar] [CrossRef]
- Dettinger, M.D. Climate change, atmospheric rivers and floods in California—A multimodel analysis of storm frequency and magnitude changes. J. Am. Water Resour. Assoc. in press.
- More information available online:. Available online: http://www.esrl.noaa.gov/psd/calwater/ (accessed on 2 January 2011).
© 2011 by the authors; licensee MDPI, Basel, Switzerland. This article is an open access article distributed under the terms and conditions of the Creative Commons Attribution license (http://creativecommons.org/licenses/by/3.0/).
Share and Cite
Dettinger, M.D.; Ralph, F.M.; Das, T.; Neiman, P.J.; Cayan, D.R. Atmospheric Rivers, Floods and the Water Resources of California. Water 2011, 3, 445-478. https://doi.org/10.3390/w3020445
Dettinger MD, Ralph FM, Das T, Neiman PJ, Cayan DR. Atmospheric Rivers, Floods and the Water Resources of California. Water. 2011; 3(2):445-478. https://doi.org/10.3390/w3020445
Chicago/Turabian StyleDettinger, Michael D., Fred Martin Ralph, Tapash Das, Paul J. Neiman, and Daniel R. Cayan. 2011. "Atmospheric Rivers, Floods and the Water Resources of California" Water 3, no. 2: 445-478. https://doi.org/10.3390/w3020445
APA StyleDettinger, M. D., Ralph, F. M., Das, T., Neiman, P. J., & Cayan, D. R. (2011). Atmospheric Rivers, Floods and the Water Resources of California. Water, 3(2), 445-478. https://doi.org/10.3390/w3020445