Soil Water Surplus in Salado River Basin and Its Variability during the Last Forty Years (Buenos Aires Province, Argentina)

Abstract
1. Introduction
2. Materials and Methods
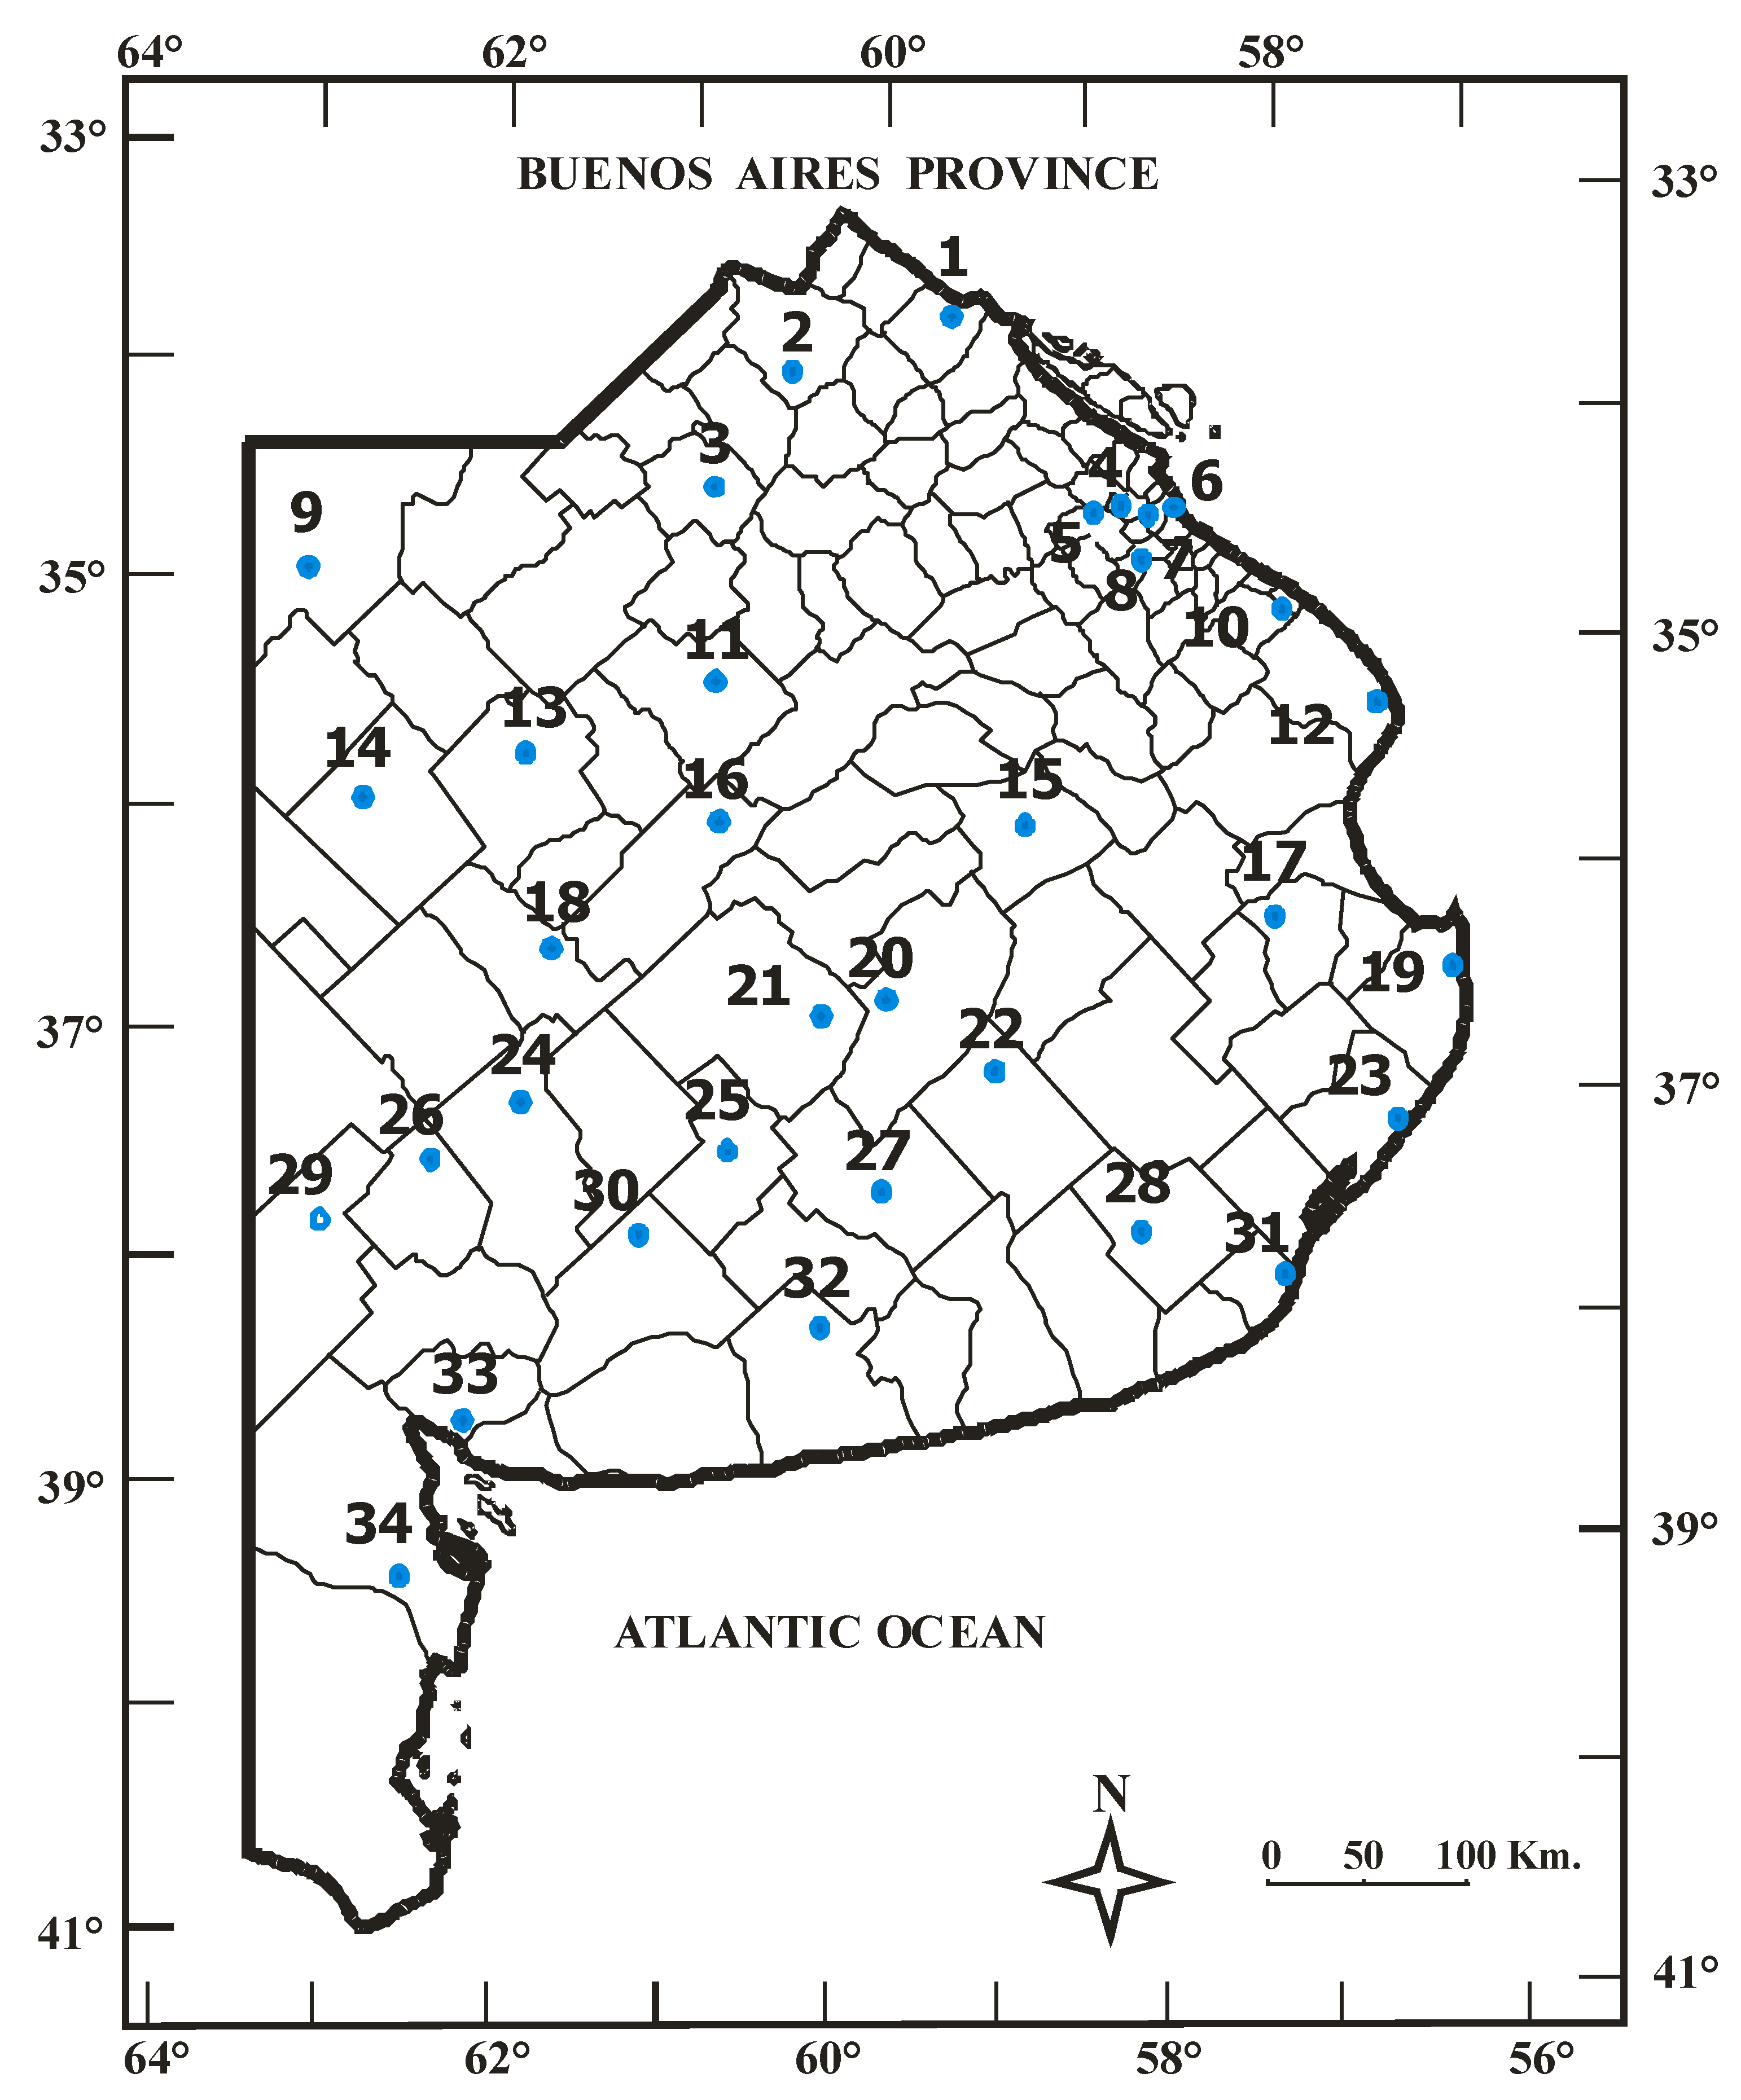
2.1. Data and Meteorological Stations

| Number | Station | Number | Station |
|---|---|---|---|
| 2 | Pergamino INTA | 19 | Santa Teresita |
| 3 | Junín | 20 | Azul |
| 4 | San Miguel | 21 | Olavarría |
| 5 | Mariano Moreno | 22 | Tandil |
| 6 | Aeroparque J. Newbery | 23 | Villa Gesell |
| 7 | Buenos Aires | 24 | Coronel Suarez |
| 8 | Ezeiza | 25 | Laprida |
| 9 | General Villegas | 26 | Pigüé |
| 10 | La Plata | 27 | Benito Juárez |
| 11 | Nueve de Julio | 28 | Balcarce INTA |
| 12 | Punta Indio | 29 | Bordenave INTA |
| 13 | Pehuajó | 30 | Coronel Pringles |
| 14 | Trenque Lauquen | 31 | Mar del Plata |
| 15 | Las Flores | 32 | Tres Arroyos |
| 16 | Bolivar | 33 | Bahía Blanca |
| 17 | Dolores | 34 | Hilario Ascasubi INTA |
2.2. Basic Hydrological Concepts
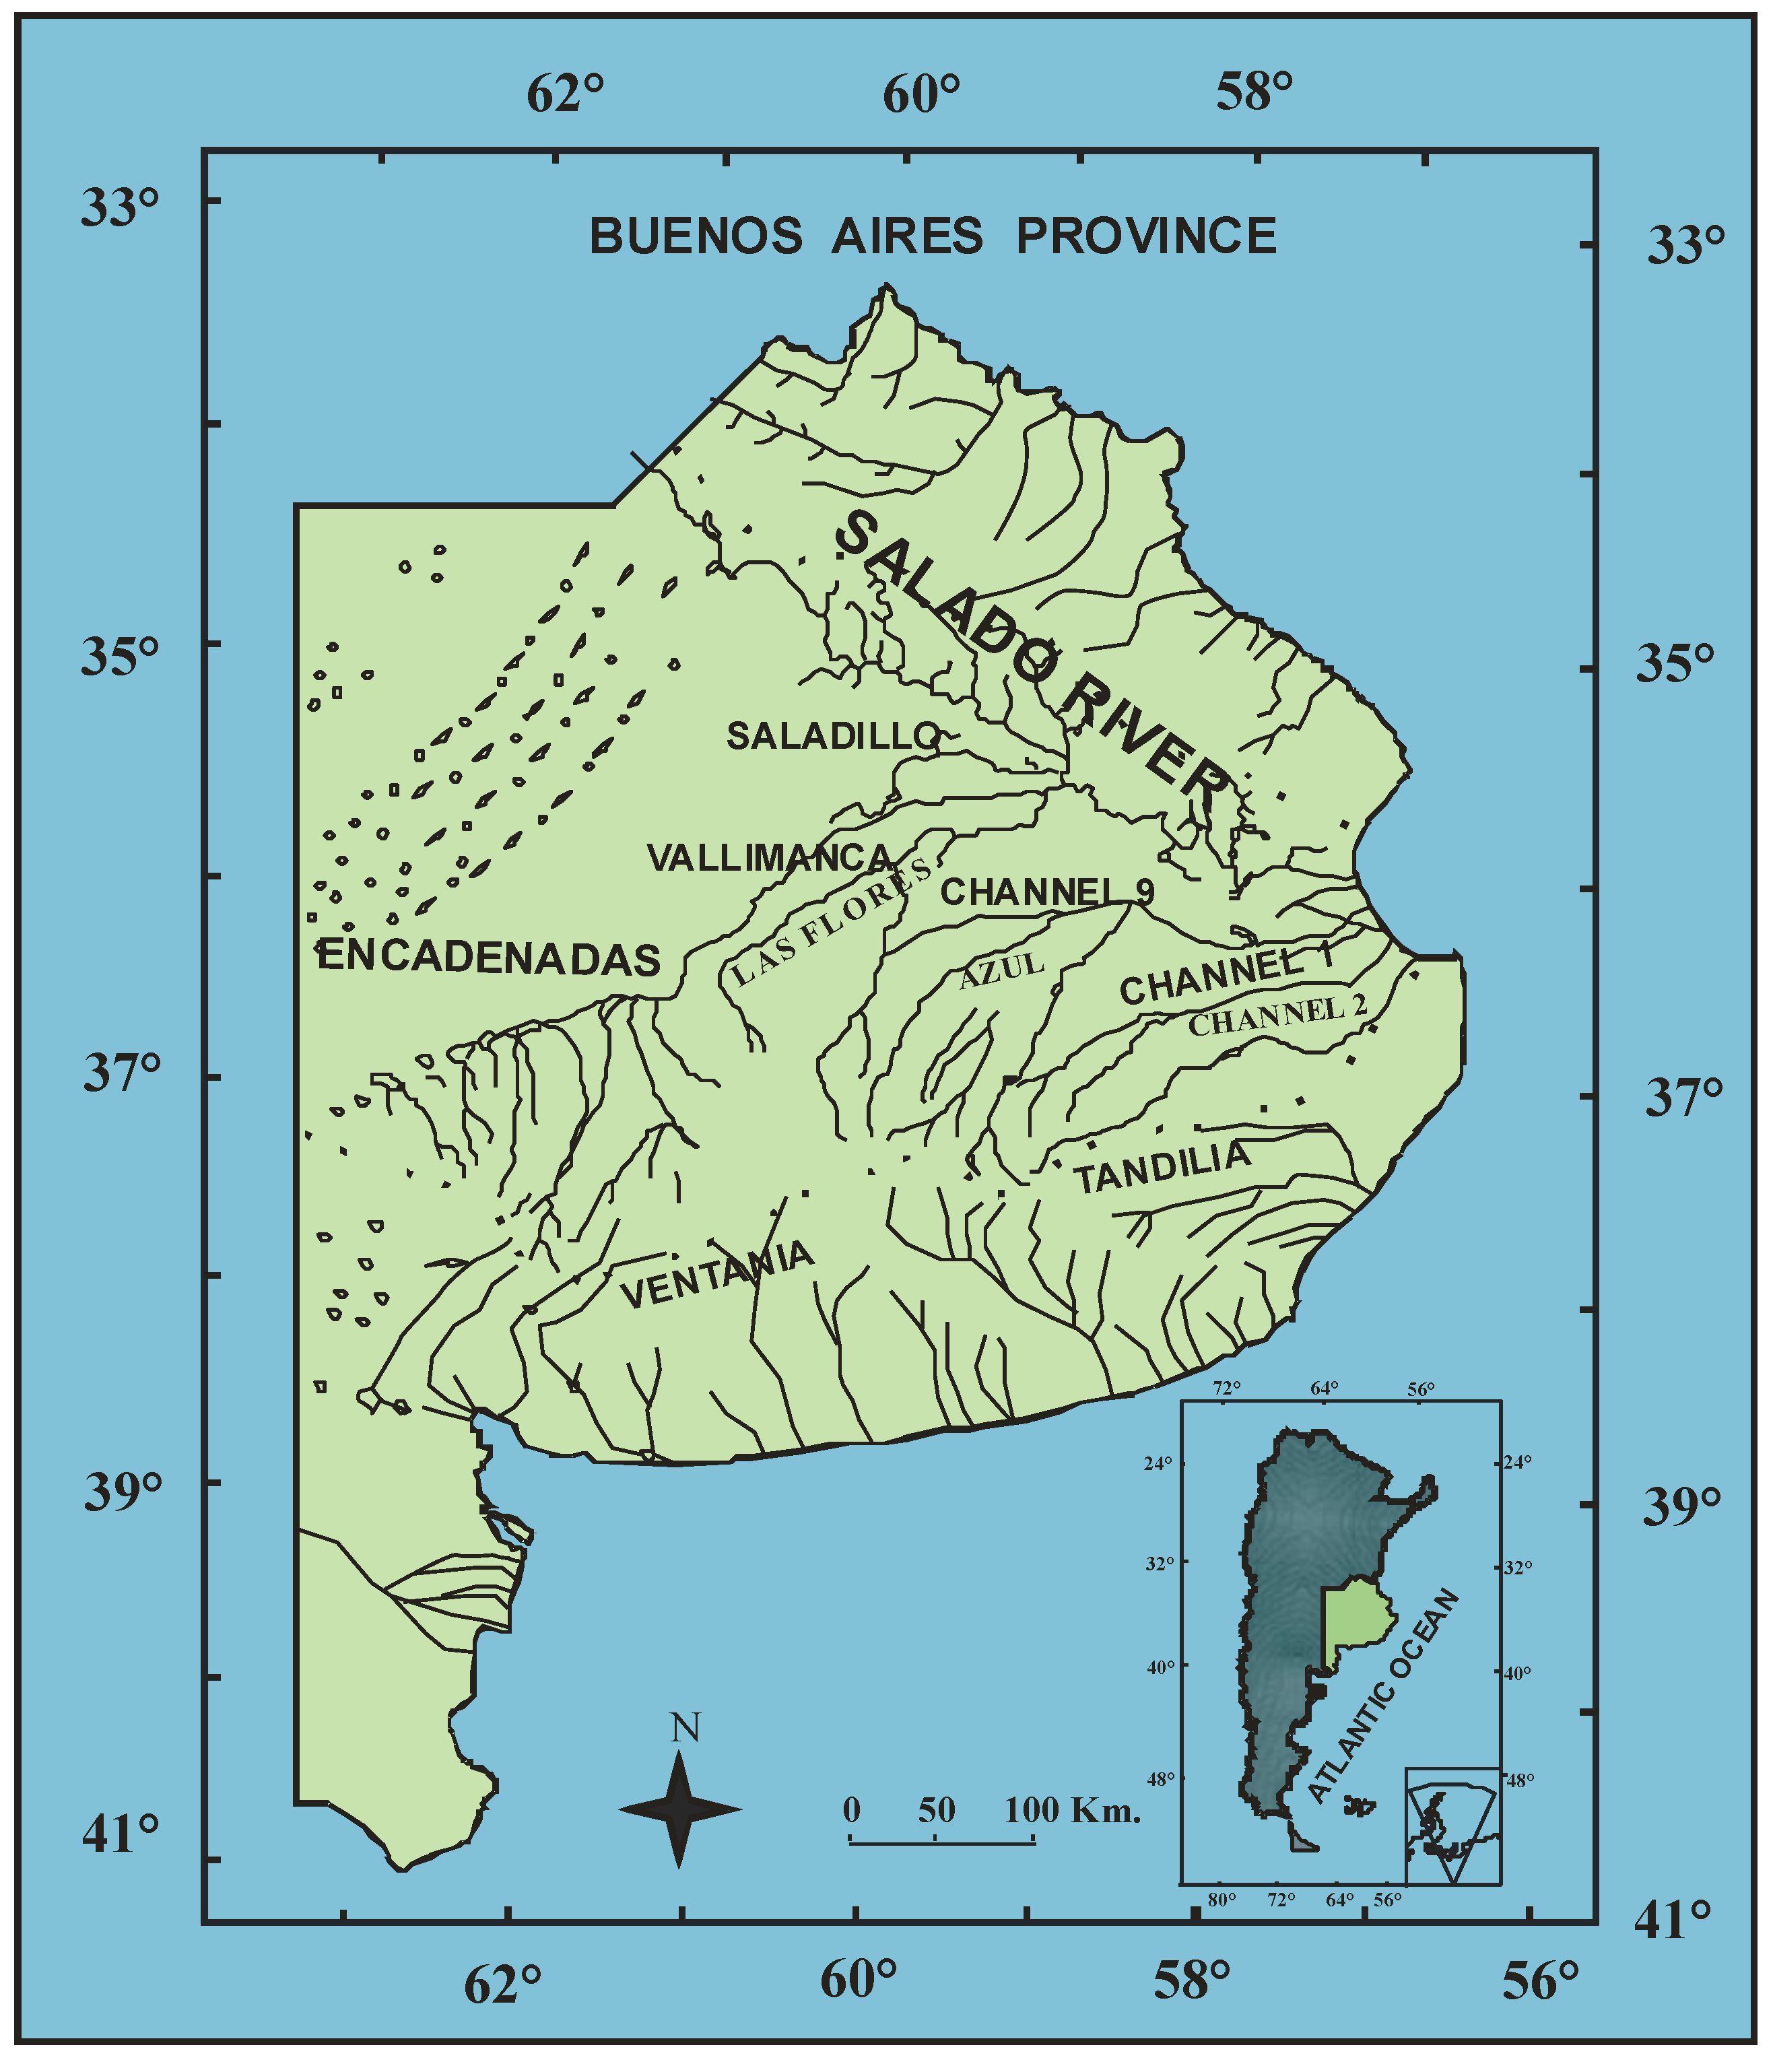
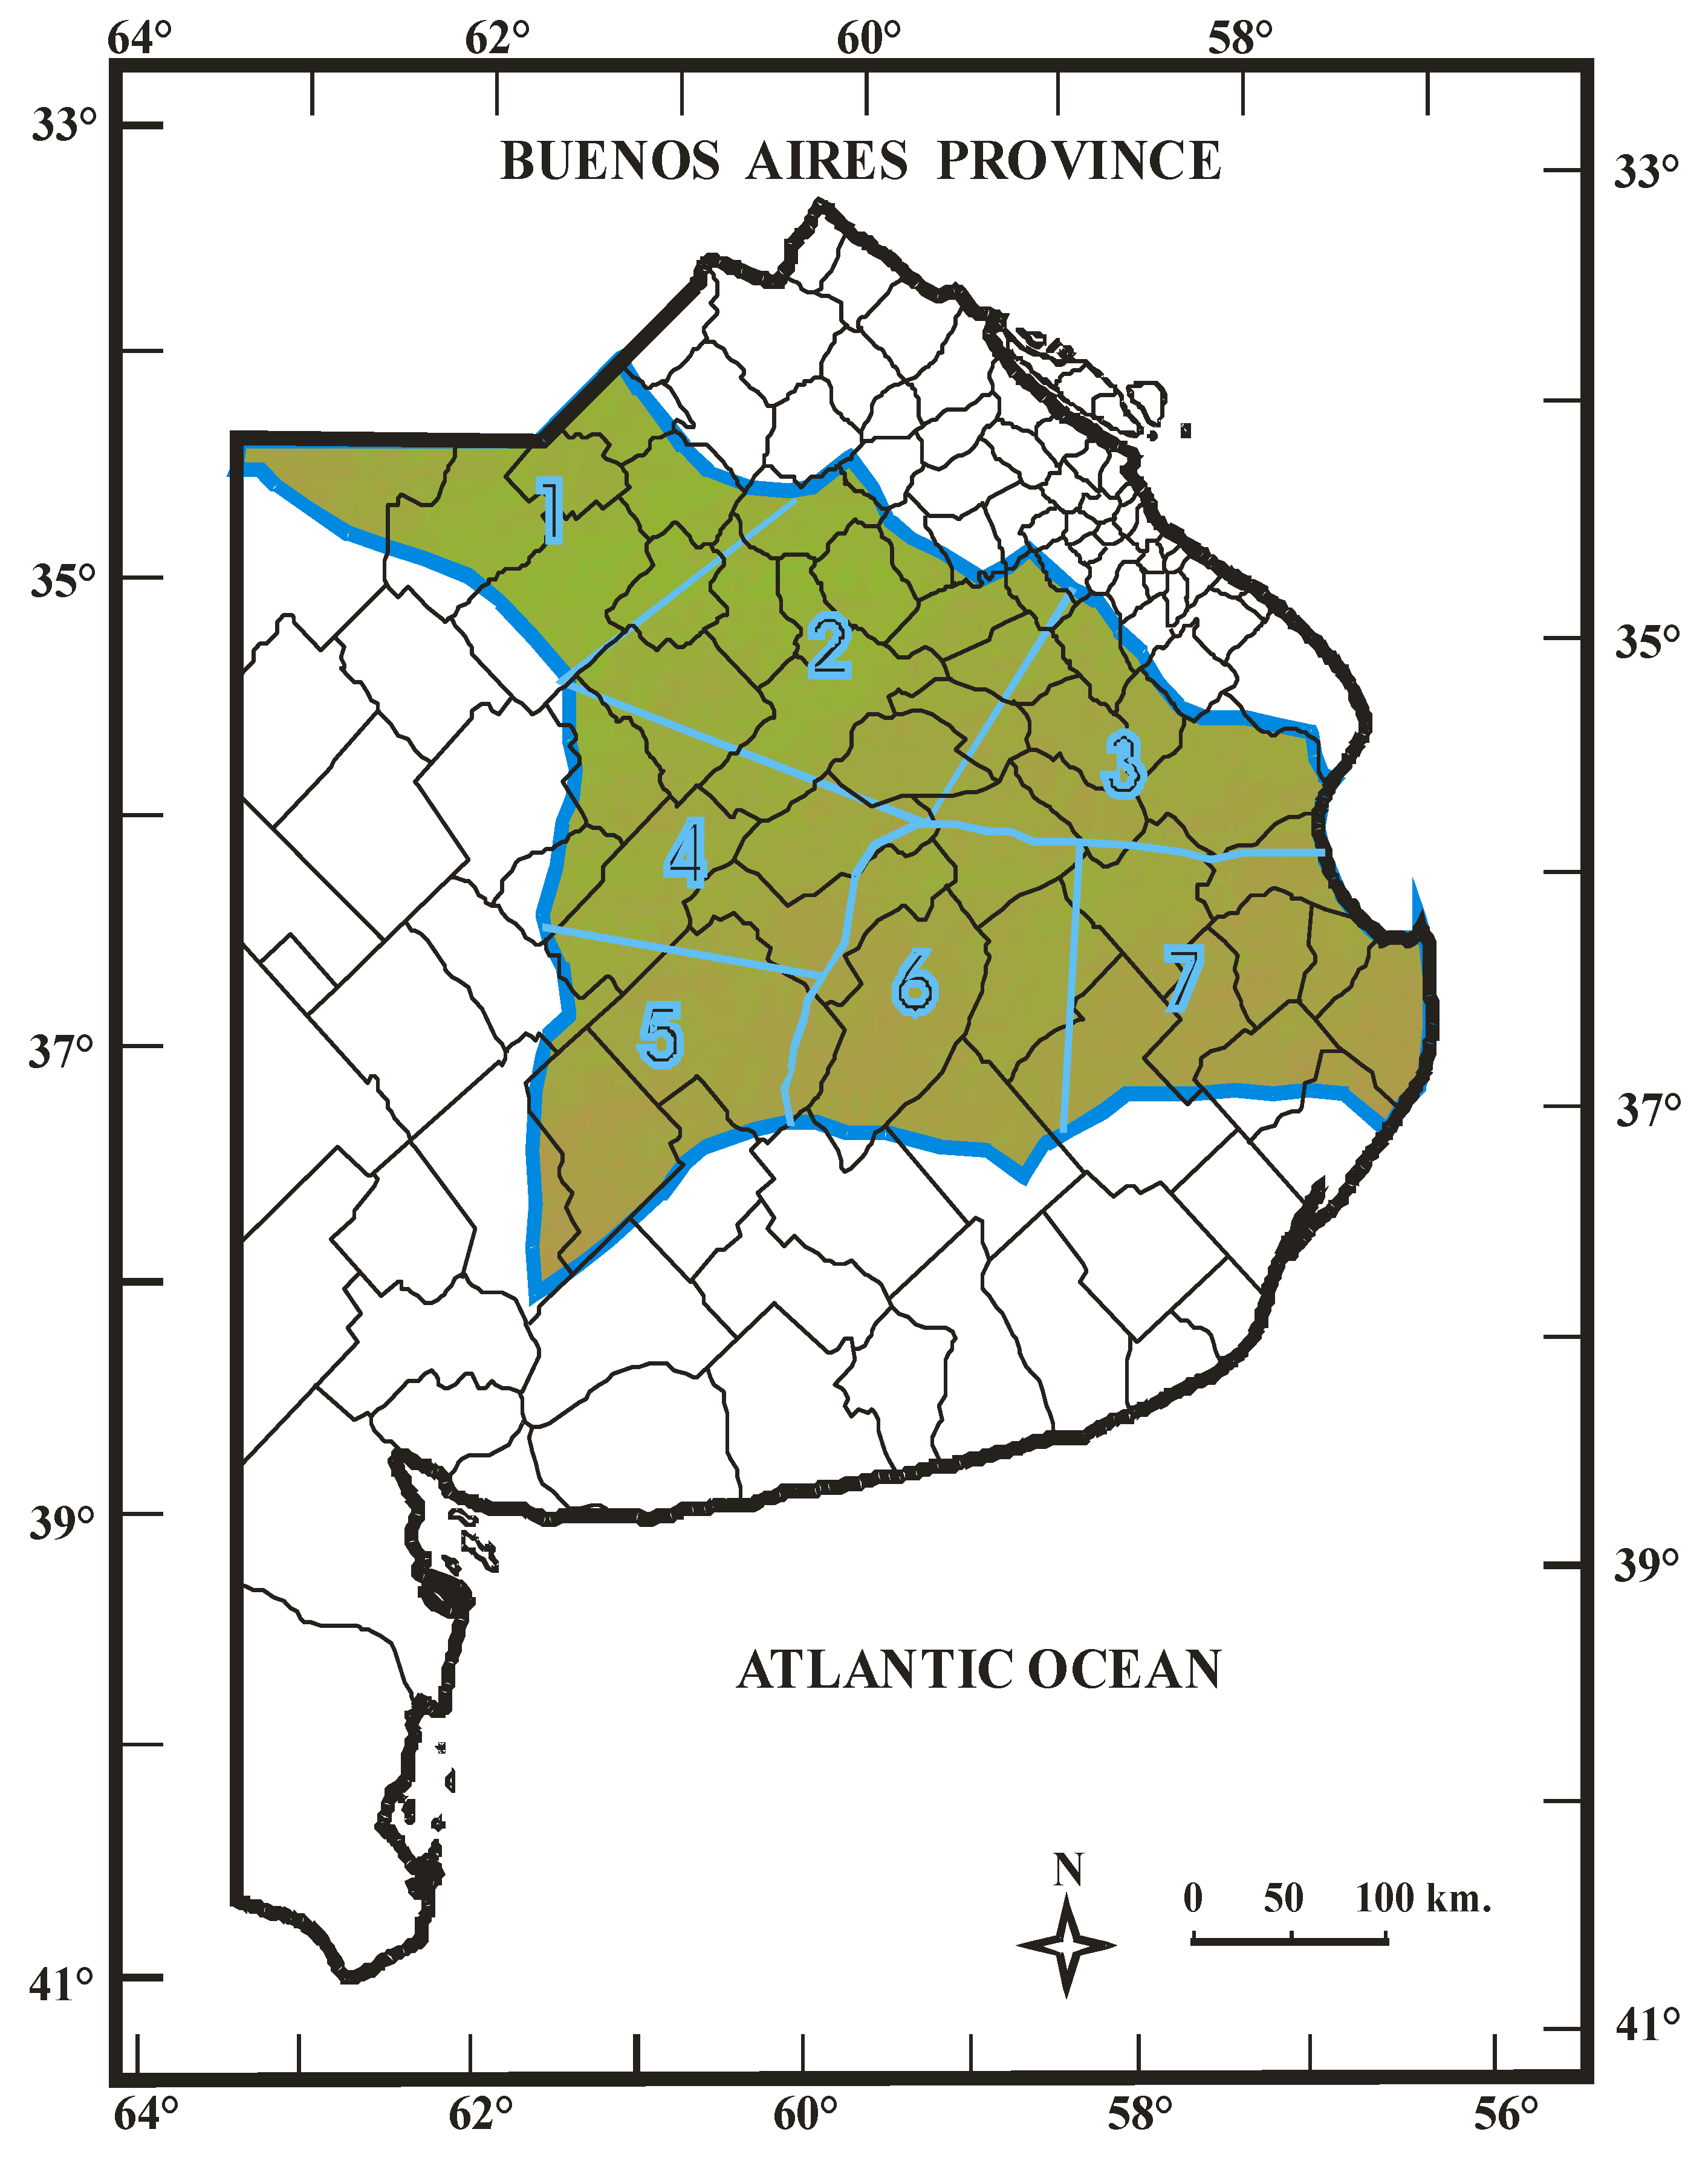
2.3. The Salado River Basin
| Drainage area | Name |
|---|---|
| S1 | Northwestern area of the Salado River basin |
| S2 | Central area of the Salado River basin |
| S3 | Salado River mouth |
| S4 | Southern area of the Salado River basin and northern area of Vallimanca River basin |
| S5 | Southern area of the Salado and Vallimanca Rivers basins |
| S6 | Western Channels area south of the Salado River |
| S7 | Channels area south of the Salado River |
2.4. Map Graphical Representation
2.5. Soil Water Surplus
2.6. Statistical Analysis
- Test Z for the trend assessment: if the number of samples n is greater than 10, the value of the statistic test Z is displayed. The absolute value of Z is compared to the standard normal cumulative distribution for assessing the presence of a trend at the selected significance level α, while a positive (negative) value of Z indicates an upward (downward) trend.
- Statistical significance: α represents the smallest significance level at which the null hypothesis (absence of trends) must be rejected. If n is lower than 10, the test uses the S statistic, while if n is larger or equal to 10, the test uses the Z (normal) statistic. To show the significance levels, the following symbols are used:
- ***
- existence of a trend with level of significance α = 0.001;
- **
- existence of a trend with level of significance α = 0.01;
- *
- existence of a trend with level of significance α = 0.05;
- +
- existence of a trend with level of significance α = 0.1.
- Estimate with the Sen’s method of the slope Q in Equation 2: Q represents the annual rate of variation of the areal sws, and is thus expressed in mm/year:
- Qmin99: estimate of the lower limit of Q with a 99% confidence interval (α = 0.1);
- Qmax99: estimate of the upper limit of Q with a 99% confidence interval (α = 0.1);
- Qmin 95: estimate of the lower limit of Q with a 95% confidence interval (α = 0.05);
- Qmax95: estimate of the upper limit of Q with a 95% confidence interval (α = 0.05).
- Estimate with the Sen’s method of the constant B in Equation 2: B represents the mean annual areal value at the beginning of the observations, and is expressed in mm:
- Bmin99: estimate of the lower limit of B with a 99% confidence interval (α = 0.1);
- Bmax99: estimate of the upper limit of B with a 99% confidence interval (α = 0.1);
- Bmin95: estimate of the lower limit of B with a 95% confidence interval (α = 0.05);
- Bmax95: estimate of the upper limit of B with a 95% confidence interval (α = 0.05);
3. Results and Discussion

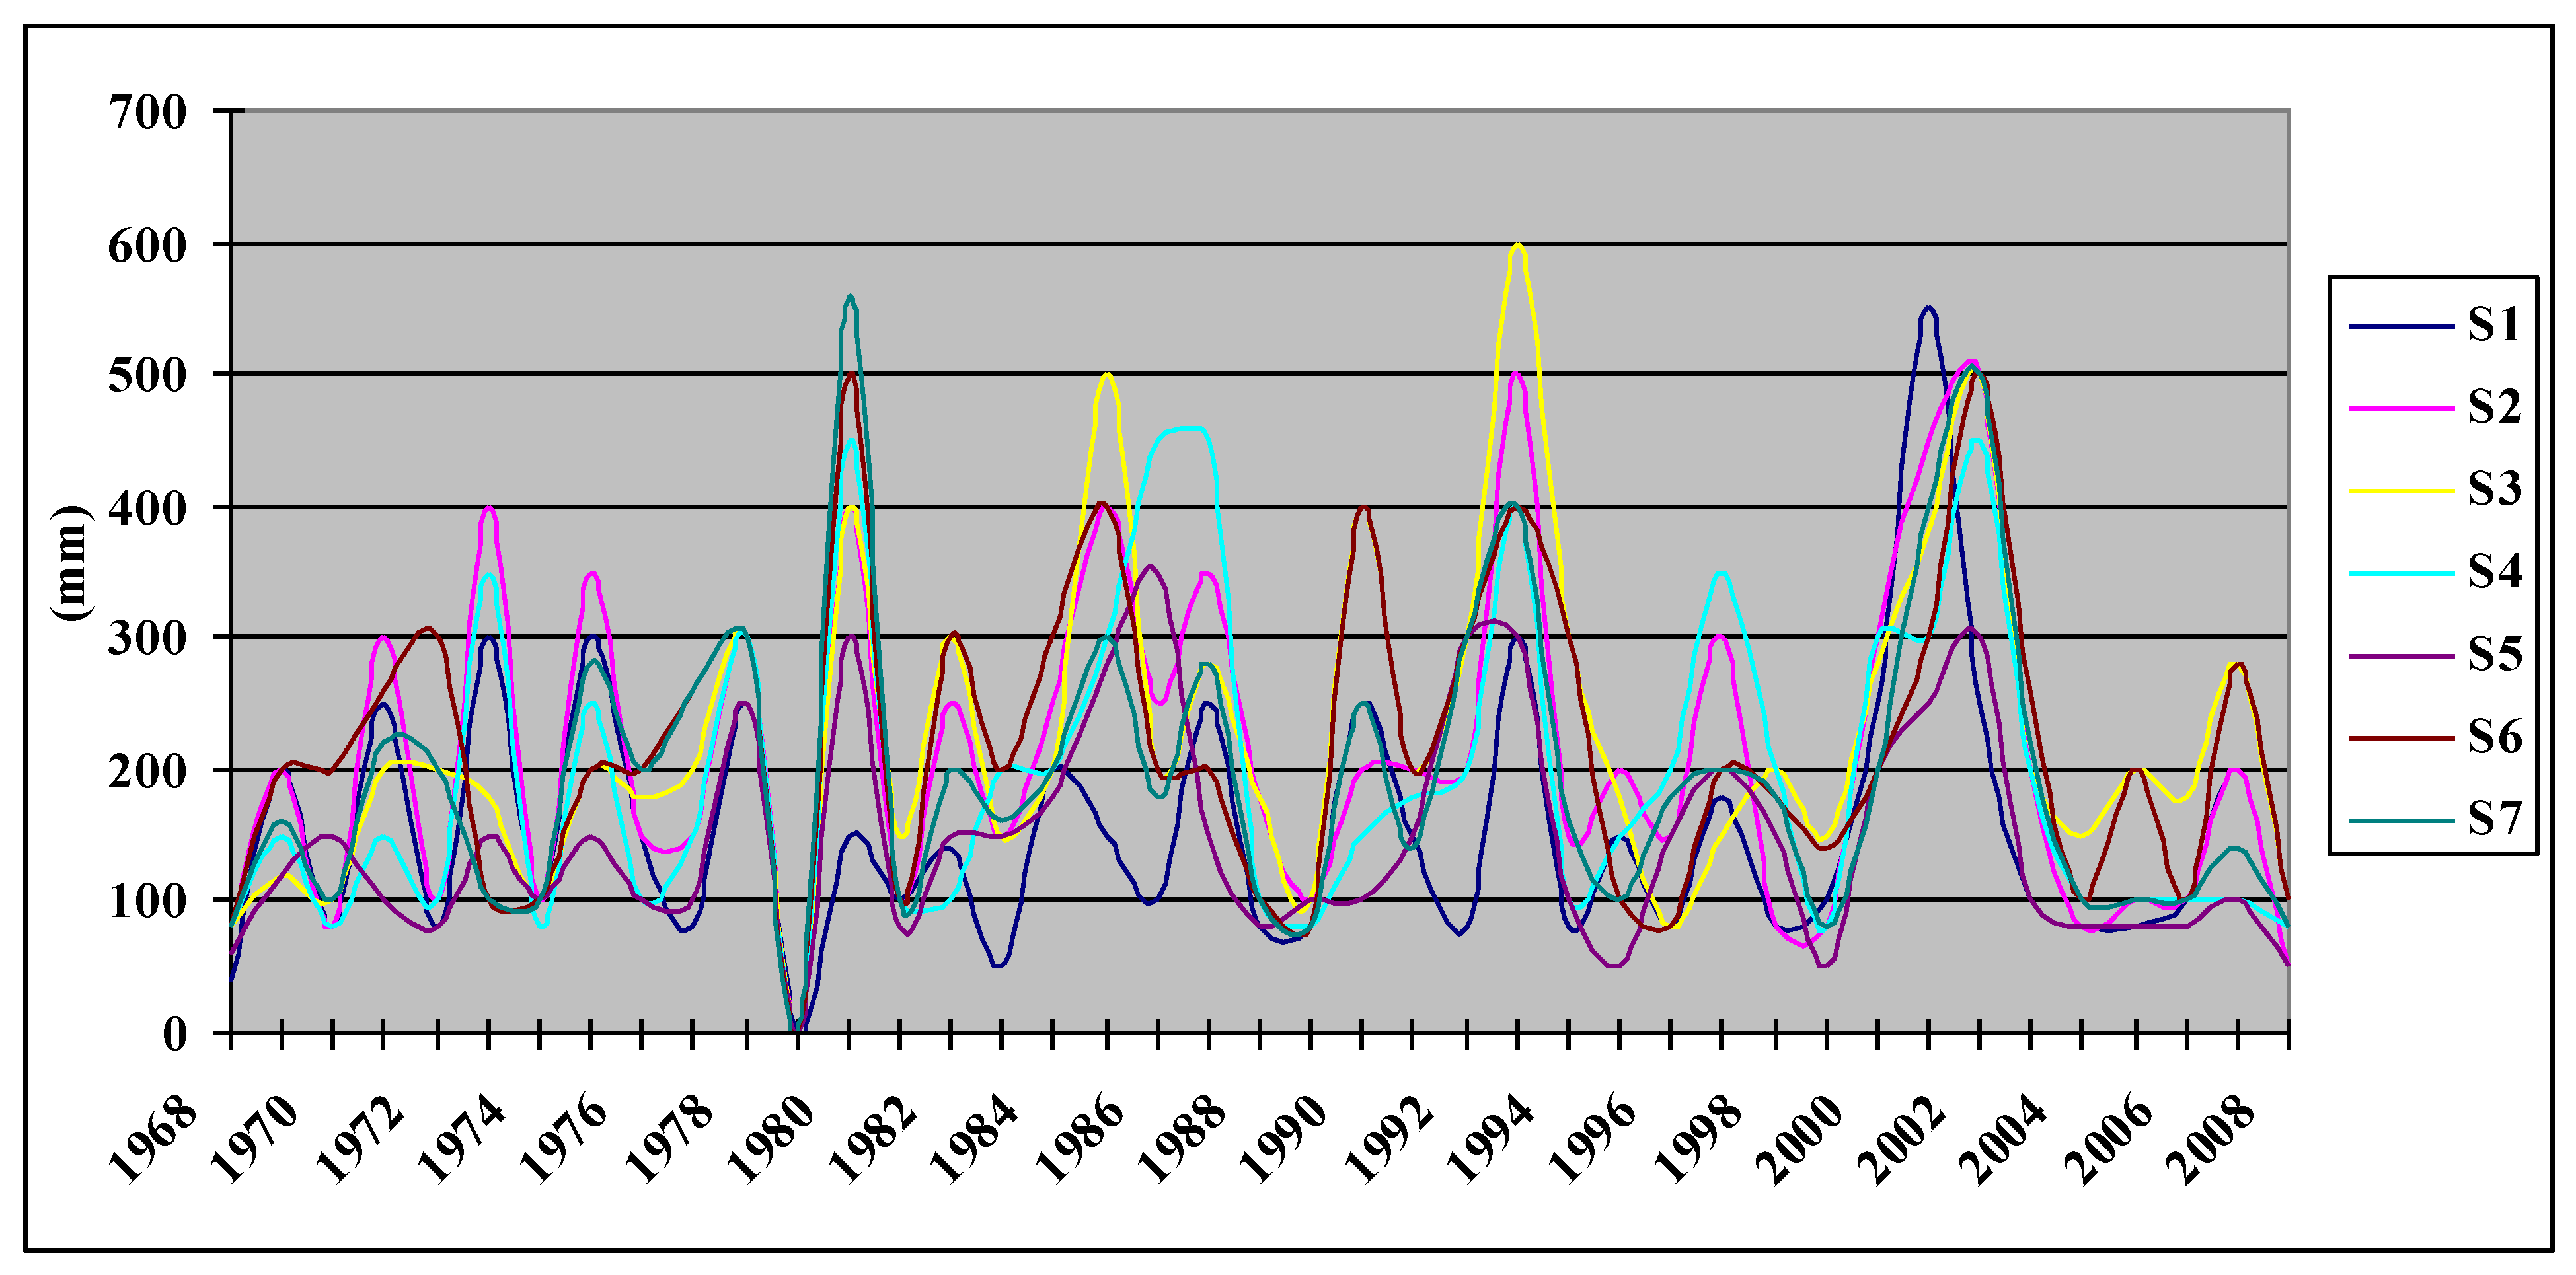
- 1968 to 1980: the values of sws were generally small;
- 1980 to 1995: in several years, the threshold of 300 mm was exceeded, including the two cases above mentioned;
- 1995 to 1999: only the second and fourth drainage areas exceeded 300 mm, in 1997;
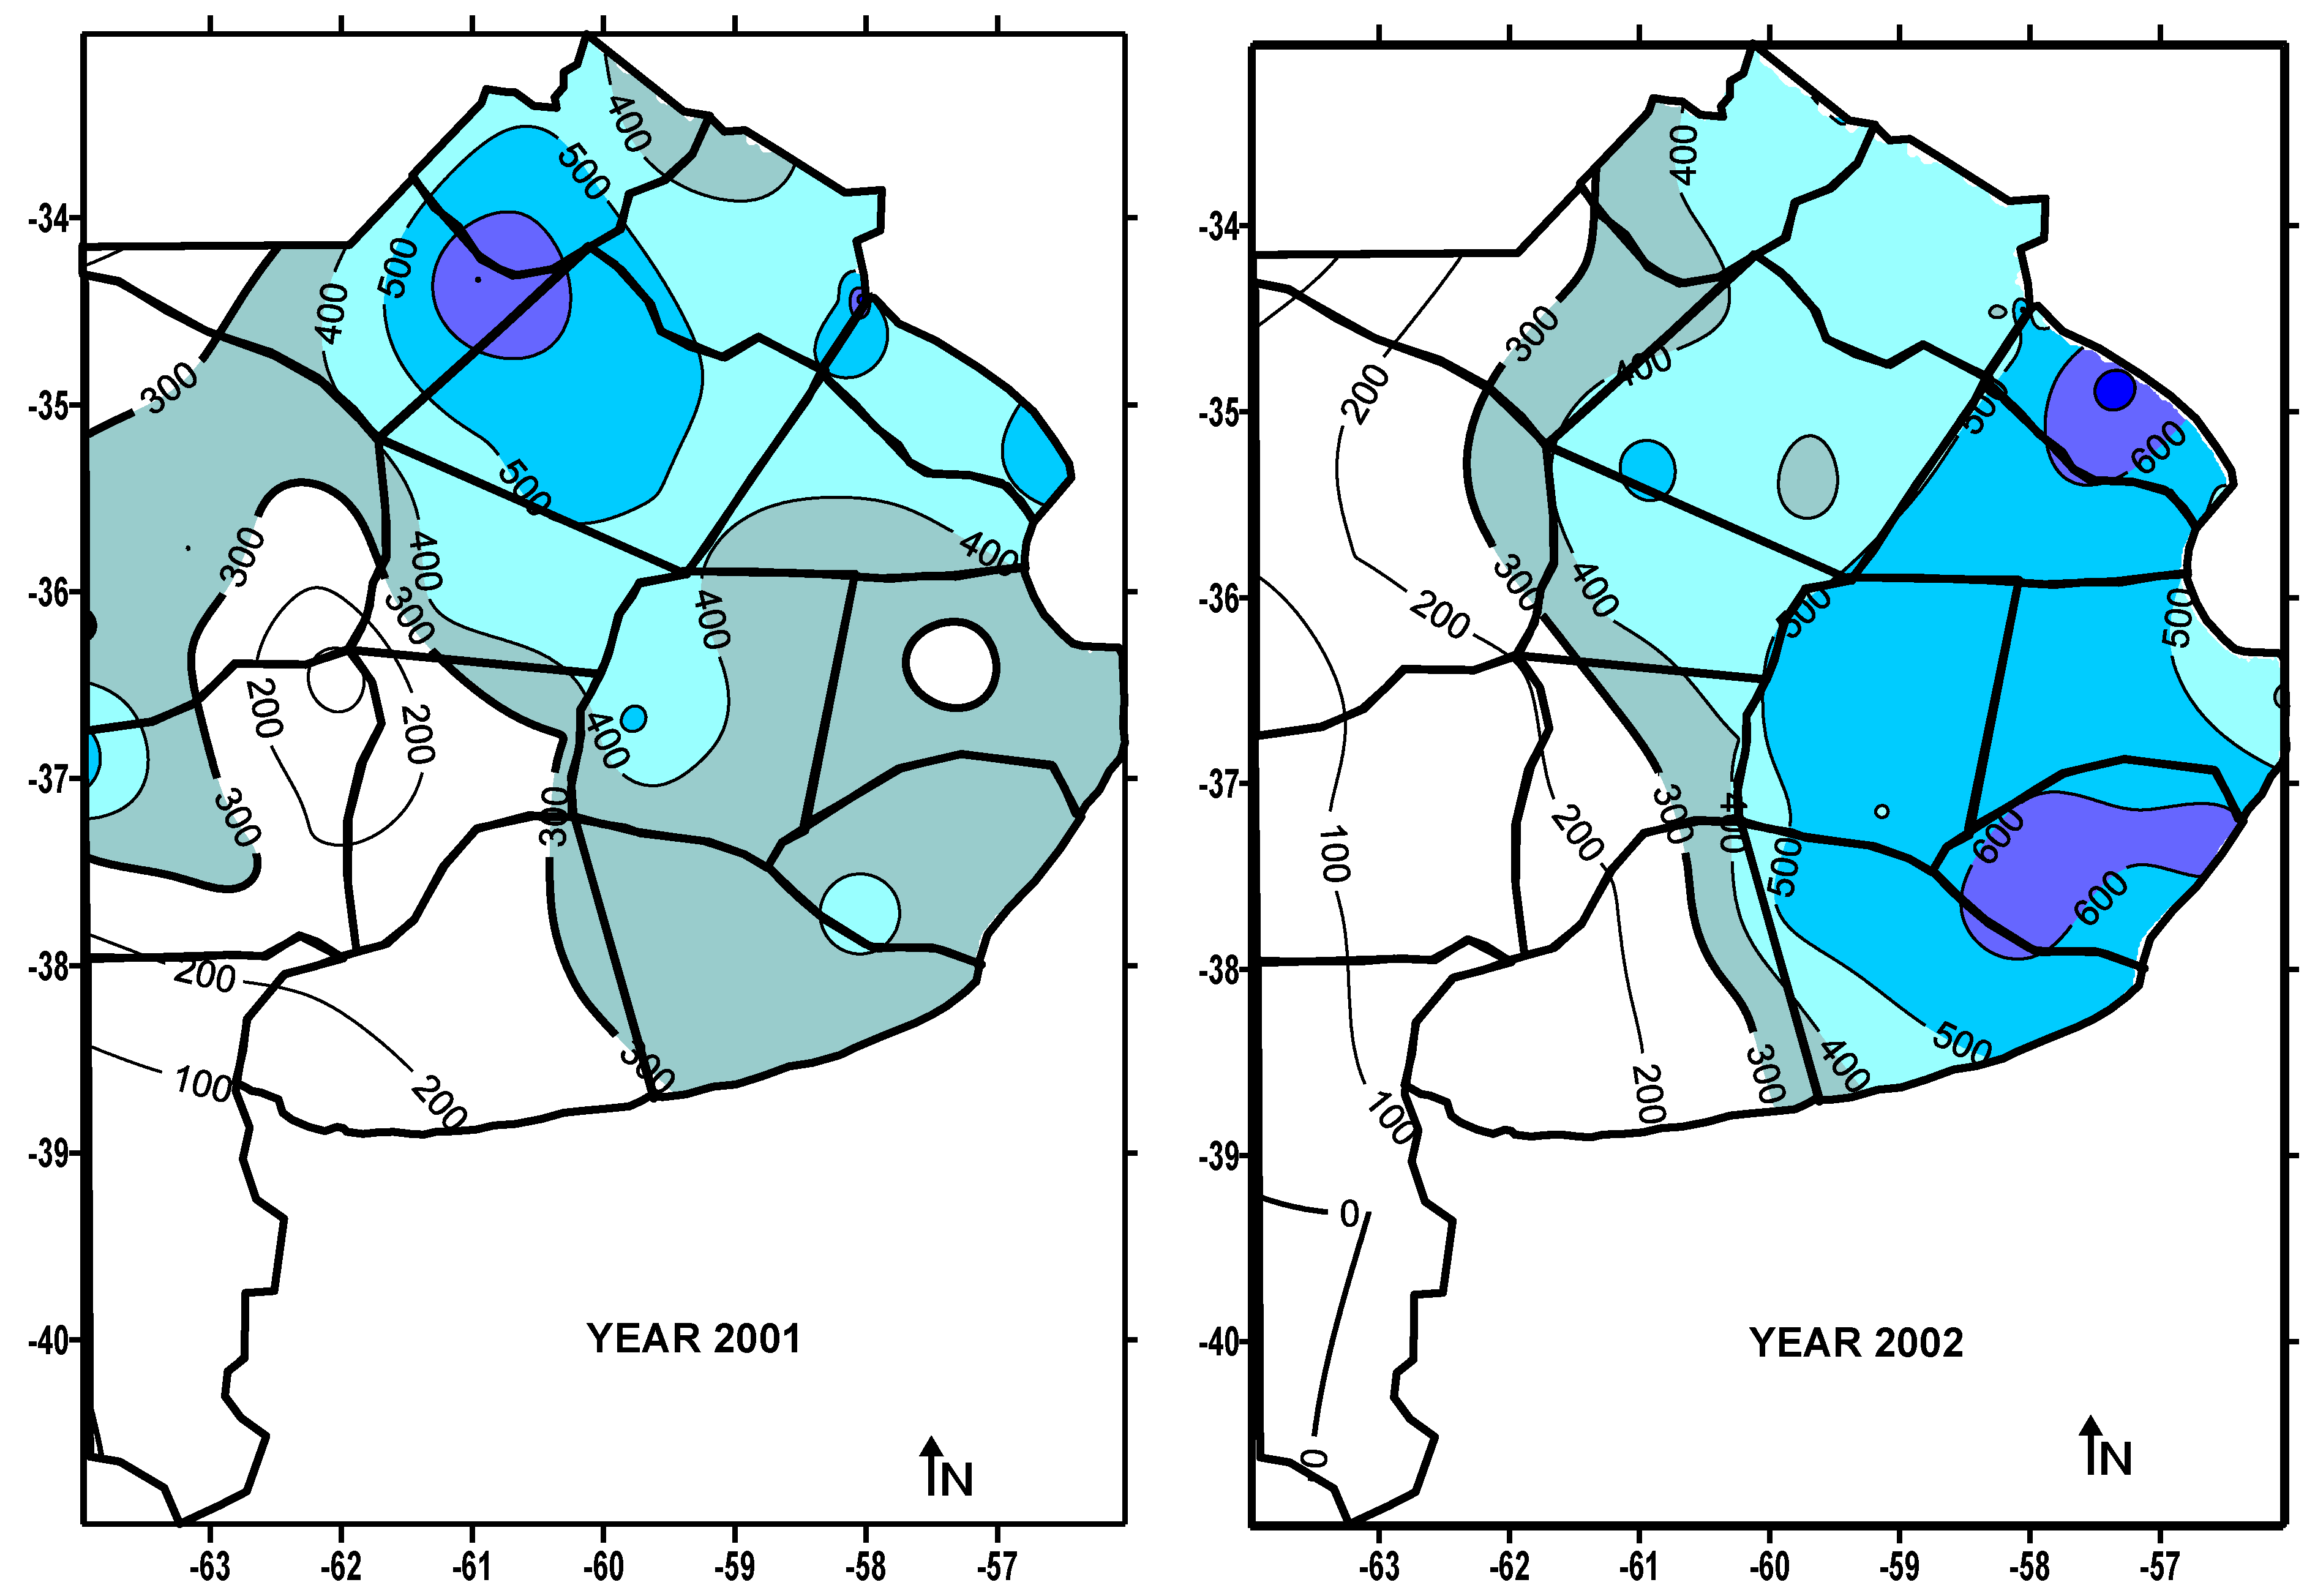
- 2000 to 2002: almost all drainage areas, except the fifth, showed large values;
- 2003 to 2008: the sws values never reached the 300 mm threshold, and are very similar to the first cycle.
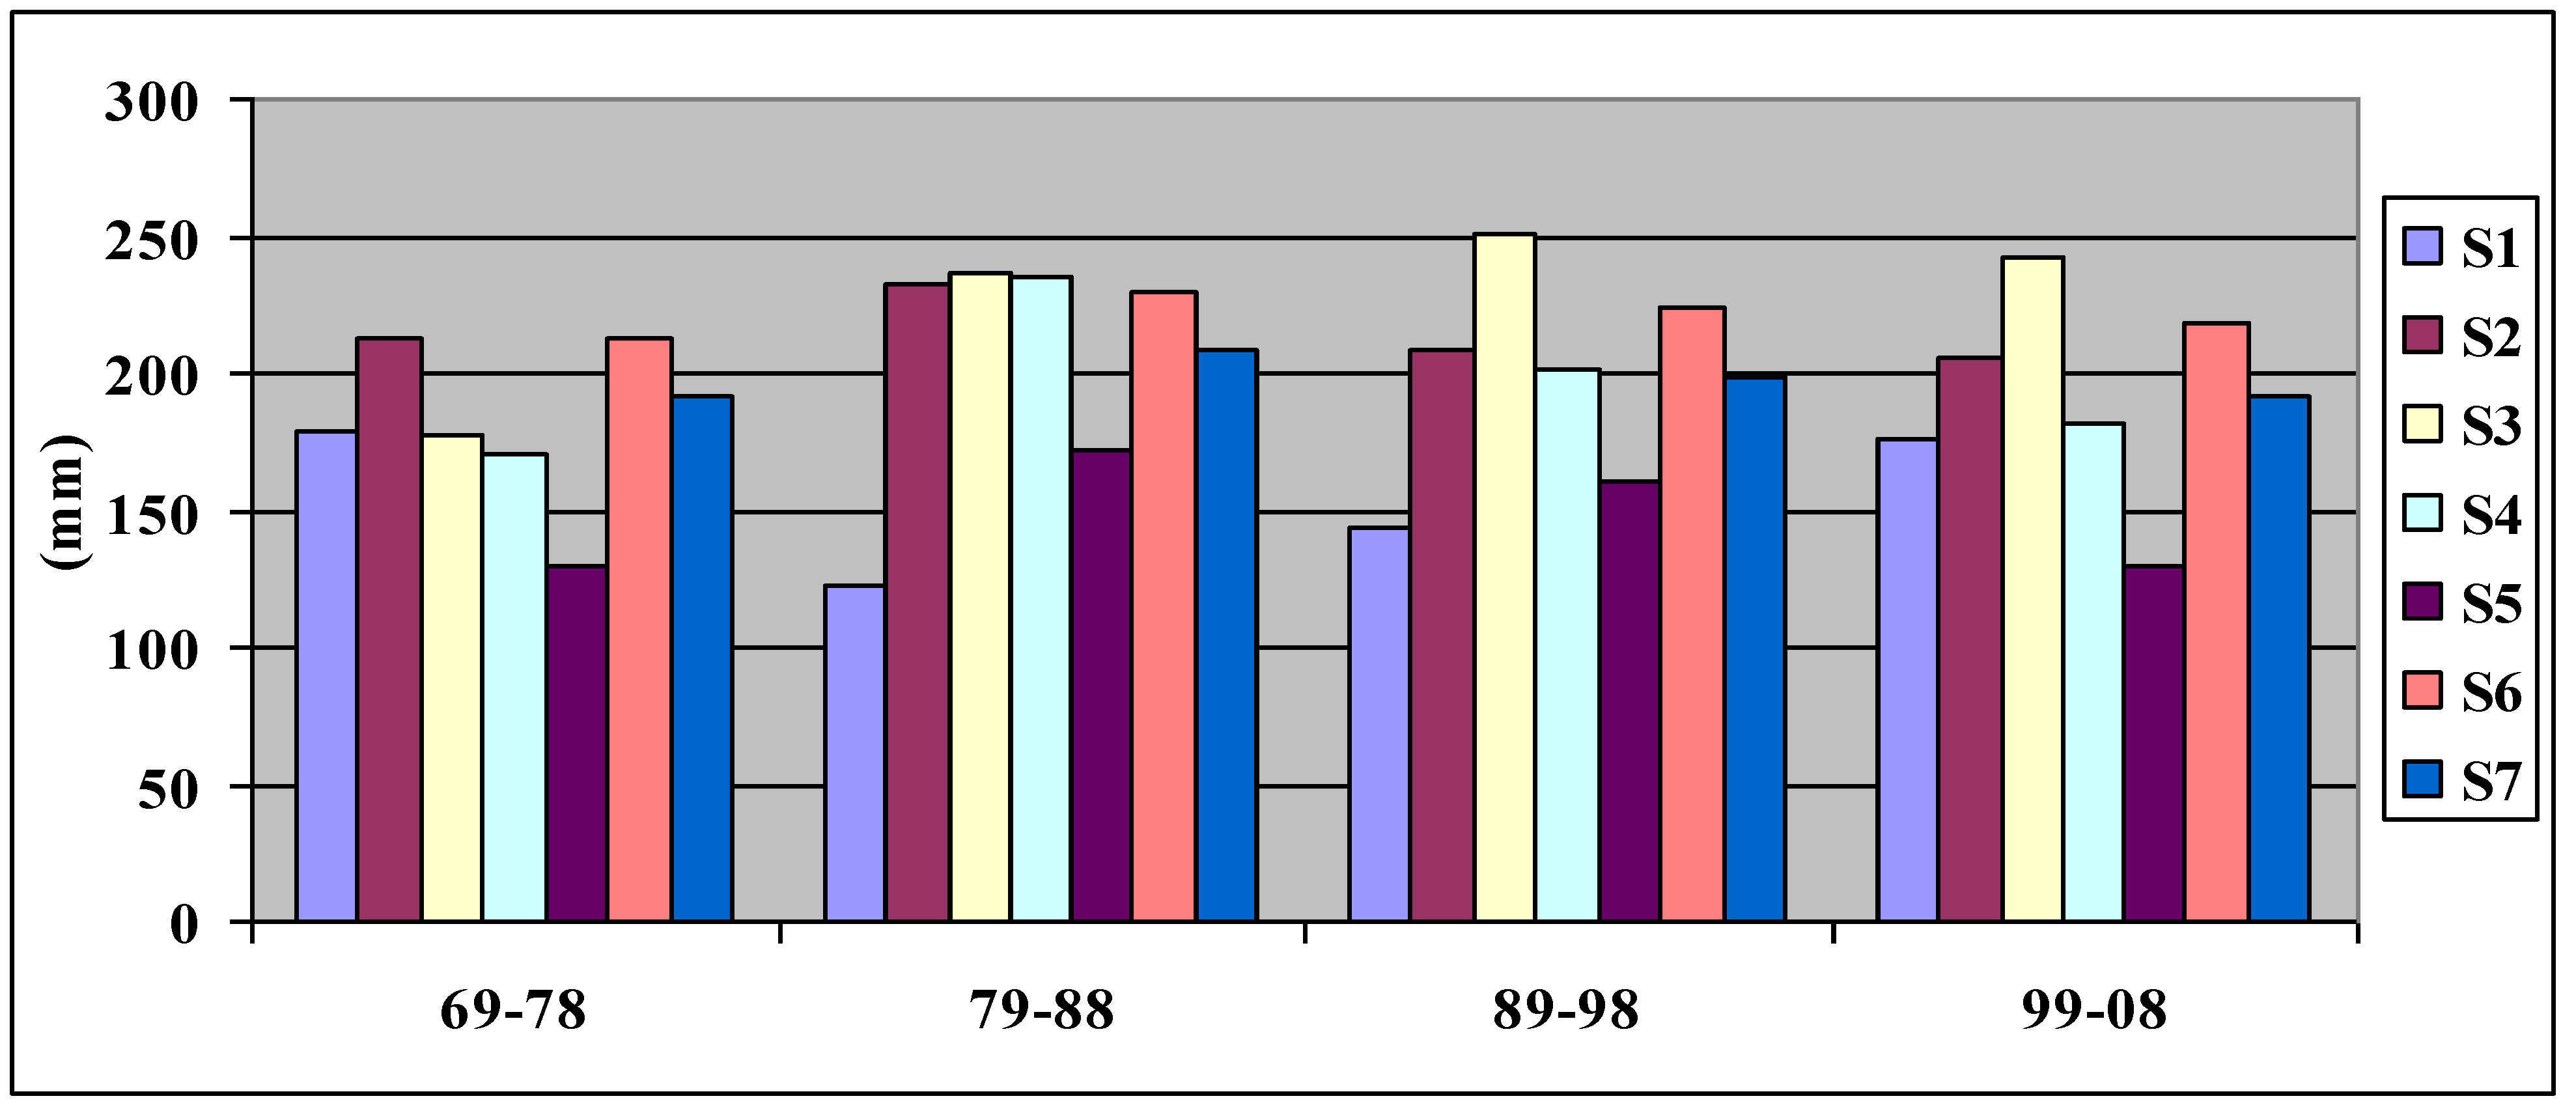
- S1 always shows values lower than 200 mm, and the minimum was observed during the second decade;
- S2 always shows values higher than 200 mm, and the maximum was observed during the second decade;
- S3 shows a high value during the second decade, but the maximum corresponds to the third;
- the maxima of S4 and S5 are recorded during the second decade, and high values are also observed in the third;
- S6 and S7 values show the smallest inter-decadal variations among all drainage areas.
| Year | Drainage area | |||||||
|---|---|---|---|---|---|---|---|---|
| S1 | S2 | S3 | S4 | S5 | S6 | S7 | N | |
| 1968 | 40 | 80 | 80 | 80 | 60 | 80 | 80 | |
| 1969 | 200 | 200 | 120 | 150 | 120 | 200 | 160 | |
| 1970 | 80 | 80 | 100 | 80 | 150 | 200 | 100 | |
| 1971 | 250 | 300 | 200 | 150 | 100 | 260 | 220 | |
| 1972 | 80 | 100 | 200 | 100 | 80 | 300 | 200 | |
| 1973 | 300 | 400 | 180 | 350 | 150 | 100 | 100 | 3 |
| 1974 | 100 | 100 | 100 | 80 | 100 | 100 | 100 | |
| 1975 | 300 | 350 | 200 | 250 | 150 | 200 | 280 | 2 |
| 1976 | 150 | 150 | 180 | 100 | 100 | 200 | 200 | |
| 1977 | 80 | 150 | 200 | 150 | 100 | 260 | 260 | |
| 1978 | 250 | 300 | 300 | 300 | 250 | 300 | 300 | 5 |
| 1979 | 0 | 0 | 0 | 0 | 0 | 0 | 0 | |
| 1980 | 150 | 400 | 400 | 450 | 300 | 500 | 560 | 6 |
| 1981 | 100 | 100 | 150 | 100 | 80 | 100 | 100 | |
| 1982 | 140 | 250 | 300 | 100 | 150 | 300 | 200 | 2 |
| 1983 | 50 | 150 | 150 | 200 | 150 | 200 | 160 | |
| 1984 | 200 | 250 | 200 | 200 | 180 | 300 | 200 | 1 |
| 1985 | 150 | 400 | 500 | 300 | 280 | 400 | 300 | 5 |
| 1986 | 100 | 250 | 200 | 450 | 350 | 200 | 180 | 2 |
| 1987 | 250 | 350 | 280 | 450 | 150 | 200 | 280 | 2 |
| 1988 | 80 | 180 | 180 | 100 | 80 | 100 | 100 | |
| 1989 | 80 | 100 | 100 | 80 | 100 | 80 | 80 | |
| 1990 | 250 | 200 | 400 | 150 | 100 | 400 | 250 | |
| 1991 | 150 | 200 | 200 | 180 | 150 | 200 | 140 | |
| 1992 | 80 | 200 | 300 | 200 | 300 | 300 | 300 | 4 |
| 1993 | 300 | 500 | 600 | 400 | 300 | 400 | 400 | 7 |
| 1994 | 80 | 150 | 300 | 100 | 100 | 300 | 160 | 2 |
| 1995 | 150 | 200 | 180 | 150 | 50 | 100 | 100 | |
| 1996 | 80 | 150 | 80 | 200 | 150 | 80 | 180 | |
| 1997 | 180 | 300 | 150 | 350 | 200 | 200 | 200 | 2 |
| 1998 | 80 | 80 | 200 | 200 | 150 | 180 | 180 | |
| 1999 | 100 | 80 | 150 | 80 | 50 | 140 | 80 | |
| 2000 | 250 | 300 | 280 | 300 | 200 | 200 | 200 | 2 |
| 2001 | 550 | 450 | 380 | 300 | 250 | 300 | 400 | 6 |
| 2002 | 250 | 500 | 500 | 450 | 300 | 500 | 500 | 6 |
| 2003 | 100 | 200 | 200 | 200 | 100 | 260 | 220 | |
| 2004 | 80 | 80 | 150 | 100 | 80 | 100 | 100 | |
| 2005 | 80 | 100 | 200 | 100 | 80 | 200 | 100 | |
| 2006 | 100 | 100 | 180 | 100 | 80 | 100 | 100 | |
| 2007 | 200 | 200 | 280 | 100 | 100 | 280 | 140 | |
| 2008 | 50 | 50 | 100 | 80 | 50 | 100 | 80 | |
| Events below 100 mm threshold | 19 | 13 | 7 | 16 | 20 | 12 | 13 | 100 |
| Events above 300 mm threshold | 4 | 12 | 10 | 11 | 5 | 12 | 6 | 60 |
| Mann-Kendall test for the trend | |||||
|---|---|---|---|---|---|
| Drainage area | N cases | Confidence Levels p = 95% | τ | Significance | |
| S1 | 41 | +0.213 | –0.213 | –0.015 | no |
| S2 | 41 | +0.213 | –0.213 | –0.020 | no |
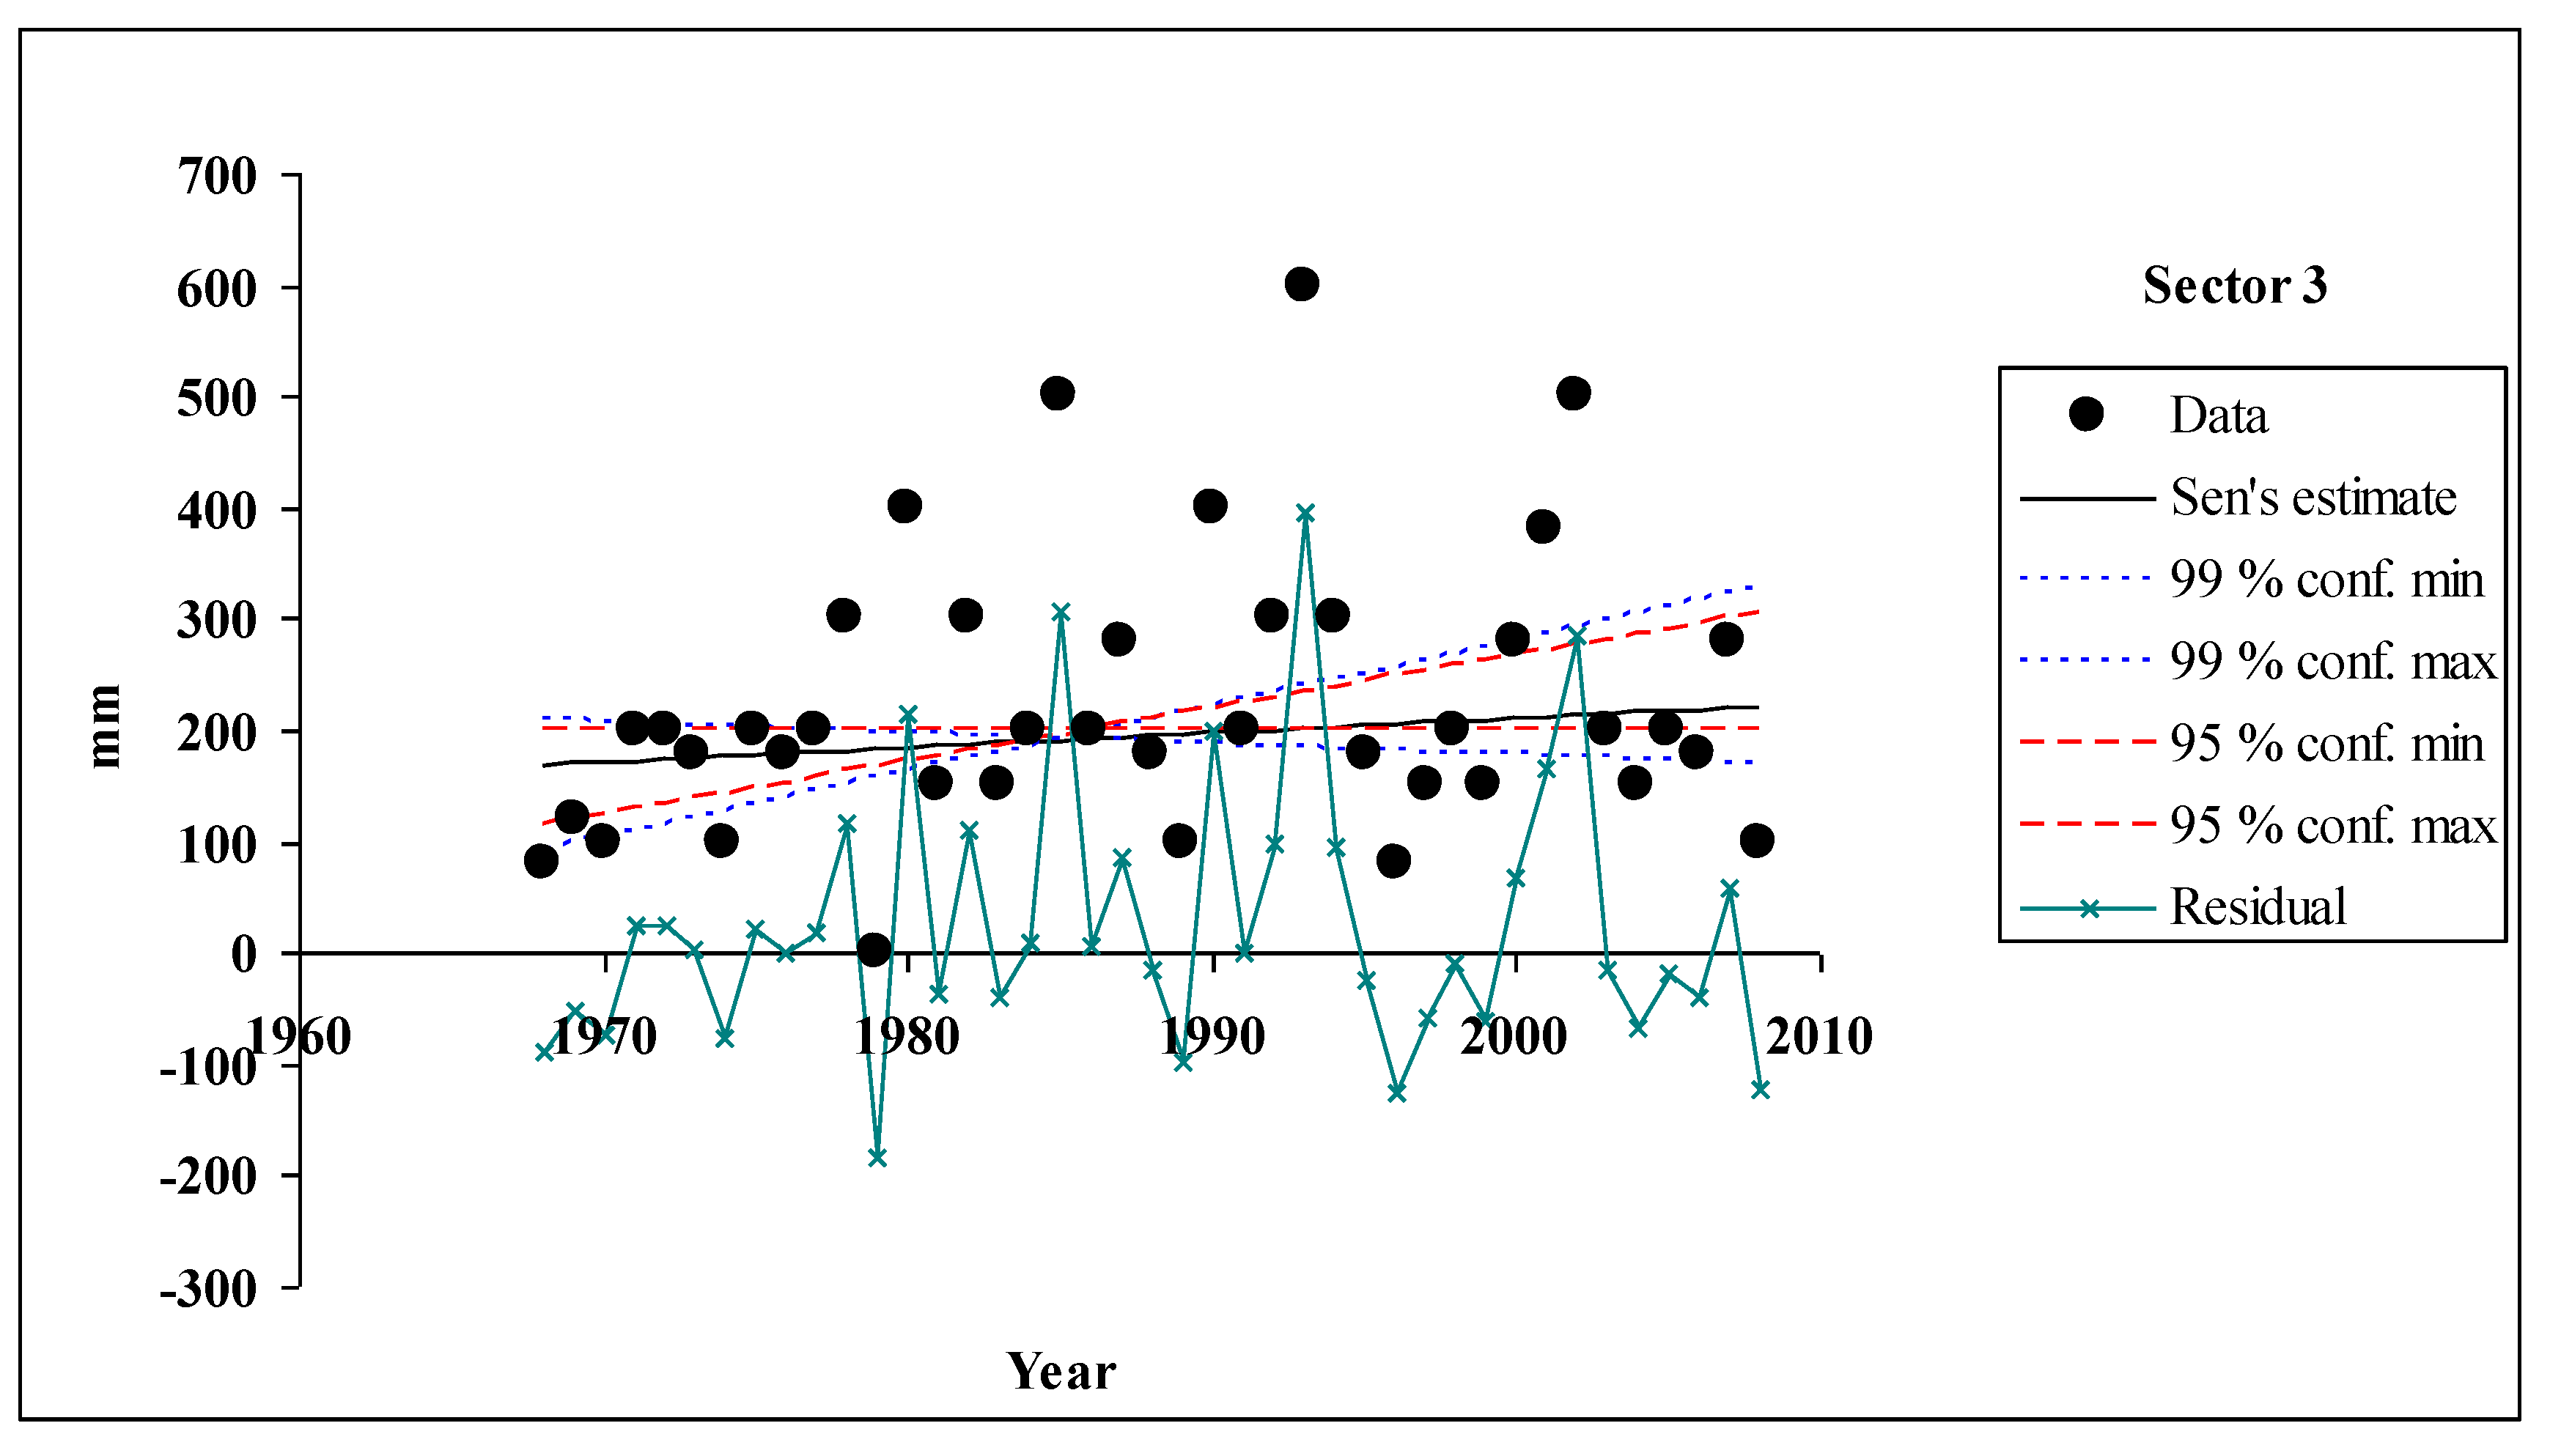
| S3 | 41 | +0.216 | –0.216 | +0.185 | yes |
| S4 | 41 | +0.213 | –0.213 | +0.061 | no |
| S5 | 41 | +0.213 | –0.213 | –0.010 | no |
| S6 | 41 | +0.213 | –0.213 | +0.010 | no |
| S7 | 41 | +0.213 | –0.213 | –0.015 | no |
| Name | S3 |
| Test Z | 1,27 |
| Significance | > 0.1 |
| Q | 1.32E + 00 |
| Qmin99 | –1.00E + 00 |
| Qmax99 | 5.88E + 00 |
| Qmin95 | 0.00E + 00 |
| Qmax95 | 4.76E + 00 |
| B | 1.70E + 02 |
| Bmin99 | 2.09E + 02 |
| Bmax99 | 9.18E + 01 |
| Bmin95 | 2.00E + 02 |
| Bmax95 | 1.14E + 02 |
4. Conclusions
References and Notes
- Forte Lay, J.A.; Quintela, R.M.; Scarpati, O.E. Variación de las características hidrometeorológicas de la llanura pampeana argentina. In Proceedings of the Memoria Encuentro Meteo 92 (Asociación Meteorológica Española), Salamanca and Cáceres, Spain, July 1992; Volume II, pp. 142–146.
- González, M.H.; Fernández, A.E. Floods increasing in Buenos Aires Salado River Basin. In Environmental Change and Rational Water Use; Scarpati, O.E., Jones, J.A.A., Eds.; International Geographical Unión: Buenos Aires, Argentina, 2007; pp. 96–113. [Google Scholar]
- Quintela, R.M.; Forte Lay, J.A.; Scarpati, O.E. Modification of the water resources characteristics of the Argentine’s Pampean subhumid-dry region. In Proceedings of the 19th Conference on Agricultural & Forest, 9th Conference on Biometeorology and Aerobiology (19th AGMET), Miami, FL, USA, July 1989. J-30-J-35.
- Castañeda, M.; Barros, V. Las tendencias de la precipitación en el cono sur de América al este de los Andes. Meteorológica 1994, 21, 23–32. [Google Scholar]
- Minetti, J.; Vargas, W. Trends and jumps in the annual precipitation en South America on the 15°S. Atmósfera 1997, 11, 204–221. [Google Scholar]
- Rusticucci, M.; Penalba, O. Interdecadal changes in the precipitation seasonal cycle over Southern South America and their relationship with surface temperature. Clim. Res. 2000, 16, 1–15. [Google Scholar] [CrossRef]
- Barros, V.; Gonzalez, M.; Liebmann, B.; Camilloni, I. Influence of the South Atlantic convergence zone and South Atlantic sea surface temperature on interannual summer rainfall variability in South-Eastern South America. Theor. Appl. Clim. 2000, 67, 123–133. [Google Scholar] [CrossRef]
- Kruse, E.; Forte Lay, J.A.; Aiello, J.L.; Basualdo, A.; Heinzenknecht, G. Hydrological processes on large flatlands: Case study in the northwest region of Buenos Aires Province (Argentina). IAHS 2001, 267, 531–535. [Google Scholar]
- Scarpati, O.E.; Forte Lay, J.A.; Capriolo, A.D. Soil water surplus and ENSO events during the last humid period in Argentine Pampean Flatlands. Int. J. Water. 2009, 5, 181–193. [Google Scholar] [CrossRef]
- Forte Lay, J.A.; Spescha, L.B. Método para la estimación de la climatología del agua edáfica en las provincias pampeanas de la Argentina. RADA 2001, 1, 67–75. [Google Scholar]
- Forte Lay, J.A.; Scarpati, O.E.; Spescha, L.B.; Capriolo, A.D. Drought risk in the pampean region using soil water storage analysis. In Environmental Change and Rational Water Use; Scarpati, O.E., Jones, J.A.A., Eds.; International Geographical Unión: Buenos Aires, Argentina, 2007; pp. 146–168. [Google Scholar]
- Forte Lay, J.A.; Scarpati, O.E.; Capriolo, A.D. Precipitation variability and soil water content in pampean flatlands (Argentina). Geofísica Inter. 2008, 47, 341–354. [Google Scholar]
- Allen, R.G.; Pereira, L.S.; Raes, D.; Smith, M. Irrigation and drainage. In Crop Evapotranspiration—Guidelines for Computing Crop Water Requirements; FAO: Rome, Italy, 2004; Paper 56; p. 301. [Google Scholar]
- Atlas digital de los recursos hídricos superficiales de la República Argentina; National Water Resources: Buenos Aires, Argentina, 2002; Available online: http://www.hidricosargentina.gov.ar/CartAct.html#1 (accessed on 18 January 2011).
- Salmi, T.; Mata, A.; Anttila, P.; Ruoho-Airola, T.; Amnell, T. Detecting Trends of Annual Values of Atmospheric Pollutants by the Mann-Kendall Test and Sen’s Slope Estimates—The Excel Template Application MAKESENS. In Publications on Air Quality; Ilmatieteen laitos Meteorologiska Institutet, Finnish Meteorological Institute Painopaikka: Edita Oyj, Helsinki, Finland, 2002. [Google Scholar]
- Liu, S.; Mo, X.; Zhao, W.; Naeimi, V.; Dai, D.; Shu, C.; Mao, L. Temporal variation of soil moisture over the Wuding River basin assessed with an eco-hydrological model, in-situ observations and remote sensing. Hydrol. Earth Syst. Sci. 2009, 13, 1375–1398. [Google Scholar] [CrossRef]
- Scarpati, O.E.; Spescha, L.B.; Capriolo, A.D. The impact of the heavy floods in the Salado River basin, Buenos Aires province, Argentina. Mitigation Adaptation Strateg. Glob. Change 2002, 7, 285–301. [Google Scholar] [CrossRef]
- Scarpati, O.E.; Forte Lay, J.A.; Fernandez Long, M.E.; Capriolo, A.D. ENSO influence on soil water balance and temperature in pampean flatlands (Argentina) with special analysis to San Pedro area. In Environmental Change and Rational Water Use; Scarpati, O.E., Jones, J.A.A., Eds.; International Geographical Unión: Buenos Aires, Argentina, 2007; pp. 169–183. [Google Scholar]
© 2011 by the authors; licensee MDPI, Basel, Switzerland. This article is an open access article distributed under the terms and conditions of the Creative Commons Attribution license (http://creativecommons.org/licenses/by/3.0/).
Share and Cite
Scarpati, O.E.; Spescha, L.B.; Lay, J.A.F.; Capriolo, A.D. Soil Water Surplus in Salado River Basin and Its Variability during the Last Forty Years (Buenos Aires Province, Argentina). Water 2011, 3, 132-145. https://doi.org/10.3390/w3010132
Scarpati OE, Spescha LB, Lay JAF, Capriolo AD. Soil Water Surplus in Salado River Basin and Its Variability during the Last Forty Years (Buenos Aires Province, Argentina). Water. 2011; 3(1):132-145. https://doi.org/10.3390/w3010132
Chicago/Turabian StyleScarpati, Olga Eugenia, Liliana Beatriz Spescha, Juan Alberto Forte Lay, and Alberto Daniel Capriolo. 2011. "Soil Water Surplus in Salado River Basin and Its Variability during the Last Forty Years (Buenos Aires Province, Argentina)" Water 3, no. 1: 132-145. https://doi.org/10.3390/w3010132
APA StyleScarpati, O. E., Spescha, L. B., Lay, J. A. F., & Capriolo, A. D. (2011). Soil Water Surplus in Salado River Basin and Its Variability during the Last Forty Years (Buenos Aires Province, Argentina). Water, 3(1), 132-145. https://doi.org/10.3390/w3010132