
Unraveling Zooplankton Trophic Dynamics: Insights from Stable Isotope Analysis in the Eastern Mediterranean (Aegean, Cretan and Ionian Seas)


Abstract
1. Introduction
2. Materials and Methods
2.1. Sample Collection
2.2. Dry Weight Biomass
2.3. Microscopic Analyses
2.4. Stable Isotopes
2.5. Data Treatment and Statistical Analysis
3. Results
3.1. Zooplankton Abundance and Biomass Distribution
3.2. Mesozooplankton Community Composition and Distribution
3.3. Stable Isotopic Composition of Prominent Zooplankton Taxa
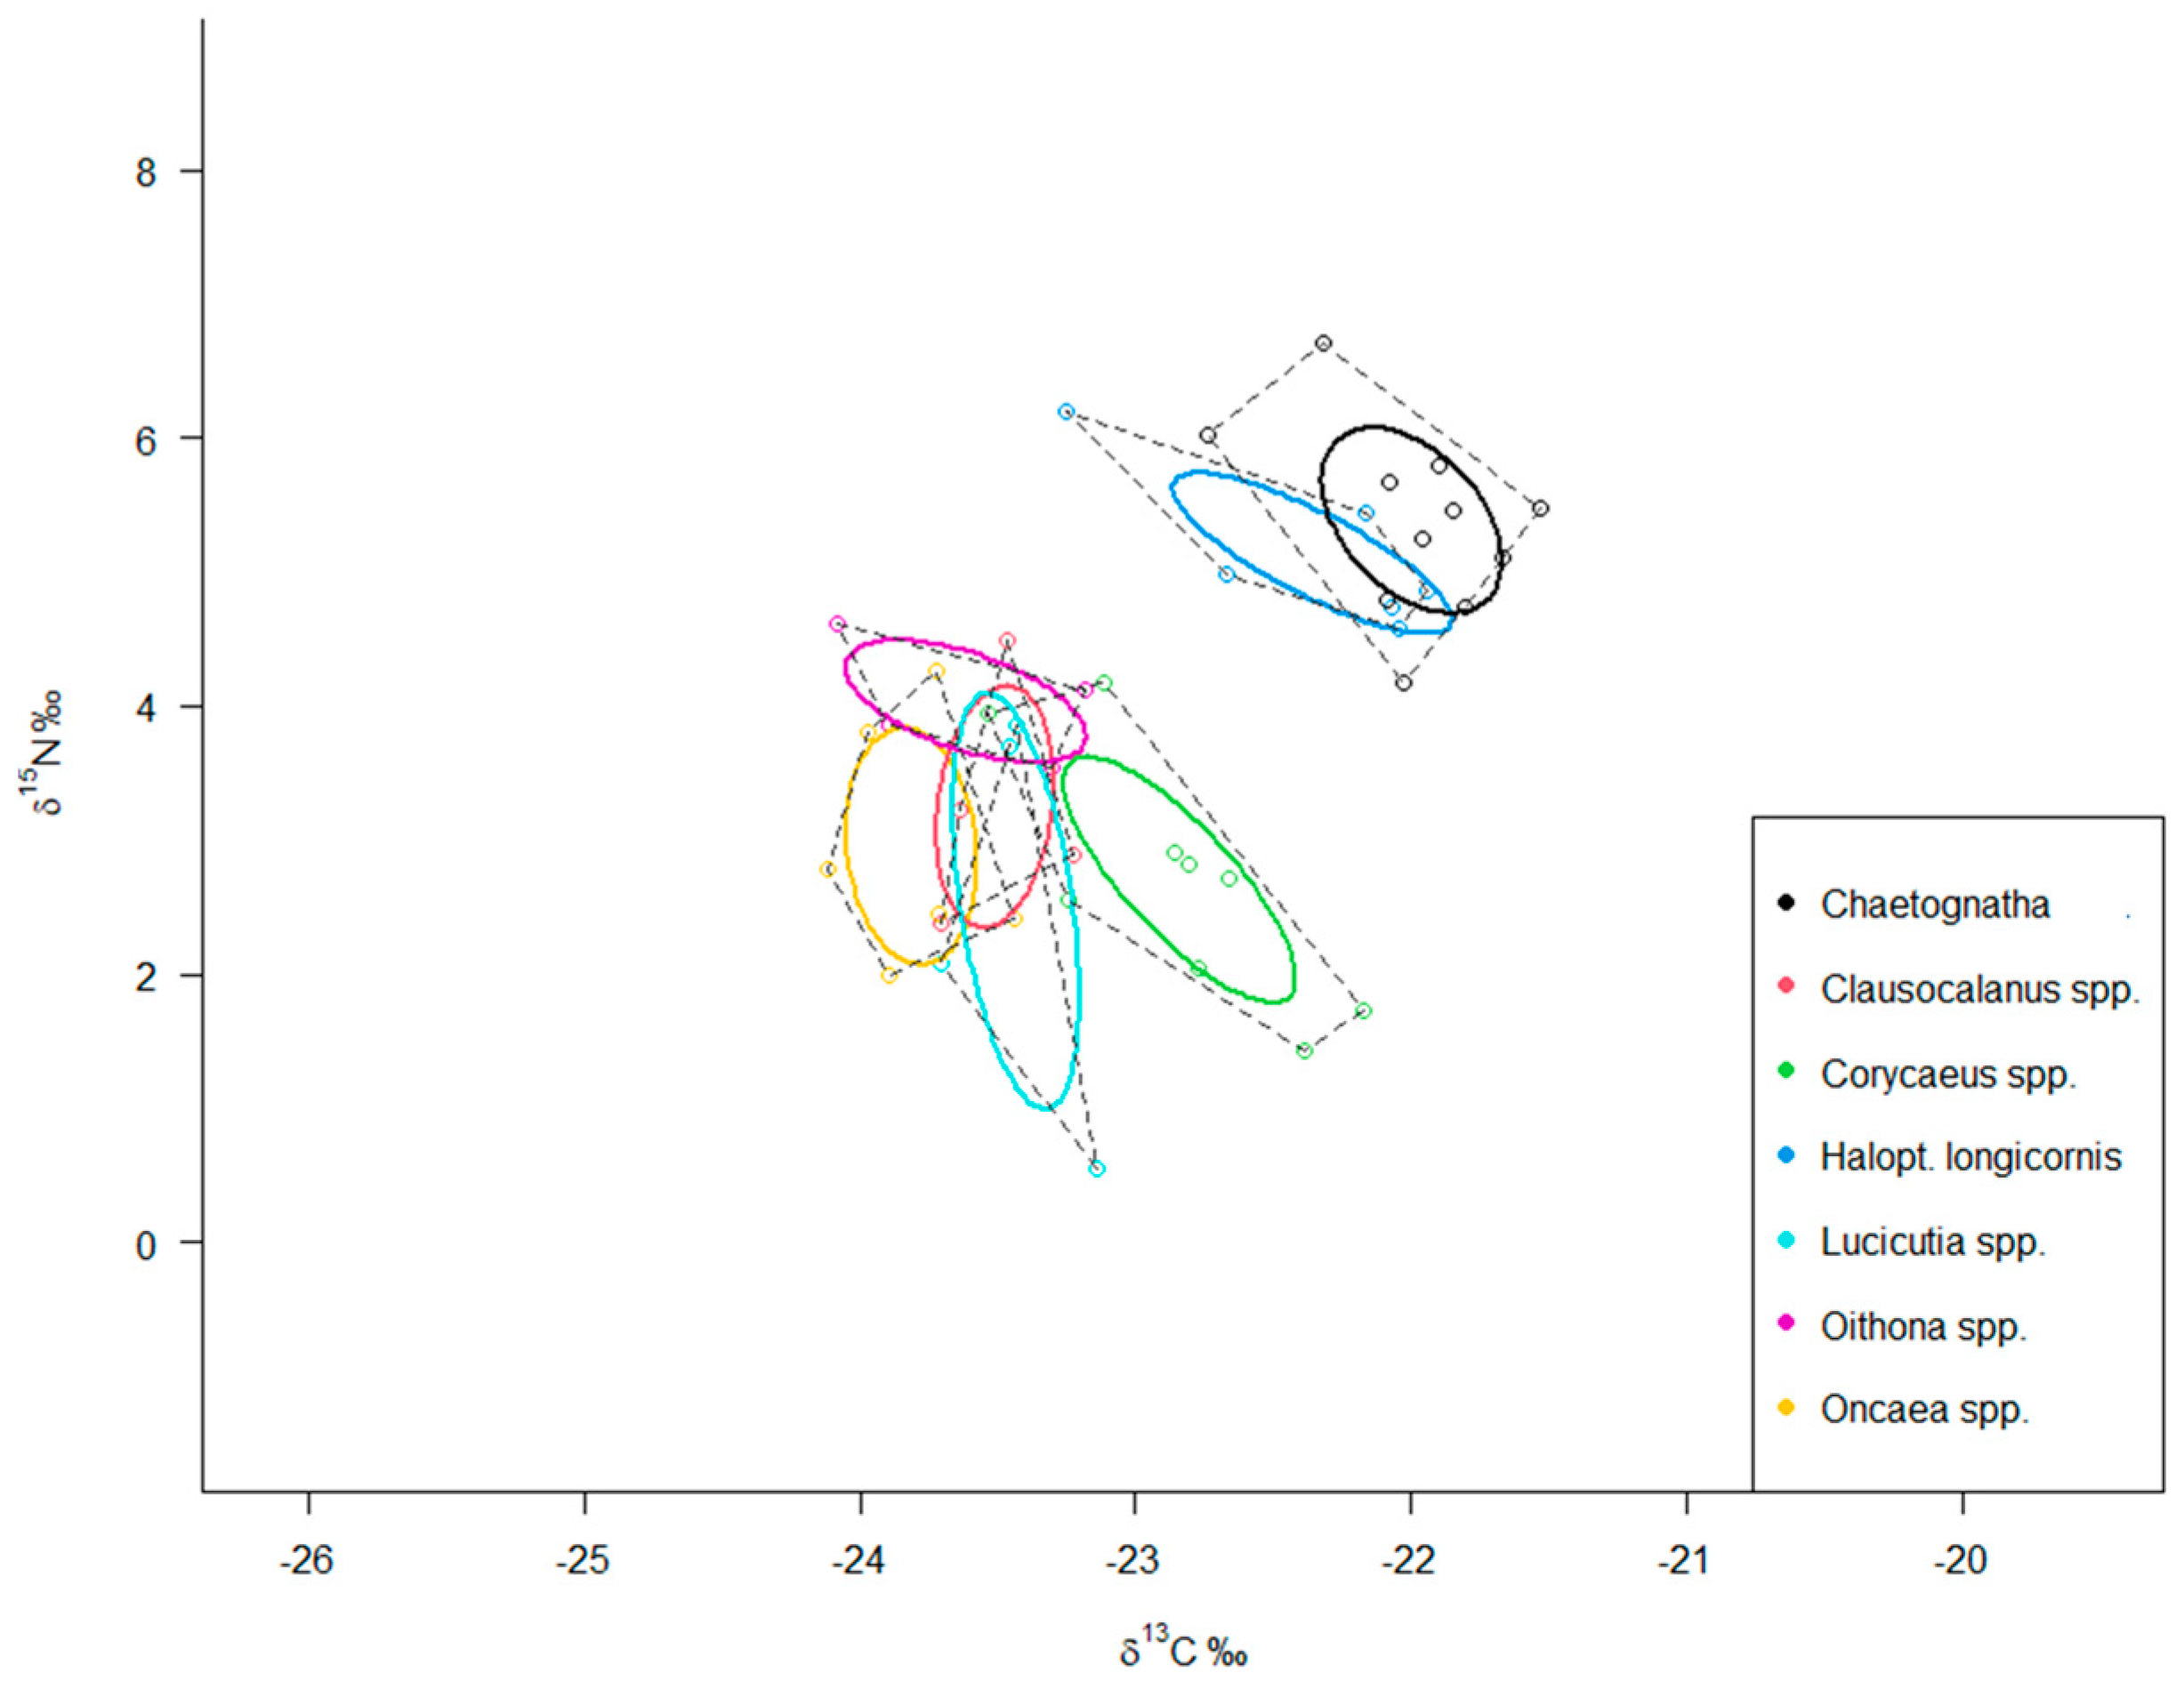
3.4. Isotopic Niche Analysis
4. Discussion
5. Conclusions
Author Contributions
Funding
Data Availability Statement
Acknowledgments
Conflicts of Interest
References
- Boecklen, W.J.; Yarnes, C.T.; Cook, B.A. On the Use of Stable Isotopes in Trophic Ecology. Annu. Rev. Ecol. Evol. Syst. 2011, 42, 411–440. [Google Scholar] [CrossRef]
- Fry, B. Stable Isotope Ecology; Springer: New York, NY, USA, 2006; Volume 521. [Google Scholar]
- Rundel, P.W.; Ehleringer, J.R.; Nagy, K.A. (Eds.) Stable Isotopes in Ecological Research; Springer: New York, NY, USA, 1989; p. 544. [Google Scholar]
- Pantoja, S.; Repeta, D.J.; Sachs, J.P.; Sigman, D.M. Stable isotope constraints on the nitrogen cycle of the Mediterranean Sea water column. Deep-Sea Res. Part I 2002, 49, 1609–1621. [Google Scholar] [CrossRef]
- Koppelmann, R.; Halsband-Lenk, C.; Weikert, H. The Stable Isotope Signature of Mesozooplankton in the Levantine Sea (Eastern Mediterranean). In Oceanography of Eastern Mediterranean and Black Sea; Yilmaz, A., Ed.; TUBITAK: Ankara, Türkiye, 2003; pp. 814–820. [Google Scholar]
- Koppelmann, R.; Weikert, H.; Lahajnar, N. Vertical distribution of mesozooplankton and its δ15N signature at a deep-sea site in the Levantine Sea (eastern Mediterranean) in April 1999. J. Geophys. Res. 2003, 108, 8118. [Google Scholar] [CrossRef]
- Sachs, J.P.; Repeta, D.J. Oligotrophy and nitrogen fixation during eastern Mediterranean sapropel events. Science 1999, 286, 2485–2488. [Google Scholar] [CrossRef]
- Krom, M.D.; Herut, B.; Mantoura, R.F.C. Nutrient budget for the Eastern Mediterranean: Implications for phosphorus limitation. Limnol. Oceanogr. 2004, 49, 1582–1592. [Google Scholar] [CrossRef]
- Koppelmann, R.; Böttger-Schnack, R.; Möbius, J.; Weikert, H. Trophic relationships of zooplankton in the eastern Mediterranean based on stable isotope measurements. J. Plankton Res. 2009, 31, 669–686. [Google Scholar] [CrossRef]
- Redfield, A.; Ketchum, B.; Richards, F. The Influence of Organisms on the Composition of Sea Water. In The Sea 2; Hill, M.N., Ed.; Wiley-Interscience: New York, NY, USA, 1963; pp. 26–77. [Google Scholar]
- Berman, T.; Townsend, D.W.; El Sayed, S.Z.; Trees, C.C.; Azov, Y. Optical transparency, chlorophyll and primary productivity in the Eastern Mediterranean near the Israeli coast. Oceanol. Acta 1984, 7, 367–372. [Google Scholar]
- Yacobi, Y.Z.; Zohary, T.; Kress, N.; Hecht, A.; Robarts, R.D.; Waiser, M.; Wood, A.M.; Li, W.K.W. Chlorophyll distribution throughout the southeastern Mediterranean in relation to the physical structure of the water mass. J. Mar. Syst. 1995, 6, 179–190. [Google Scholar] [CrossRef]
- Krom, M.D.; Kress, N.; Brenner, S.; Gordon, L.I. Phosphorus limitation of primary productivity in the Eastern Mediterranean. Limnol. Oceanogr. 1991, 36, 424–432. [Google Scholar] [CrossRef]
- Krom, M.D.; Brenner, S.; Kress, N.; Neori, A.; Gordon, L.I. Nutrient dynamics and new production in a warm core eddy from the Eastern Mediterranean. Deep-Sea Res. 1992, 39, 467–480. [Google Scholar] [CrossRef]
- Ignateadis, L.; Vounatsou, P.; Karydis, M. A possible method for evaluating oligotrophy and eutrophication based on nutrient concentration scales. Mar. Poll. Bull. 1992, 24, 238–243. [Google Scholar] [CrossRef]
- Calbet, A.; Landry, M.R. Mesozooplankton influences on the microbial food web: Direct and indirect trophic interactions in the oligotrophic open ocean. Limnol. Oceanogr. 1999, 44, 1370–1380. [Google Scholar] [CrossRef]
- Gaudy, R.; Youssara, F.; Diaz, F.; Raimbault, P. Biomass, metabolism and nutrition of zooplankton in the Gulf of Lions (NW Mediterranean). Oceanol. Acta 2003, 26, 357–372. [Google Scholar] [CrossRef]
- Siokou-Frangou, I.; Christaki, U.; Mazzocchi, M.G.; Montresor, M.; Ribera D’Alcala, M.; Vaque, D.; Zingone, A. Plankton in the open mediterranean Sea: A review. Biogeosciences 2010, 7, 1543–1586. [Google Scholar] [CrossRef]
- Kleppel, G.S. On the diets of calanoid copepods. Mar. Ecol. Prog. Ser. 1993, 99, 183–195. [Google Scholar] [CrossRef]
- Calbet, A.; Saiz, E. The ciliate–copepod link in marine ecosystems. Aquat. Microb. Ecol. 2005, 38, 157–167. [Google Scholar] [CrossRef]
- Zervoudaki, S.; Nielsen, T.G.; Christou, E.D.; Siokou-Frangou, I. Zooplankton distribution and diversity in a frontal area of the Aegean Sea. Mar. Biol. Res. 2006, 2, 149–168. [Google Scholar] [CrossRef]
- Richmond, E.C.; Wethey, D.S.; Woodin, S.A. Climate change and increased environmental variability: Demographic responses in an estuarine harpacticoid copepod. Ecol. Model. 2007, 209, 189–202. [Google Scholar] [CrossRef]
- Pavlidou, A.; Velaoras, D.; Karageorgis, A.P.; Rousselaki, E.; Parinos, C.; Dähnke, K.; Möbius, J.; Meador, T.B.; Psarra, S.; Frangoulis, C.; et al. Seasonal variations of biochemical and optical properties, physical dynamics and N stable isotopic composition in three northeastern Mediterranean basins (Aegean, Cretan and Ionian Seas). Deep. Sea Res. Part II Top. Stud. Oceanogr. 2020, 171, 104704. [Google Scholar] [CrossRef]
- Zervakis, V.; Georgopoulos, D. Hydrology and circulation in the North Aegean (eastern Mediterranean) throughout 1997 and 1998. Mediterr. Mar. Sci. 2002, 3, 5–19. [Google Scholar] [CrossRef]
- Velaoras, D.; Krokos, G.; Theocharis, A. Recurrent intrusions of transitional waters of Eastern Mediterranean origin in the Cretan Sea as a tracer of Aegean Sea dense water formation events. Prog. Oceanogr. 2015, 135, 113–212. [Google Scholar] [CrossRef]
- Bensi, M.; Velaoras, D.; Meccia, V.L.; Cardin, V. Effects of the Eastern Mediterranean Sea circulation on the thermohaline properties as recorded by fixed deep-ocean observatories. Deep. Sea Res. Part I Oceanogr. Res. Pap. 2016, 112, 1–13. [Google Scholar] [CrossRef]
- Protopapa, M.; Koppelmann, R.; Zervoudaki, S.; Wunsch, C.; Peters, J.; Parinos, C.; Paraschos, F.; Gogou, A.; Möllmann, C. Trophic positioning of prominent copepods in the epi- and mesopelagic zone of the ultra-oligotrophic eastern Mediterranean Sea. Deep-Sea Res. Part II Top. Stud. Oceanogr. 2019, 164, 144–155. [Google Scholar] [CrossRef]
- Hannides, C.C.S.; Zervoudaki, S.; Frangoulis, C.; Lange, M.A. Mesozooplankton stable isotope composition in Cyprus coastal waters and comparison with the Aegean Sea (eastern Mediterranean). Estuar. Coast Shelf Sci. 2015, 154, 12–18. [Google Scholar] [CrossRef]
- Zervakis, V.; Georgopoulos, D.; Drakopoulos, P.G. The role of the North Aegean in triggering the recent Eastern Mediterranean climatic changes. J. Geophys. Res. 2000, 105, 26103–26126. [Google Scholar] [CrossRef]
- Velaoras, D.; Krokos, G.; Nittis, K.; Theocharis, A. Dense intermediate water outflow from the Cretan Sea: A salinity driven, recurrent phenomenon, connected to thermohaline circulation changes. J. Geophys. Res. Oceans 2014, 119, 4797–4820. [Google Scholar] [CrossRef]
- Sameoto, D.; Wiebe, P.; Runge, J.; Postel, L.; Dunn, J.; Miller, C.; Coombs, S. Metabolism. In ICES Zooplankton Methodology Manual; Harris, R.P., Ed.; Academic Press: London, UK, 2000; pp. 455–532. [Google Scholar]
- Postel, L.; Fock, H.; Hagen, W. 4 Biomass and abundance Some decades after Johannes Mu. In ICES Zooplankton Methodology Manual; Academic Press: London, UK, 2000. [Google Scholar] [CrossRef]
- Clarke, K.R.; Warwick, R.M. Changes in Marine Communities: An Approach to Statistical Analysis and Interpretation; Primer-E Ltd.: Plymouth, UK, 1995; p. 144. [Google Scholar]
- Post, D.M. Using stable isotopes to estimate trophic position: Models. methods and assumptions. Ecology 2002, 83, 703–718. [Google Scholar] [CrossRef]
- Jackson, A.L.; Inger, R.; Parnell, A.C.; Bearhop, S. Comparing isotopic niche widths among and within communities: SIBER—Stable Isotope Bayesian Ellipses in R. J. Anim. Ecol. 2011, 80, 595–602. [Google Scholar] [CrossRef]
- Layman, C.A.; Arrington, D.A.; Montana, C.G.; Post, D.M. Can stable isotope ratios provide for community-wide measures of trophic structure? Ecology 2007, 88, 42–48. [Google Scholar] [CrossRef]
- Protopapa, M.; Zervoudaki, S.; Tsangaris, C.; Velaoras, D.; Koppelmann, R.; Psarra, S.; Moellmann, C. Zooplankton distribution and electron transport system activity in the Cretan Passage, Eastern Mediterranean. Deep. Res. Part II 2019, 164, 156–169. [Google Scholar] [CrossRef]
- Siokou-Frangou, I.; Zervoudaki, S.; Christou, E.D.; Zervakis, V.; Georgopoulos, D. Variability of mesozooplankton spatial distribution in the North Aegean Sea, as influenced by the Black Sea waters outflow. J. Mar. Syst. 2009, 78, 557–575. [Google Scholar] [CrossRef]
- Turner, J.T. The importance of small planktonic copepods and their roles in pelagic marine food webs. Zool. Stud. 2004, 43, 255–266. [Google Scholar] [CrossRef]
- Protopapa, M.; Yebra, L.; Koppelmann, R.; Zervoudaki, S. Ecological Application of Biomarkers to Mesozooplankton Communities in the Mediterranean Sea. In Zooplankton Challenges in a Changing World; Taylor & Francis Group: Abingdon, UK, 2025. [Google Scholar] [CrossRef]
- Hays, G.C.; Richardson, A.J.; Robinson, C. Climate change and marine plankton. Trends Ecol. Evol. 2005, 20, 337–344. [Google Scholar] [CrossRef] [PubMed]
- Paffenhöfer, G.A. On the ecology of marine cyclopoid copepods (Crustacea. Copepoda). J. Plankton Res. 1993, 15, 37–55. [Google Scholar] [CrossRef]
- Zervoudaki, S.; Christou, E.D.; Assimakopoulou, G.; Örek, H.; Gucu, A.C.; Giannakourou, A.; Pitta, P.; Terbiyik, T.; Yϋcel, N.; Moutsopoulos, T.; et al. Copepod communities, production and grazing in the Turkish Straits System and the adjacent northern Aegean Sea during spring. J. Mar. Syst. 2011, 86, 45–56. [Google Scholar] [CrossRef]
- Guschina, I.A.; Harwood, J.L. Algal lipids and effect of the environment on their biochemistry. In Lipids in Aquatic Ecosystems; Arts, M.T., Brett, M.T., Kainz, M.J., Eds.; Springer: New York, NY, USA, 2009; pp. 1–24. [Google Scholar]
- Andersen, V. Salp and pyrosomid blooms and their importance in biogeochemical cycles. In The Biology of Pelagic Tunicates; Bone, Q., Ed.; Oxford University Press: Oxford, UK, 1998; pp. 125–137. [Google Scholar] [CrossRef]
- Mazzocchi, M.G.; Christou, E.D.; Di Capua, I.; de Puelles, M.F.; Fonda-Umani, S.; Molinero, J.C.; Nival, P.; Siokou-Frangou, I. Temporal variability of Centropages typicus in the Mediterranean Sea over seasonal-to-decadal scales. Prog. Oceanogr. 2007, 72, 214–232. [Google Scholar] [CrossRef]
- Zervakis, V.; Krasakopoulou, E.; Georgopoulos, D.; Souvermezoglou, E. Vertical diffusion and oxygen consumption during stagnation periods in the deep North Aegean. Deep. Sea Res. Part I Oceanogr. Res. Pap. 2003, 50, 53–71. [Google Scholar] [CrossRef]
- Poulos, S.E.; Lindsay, F.S.; Pates, J.M. Seasonal variability in sea surface oceanographic conditions in the Aegean Sea (eastern Mediterranean): An overview. J. Mar. Syst. 1997, 13, 225–244. [Google Scholar] [CrossRef]
- Harris, R.; Wiebe, P.; Lenz, J.; Skjoldal, H.R.; Huntley, M. (Eds.) ICES Zooplankton Methodology Manual; Academic Press: Cambridge, MA, USA, 2000. [Google Scholar]
- Koski, M. Carbon:nitrogen ratios of Baltic Sea copepods—Indication of mineral limitation? J. Plankton Res. 1999, 21, 1565–1573. [Google Scholar] [CrossRef]
- Tsutomu, I.; McKinnon, A.D. Metabolism and chemical composition of zooplankton and hyperbenthos from the Great Barrier Reef waters, North Queensland, Australia. Plankton Benthos. Res. 2012, 7, 8–19. [Google Scholar] [CrossRef]
- Williams, R.; Robins, D.B. Effects of preservation on wet weight, dry weight, nitrogen and carbon contents of Calanus helgolandicus (Crustacea: Copepoda). Mar. Biol. 1982, 71, 271–281. [Google Scholar] [CrossRef]
- Aranguren-Riaño, N.J.; Guisande, C.; Shurin, J.B.; Jones, N.T.; Barreiro, A.; Duque, S.R. Amino acid composition reveals functional diversity of zooplankton in tropical lakes related to geography, taxonomy and productivity. Oecologia 2018, 187, 719–730. [Google Scholar] [CrossRef]
- Jakob, W.; Larsson, U. Carbon, nitrogen and phosphorus stoichiometry of crustacean zooplankton in the Baltic Sea: Implications for nutrient recycling. J. Plankton Res. 1999, 21, 2309–2321. [Google Scholar] [CrossRef]
- Molinero, J.C.; Ibanez, F.; Nival, P.; Buecher, I.; Souissi, S. North Atlantic climate and northwestern Mediterranean plankton variability. Limnol. Oceanogr. 2005, 50, 1213–1220. [Google Scholar] [CrossRef]
- Möllmann, C.; Müller-Karulis, B.; Kornilovs, G.; St John, M.A. Effects of climate and overfishing on zooplankton dynamics and ecosystem structure: Regime shifts, trophic cascade, and feedback loops in a simple ecosystem. ICES J. Mar. Sci. 2008, 65, 302–310. [Google Scholar] [CrossRef]


| Station | Region | Date | Local Time | Layer (m) |
|---|---|---|---|---|
| M02 | 40°06′ N, 24°31′ E | 4 October 2014 | 09:00–09:30 | 0–500 |
| 23 May 2015 | 09:10–09:40 | |||
| M3A | 35°44′ N, 25°09′ E | 9 October 2014 | 12:55–13:20 | 0–350 |
| 25 May 2015 | 11:55–12:15 | |||
| NESTOR | 36°32′ N, 21°27′ E | 12 October 2014 | 12:20–12:40 | 0–700 |
| 26 May 2015 | 09:25–10:10 |
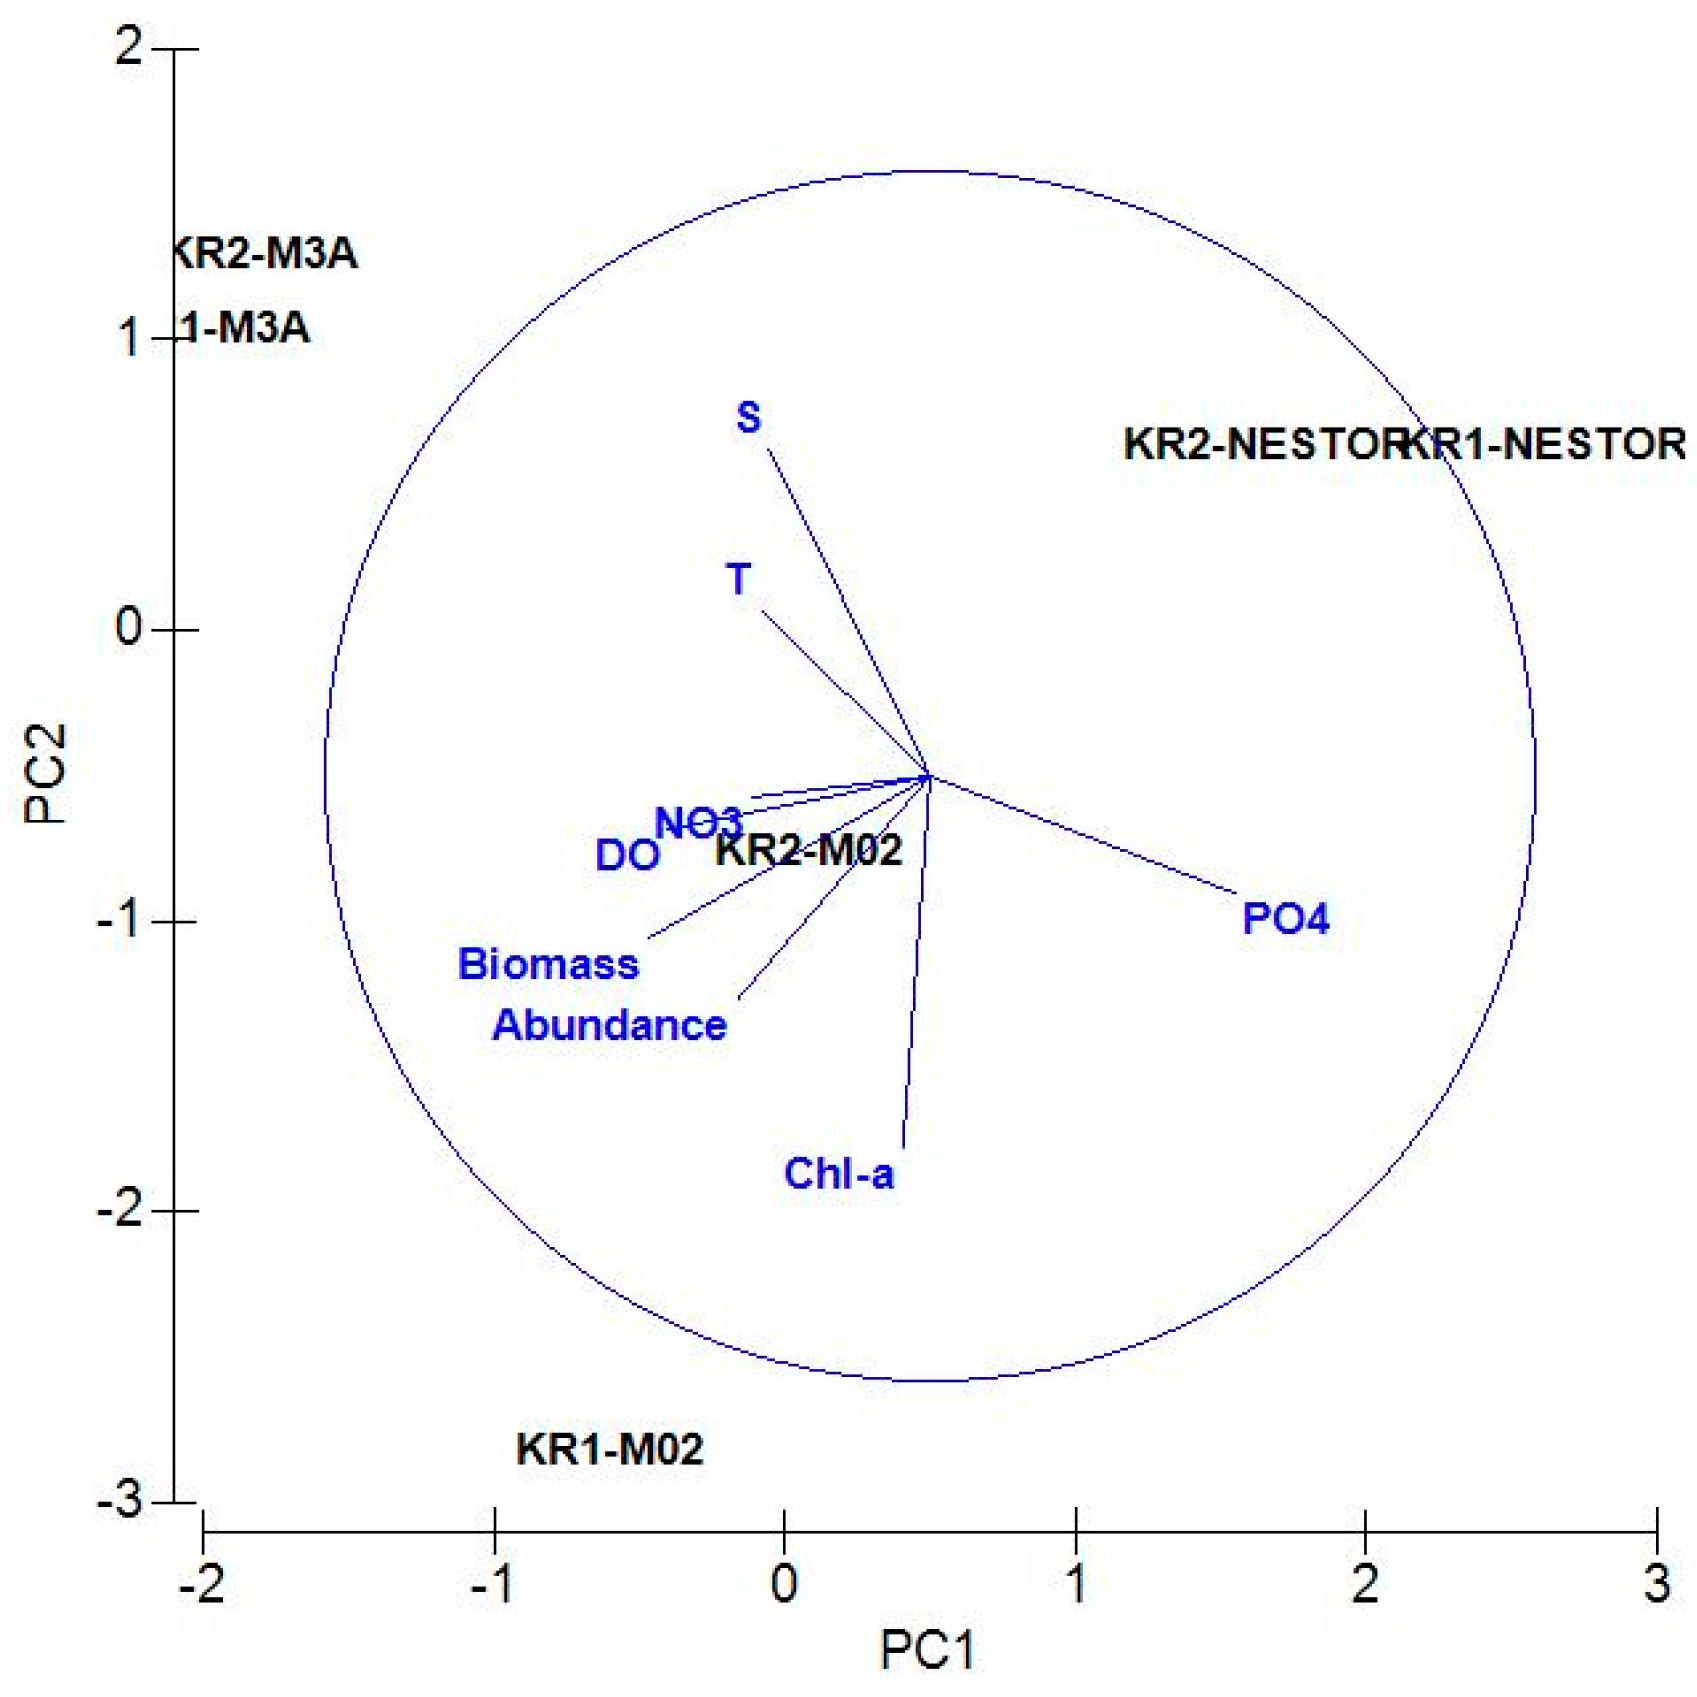
| Cruise/Station | T° [C°] | SALINITY [P.S.U.] | DO [mL/L] | PO4 [μmole/L] | NO3 [μmole/L] | Chl-a [μg/L] |
|---|---|---|---|---|---|---|
| KR1-M02 | 15.24 | 38.86 | 4.97 | 0.11 | 2.16 | 0.13 |
| KR1-M3A | 16.59 | 39.10 | 5.09 | 0.06 | 2.08 | 0.06 |
| KR1-NESTOR | 15.49 | 38.93 | 4.62 | 0.14 | 3.12 | 0.05 |
| KR2-M02 | 14.59 | 38.93 | 5.07 | 0.09 | 2.18 | 0.07 |
| KR2-M3A | 15.62 | 39.08 | 4.99 | 0.06 | 1.57 | 0.04 |
| KR2-NESTOR | 14.88 | 39.01 | 4.92 | 0.13 | 3.51 | 0.06 |
| Station | Layer (m) | Biomass (mg DW m−3) | Abundance (ind m−3) |
|---|---|---|---|
| KR1-M02 | 0–500 | 1.05 | 276 |
| KR2-M02 | 0.98 | 114 | |
| KR1-M3A | 0–350 | 0.89 | 210 |
| KR2-M3A | 1.01 | 124 | |
| KR1-NESTOR | 0–700 | 0.46 | 110 |
| KR2-NESTOR | 0.61 | 60 |
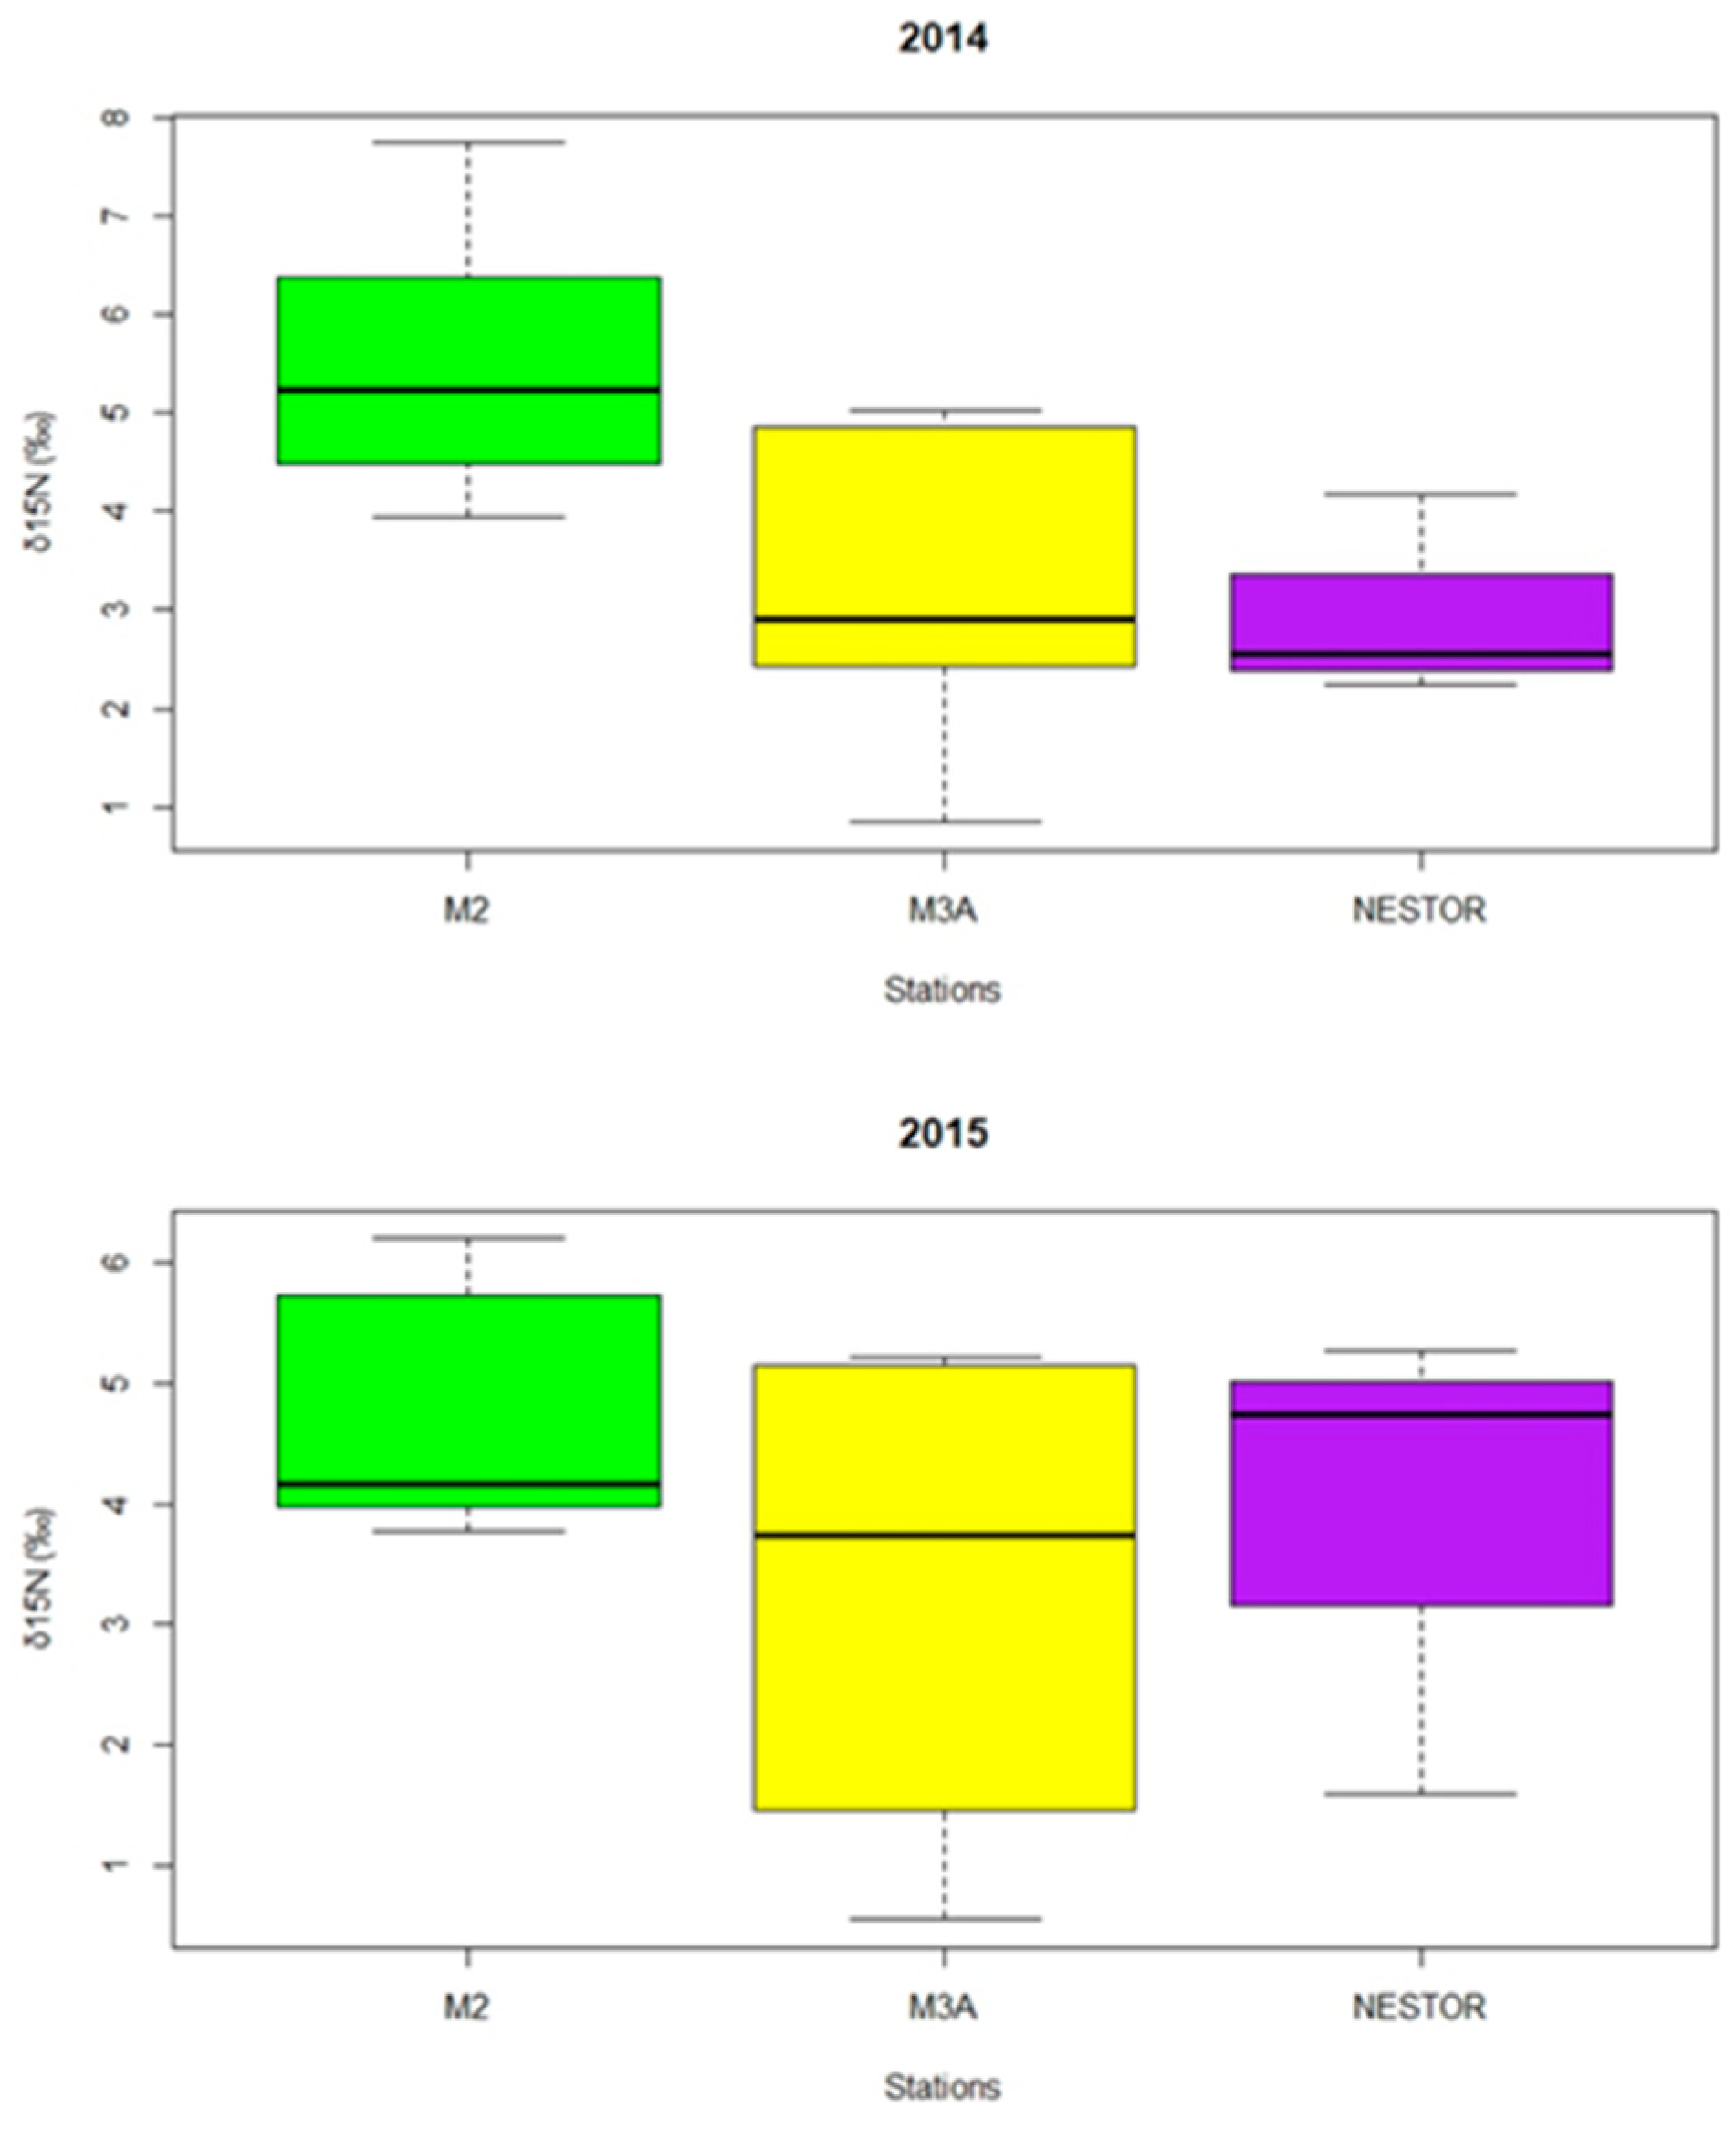
| Taxa | Station | n (ind) | δ13C | δ15N | C/N | TP |
|---|---|---|---|---|---|---|
| 2014 | ||||||
| Lucicutia spp. | M02 | 2 (20/26) | −23.43/−23.45 | 3.69/3.85 | 3.40/3.65 | 2.168 |
| NESTOR | 1 (20) | −23.14 | 0.55 | 1.76 | 1.221 | |
| Haloptilus longicornis | M02 | 1 (50) | −23.25 | 6.20 | 4.53 | 2.882 |
| M3A | 1 (50) | −22.07 | 4.74 | 4.48 | 2.453 | |
| NESTOR | 2 (50) | −22.16/−22.67 | 5.45/4.99 | 4.46/4.17 | 2.594 | |
| Oithona spp. | NESTOR | 2 (50) | −23.31/−23.19 | 3.53/4.13 | 4.63/3.82 | 2.185 |
| Pleuromamma spp. | M02 | 2 (10) | −22.96/−22.65 | 4.27/3.29 | 4.08/4.16 | 2.229 |
| Corycaeus spp. | M02 | 1 (30) | −23.11 | 4.17 | 4.35 | 2.284 |
| M3A | 2 (40) | −22.17/−22.39 | 1.73/1.44 | 4.30/4.01 | 1.525 | |
| NESTOR | 2 (40) | −22.66/−22.77 | 2.71/2.05 | 3.76/2.77 | 1.759 | |
| Chaetognatha | M02 | 2 (10) | −21.90/−22.08 | 5.80/5.68 | 3.87/3.46 | 2.747 |
| M3A | 2 (10) | −21.85/−21.67 | 5.45/5.11 | 4.29/4.19 | 2.612 | |
| NESTOR | 2 (10) | −21.53/−21.80 | 5.474.74 | 4. 10/4.33 | 2.560 | |
| 2015 | ||||||
| Centropages typicus | Μ02 | 2 (20) | −23.16/−23.15 | 5.14/5.32 | 4.33/3.88 | 2.596 |
| Calanus helgolandicus | Μ02 | 2 (12/10) | −21.69/−22.46 | 7.62/7.86 | 9.70/10.24 | 3.335 |
| Clausocalanus spp. | Μ02 | 1 (40) | −23.47 | 4.49 | 4.30 | 2.381 |
| NESTOR | 1 (20) | −23.22 | 2.89 | 4.20 | 1.908 | |
| Haloptilus longicornis | M3A | 1 (50) | −22.05 | 4.58 | 4.38 | 2.407 |
| NESTOR | 1 (50) | −21.94 | 4.86 | 4.09 | 2.489 | |
| Oithona spp. | M02 | 2 (50) | −23.89/−24.08 | 3.86/4.61 | 5.10/3.94 | 2.305 |
| Pleuromamma spp. | NESTOR | 1 (15) | −22.84 | 2.92 | 4.24 | 1.916 |
| Corycaeus spp. | Μ02 | 1 (35) | −23.53 | 3.94 | 4.74 | 2.219 |
| M3A | 1 (40) | −23.25 | 2.55 | 4.21 | 1.808 | |
| NESTOR | 2 (40) | −22.86/−22.81 | 2.91/2.83 | 4.06/4.50 | 1.902 | |
| Oncaea spp. | M3A | 2 (50) | −23.89/−23.72 | 2.00/2.46 | 4.46/4.01 | 1.714 |
| NESTOR | 1 (50) | −23.44 | 2.42 | 4.45 | 1.770 | |
| Doliolidae | NESTOR | 1 (15) | −22.44 | 0.84 | 4.08 | 1.305 |
| Chaetognatha | Μ02 | 2 (10) | −22.74/−22.32 | 6.03/6.71 | 3.50/4.29 | 2.932 |
| M3A | 1 (10) | −22.03 | 4.18 | 4.02 | 2.287 | |
| NESTOR | 2 (10) | −21.96/−22.08 | 5.25/4.80 | 4.47/4.53 | 2.537 | |
Disclaimer/Publisher’s Note: The statements, opinions and data contained in all publications are solely those of the individual author(s) and contributor(s) and not of MDPI and/or the editor(s). MDPI and/or the editor(s) disclaim responsibility for any injury to people or property resulting from any ideas, methods, instructions or products referred to in the content. |
© 2025 by the authors. Licensee MDPI, Basel, Switzerland. This article is an open access article distributed under the terms and conditions of the Creative Commons Attribution (CC BY) license (https://creativecommons.org/licenses/by/4.0/).
Share and Cite
Protopapa, M.; Zervoudaki, S. Unraveling Zooplankton Trophic Dynamics: Insights from Stable Isotope Analysis in the Eastern Mediterranean (Aegean, Cretan and Ionian Seas). Water 2025, 17, 1187. https://doi.org/10.3390/w17081187
Protopapa M, Zervoudaki S. Unraveling Zooplankton Trophic Dynamics: Insights from Stable Isotope Analysis in the Eastern Mediterranean (Aegean, Cretan and Ionian Seas). Water. 2025; 17(8):1187. https://doi.org/10.3390/w17081187
Chicago/Turabian StyleProtopapa, Maria, and Soultana Zervoudaki. 2025. "Unraveling Zooplankton Trophic Dynamics: Insights from Stable Isotope Analysis in the Eastern Mediterranean (Aegean, Cretan and Ionian Seas)" Water 17, no. 8: 1187. https://doi.org/10.3390/w17081187
APA StyleProtopapa, M., & Zervoudaki, S. (2025). Unraveling Zooplankton Trophic Dynamics: Insights from Stable Isotope Analysis in the Eastern Mediterranean (Aegean, Cretan and Ionian Seas). Water, 17(8), 1187. https://doi.org/10.3390/w17081187