Article

Process Modeling and Its Application in Municipal Wastewater Treatment Plant Based on Seasonal Temperature Variations: A Case Study in Eastern China

by
Yaxuan Tian
1,
Zhirong Hu
2,
Hude Cheng
3,
Jianjian Xiao
3 and
Lei Wu
1,*
1
School of Energy and Environment, Southeast University, Nanjing 210096, China
2
GL Environment Inc., Hamilton, ON L9H 6X7, Canada
3
Guobang Water Services Co., Ltd., Nanjing 211300, China
*
Author to whom correspondence should be addressed.
Water 2025, 17(7), 994; https://doi.org/10.3390/w17070994
Submission received: 15 February 2025 / Revised: 21 March 2025 / Accepted: 25 March 2025 / Published: 28 March 2025
(This article belongs to the Section Wastewater Treatment and Reuse)

Abstract

:
Based on the impact of seasonal temperature variations on wastewater treatment plants (WWTPs), a mathematical model of the Anaerobic–Anoxic–Oxic (AAO) process at a municipal WWTP in Eastern China was developed using GPS-X 8.5 software. A sensitivity analysis was conducted on 128 parameters, and key influential parameters were identified and adjusted accordingly. The model’s accuracy was validated using historical monitoring data, and the validation confirmed its ability to reflect operational conditions across different seasons. To address seasonal challenges observed in historical data, several scenarios were simulated. The results show that the maximum treatment capacity of the WWTP is approximately 125% of the design capacity. Under low winter temperatures, the treatment efficiency can be enhanced by reducing the dissolved oxygen (DO) levels in the oxic tank to 1.5–2 mg/L and increasing both the internal reflux ratios to approximately 150% and external reflux ratios to 100%. During summer rainstorms, the risk of exceeding the discharge limits can be mitigated by appropriately increasing the dosage of the flocculant poly-aluminum chloride (PAC). Additionally, carbon source supplementation strategies were proposed based on varying influent carbon-to-nitrogen ratios (C/N). These findings provided precise operational strategies for the WWTP, effectively reducing the effluent concentrations of COD, TN, NH4+-N, and TP by 3.1%, 12.7%, 24.1%, and 18.9%, respectively, while also achieving a 24.2% reduction in the carbon source dosage.

1. Introduction

Wastewater treatment plants (WWTPs) are essential infrastructures to reduce water pollution and keep environmental health, by collecting, treating, and discharging municipal and industrial wastewater [1]. In China, the urban wastewater treatment coverage rate has surpassed 95%, with the number of WWTPs reaching 13,527. Concurrently, the discharge standards have become increasingly stringent. In China, several provinces have enacted provincial wastewater discharge standards that are more stringent than the national standards. For example, in Jiangsu Province, the limit of TN of urban WWTPs has been decreased from 15 mg/L in national standard grade 1-A to 12 mg/L (15 mg/L in winter) [2]. Therefore, it is necessary to use more effective methods to investigate management strategies for enhancing the pollutant removal efficiency of existing WWTPs to meet updated emission standards.
Considering the complex systems of WWTPs, the use of mathematical activated sludge models and computer software simulation enables rapid completion of thousands of simulation experiments within a short time. The most widely used mathematical models for activated sludge processes are the ASM series models, developed by the International Water Association (IWA) between 1987 and 1999 [3]. These models generally include activated sludge model No.1 (ASM1), activated sludge model No.2 (ASM2), activated sludge model No.2D (ASM2d), and activated sludge model No.3 (ASM3). These models fulfill the requirements for describing the entire process of wastewater treatment using activated sludge methods. Based on the characterization of influent COD components using standard physicochemical analysis methods, Carrette et al. [4] successfully simulated the treatment process of a WWTP in Belgium that processes a mixture of textile wastewater and domestic sewage using the ASM2d. Elawwad et al. [5] utilized the ASM3 to simulate the processes of a WWTP for industrial mixed influent in arid cities, incorporating the Arrhenius equation to effectively predict the treatment performance of the studied WWTP. To further simplify the simulation process, a large number of wastewater treatment simulation software based on the ASM series models have been developed, including GPS-X, Biowin, and WEST. Among these, GPS-X was developed by the Hydromantis company. It offers an extensive model library capable of simulating various stages of wastewater treatment, and has been used worldwide. Based on the ASM2d and ADM1 models, GPS-X has developed a new comprehensive model, Mantis 2, which covers the most common biological, physical, and chemical processes in WWTPs, and is widely used in the modeling of urban WWTPs. The comparison between the Mantis 2 model and ASM series models is shown in Table 1. The Mantis 2 model has the most processes and can more accurately simulate the operation of a WWTP throughout the entire process. A currently operational but malfunctioning modular WWTP in India utilized GPS-X software to analyze its operational issues and provided a techno-economically feasible solution for the biological treatment unit [6]. Additionally, GPS-X has been used to evaluate the feasibility and economic viability of using brewery wastewater as a carbon source in municipal WWTPs [7]. The application of mathematical models and related simulation software to simulate and optimize the operation of WWTPs significantly reduces the need for extensive experimental research, thereby enhancing overall efficiency.
According to the activated sludge model, the performance of wastewater treatment systems is closely linked to the microbial communities within. Environmental factors such as the temperature, pH, and dissolved oxygen (DO) levels significantly influence the effectiveness of biochemical treatment processes [8]. Among these, temperature specifically impacts the activity and growth rates of microorganisms in the activated sludge [9]. The impact of temperature on activated sludge treatment effectiveness can be categorized into two main aspects: (1) the effect on the metabolic rate and growth rate of microorganisms and (2) the influence on the reaction kinetics and settling characteristics of the wastewater treatment process [10]. Lower temperatures can decrease microbial proliferation rates, alter community structure, and negatively impact adsorption and settling properties within activated sludge systems [11]. Under seasonal temperature changes, due to the different optimal growth temperatures, the dominant microbial communities in activated sludge in WWTPs are also different [12]. For the same activated sludge system, the number of dominant bacteria at mesophilic conditions is greater than that at low temperatures. When the water temperature is about 20 °C, the microbial activity in the sludge is high, the growth rate is fast, and the rate of pollutant treatment is also fast. When the temperature drops below 15 °C, the enzyme activity of microorganisms drops sharply, which seriously affects the enzyme reaction, and even some microorganisms lose the ability to degrade organic matter [13]. This difference leads to the problem of poor treatment effects of sewage treatment plants in winter compared to other seasons. However, existing studies on the simulation process models of WWTPs have mainly focused on periods spanning several days or months with minimal temperature variation [14,15], lacking comprehensive modeling research on a year-round scale for WWTPs in regions with significant seasonal temperature fluctuations.
Given the seasonal variations in temperature and influent water quality, WWTPs encounter distinct challenges throughout the year. Generally, during the summer, rainfall can lead to a sudden increase in influent flow, placing additional pressure on the treatment systems. During winter, low temperatures often hinder nitrogen removal processes, leading to suboptimal performance that may necessitate the addition of carbon sources or adjustments to process parameters to meet the discharge requirements [16]. Lawrence et al. [17] analyzed the impact of seasonal environmental fluctuations on WWTP performance in Italy. Their study highlighted that the temperature influences nitrogen and phosphorus removal efficiencies, necessitating operational adjustments aligned with seasonal climate changes. A WWTP in Southeast China optimized its internal/external reflux ratios and DO levels to mitigate the effects of seasonal temperature changes [18]. In another case, Pilz et al. [19] successfully addressed challenges posed by seasonal winter tourism in an Austrian activated sludge WWTP through ASM3 model simulation. These studies show that it is necessary to optimize the treatment effect of WWTPs in different seasons by adjusting the operation parameters. Thus, using process simulation software to identify effective methods to address seasonal issues and providing management and operational strategies for WWTPs can effectively prevent pollutant discharge exceedance and mitigate the risk of water environmental pollution.
In this study, the wastewater treatment process simulation software GPS-X was utilized to model the treatment processes of a typical municipal WWTP in Eastern China. Through comprehensive sensitivity analysis and parameter adjustments, a simulation model tailored to this WWTP was developed. Based on the operational situations and seasonal variations, several simulation scenarios were designed to provide optimal operational management strategies.

2. Materials and Methods

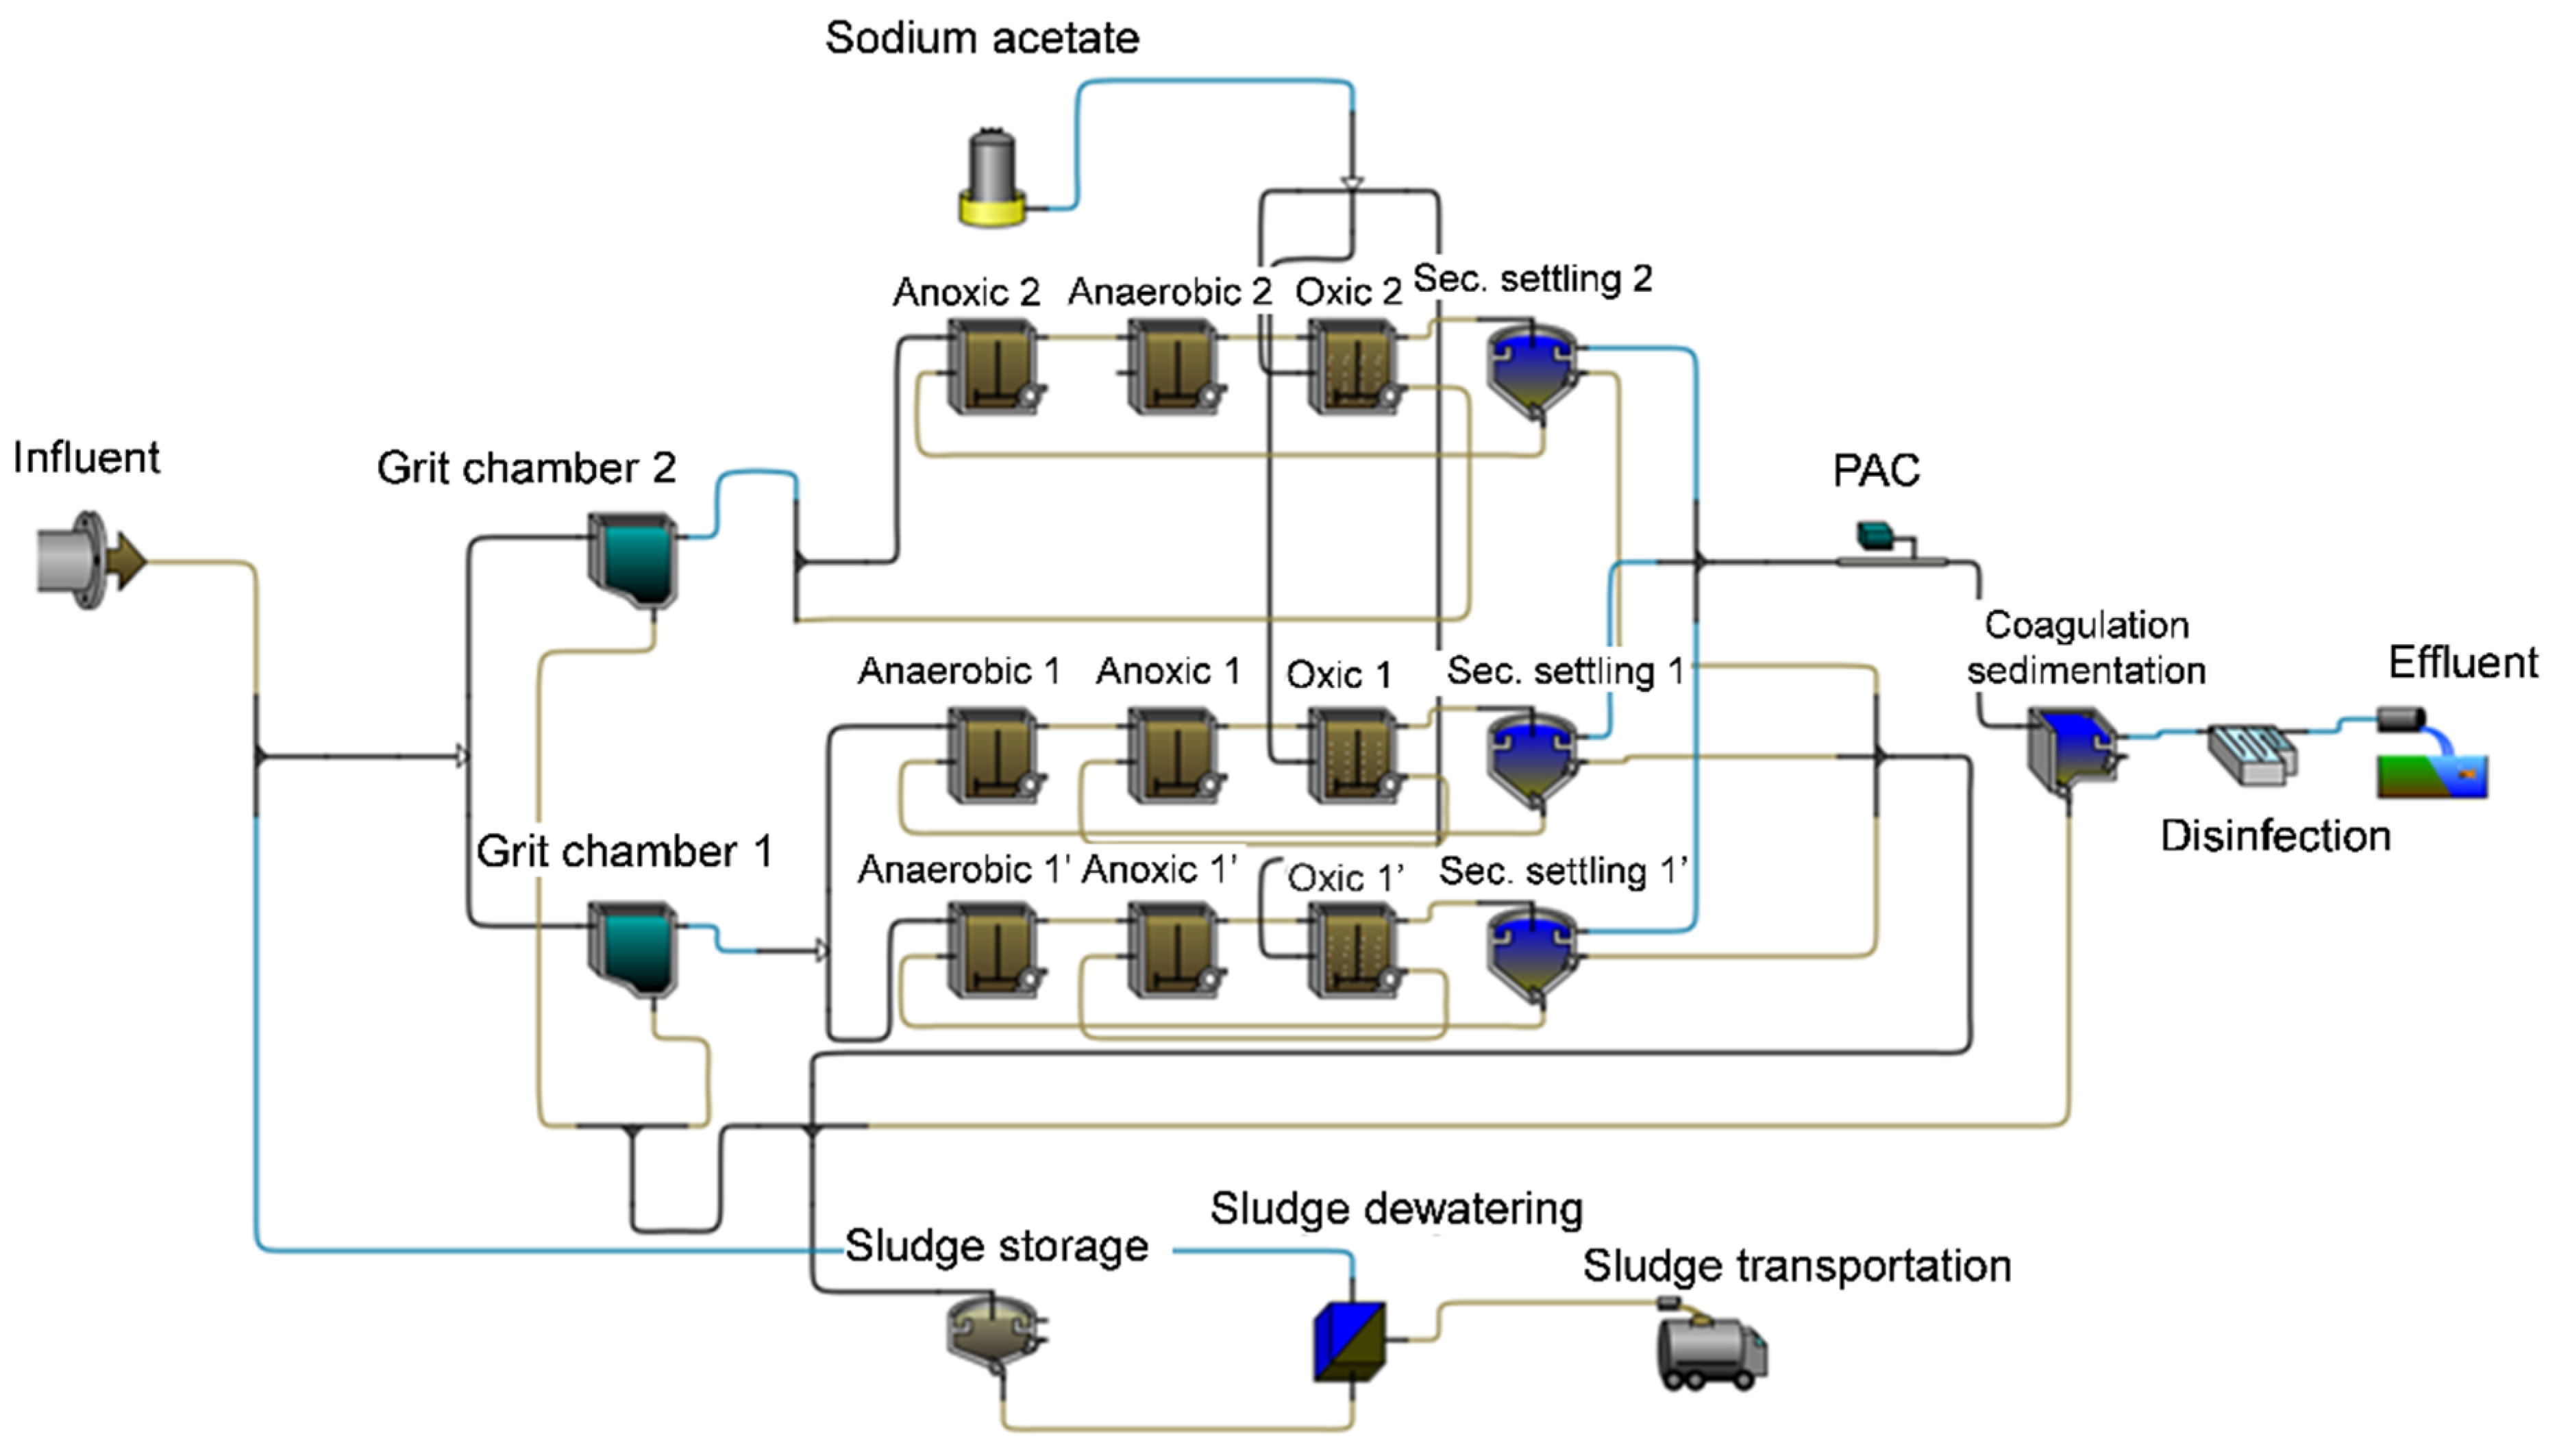
2.1. Selection of the Typical Municipal WWTP

This study focused on a municipal WWTP located in Jiangsu Province, China, with a daily processing capacity of 4 × 10⁴ m3. The schematic of the selected WWTP is shown in Figure 1. After municipal wastewater flows into the WWTP via the collection system, it first undergoes pretreatment through screening and vortex grit chambers. Subsequently, the pretreated wastewater flows into the biochemical treatment units, the AAO oxidation ditch, and the secondary sedimentation tank, for secondary treatment. The secondary treatment is divided into two phases, each with a treatment capacity of 2 × 10⁴ m3/day. After secondary treatment, the effluent passes through a coagulation sedimentation tank and a disinfection chamber before being discharged in compliance with standards. The main design parameters are detailed in Table 2.

2.2. Data Description of Different Seasons

The operational data of the WWTP over the past three years (2021~2023) were collected (Table S1). The removal rates of COD, TN, NH4+-N, and TP were 91.0%, 66.1%, 96.9%, and 91.6%, respectively. All effluent data met the discharge requirements of the newly implemented provincial standard of Jiangsu Province [20].
As Jiangsu Province is located in the East China region and is influenced by the East Asian monsoon climate, it experiences distinct seasons with significant temperature variations. These seasonal temperature changes inevitably cause fluctuations in wastewater temperature, which in turn affects the performance of the biochemical treatment units. The monthly data for influent flow, temperature, and the removal rates of COD, TN, NH4+-N, and TP over the past three years are shown in Figure 2a. Throughout the year, the average water temperature is highest in August at 27.0 °C and lowest in January at 11.6 °C, showing a gradual increase over time. The influent flow followed a similar trend, peaking in August with a daily average of 41,329 m3, and reaching its lowest point in January at 38,351 m3. Notably, the removal rate for COD, TP, and NH4+-N remained relatively stable despite temperature fluctuations, maintaining average rates of 91.1%, 91.8%, and 96.9%, respectively. However, the removal rate of TN showed significant monthly fluctuations and a positive correlation with the water temperature. The highest removal rate of TN occurred in July at 73.9% when the water temperature was high, while the lowest rate was observed in February at 61.4% during the colder months.

2.3. Sensitive Analysis

Sensitivity analysis is a method for studying or analyzing the impact of parameter variations on a system’s (or model’s) output results. In GPS-X software, parameters that affect the output results include kinetic and stoichiometric parameters related to ammonia-oxidizing bacteria (AOB), nitrite-oxidizing bacteria (NOB), ordinary heterotrophic organisms (OHOs), and phosphorus-accumulating organisms (PAOs) in the activated sludge model. The parameter sensitivity (Si,j) represents the ratio of the percentage change in the model’s dependent variable ( y i ) to the percentage change in the model’s independent variable ( x i ). According to the guideline proposed by US EPA, its calculation is as follows [21]:
S i , j = Δ y i / y i Δ x i / x i
Based on the calculation results, a positive Si,j indicates a positive correlation between the parameter and the indicator, while a negative Si,j suggests a negative correlation. The larger the absolute value of Si,j, the greater the impact on the model. Generally, parameters with |Si,j| values equal to or larger than 0.25 are selected for calibration [22]. Once the parameters needing adjustment are identified, their values can be adjusted according to the parameter ranges provided by GPS-X or by referring to the relevant literature.

2.4. Simulation Results Analysis

Each time the model is corrected, it must undergo evaluation. This study employs error analysis to assess the model’s quality and reliability. The model errors are primarily categorized into Mean Absolute Error (MAE), Mean Relative Error (MRE) and Thiel inequality coefficient (TIC), with their calculation methods as follows:
M A E = | x i y i | n
M R E = 1 n i = 1 n | x i y i y i |
T I C = i = 1 n ( x i y i ) 2 i = 1 n x i 2 + i = 1 n y i 2
where x i represents the simulated results and y i represents the actual values. Generally, the smaller the MAE, MRE, and TIC, the better the model is.

3. Results and Discussion

3.1. Parameters Sensitivity

To fulfill the GPS-X model requirements for detailed influent quality component specification, field sampling and analysis were also conducted at the WWTP to validate historical data and obtain accurate wastewater characteristics. The influent was analyzed for COD components, nitrogen components, and phosphorus components. The component analysis methods referred to the standard methods and relevant research [23]. Based on the recommended value ranges from the software and relevant literature, the proportions of the influent characteristic components were determined, as shown in Figure 2b. The COD of the influent wastewater primarily consists of the following fractions: frsi (soluble inert fraction of total COD), frss (readily biodegradable fraction of total COD), frxi (particulate inert fraction of total COD), frscol (colloidal fraction of slowly biodegradable COD), and others. The percentages of each component fall within the recommended model values and align with the scope of findings from related studies [3,24].
The sensitivity analysis results for 19 stoichiometric parameters and 109 kinetic parameters in the model are shown in Figure 2c, with 15 parameters identified as having an impact on at least one observed index according to the classification of influence levels. Refer to Table 3 for specific parameter meanings corresponding to parameter symbols. For different monitored pollutants (COD, NH4+-N, TN, and TP), there are 1, 3, 2, and 10 parameters, respectively, affecting each. The anaerobic yield of OHOs on soluble substrates and maximum specific growth rate (of OHOs) on substrates are extremely influential to the simulation results of TP; the anaerobic yield of OHOs on soluble substrates and aerobic yield of OHOs on soluble substrates are influential to the simulation results of TN; and the maximum specific growth rate of AOB is very influential to the simulation results of NH4+-N.

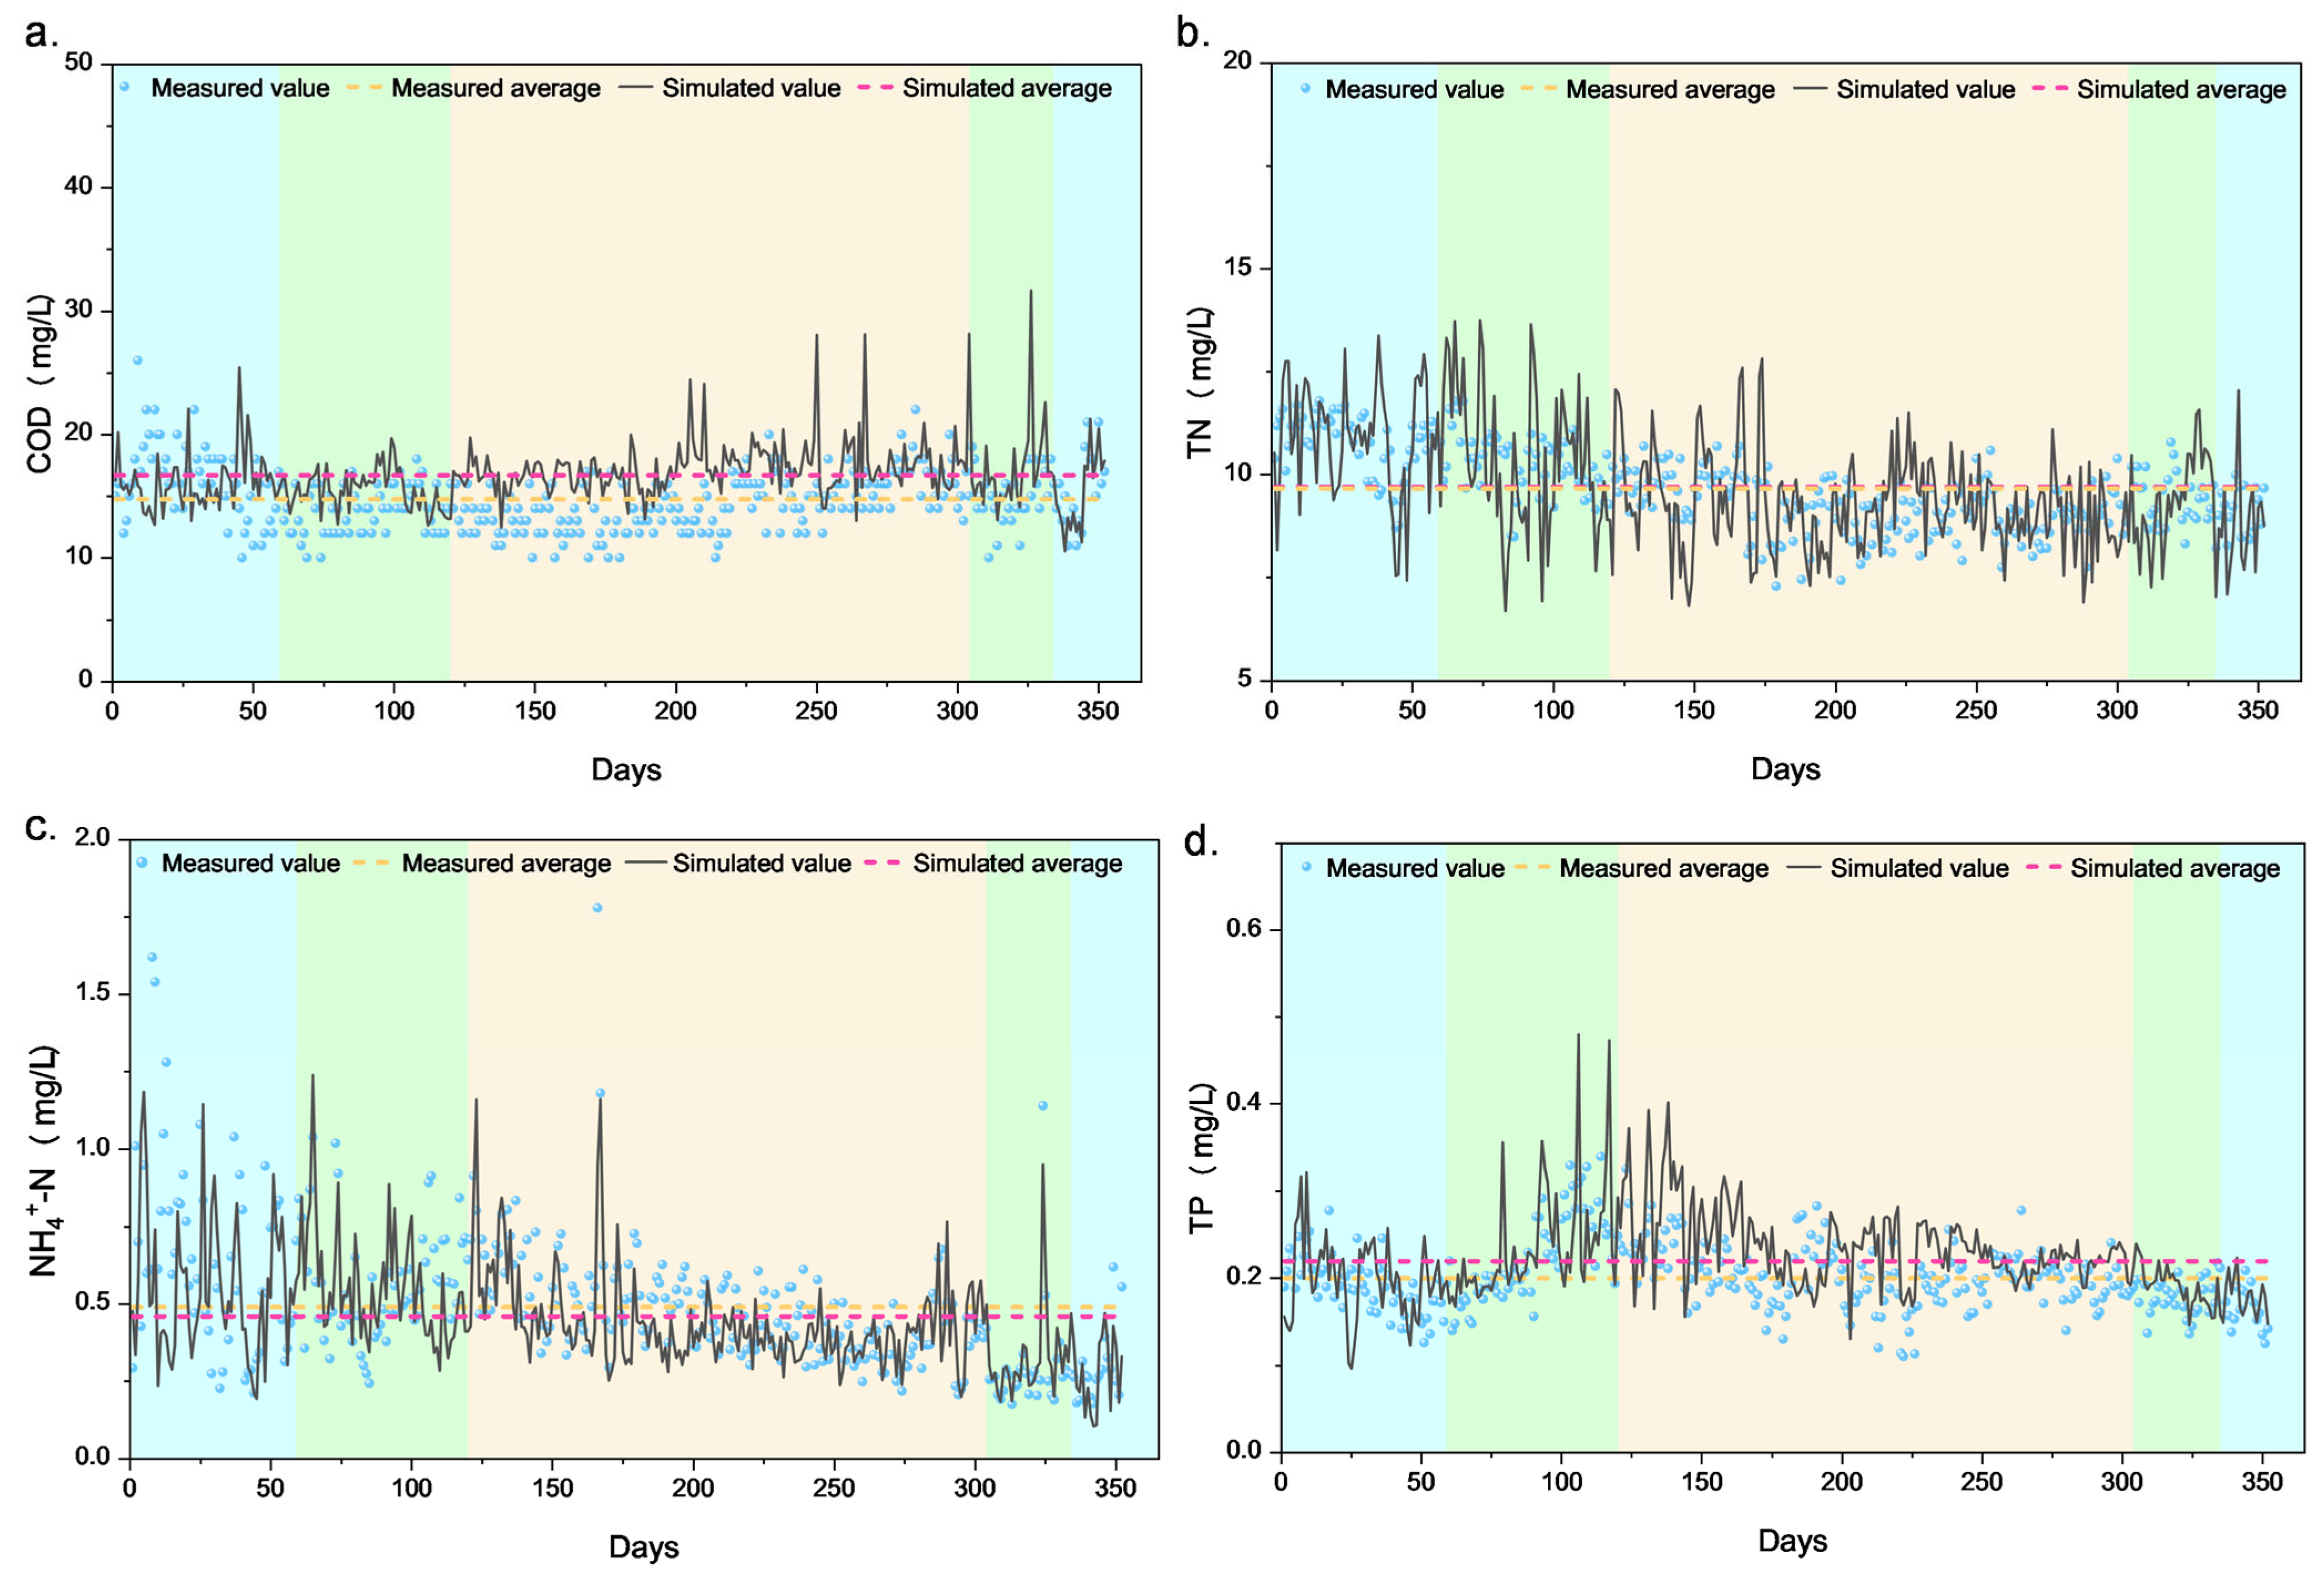
3.2. Parameter Calibration and Simulation Results

Due to the use of default values for certain parameters in the model, such as dynamic and stoichiometric parameters from GPS-X, the initial simulation results showed significant deviations from the actual effluent quality data. Therefore, it was necessary to adjust the key model parameters, including influent characteristics, dynamic parameters, and stoichiometric parameters, before fitting the simulation results to the actual effluent quality data.
Considering the seasonal variation in wastewater temperature, which affects the dominance of microbial populations in activated sludge and leads to changes in microbial kinetics and stoichiometric parameters, the data for the entire year were grouped into three seasonal categories based on the monthly average water temperatures: winter (January, February, and December with monthly average temperatures below 15 °C), spring and autumn (March, April, and November with monthly average temperatures ranging from 15 °C to 20 °C), and summer (May to October with monthly average temperatures above 20 °C). The average water temperatures, as well as the influent water quality and quantity for each season, were calculated for the simulation scenario (Table S2).
Figure 2d shows the preliminary simulation results of four effluent water quality indicators (COD, NH4+-N, TN, and TP) in each season. When using the parameters with default values in GPS-X, the average MRE values of COD, NH4+-N, TN, and TP were 29.18%, 83.50%, 21.85%, and 99.60%, which were relatively high. According to the IWA’s Guidelines for Using Activated Sludge Models, a high-quality simulation model should yield an MRE within 5% to 15%. However, if the pollution concentration in the effluent is very low, an MRE greater than 100% may still be considered acceptable [33]. Still, other researchers have suggested that for a reliable model, the MRE should be less than 20% [34]. Notably, the MRE for all four observed indices from the primary simulation surpassed the recommended limit.
Also, as for different seasons, the preliminary simulation results show better performance at higher temperatures in summer, with the MRE of COD, NH4+-N, TN, and TP being 25.28%, 27.06%, 20.34%, and 61.45%. In contrast, at the lower temperatures in winter and during spring and autumn, the preliminary simulation results show greater deviations, with some MREs exceeding the measured data by several times. Specifically, for spring and autumn, the MREs of COD, NH4+-N, TN, and TP were 25.98%, 85.53%, 24.72%, and 96.2%, while for winter, they were 36.3%, 137.9%, 18.62%, and 141.16%, respectively. Therefore, it is necessary to adjust the model parameters according to seasonal variations in water temperature. Regarding the different pollutants, the preliminary simulation results for TN and COD align relatively well with the measured data, with MREs around 20%. Thus, the parameters that primarily need adjustment are the kinetic and stoichiometric parameters related to the removal of NH4+-N and TP by microorganisms.
To perform the calibration, a series of dynamic simulations under various scenarios was conducted. By comparing the simulation results with the measured data, further cleaning of the model input data was carried out, followed by the calibration of dynamic and stoichiometric parameters. The parameters selected for calibration, along with their default and adjusted values, are presented in Table 3. All other parameters not listed were kept at their default values in GPS-X.
Figure 3 shows that the simulated concentrations of COD, TN, NH4+-N, and TP in the effluent closely align with the measured values, demonstrating that the simulation effectively reflects the variations in the actual effluent concentrations. Additionally, it is evident from Figure 2d that both the MRE and MAE of the simulated results significantly decreased after parameter calibration compared to the preliminary simulation results. The MREs of COD, NH4+-N, TN, and TP were 18.31%, 22.26%, 10.81%, and 21.42% in summer; 17.39%, 23.64%, 12.48%, and 16.75% in spring and autumn; and 19.48%, 28.28%, 10.14%, and 20.71% in winter, respectively. These values are acceptable for a reliable simulation model. The TICs for COD, NH4+-N, TN, and TP were 0.12, 0.19, 0.07, and 0.12, respectively, all falling within the typical effective limit (≤0.3) [14]. It shows that the deviation between the simulated value and the actual value is low, and the model can accurately reflect the actual operation situation of the WWTP. Although some individual data points showed discrepancies, these are mainly attributed to variations in influent composition caused by rainfall and monitoring errors. Such discrepancies do not undermine the overall accuracy of the model in simulating daily influent and effluent water quality.

3.3. Scenario Settings and Simulation Results for Different Seasonal Problems

3.3.1. The Impact of Influent Flow Rate on Effluent Quality

Due to the WWTP operating at or above full capacity throughout the year, scenarios of influent flow overload and reduced load were configured into the simulation model. By running the model, variations in effluent quality under different scenarios were observed to establish boundary conditions for influent flow rates. These boundary conditions will be used to inform management and control strategies.
Given the design variation coefficient Kz = 1.31, scenarios were set to vary from 75% to 250% of the plant’s design capacity of 4 × 10⁴ m3/d. This resulted in influent flow varying from 3 × 10⁴ m3/d to 1 × 10⁵ m3/d in increments of 2 × 10³ m3/d. The model then simulated effluent quality under different influent flow rates for each season, with influent quality data based on seasonal averages for 2023.
Figure 4a–d show that as the influent flow rate increases, the concentrations of COD, TN, NH4+-N, and TP in the effluent also rise. Although the concentrations of effluent COD (Figure 4a) and NH4+-N (Figure 4c) increase with the flow rate, there is no risk of exceeding the discharge standards under the simulated scenarios. However, the concentrations of effluent TN (Figure 4b) and TP (Figure 4d) present a risk of exceeding discharge limits as the influent flow rate increases, with the level of risk varying by season. For effluent TN, when the influent flow rate exceeds 6 × 10⁴ m3/d, the winter effluent TN concentration is greater than 12 mg/L but less than 15 mg/L. If the influent flow rate exceeds 8 × 10⁴ m3/d, the effluent TN concentration in spring and autumn exceeds 12 mg/L, surpassing the discharge standards. For effluent TP, when the influent flow rate is 6.6 × 10⁴ m3/d, 7 × 10⁴ m3/d, and 7.6 × 10⁴ m3/d, the effluent TP concentrations in spring, autumn, summer, and winter exceed 0.40 mg/L, indicating a certain risk of exceeding the standards. When the influent flow rate is 7.4 × 10⁴ m3/d, 7.8 × 10⁴ m3/d, and 8.4×10⁴ m3/d, the effluent TP concentrations in spring and autumn, summer, and winter exceed 0.45 mg/L, exacerbating the risk of exceeding the discharge limits. Furthermore, at an influent flow rate of 8 × 10⁴ m3/d and 8.4 × 10⁴ m3/d, the effluent TP concentrations in spring and autumn, as well as summer, exceed 0.45 mg/L, leading to non-compliant discharge.
Therefore, by using the influent water quality from each season in 2023 as the upper limit and ensuring that the influent volume remains below the design load or controlling the treatment load within 125% of the design capacity, it is possible to ensure that the effluent quality meets the standards under the existing treatment processes and conditions. In this scenario, it is recommended to control the influent flow rate within the range of 3.2 × 10⁴ to 5 × 10⁴ m3/d.

3.3.2. Flocculation Dosing Strategies Under Summer Heavy Rainfall Conditions

Based on historical data from the WWTP, the influent flow rate in summer is typically higher than in other seasons. During extreme rainfall events in summer, the daily maximum treatment load can reach up to 47,000 m3/d, exceeding the design capacity by 17.5%. According to the simulation results from the previous section, the increase in influent flow during summer has the greatest impact on the effluent TP concentration. The rise in influent flow poses a risk of exceeding the effluent TP discharge standards. Due to the sudden nature of summer storms, adjusting the flocculation (10% PAC) dosage is a relatively simple and effective measure to reduce the risk of the TP discharge concentration exceeding the standards.
To address this situation, a simulation scenario was set for summer storm conditions, with an influent flow rate of 4.7 × 10⁴ m3/d. The influent concentrations of COD, TN, NH4+-N, and TP were calibrated to reflect values typically observed during summer storm conditions. The simulation evaluated the impact of different PAC dosages on effluent water quality, with the goal of developing an optimal PAC dosing strategy for managing effluent quality under summer storm conditions.
Figure 4e shows that increasing the PAC dosage has minimal impact on the effluent concentrations of NH4+-N and TN, but the effluent concentrations of COD and TP decrease as the PAC dosage rises. When no PAC is added, the TP concentration is 0.62 mg/L, which does not meet the discharge standard. When the average daily PAC dosage exceeds 1500 kg/d, the effluent TP concentration is reduced to below 0.5 mg/L, meeting the discharge standard. At an average daily PAC dosage of 4400 kg/d, the effluent TP concentration is further reduced to 0.34 mg/L. To reduce the effluent TP concentration to below 0.25 mg/L, which is typically observed under design load conditions, the PAC dosage would need to be increased to more than 6500 kg/d. From an economic perspective, assuming the influent volume during the summer storm season does not exceed 47,000 m3/d, it is recommended that the PAC dosage be set to more than 1500 kg/d to ensure that the effluent TP concentration remains below the new standard of 0.5 mg/L.

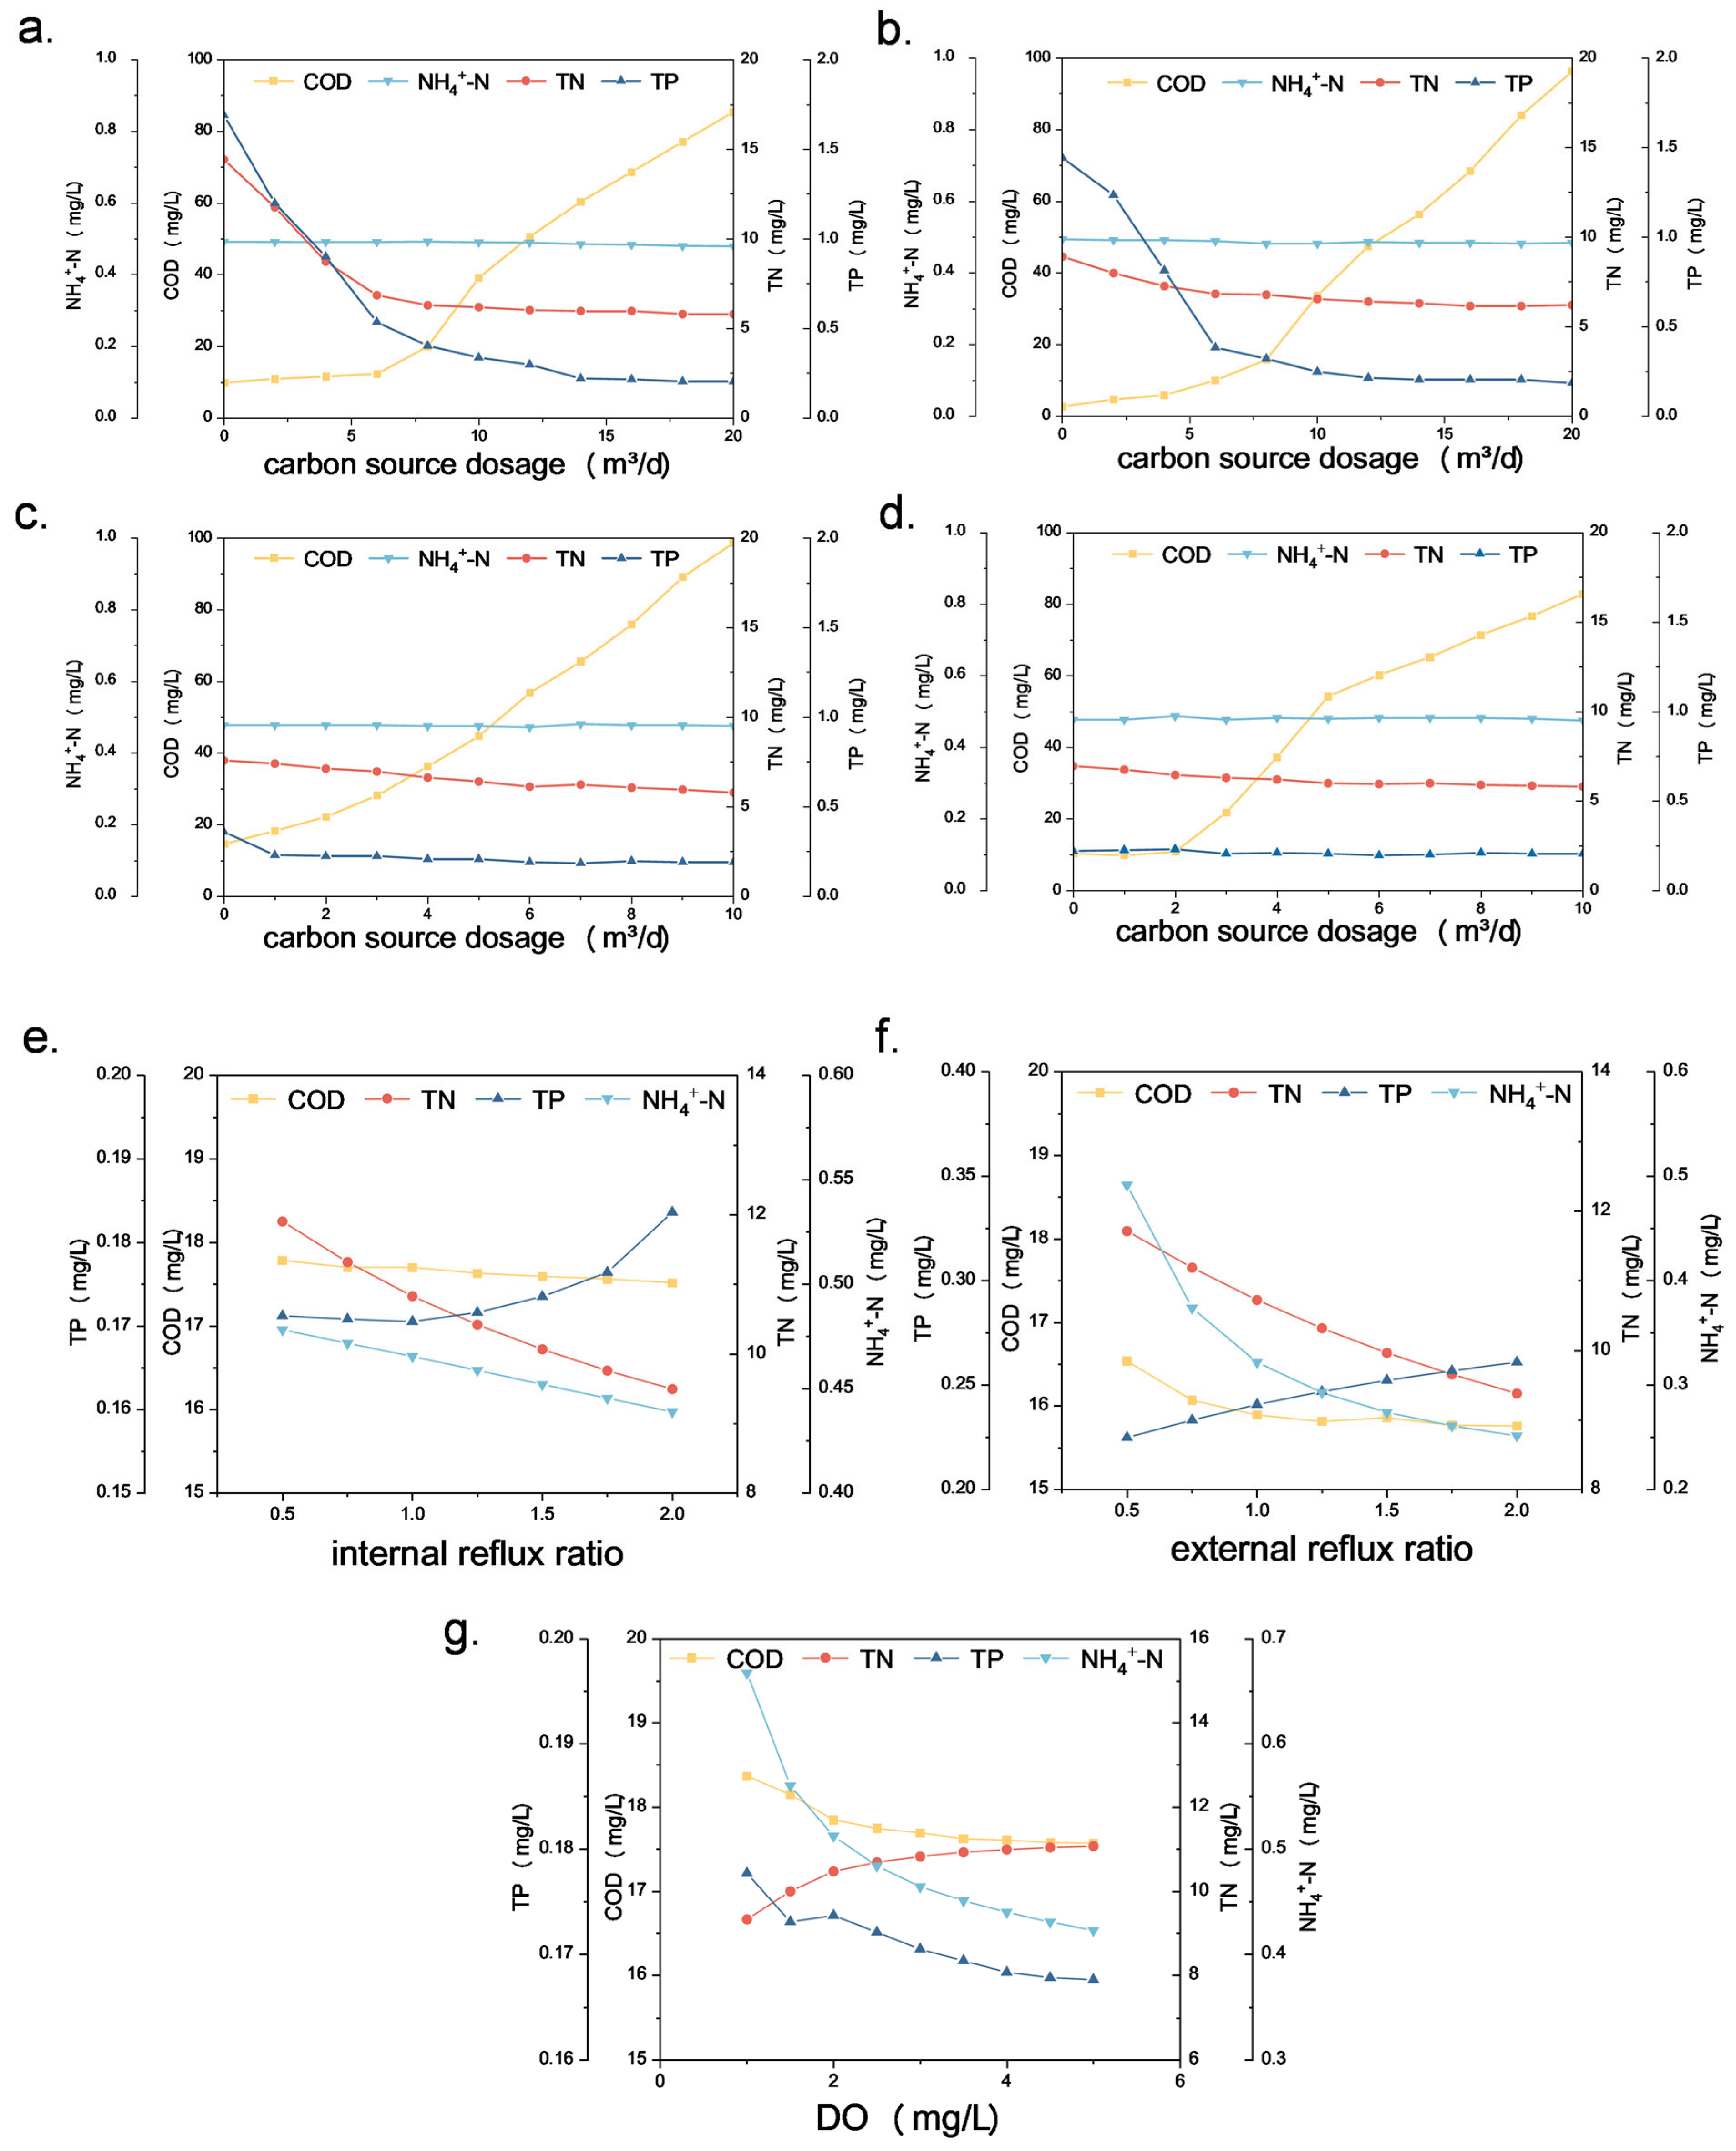
3.3.3. The Effect of Varying C/N Ratios on Effluent Quality

Due to the inconsistency in influent water quality, the addition of carbon sources is often necessary to adjust and optimize the influent C/N ratio, thereby enhancing the efficiency and stability of the treatment process. Further analysis of the influent water quality during these periods shows that the C/N ratio typically falls below 3, sometimes as low as 1.9. This carbon deficiency impairs the denitrification process, weakening nitrogen removal and increasing the effluent TN concentrations [35,36]. Thus, adding carbon sources to raise the influent C/N ratio can improve both phosphorus and nitrogen removal efficiencies, reducing the risk of exceeding the discharge limits.
For the simulation, representative models and water quality conditions for spring and autumn were used. The simulation model used a 30% sodium acetate solution as an external carbon source, with the addition rate varying from 0 to 20 or 10 m3/d (in 1 m3/d increments), to simulate the effects of different carbon source dosages on the effluent parameters.
The model simulations assessed the effect of carbon source addition on the effluent quality under different influent C/N ratios of 1.9, 2.8, 3.7, and 4.6, with the results shown in Figure 5a–d. They show that when the influent C/N is 1.9 (Figure 5a), the effluent quality meets the standards with a carbon source addition greater than 6 m3/d. However, if the addition exceeds 12 m3/d, the effluent COD concentration surpasses the standard. When the influent C/N is 2.8 (Figure 5b), the effluent quality meets the standards with a carbon source addition greater than 4 m3/d, but if the addition exceeds 8 m3/d, the effluent COD concentration rapidly increases, posing a risk of exceeding the standards. For an influent C/N of 3.7 (Figure 5c), the effluent quality meets the standards without carbon source addition; however, if the addition exceeds 6 m3/d, the effluent COD concentration rapidly increases, posing a risk of exceeding the standards. Similarly, for an influent C/N of 4.6 (Figure 5d), the effluent quality meets the standards without carbon source addition, but if the addition exceeds 5 m3/d, the effluent COD concentration rapidly increases, again posing a risk of exceeding the standards.
Therefore, in practical treatment processes, the quantity of carbon source addition should be adjusted in response to variations in the influent water quality and C/N ratios. This strategy will help mitigate the risk of TN exceeding the standards while also preventing potential COD exceedances.

3.3.4. Operational Optimization Under Low Temperatures in Winter

Analysis of the effluent quality data from the WWTP over the past three years reveals that elevated TN concentrations are most prominent during the winter months. Specifically, the risk of exceeding the TN discharge limits increases in winter due to lower water temperatures. To address this, this section will develop scenarios for low winter temperatures, incorporating winter-specific characteristics such as water temperature, corresponding kinetic parameters, and influent water quality into the model. The focus will be on discussing and optimizing operational schemes for the WWTP during winter conditions.
(1)
Internal reflux ratio
Internal reflux refers to the process in which a mixture with a high concentration of NO3-N, taken from the end of the aerobic treatment unit, is pumped into the anoxic zone to facilitate denitrification. If the internal reflux ratio is too low, the nitrate nitrogen concentration in the anoxic zone restricts the denitrification process. Conversely, if the internal reflux ratio is too high, it not only increases the pumping energy consumption but also raises the DO level in the anoxic zone, which negatively impacts the anoxic environment [37]. Therefore, controlling the internal reflux ratio is crucial during operation.
In the model, simulations were conducted with internal reflux ratios ranging from 0.5 to 2, in increments of 0.25. The impact of the internal reflux ratio on the effluent quality is shown in Figure 5e. The results indicate that the internal reflux ratio has a minimal impact on the COD levels. However, as the internal reflux ratio increases, the concentration of TP in the effluent increases, while the concentrations of TN and NH4+-N decrease. Consequently, increasing the internal reflux ratio can enhance the removal efficiency of TN to a certain extent. As the WWTP typically sets an internal reflux ratio of 100%, when the effluent TN faces the risk of exceeding the limit during winter, the internal reflux ratio can be appropriately increased to around 150%. This adjustment can lower the effluent TN concentration without causing the effluent TP concentration to exceed the limit.
(2)
External reflux ratio
External reflux, also known as sludge recirculation, refers to the process of returning sludge from the secondary sedimentation tank to the anaerobic (or anoxic) zone. This helps maintain the stability of activated sludge and enhances the treatment efficiency.
In our study, simulations were conducted with external reflux ratios ranging from 0.5 to 2, with a step size of 0.25. The impact of the external reflux ratio on the effluent quality is shown in Figure 5f. It indicates that variations in the external reflux ratio have a minimal effect on the effluent COD concentration. The concentration of TP in the effluent increases slightly with the rise in the external reflux ratio, while the concentrations of TN and NH4+-N decrease as the external reflux ratio increases. Therefore, increasing the external reflux ratio can improve the removal efficiency of TN to some extent. Due to the external reflux ratio in the WWTP typically being set between 50% and 60%, when the effluent TN faces the risk of exceeding the limit during winter, the external reflux ratio can be appropriately increased to around 100%. This adjustment can lower the effluent TN concentration without causing the effluent TP concentration to exceed the permissible limit.
(3)
DO concentrations in the aerobic tank
Dissolved oxygen (DO) levels in the activated sludge tank are a critical parameter that must be strictly controlled during the operation of WWTPs. Proper DO management is essential to support the growth and reproduction of microorganisms. Oxygen supply equipment is a major energy consumption factor in WWTPs. Excessive aeration not only leads to energy waste but can also cause the disruption of activated sludge flocs [38].
In the model, simulations were conducted with DO concentrations in the aerobic tank ranging from 1 to 5 mg/L, in increments of 0.5 mg/L. The impact of the DO levels in the aerobic tank on the effluent quality is shown in Figure 5g. The results indicate that the effluent COD concentration is not significantly affected by the DO levels in the aerobic tank. The effluent TP concentration slightly decreases with the increasing DO levels, and the NH4+-N concentration also decreases with the rising DO levels. However, the concentration of TN in the effluent increases with higher DO levels. This may be due to enhancing ammonia oxidation caused by higher DO, which promotes the growth of nitrifying bacteria and increases nitrification. Excessive aeration in the aerobic tank can also introduce large amounts of oxygen into the anoxic and pre-anoxic zones through recirculated flows and sludge, disrupting the anoxic environment and affecting denitrification.
Therefore, during actual operations, it is crucial to control the DO concentration in the aerobic tank to prevent high DO levels from adversely affecting the effluent TN concentration. It is ideal to maintain the DO concentration between 1.5 and 2.5 mg/L.
In summary, under low winter temperatures, improving the internal and external reflux ratios and reducing the DO concentration in the aerobic tank can enhance the TN removal effectiveness of the process and help mitigate the risk of TN exceeding the discharge standards in winter. Since increasing the internal and external reflux ratios will raise energy consumption, when the risk of TN exceedance is not significant, priority should be given to reducing the DO concentration in the aerobic tank.
The steady-state conditions (Table S2) corresponding to each season are applied in the scenario simulations, which may lead to the deviations between the simulation and the actual situation. For example, during a summer rainstorm, the pollutants concentration in the influent tends to be lower than usual, which is also a dynamic and complex change process. This is caused by the limitation of the simulation software and research capability, because the actual situation is often more complex. But these scenario simulations can still provide effective reference for the optimization schemes and give coping strategies for different scenarios.

3.4. Optimization Schemes and Practical Application

3.4.1. Optimization Schemes

According to the results of the scenario simulation, the operation optimization schemes of the WWTP are as follows:
(1)
Control the influent flow rate within 125% of the design capacity, i.e., 5 × 10⁴ m3/d, to maintain the stability of operation.
(2)
In summer, operators should closely monitor the changes in influent flow. In the event of heavy rainfall, promptly increase the PAC dosage. When the influent flow approaches the historical maximum of 4.7 × 10⁴ m3/d, the PAC dosage should not be less than 1500 kg/d to ensure the effluent TP meets the standard.
(3)
Closely monitor the influent C/N ratio. When online monitoring indicates a decrease in the influent C/N ratio, the carbon source dosage should be increased to reduce the risk of TN and TP exceedance. Conversely, when the influent C/N ratio increases, the carbon source dosage should be promptly reduced to mitigate the risk of COD exceedance. For detailed schemes, refer to Section 3.3.3.
(4)
In winter, when low temperatures hinder TN removal, the effluent TN removal efficiency can be enhanced by appropriately increasing the internal reflux ratio (around 150%) and external reflux ratio (around 100%), and reducing the DO level (1.5~2 mg/L) in the oxic tank. Considering energy consumption, priority should be given to reducing the DO level.

3.4.2. Practical Application

Since January 2024, the sewage treatment plant has adopted the above operation optimization scheme and effectively improved the effluent quality through non-engineering methods. As of June 2024, compared with the same period in 2023, the effluent COD, TN, NH4+-N, and TP concentrations were reduced by 3.1%, 12.7%, 24.1%, and 18.9%, respectively, and the dosage of the carbon source was also reduced by 24.2% (Figure 6). According to historical data, the price of 30% sodium acetate solution as an additional carbon source in the WWTP is 937 CNY/t. After adopting the optimization scheme, the plant can save CNY 1040 of operating cost per day, and CNY 379,625 per year. At the same time, according to the carbon emission accounting method in technical specification for low carbon operation evaluation of municipal treatment plant (T/CAEPI 49-2022) [39], this reduced carbon source dosage can reduce 1760 kg of carbon dioxide emissions per day, or 642.4 t of carbon dioxide emissions per year.

4. Conclusions

Considering the impact of seasonal temperature variations on the biological treatment in WWTPs, a successful simulation of the target WWTP was conducted using GPS-X software. A sensitivity analysis was performed on 128 stoichiometric and kinetic parameters related to the removal of key pollutants, identifying 16 parameters that significantly influence the effluent concentrations of COD, TN, NH4+-N, and TP. Based on the variations in the average water temperature, the year was divided into three seasons: winter, spring and autumn, and summer, with parameters calibrated accordingly to develop a reliable simulation model. According to the problems encountered in different seasons, the model was used to investigate the effects of the influent flow rate, influent C/N ratio, PAC dosage, internal and external reflux ratios, and DO levels on the effluent water quality. Optimization schemes were provided for each scenario; the WWTP also effectively reduced the effluent pollutant concentration and carbon source dosage through the implementation of the schemes.
The findings of this study demonstrate that mathematical simulation software, such as GPS-X, can play a key role in optimizing the operation of and providing management strategies for existing municipal WWTPs. Furthermore, with the growing emphasis on carbon reduction across the entire industry, software like GPS-X also provides valuable insights and methodologies for improving energy efficiency and reducing consumption in municipal WWTPs in the future.

Supplementary Materials

The following supporting information can be downloaded at: https://www.mdpi.com/article/10.3390/w17070994/s1, Table S1: the average operational data over the past three years (2021~2023); Table S2: the average water temperatures, the influent water quality, and quantity for each season.

Author Contributions

Writing—original draft preparation, formal analysis, investigation, visualization, Y.T.; writing—review and editing, methodology, Z.H.; data curation, investigation, H.C.; data curation, investigation, J.X.; conceptualization, writing—review and editing, funding acquisition, L.W. All authors have read and agreed to the published version of the manuscript.

Funding

This research was funded by the “Key Program of Social Development, Jiangsu Province Science and Technology Department (No. BE2021619)”.

Data Availability Statement

Data are contained within the article and Supplementary Materials.

Conflicts of Interest

Authors Hude Cheng, Jianjian Xiao were employed by the company Guobang Water Services Co., Ltd. The remaining authors declare that the research was conducted in the absence of any commercial or financial relationships that could be construed as a potential conflict of interest. The funders had no role in the design of the study; in the collection, analyses, or interpretation of data; in the writing of the manuscript; or in the decision to publish the results.

References

  1. Poblete, I.; Araujo, O.; de Medeiros, J.L. Sewage-Water Treatment and Sewage-Sludge Management with Power Production as Bioenergy with Carbon Capture System: A Review. Processes 2022, 10, 788. [Google Scholar] [CrossRef]
  2. Xu, A.; Wu, Y.H.; Chen, Z.; Wu, G.X.; Wu, Q.Y.; Ling, F.Q.; Huang, W.E.; Hu, H.Y. Towards the new era of wastewater treatment of China: Development history, current status, and future directions. Water Cycle 2020, 1, 80–87. [Google Scholar] [CrossRef]
  3. Henze, M.; Gujer, W.; Mino, T.; Matsuo, T.; Wentzel, M.C.; Marais, G.; Van Loosdrecht, M. Activated Sludge Model No.2d, ASM2d. Water Sci. Technol. 1999, 39, 165–182. [Google Scholar] [CrossRef]
  4. Carrette, R.; Bixio, D.; Thoeye, C.; Ockler, P. Full-scale application of the IAWQ ASM No. 2d model. Water Sci. Technol. 2001, 44, 17–24. [Google Scholar] [CrossRef]
  5. Elawwad, A.; Zaghloul, M.; Abdel-Halim, H. Simulation of municipal-industrial full scale WWTP in an arid climate by application of ASM3. J. Water Reuse Desalin. 2017, 7, 37–44. [Google Scholar] [CrossRef]
  6. Srivastava, S.; Brar, S.K.; Rao, S.; Kumar, P. Assessing operational issues in a modular sewage treatment plant and providing remedies via comprehensive modeling and simulation through GPS-X. J. Water Process. Eng. 2024, 57, 104678. [Google Scholar] [CrossRef]
  7. He, S.J.; Zhou, J.F.; Zhou, L.; Yang, N.; Gao, J.S.; Zhu, J.; Chen, J.W.; Chen, J.J. Assessment and modeling of effluent quality, economic benefits, and greenhouse gas reduction for receiving brewery wastewater on A2O by GPS- X. Sci. Total Environ. 2023, 883, 163671. [Google Scholar] [CrossRef]
  8. Ilie, M.; Robescu, D.N.; Ghita, G. Modelling and Simulation of Organic Matter Biodegradation Processes in Aeration Tanks with Activated Sludge. Rev. De Chim. 2009, 60, 529–532. [Google Scholar]
  9. Sheik, A.G.; Seepana, M.M.; Ambati, S.R. A Model-Based Approach to Study the Effect of Temperature in Plant-Wide Biological Wastewater Treatment Plants. J. Water. Chem. Technol. 2022, 44, 182–190. [Google Scholar] [CrossRef]
  10. Shao, Y.T.; Wang, Y.; Wang, H.C.; Liu, G.H.; Qi, L.; Xu, X.L.; Zhang, J.B.; Liu, S.; Sun, W.Z. Effect of operating temperature on the efficiency of ultra-short-sludge retention time activated sludge systems. Environ. Sci. Pollut. Res. 2021, 28, 39257–39267. [Google Scholar] [CrossRef]
  11. Alisawi, H. Performance of wastewater treatment during variable temperature. Appl. Water Sci. 2020, 10, 89. [Google Scholar] [CrossRef]
  12. Zhang, B.; Yu, Q.W.; Yan, G.Q.; Zhu, H.B.; Xu, X.Y.; Zhu, L. Seasonal bacterial community succession in four typical wastewater treatment plants: Correlations between core microbes and process performance. Sci. Rep. 2018, 8, 4566. [Google Scholar] [CrossRef]
  13. Wang, Q.; Gong, C.; Wei, B.; Liu, W.; Zhang, P.; Duan, Y.; Song, J.; Wang, L. Analysis of wastewater treatment plant performance and sludge characteristics under seasonal climate change. Water Wastewater Eng. 2021, 47, 49–54. [Google Scholar]
  14. Cao, J.; Yang, E.; Xu, C.; Zhang, T.; Xu, R.; Fu, B.; Feng, Q.; Fang, F.; Luo, J. Model-based strategy for nitrogen removal enhancement in full-scale wastewater treatment plants by GPS-X integrated with response surface methodology. Sci. Total Environ. 2021, 769, 144851. [Google Scholar] [CrossRef] [PubMed]
  15. Mu’Azu, N.D.; Alagha, O.; Anil, I. Systematic Modeling of Municipal Wastewater Activated Sludge Process and Treatment Plant Capacity Analysis Using GPS-X. Sustainability 2020, 12, 8182. [Google Scholar] [CrossRef]
  16. Jiang, B.C.; Ma, F.; Wei, L.; Guo, J.B.; Li, A. Operational Conditions and Improvement Methods of Municipal Wastewater Treatment Plants under Low Temperatures in Northern China. In Environment Materials and Environment Management Pts 1-3; Du, Z.Y., Sun, X.B., Eds.; International Conference of Environment Materials and Environment Management; Routledge: Oxfordshire, UK, 2010; Volume 113–116, p. 651. [Google Scholar]
  17. Lawrence, J.; Giurea, R.; Bettinetti, R. The Impact of Seasonal Variations in Rainfall and Temperature on the Performance of Wastewater Treatment Plant in the Context of Environmental Protection of Lake Como, a Tourist Region in Italy. Appl. Sci. 2024, 14, 11721. [Google Scholar] [CrossRef]
  18. Hu, C.; He, Q.; Xu, Z.; Zhu, J.; Li, H.; Lang, F. Operation and Control of Reversed A2/O Process Based on Seasonal Temperature Variation. China Water Wastewater 2012, 28, 126–129. [Google Scholar]
  19. Pilz, F.; Svardal, K.; Kreuzinger, N.; Krampe, J. Model-based dynamic simulation study to boost the WWTP performance in winter tourism regions. J. Water Process. Eng. 2024, 61, 105266. [Google Scholar] [CrossRef]
  20. DB 32/4440-2022; Discharge Standard of Pollutants for Municipal Wastewater Treatment Plant. Standards Press of China: Beijing, China, 2022.
  21. EPA US. QUAL2E—The Enhanced Stream Water Quality Model EPA/823/B-95/003; Environmental Research Laboratory: Athens, GA, USA, 1987.
  22. Liwarska-Bizukojc, E.; Biernacki, R. Identification of the most sensitive parameters in the activated sludge model implemented in BioWin software. Bioresour. Technol. 2010, 101, 7278–7285. [Google Scholar] [CrossRef]
  23. Del Pozo, R.; Tas, D.O.; Dulkadiroglu, H.; Orhon, D.; Diez, V. Biodegradability of slaughterhouse wastewater with high blood content under anaerobic and aerobic conditions. J. Chem. Technol. Biotechnol. 2003, 78, 384–391. [Google Scholar] [CrossRef]
  24. Roeleveld, P.J.; van Loosdrecht, M. Experience with guidelines for wastewater characterisation in The Netherlands. Water Sci. Technol. 2002, 45, 77–87. [Google Scholar] [CrossRef]
  25. Henze, M.; Gujer, W.; Mino, T.; Van Loosedrecht, M. Activated Sludge Models ASM1, ASM2, ASM2d and ASM3; IWA Publishing: London, UK, 2006; ISBN 1780402368. [Google Scholar]
  26. Dold, P.L.; Jones, R.M.; Bye, C.M. Importance and measurement of decay rate when assessing nitrification kinetics. Water Sci. Technol. 2005, 52, 469–477. [Google Scholar] [CrossRef]
  27. Aguilar, M.I.; Lloréns, M.; Fernández-Garrido, J.M.; Pérez-Marín, A.B.; Ortuño, J.F.; Meseguer, V.F. Heavy metals effect on the heterotrophic activity of activated sludge. Int. J. Environ. Sci. Technol. 2020, 17, 3111–3118. [Google Scholar] [CrossRef]
  28. Liau, K.F.; Shoji, T.; Ong, Y.H.; Chua, A.S.M.; Yeoh, H.K.; Ho, P.Y. Kinetic and stoichiometric characterization for efficient enhanced biological phosphorus removal (EBPR) process at high temperatures. Bioprocess. Biosyst. Eng. 2015, 38, 729–737. [Google Scholar] [CrossRef]
  29. Bornemann, C.; Londong, J.; Freund, M.; Nowak, O.; Otterpohl, R.; Rolfs, T. Hinweise zur dynamischen Simulation von Belebungsanlagen mit dem Belebtschlammodell Nr. 1 der IAWQ. KA. Korrespondenz Abwasser 1998, 45, 455–462. [Google Scholar]
  30. Spanjers, H.; Vanrolleghem, P.; Nguyen, K.; Vanhooren, H.; Patry, G.G. Towards a simulation-benchmark for evaluating respirometry-based control strategies. Water Sci. Technol. 1998, 37, 219–226. [Google Scholar] [CrossRef]
  31. Lopez-Vazquez, C.M.; Mithaiwala, M.; Moussa, M.S.; van Loosdrecht, M.C.M.; Brdjanovic, D. Coupling ASM3 and ADM1 for wastewater treatment process optimisation and biogas production in a developing country: Case-study Surat, India. J. Water Sanit. Hyg. Dev. 2013, 3, 12–25. [Google Scholar] [CrossRef]
  32. Eidroos, A. Optimization of Wastewater Treatment Plant Using Plant-Wide modeling Tool: Reysut WWTP Salalah-Oman [Case Sstudy]. Master’s Thesis, UNESCO-IHE Institute for Water Education, Delft, The Netherlands, 2014. [Google Scholar]
  33. Rieger, L.; Gillot, S.; Langergraber, G.; Ohtsuki, T.; Shaw, A.; Takacs, I.; Winkler, S. Guidelines for Using Activated Sludge Models; IWA Publishing: London, UK, 2012; ISBN 1843391740. [Google Scholar]
  34. Elawwad, A.; Matta, M.; Abo-Zaid, M.; Abdel-Halim, H. Plant-wide modeling and optimization of a large-scale WWTP using BioWin’s ASDM model. J. Water Process. Eng. 2019, 31, 100819. [Google Scholar] [CrossRef]
  35. Zhao, W.H.; Huang, Y.; Wang, M.X.; Pan, C.; Li, X.Y.; Peng, Y.Z.; Li, B.K. Post-endogenous denitrification and phosphorus removal in an alternating anaerobic/oxic/anoxic (AOA) system treating low carbon/nitrogen (C/N) domestic wastewater. Chem. Eng. J. 2018, 339, 450–458. [Google Scholar] [CrossRef]
  36. Zhou, Z.; Li, H.; Wang, Y.; Wang, S.; Li, J. Research on low-carbon operation mode in AAO-based wastewater treatment plants with low C/N influent. China Environ. Sci. 2022, 42, 5088–5099. [Google Scholar]
  37. Feng, H.; Zhao, M.; Ding, S. Optimal Control of Biological Nitrogen Removal in A~2/O Process of WWTP. China Water Wastewater 2021, 37, 102–106. [Google Scholar]
  38. Jiang, L.M.; Zhang, W.; Li, Y.H.; Shao, Y.J.; Zhang, Z.J.; Zhang, M.; He, J.L.; Qiu, J.; Li, W.X.; Wang, J.W.; et al. Applying mass flow analysis and aeration optimization strategy to reduce energy consumption of a full-scale anaerobic/anoxic/oxic system. J. Water Process. Eng. 2023, 54, 104037. [Google Scholar] [CrossRef]
  39. T/CAEPI 49-2022; Technical Specification for Low-Carbon Operation Evaluation of Sewage Treatment Plant. China Association of Environmental Protection Industry: Beijing, China, 2022.
Figure 1. Schematic of the WWTP model.
Water 17 00994 g001
Figure 2. (a) Monthly removal rates, flow, and temperature conditions of the WWTP; (b) components of influent COD, TN, and TP; (c) results of sensitivity analysis; (d) MAE and MRE results of COD, NH4+-N, TN, and TP of effluent in each season.
Water 17 00994 g002
Figure 3. Validation results of the model simulation based on the measured and simulated concentrations of pollutants in the effluents, (a) COD; (b) TN; (c) NH4+-N; (d) TP (different background colors mean different seasons, blue for winter, green for spring and summer, yellow for summer).
Water 17 00994 g003
Figure 4. (a) The impact of influent flow on effluent COD concentration; (b) the impact of influent flow on effluent TN concentration; (c) the impact of influent flow on effluent NH4+-N concentration; (d) the impact of influent flow on effluent TP concentration; (e) the impact of PAC dosage on effluent water quality under summer storm condition.
Water 17 00994 g004
Figure 5. (a) The impact of carbon source addition, C/N = 1.9; (b) the impact of carbon source addition, C/N = 2.8; (c) the impact of carbon source addition, C/N = 3.7; (d) the impact of carbon source addition, C/N = 4.6; (e) the impact of different internal reflux ratios; (f) the impact of different external reflux ratios; (g) the impact of DO concentrations in the oxic tank.
Water 17 00994 g005
Figure 6. Comparison of effluent quality and carbon source dosage before and after the implementation of the optimization scheme.
Water 17 00994 g006
Table 1. Comparison of ASM series models and mantis2 model.
ModelKey FeaturesNumber of Processes
ASM1
  • Focusing on the basic principle, process, and dynamic simulation of wastewater biological treatment;
  • Nitrogen removal is incorporated into the model.
8
ASM2
  • The process of biological phosphorus removal by phosphorus-accumulating bacteria (PAO) is introduced;
  • Anaerobic hydrolysis, fermentation, and other reactions are added.
19
ASM2d
  • Extend denitrifying phosphorus removal process;
  • Enhance nitrogen and phosphorus removal system.
21
ASM3
  • Modification of ASM1, focusing on the storage process of organic matter;
  • Excluding phosphorus removal process.
12
Mantis 2 (GPS-X)
  • Carbon, nitrogen, and phosphorus removal with integrated anaerobic digestion processes;
  • Two-step nitrification, two-step denitrification, denitrification on methanol, and Anaerobic Ammonium Oxidation (ANNAMOX) are adopted.
56
Table 2. The main design parameters of the WWTP.
ParameterUnitValue
Phase 1Phase 2
Hydraulic Retention Time (HRT)h1117.7
HRT of anaerobic tankh1.481.2
HRT of anoxic tankh2.04.2
HRT of oxic tankh7.5212.3
Mixed Liquid Suspended Solids (MLSS)mg/L36003500
Reflux ratio of sludge-50~100%
Reflux ratio of nitrification liquid-100~200%
DO of oxic tankmg/L2~3
Table 3. Default and adjusted values of dynamic and stoichiometric parameters.
ParameterSymbolDefault Value in GPS-XSeasonCalibration ValueReferred
Values
References
Aerobic decay coefficient of PAOsbbpcon0.2Spring and autumn0.100.10~0.20[25]
Summer0.15
Aerobic decay rate of AOBbnhcon0.17Spring and autumn0.13Around 0.15[26]
Summer0.13
Winter0.10
Aerobic yield of OHOs on soluble substratesyhaircon0.666Spring and autumn0.800.4~0.8[27]
Summer0.75
Winter0.80
Aerobic yield of PAOsypaircon0.639All0.750.625~0.821[28]
Aerobic yield reduction coefficient of OHOsbhcon0.62Spring and autumn0.450.4~0.65[29]
Summer0.4
Winter0.5
Anaerobic yield of OHOs on soluble substratesyhanocon0.533Spring and autumn0.550.50~0.65[25]
Summer0.5
Winter0.5
Hydrolysis rate constant of Xskhcon3All2.52~5.2[30]
Maximum specific growth rate (of OHOs) on substratemuhcon3.2Spring and autumn33~6[25]
Summer4
Winter3
Maximum specific growth rate of AOBmunchcon0.9Spring and autumn10.25~2.10[31]
Summer0.8
Winter1.2
PHA storage yieldypo4con0.4Spring and autumn0.250.10~0.40[28]
Winter0.3
Reduction factor for anaerobic hydrolysisnsanaerxcon0.4All0.30.2~0.4[25]
Reduction factor for anoxic hydrolysisnsanoxcon0.8All0.60.6~0.8[25]
Saturation coefficient of ammonia for AOBkalsnhcon0.7Summer0.650.35~1.00[32]
Disclaimer/Publisher’s Note: The statements, opinions and data contained in all publications are solely those of the individual author(s) and contributor(s) and not of MDPI and/or the editor(s). MDPI and/or the editor(s) disclaim responsibility for any injury to people or property resulting from any ideas, methods, instructions or products referred to in the content.

