Article

Toward Urban Micro-Renewal: Integrating “BMP-Plan” and “LID-Design” for Enhanced Stormwater Control—A Case Study

1
Art Department, College of Cultural Relics and Art, Hebei Oriental University, Langfang 065001, China
2
School of Architecture & Art, Shijiazhuang Tiedao University, Shijiazhuang 050043, China
3
Department of Landscape Architecture, School of Horticultural & Forestry Sciences, Huazhong Agricultural University, Wuhan 430070, China
4
Key Laboratory of Urban Agriculture in Central China, Ministry of Agriculture and Rural Affairs, Wuhan 430070, China
5
Shandong Jianzhu University Design Group Co., Ltd., Jinan 250100, China
*
Author to whom correspondence should be addressed.
Water 2025, 17(7), 992; https://doi.org/10.3390/w17070992
Submission received: 20 January 2025 / Revised: 13 March 2025 / Accepted: 18 March 2025 / Published: 28 March 2025
(This article belongs to the Special Issue Urban Drainage Systems and Stormwater Management)

Abstract

:
This study addresses the growing inadequacies of traditional architectural concepts and techniques in stormwater management amid the increasing frequency of extreme weather events, particularly in densely built urban micro-spaces. To tackle these challenges, we propose an integrated theoretical and practical framework applied to a case study of a small-scale urban public space in Chang’an District, Shijiazhuang City, Hebei Province, covering an area of about 2.15 hectares in North China. The framework combines Best Management Practices Planning (BMP-P) with Low Impact Development Design (LID-D). The framework optimizes sub-catchment delineation, strategically locates drainage outlets, and configures network layouts to reduce runoff path lengths, thereby reducing total runoff volume, enhancing drainage capacity, and alleviating surface water accumulation, which, in turn, informs the parametric design of LID facilities. In the BMP-P phase, four source-control measures were developed based on runoff control and stormwater retention: adjusting terrain slopes, adding or removing curbs and facilities, redistributing infiltration areas, and adjusting drainage outlet and piping layouts. By shortening runoff paths and reducing potential waterlogging areas, these measures effectively reduced total runoff volume (Trv) by 31.5% to 35.7% and peak runoff volume (Prv) by 19.4% to 32.4%. Moreover, by remodeling the stormwater network with a different layout, larger pipe diameters, and substantially increased network capacity, the total discharge (Tdv) increased by 1.8% to 50.2%, and the peak discharge rate (Pdr) increased by 100% to 550%, thus minimizing surface flooding. In the LID-D phase, we developed a Grasshopper-based parametric design program for the layout and design of LID facilities. This approach significantly reduces interdisciplinary communication costs and enhances urban planning efficiency. By integrating BMP and LID strategies, the proposed framework offers a flexible, rapid, and efficient solution for achieving resilient stormwater management in the context of urban micro-renewal.

1. Introduction

The rapid urbanization process has led to the creation of substantial impervious urban surfaces, significantly altering the natural hydrological cycle of urban areas and making urban waterlogging a global issue [1]. At the same time, against the background of global warming, the frequent occurrence of extreme weather conditions (such as seasonal sustained rainfall and prolonged droughts) also brings enormous pressure and challenges to urban stormwater management systems [2]. It was not until 2013 that Chinese scholars learnt and absorbed the advanced knowledge regarding urban drainage management from various countries, prompting the government to launch the construction of “Sponge City”. Best management practice (BMP) and Low impact development (LID) are the core terms and measures of “Sponge City” and are crucial for regulating urban runoff [3]. Due to the relatively late implementation of the “Sponge City” policy, more than half of China’s cities have been constructed without its adoption. Early urban stock spaces are limited by prior knowledge and artistic aesthetics driven by singular planning and design approaches; these are no longer able to meet the functional requirements of resilient cities to withstand flood or waterlogging disasters. Therefore, there is an urgent need to improve urban space optimization aiming to solve hydrological issues.
Best Management Practices (BMPs) refer to a series of validated and effective structural and non-structural measures aimed at controlling and reducing pollutant discharges, improving stormwater runoff management, and protecting water quality and the ecological environment through engineering techniques, management systems, and operational standards. These measures are mainly categorized into structural BMPs and non-structural BMPs. Structural BMPs are primarily reflected in specific practices and are conceptually similar to Low Impact Development (LID) facilities, with typical examples including bio-retention units, rain gardens, permeable pavements, and green roofs [4,5]. As an environmental management strategy, LID effectively mitigates the impact of urban development on stormwater runoff by simulating natural hydrological processes. Specifically, LID employs green infrastructure measures such as permeable pavements, green roofs, rain gardens, and stormwater retention or infiltration systems to achieve the on-site infiltration, storage, purification, and gradual release of stormwater, thereby reducing runoff from heavy rainfall, minimizing water quality pollution, and enhancing the sustainability of urban ecological environments. Based on this, a team led by Jia Haifeng introduced the concept of “Low Impact Development-based Best Management Practices (LID-BMPs)” to refer to one of the most practical and cost-effective structural BMPs in urban spatial research [3,6,7]. However, compared to structural BMPs, non-structural BMPs offer more comprehensive guidance for spatial management optimization. For example, the “Planning and Management” measures proposed in the white paper [8] emphasize the prioritization of evaluating a site’s hydrological conditions and the rationality of engineering measures during the planning and design phase, as well as achieving source control through urban spatial optimization, which results in engineering optimization that cannot be achieved by simply adding or optimizing the layout of LID facilities.
Current research on small-scale urban spatial planning primarily focuses on case studies and the evaluation and comparison of stormwater management efficiency using single or multiple LID facility combinations [3,8]. For example, Agnieszka Jaszczak proposed a green infrastructure-based design concept, presenting a comparative study of cases from Poland, Slovakia, and Lithuania to demonstrate how to achieve stormwater retention, infiltration, and regulation in limited urban spaces. This approach not only mitigates flood risks and improves stormwater utilization but also enhances urban landscapes and ecological environments [9]. On the other hand, Ayla Rachel Tarr and colleagues conducted a multi-perspective study on Phoenix’s stormwater management system. Through performance testing of small-scale bioretention systems, they quantified their effectiveness in flood control and water quality improvement, showing that even in arid and semi-arid environments, stormwater management facilities in small spaces can still play a significant role. Additionally, they explored the integration of adaptability and sustainability concepts into engineering education, emphasizing the importance of interdisciplinary collaboration in future urban stormwater management design [6]. Furthermore, Jianguang Xie et al. used the SWMM model and the Chicago rainfall model to compare the effectiveness of traditional development patterns and Low Impact Development (LID) strategies in stormwater management for small urban spaces. By simulating the combined effects of grass swales and permeable pavements under different rainfall return periods, the study found that LID facilities significantly reduced total runoff and peak flow, delayed runoff initiation, and avoided peak occurrence times. Moreover, the combined use of these two facilities yielded significantly better results than their individual application [8]. In addition, most existing studies treat LID as a core concept and use structural BMPs as simulation practices to study the spatial layout of facilities. For instance, Jia Haifeng, Lu Ye, Yu Shiliang, and Chen Ye [10] integrated “LID-BMPs” within community planning, creating three scenarios through the BMPDSS model under existing planning and design schemes to assess and optimize the specifications of different BMP types. Overall, BMPs are more commonly seen as structural additions to existing planning schemes, still fundamentally relying on LID facilities rather than being promoted as an independent spatial optimization concept.
The fundamental principle of LID facilities is to reduce surface runoff by increasing infiltration, thereby achieving the goal of urban hydrological governance. The practice network of hydrological environmental mechanisms and objectives to mitigate flood risk is constituted jointly by non-structural BMPs and LID facilities [11], rather than simply adding or adjusting some LID facilities to achieve optimal results. Through historical research on BMPs, we found that fully utilizing the planning and management thinking of non-structural BMPs, combined with low-impact spatial optimization and reorganization methods, can better improve site drainage efficiency. Muqing, J., T. Guohang, B. Tian, W. Guifang, Z. Jingbiao, and H. Ruizhen [12] explored the impact of different spatial layouts on urban rainfall runoff, finding that different water flow lengths and area ratios, among other factors, significantly affected the state of urban stormwater runoff. Zhiheng, Z., J. Yinghe, H. Minyi and J. Jianhua [13] also found that the characteristic width of catchment areas, the average slope, and the setting of the drainage outlet significantly affected the rainwater simulation results of SWMM. These studies indicated that under the concept of low-impact development, the hydrological simulation effect of reorganizing urban spaces would be superior to the direct setting of LID facilities. Minor engineering modifications can significantly improve site drainage and infiltration efficiency, solving urban waterlogging issues.
In multi-scale urban spatial research, the deployment of LID facilities has become mainstream in hydrological model studies. Most studies first subjectively define the scale and layout of LID facilities, then verify their efficacy through stormwater simulation software, and finally, determine the quantity and placement of LID facility combinations through trial and error [14,15,16,17], without providing corresponding practical design plans. LID facilities, as a special kind of spatial facility, are often selectively neglected in terms of the design of their internal form [18]. Therefore, the question of how to practically transfer and apply small and micro-scale urban research outcomes to project practices is crucial, and the size and shape of LID facilities should be considered as being equally important as their layout and deployment [18,19,20]. Grasshopper, a visual programming plugin for Rhino, offers significant advantages by condensing numerous programming commands into individual components. It allows for the integration of data from multiple platforms and facilitates interdisciplinary collaboration through the use of programming languages. Ultimately, it enables the creation of a data-driven design system built on parametric design principles. This parametric approach not only streamlines the design process but also, through its programmatic nature, accurately determines the optimal location and size of LID facilities in the “LID-Design” steps, thus enhancing the effectiveness of scientific planning and facilitating efficient spatial layout.
While Grasshopper is predominantly applied in architectural design, environmental simulation, landscape architecture, and product design [21], there has been relatively limited research on its application in rainwater management and spatial design for LID facility layout. However, studies by Chensong, L. I. N., D. Yuxiang, C. Hongyu, and L. I. Xiong Chensong, L. I. N., D. Yuxiang, C. Hongyu, and L. I. Xiong [22], as well as by Sai Kumar Manapragada, N. V. Sai Kumar Manapragada, N. V. [19], demonstrated the practical applicability of Grasshopper in urban spatial design, particularly in scenarios aimed at achieving stormwater management objectives.
Therefore, this study creatively proposes an urban space optimization program based on BMPs and LID facilities, combining the planning and management philosophy of non-structural BMPs with the aesthetic and functional characteristics of LID facilities added to urban spaces. By integrating “BMPs-Planning” and “LID-Design” steps, the optimization and renovation of urban stock spaces are accomplished using the SWMM and Grasshopper. This framework not only enables the most efficient use of planning and design methods to achieve optimal hydrological management under the concept of LID but also facilitates the practice of optimizing micro-spaces based on the functional needs of resilient cities to resist urban waterlogging disasters.

2. Materials and Methods

2.1. Study Area

The study area is located on Beierhuan East Road in Chang’an District, Shijiazhuang City, Hebei Province, China (Latitude 38°04′54.49″ N, Longitude 114°30′09.05″ E). This represents a small-scale urban public space, covering an area of 2.15 hectares. The Chang’an District of Shijiazhuang is situated in the North China Plain, belonging to the temperate monsoon climate, with significant diurnal temperature variation and an annual average temperature of 10–20 °C. The average annual precipitation, based on meteorological data from 1970 to 2003, is 621.47 mm. Rainfall is predominantly concentrated in the summer months, and significant interannual variations have been observed, with distinct consecutive dry and wet periods.
The CAD plan data of the study area was provided by the China Railway Construction Corporation. According to local urban planning, the proportion of impervious areas composed of internal roads, plazas, and other surfaces (63.6%) is significantly higher than that of green spaces and gardens (36.4%). Stormwater runoff on the site follows the natural construction slope; however, deficiencies in the design and construction have led to suboptimal slope configurations. For instance, the green space is situated at a higher elevation than the adjacent hard-paved area, and localized depressions fall within drainage blind zones. This results in ineffective runoff convergence and increased water retention, ultimately compromising the drainage system’s efficiency in collecting and discharging stormwater. Figure 1 shows the location of the study area and the underlying surface conditions. Due to the long construction period and reliance on preliminary design drawings based on traditional architectural concepts and technologies, the constructed site lacks adequate rainwater management capacity. The local drainage system, which is a combined sewer system, is not sufficiently designed to handle high volumes of stormwater during heavy rainfall. Consequently, during wet periods, widespread waterlogging, drain overflow, and runoff pollution occur. The issue is primarily attributable to two factors: first, design deficiencies in the site topography lead to extended stormwater runoff paths and prolonged collection times, thereby intensifying runoff accumulation; second, the Inflow and Infiltration (I/I) phenomenon, wherein groundwater mixes with stormwater runoff in the drainage network due to construction defects, structural degradation, or non-compliant connections, compromises both drainage efficiency and water quality management [23,24].

2.2. Study Design and Data Processing

This study is based on the planning and management of non-structural BMPs, intending to first enhance the stormwater management efficiency of urban spaces through spatial reorganization and planning methods. Subsequently, it uses a parametric approach to add LID facilities and conduct morphological design, beautifying urban spaces while maintaining and stabilizing the natural hydrological functions of construction land. Figure 2 shows a research design diagram of the entire theoretical and practical framework.
In the “BMPs-Planning” phase, through field surveys of the study area, the following main issues were identified:
(1)
The elevation of green spaces in the study area is generally higher than that of the road surface, causing most rainwater to accumulate on impermeable surfaces;
(2)
Due to the lack and unreasonable layout of drainage outlets, surface water cannot be discharged, and curbs and other engineering facilities further cause the singularity of runoff routes;
(3)
Aging combined sewer systems are prone to capacity overload during intense rainfall events due to high discharge volumes, which can cause blockages and lead to overflows at downstream outfalls.
Targeting these three issues, we propose four optimization strategies from the aspects of runoff control and stormwater retention and drainage (see BMPs Management-Planning phase in Figure 2):
(1)
Adjusting terrain slopes: This includes modifying the site’s elevation to direct rainwater flow toward designated runoff areas, preventing accumulation on impermeable surfaces.
(2)
Adding or removing curbs and facilities: We suggest removing unnecessary curbs or adding drainage features to optimize the runoff path and ensure water flow toward the correct discharge points.
(3)
Redistributing infiltration areas: This involves increasing permeable surfaces, such as replacing impermeable pavements with permeable materials, to enhance water absorption and reduce runoff.
(4)
Adjusting drainage outlet and piping layouts: This includes expanding drainage outlets, adjusting pipe sizes, and modifying slopes to improve flow capacity and prevent blockages during heavy rainfall.
Based on these optimization strategies, we developed two spatial management planning schemes with distinct priorities. We then used SWMMH 5.2.011 software to compare the runoff-discharge and full pipe flow analysis results between the current baseline condition and the two schemes, selecting the best-performing scheme as the final optimization solution. In the LID-Design phase, all available LID facility types within the study area were integrated, and Grasshopper was employed to systematically determine the scale, location, and boundaries of each LID. This parametric design approach—detailed in Section 2.4.2—is based on preset parameters and algorithmic calculations.
In “LID-Design” phase, we integrated all available LID facility types within the study area and used Grasshopper to determine the scale, location, and boundaries of different types of LID facilities, enabling complex calculations and visual expressions based on preset parameters, and ultimately completing the LID facilities parametric design under the concept of low-impact development. Additionally, we organized the required data for the “BMPs-Planning phase” and the “LID-Design phase”. Table A1 in Appendix A lists all the data sources for the two phases respectively.

2.3. Selecting Spatial Optimization Schemes Using SWMMH 5.2

2.3.1. SWMM Description and Construction

The United States Environmental Protection Agency Storm Water Management Model (SWMM) is a dynamic rainfall-runoff simulation model used to simulate urban area single event or long-term runoff quantity and quality [25]. After several significant upgrades, the latest version is SWMMH 5.2.011. In this study, the latest version of SWMM was used to model urban space sites, requiring calculations of storm intensity in the study area, input boundaries and related parameters for sub-catchment areas, and various parameters for pipes based on the data entered into the model.
(1)
Calculate the storm intensity in the study area as the input parameter for the “rain gauge”.
The Chicago rainfall method was used to calculate the rainfall process curves for short-duration (return periods of 1, 5) and long-duration (return periods of 10, 20) in the study area. By consulting the relevant literature [26,27,28,29], we determined the storm intensity formula for different periods:
q = 167 A 1 + C l g P t + b n
In the formula, q represents the precipitation intensity, with units in mm·min−1; t represents the storm duration, with units in min. Based on the rainfall characteristics of the Shijiazhuang area, the rainfall duration for return periods of 1 year and 5 years was set to 120 min, while the rainfall duration for return periods of 10 years and 20 years was set to 1440 min.; A is the rainfall intensity parameter, which corresponds to the design rainfall amount for a 1 min return periods, with units in mm; C is the rainfall intensity variation parameter; P is the return periods; b is the rainfall duration correction parameter, with units in min, which is a time constant added to make the curve linear when taking the logarithm of both sides of the storm intensity formula; n is the storm attenuation index that varies according to the return periods (P).
Upon consulting the Shijiazhuang Sponge City Planning and Design Guidelines [26] and incorporating known parameters [28,29,30], the storm intensity formulas for Shijiazhuang City with return periods of 1–5 years and 10–20 years were obtained (Formulas (2) and (3)). These formulas have been applied multiple times in rainfall simulations for the Shijiazhuang area and have been proven to be effective and accurate.
The storm intensity formula for Shijiazhuang with a return period of 1–5 years:
q = 2764.184 1 + 0.898 lg P ( t + 13.75 ) 0.811
The storm intensity formula for Shijiazhuang with a return period of 10–20 years:
q = 2262.516 1 + 0.853 lg P ( t + 12.16 ) 0.752
(2)
Input sub-catchment boundaries and set related parameters
By adjusting the microtopography of the site, modifying road longitudinal slopes, adding drainage ditches, planning water retention measures, and re-planning the drainage outlets based on pipeline conditions, the runoff paths were modified to create a new sub-catchment division plan. They were then input into the “Sub-catchment Division” module under “Hydrology” in SWMM. Next, we measured the sub-catchment area, impervious area, and characteristic width from the CAD source files and entered these parameters into the module. The characteristic width of the watershed was calculated using Formula (4) [30,31].
W = S L
where W is the watershed’s characteristic width, S is the sub-catchment area in m2, and L is the runoff length within the sub-catchment in meters.
(3)
Input various parameters for pipes
We measured the pipe data from the CAD source files (see the pipes section of Data Prepared for “BMPs-Planning Phase” in Table A1) and input them into the “Conduits” and “Nodes” modules under “Hydraulics” in SWMM.

2.3.2. Optimization Plan Design

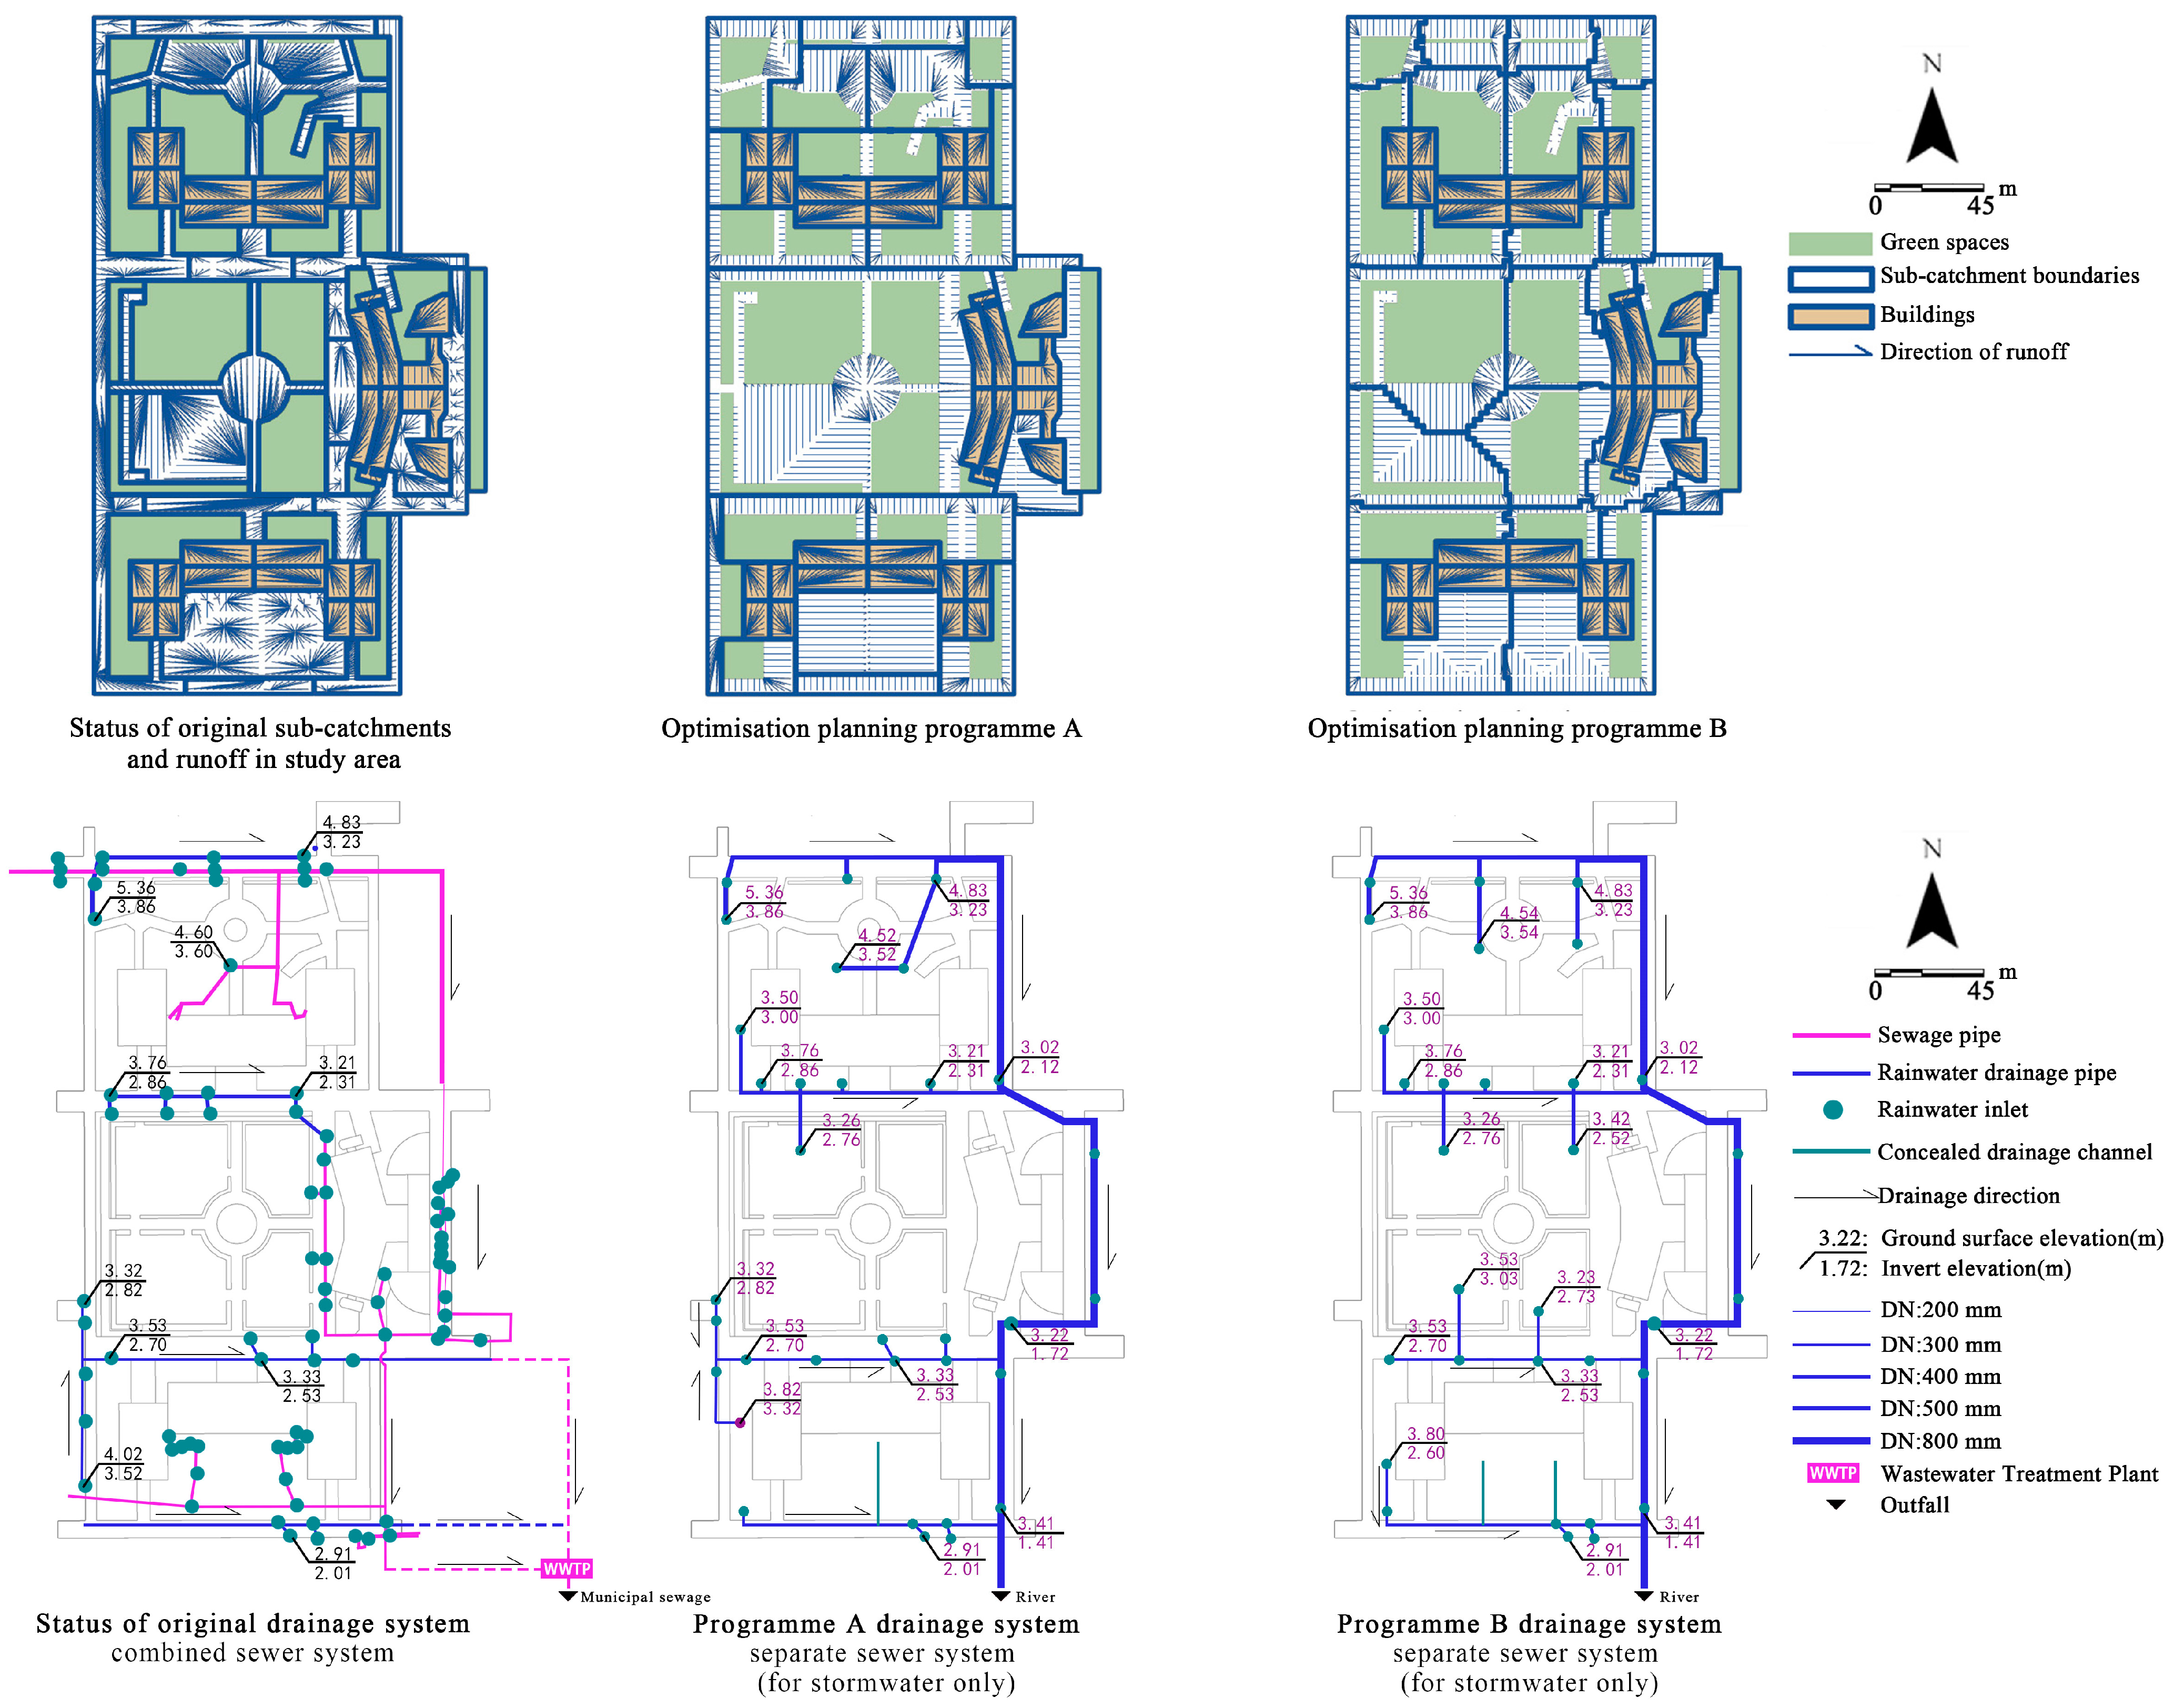
Based on the related issues and targeted solution strategies proposed in the research design section, we correspondingly proposed two different optimization schemes to re-optimize the sub-catchment area and morphology (see Figure 3).
Plan A used greenfield area balance as a sub-catchment optimization criterion. Therefore, the green space area percentage of each sub-catchment was set to approximately 35%. We improved drainage efficiency by adjusting the greening rate and drainage outlet settings for each sub-catchment. The greening rate was adjusted by modifying the terrain slope to change the site elevation, directing rainwater toward green spaces. The drainage outlet settings were optimized based on the specific runoff characteristics of each sub-catchment, with adjustments made to the number, location, or size of the outlets to facilitate effective water discharge.
Plan B used the reduction of impervious area runoff length as a sub-catchment optimization criterion, i.e., by increasing their characteristic width to enhance the drainage capacity of the impervious area in the sub-catchment, thereby improving the drainage speed. In actual scheme planning, we set the green space (the endpoint of stormwater runoff) as the center, using an appropriate runoff length within the threshold as the offset radius to determine the sub-catchment boundaries. Therefore, in this plan, the adjustment of facilities in the impervious area, namely, adjusting the site elevation and optimizing along the runoff line facilities, was prioritized. Subsequently, the green spaces within the site were fine-tuned based on drainage needs. Table 1 compares the important parameters after optimization of the two plans.
Regarding the drainage pipes, both plans converted the incomplete rainwater and sewage diversion pipes into complete systems and made some deletions and modifications to the existing stormwater pipes based on the adjustments of sub-catchments (Figure 3).

2.3.3. Model Validation

To verify the reliability of the model, this study used the Nash-Sutcliffe Efficiency coefficient [16] to evaluate the accuracy of the measured drainage pipe flow rates and rainfall simulation results for four roads: Qiushi Road, Xiaxin Road, Chunhua Road, and Caihong Road. The NSE coefficient assesses the impact of numerical errors on model accuracy.
The value of E ranged from −∞ to 1, where a value closer to 1 indicates good model quality, while a value much less than 1 suggests the model is unreliable. The measured values were chosen to start at 13:00 on 30 July 2023, using an ultrasonic flow meter, measuring the flow rates of drainage pipes on the four roads every 1 h.
N S E = 1 t = 1 T Q 0 t Q m t 2 t = 1 T Q 0 t Q 0 ¯ 2
The value of N S E represents the NSE coefficient, Q 0 for the measured value, Q m for the simulated value, Q t indicates the value at time t, and Q 0 ¯ represents the overall average of the measured values.

2.4. LID Facilities Design Using Grasshopper

2.4.1. Selection of LID Facility Types

After conducting a site survey, we analyzed the potential types of LID facilities that could be implemented at the location (see Table 2). Based on site conditions, stormwater management requirements, and practical feasibility, rain gardens and permeable pavements were selected as the optimal combination for stormwater management in this case study. In our optimization process, we employed a parameter optimization algorithm based on drainage distance and topographical elevation to determine the optimal configuration of these facilities.

2.4.2. Parametric Model Construction with Grasshopper

In this study, we used Grasshopper version 1.0.0007 to complete the optimization design for Rain Gardens (RGs) and Permeable Pavements (PPs).
The parametric design of RGs was divided into the following three steps (see Figure 4 and Figure 5):
(1)
Elevation data processing. We used the “Contour” component to convert site elevations into contour lines and arranged them in ascending order; then we used the “Move” component to align the contours on the same plane for subsequent Boolean operations.
(2)
Removing unavailable areas. We converted areas affected by paving, plants, pipelines, buildings, etc., into surface and perform Boolean intersection operations with the lowest elevation contour line using the “SDiff” component.
(3)
Boundary and shape generation. We calculated the area of the boundaries obtained in step (2) using the “Area” component and eliminated areas that were too small. We then divided the boundaries using the “Divide Curve” component and used the generated smooth curves as the shape outline curves for the RGs.
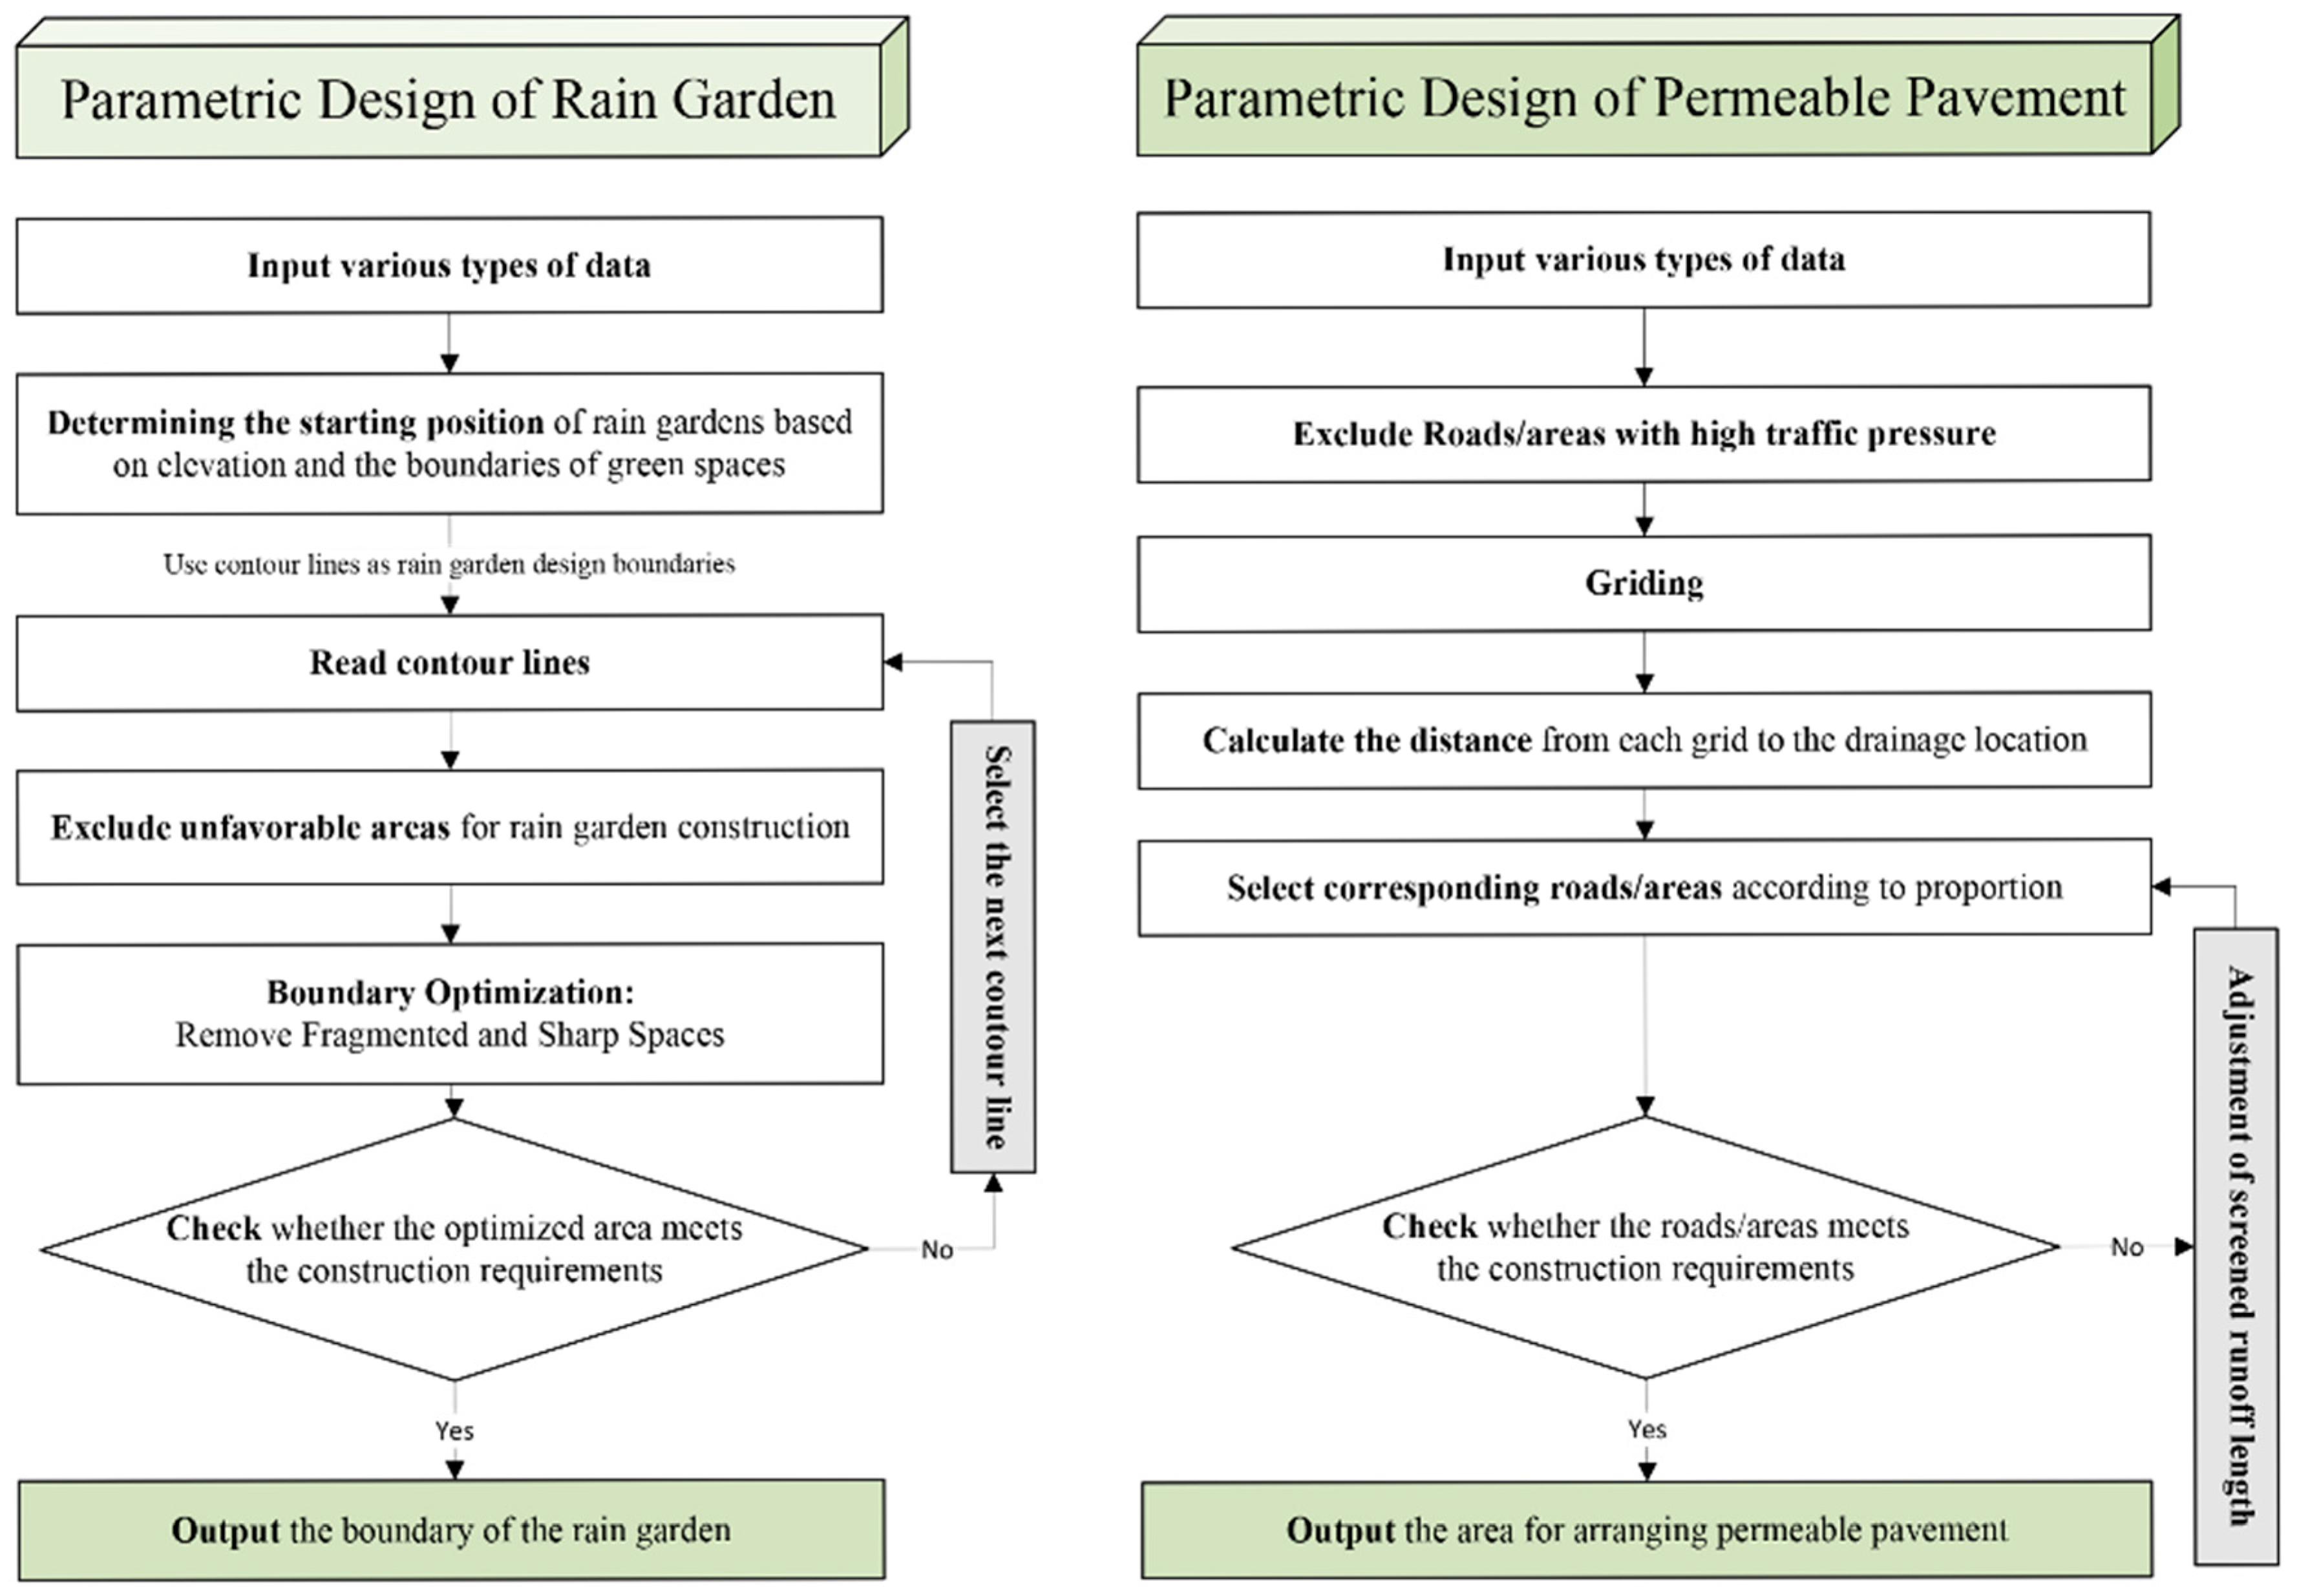
Figure 4. Parametric design workflow with Grasshopper.
Water 17 00992 g004
Figure 5. Parametric design illustrations of partial rain gardens and permeable pavements.
Water 17 00992 g005
The parametric design of PPs is divided into the following four steps (see Figure 4 and Figure 5):
(1)
Data processing. We used the “SDiff” component to remove areas unsuitable for PPs and used the “Isotrim” component to set 2 m × 2 m grid and extract the center points of each grid;
(2)
Calculating runoff distance. We used the “Pull Point” component to calculate the distance from each grid center to the nearest drainage outlet or green space boundary and sorted them from highest to lowest;
(3)
Boundary and shape generation. We extracted the corresponding grid points according to the required proportion and merged them into a whole shape to determine the location and boundary of the PPs.

3. Results

3.1. Model Validation Results

To validate the model’s reliability, the original site model was used to simulate the rainfall event on 30 July 2023, in Shijiazhuang City. The simulated flow rates of four stormwater drainage networks within the site were compared with actual flow rates from 13:00 to 18:00, with measurements taken hourly. The actual flow rates were recorded using ultrasonic flow meters.
The simulated values, measured values, and E values of the drainage pipes for different roads at different times are shown in Table 3 and Figure 6. The results indicated that all E values were more than 0, demonstrating good model quality, which could be used for data simulation and analysis.

3.2. Comparison of SWMM Simulation Results for ‘BMPs-Planning’ Phase

3.2.1. The Analysis of Surface Runoff-Discharge

(1)
Surface runoff
Waterlogging is a central problem in urban spaces where rainfall is concentrated. The sudden increase in runoff within a short period after a rainfall event and the carrying capacity of the pipes are the key factors that trigger the waterlogging phenomenon in urban spaces [32,33]. Therefore, this study used runoff-discharge analysis and full pipe flow state at the stormwater end of the four roads to compare the optimization effectiveness of the planning plans and as a basis for their selection.
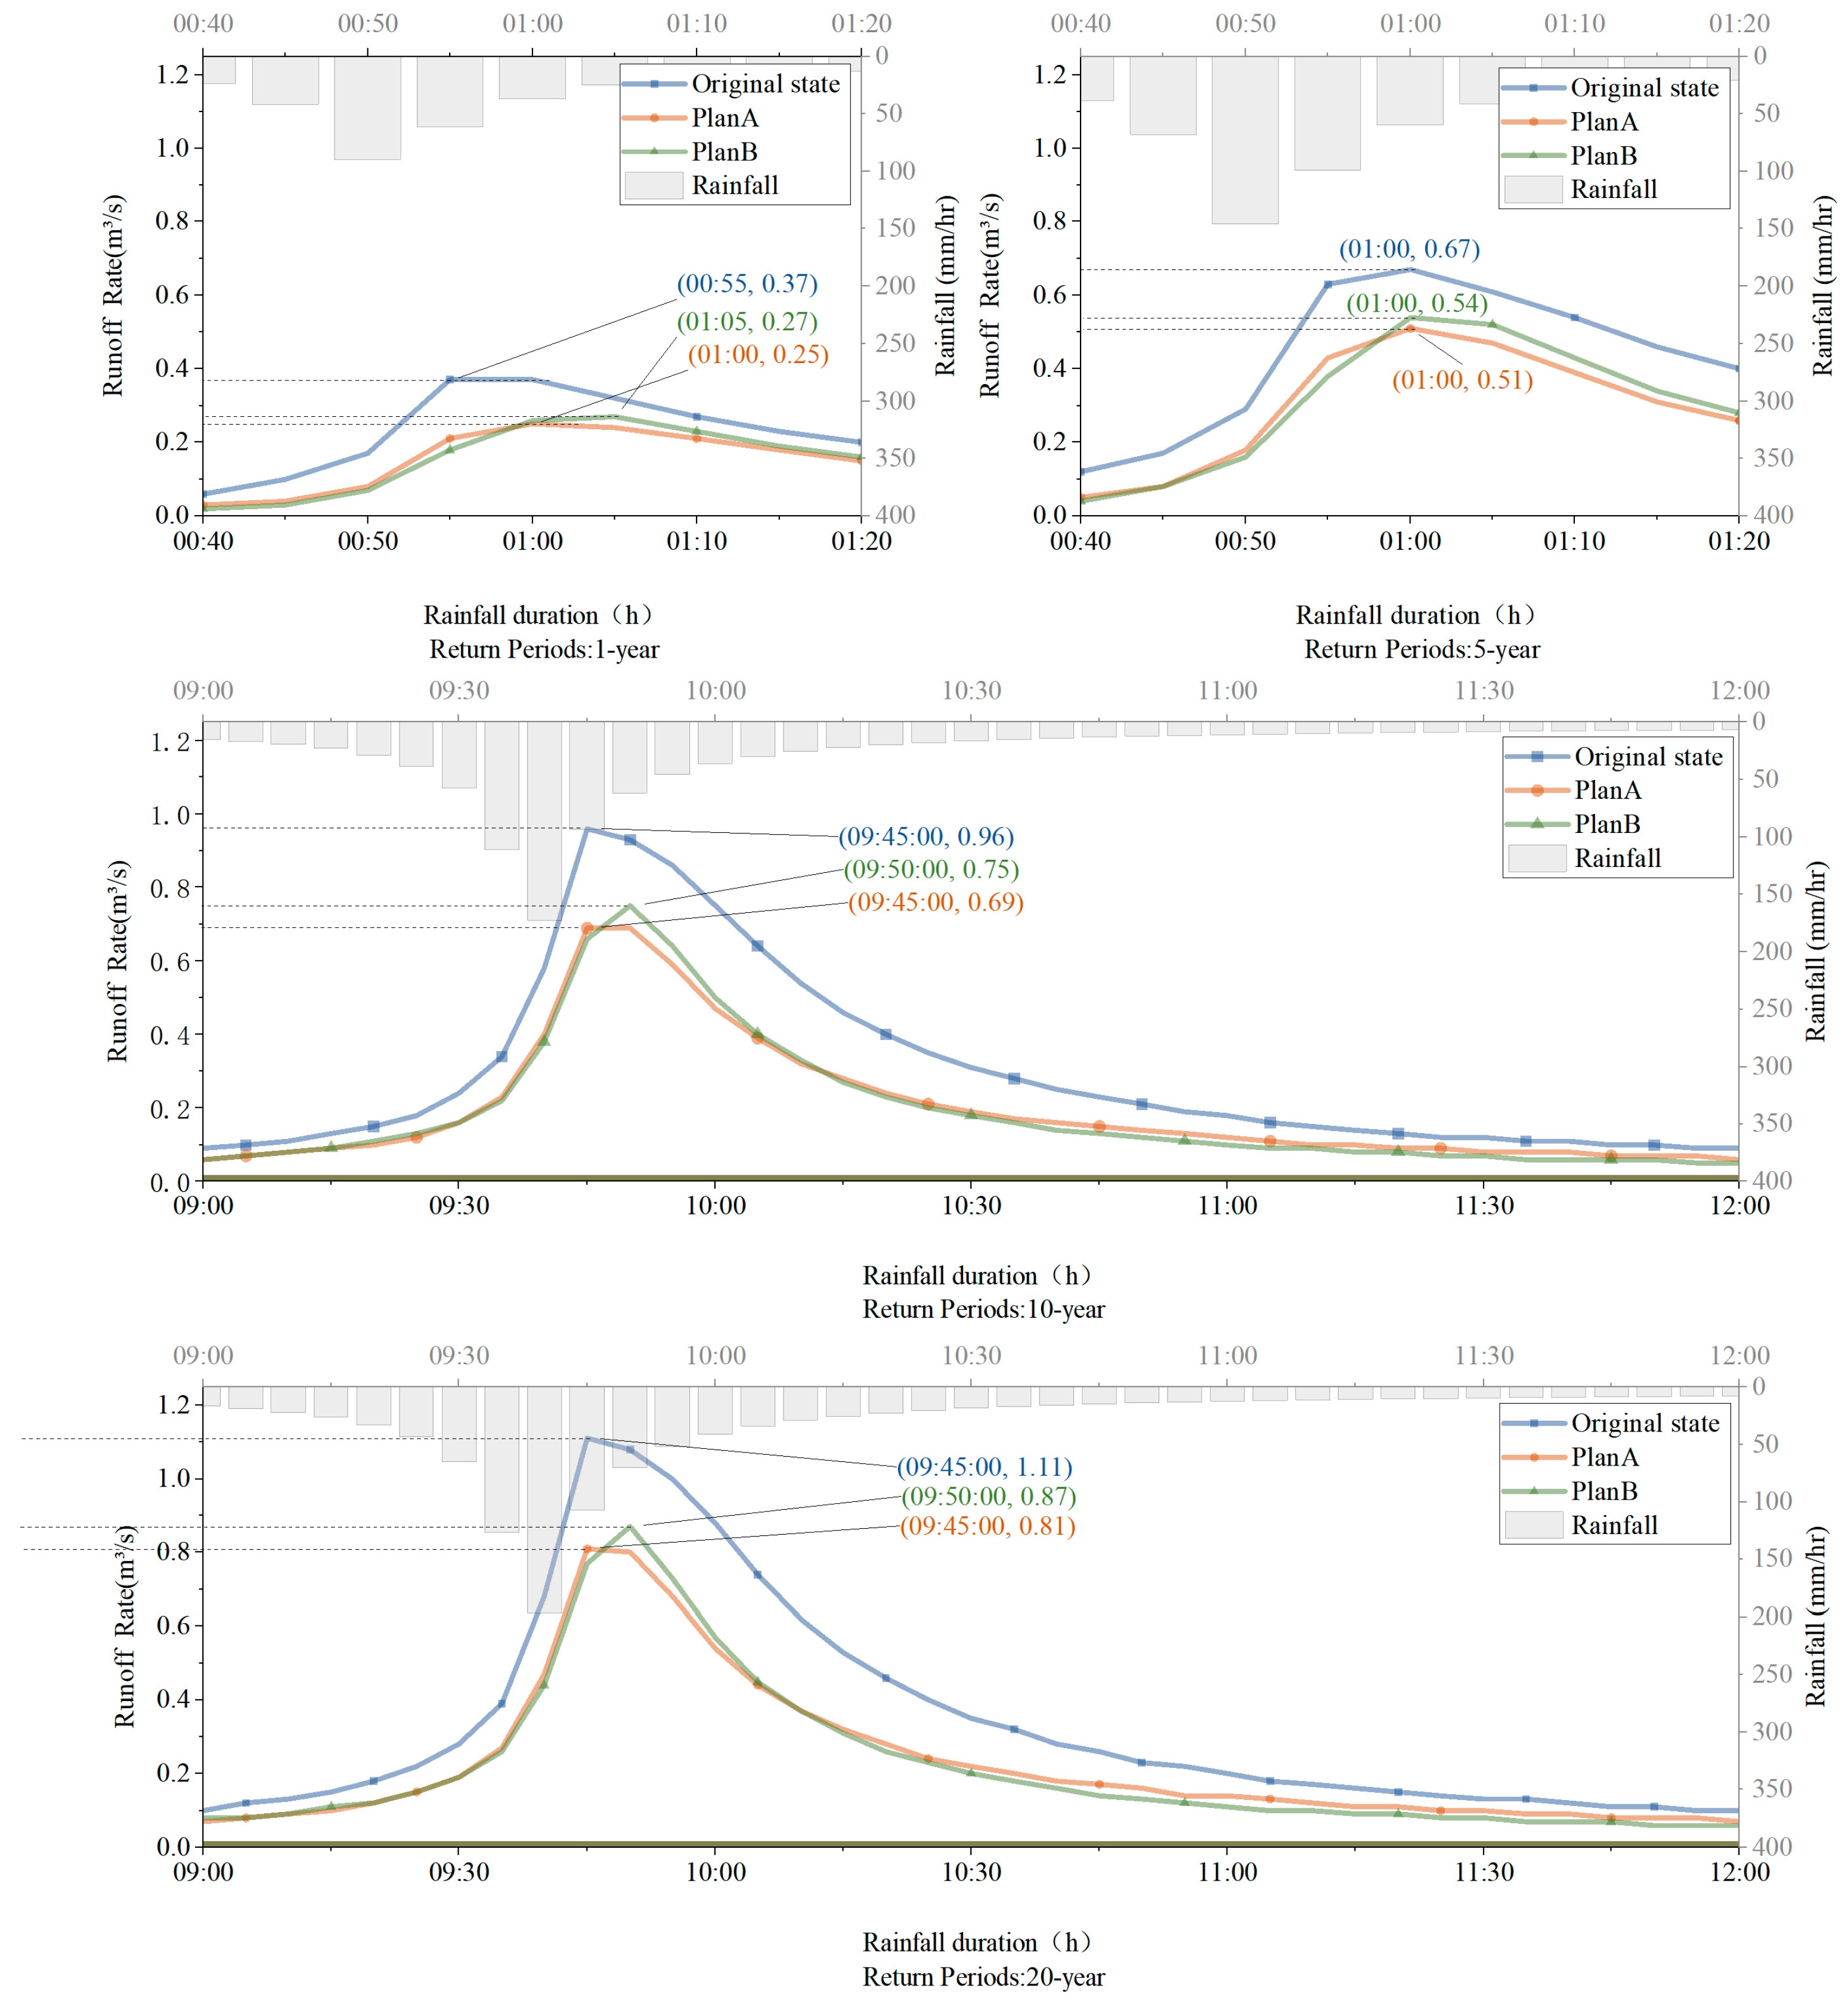
Surface runoff refers to the portion of precipitation that flows over the land surface, rather than infiltrating into the soil or evaporating. It occurs when the rainfall intensity exceeds the soil’s infiltration capacity, causing excess water to move over the surface and eventually enter drainage systems such as municipal pipelines. The Total runoff volume (Trv) refers to the total amount of water passing through a specific section within a designated period. In this study, the Reduction Total runoff volume (RTrv) refers to the decrease in the total volume of surface runoff from the optimized plan compared to the current site condition. The higher the RTrv, the lower the waterlogging risk, and the more significant the optimization effect. We compared and analyzed the Trv and RTrv for four return period scenarios—specifically, 1-year, 5-year, 10-year, and 20-year events (see Figure 7)—as well as the corresponding runoff time series curves (see Figure 8). The larger the time lag between the occurrence of the Peak runoff rate (Prr) and the Peak rainfall (Prf), the more favorable it is for mitigating waterlogging and runoff pollution issues. A smaller Prr represents a larger instantaneous reduction runoff volume and a better optimization.
As can be seen from Figure 7 and Table 4, the Trv of the optimization scheme was significantly reduced, and the Trv can reached 31.5–35.7% under multiple reproduction periods. Meanwhile, as can be seen from Figure 8, the optimization scheme also abated the Peak Runoff Volume (Prv) by 9.4–32.4%.
Plan A’s RTrv was higher than Plan B’s by 1.44% (15.526 m3) only for periods of 1 year. In other scenarios, especially at return periods of 10 years and 20 years, the reduction rate of plan B was higher than that of Plan A (3.84% and 4.15% respectively), and the reduction capacity of Plan B gradually increased as the return periods increased. Plan A allocated a substantial area of green space within each sub-catchment, enabling stormwater to more easily infiltrate and form runoff within these areas. In contrast, Plan B emphasized the rapid discharge of stormwater from the site by significantly shortening the runoff path. Under low rainfall conditions, stormwater can infiltrate green spaces, and runoff occurs only on impervious surfaces; the even distribution of green areas maximizes infiltration and helps reduce runoff. However, when rainfall intensifies beyond the infiltration capacity of green spaces, runoff will also develop over these areas, making the scheme with a shorter drainage path more advantageous.
Figure 8 shows that in the original state, the Prr consistently occurs within 5–10 min after the Prf. When comparing Prv, Plan A consistently achieved greater reductions than Plan B, cutting an additional 0.02, 0.03, 0.06, and 0.06 m3/s, respectively. Moreover, this advantage became increasingly pronounced as the return period increased. Regarding the timing of the peak runoff, a later peak occurrence in the optimized plans indicated more effective runoff control. As illustrated in Figure 8, Plan A and Plan B exhibited the same level of control at return periods of 10 years and 20 years. However, at return periods of 1 year and 5 years, Plan B’s peak appeared 5 min later than both Plan A’s and the original state’s peak, demonstrating a slight temporal advantage.
(2)
Discharge Volume
Discharge volume refers to the volume of rainwater or surface water flowing out of the municipal pipeline system. On the basis of the original state, the more the Total discharge volume (Tdv) increases after optimization, the more smoothly the rainwater can be discharged through the drainage system. The rate of response of a drainage system to rainfall can be determined by comparing the difference between the time at which Peak rainfall (Prf) occurs and the time at which Peak discharge rate (Pdr) is reached. If Pdr is closer in time to Prf, it means that stormwater is discharged from the site in a shorter period of time.
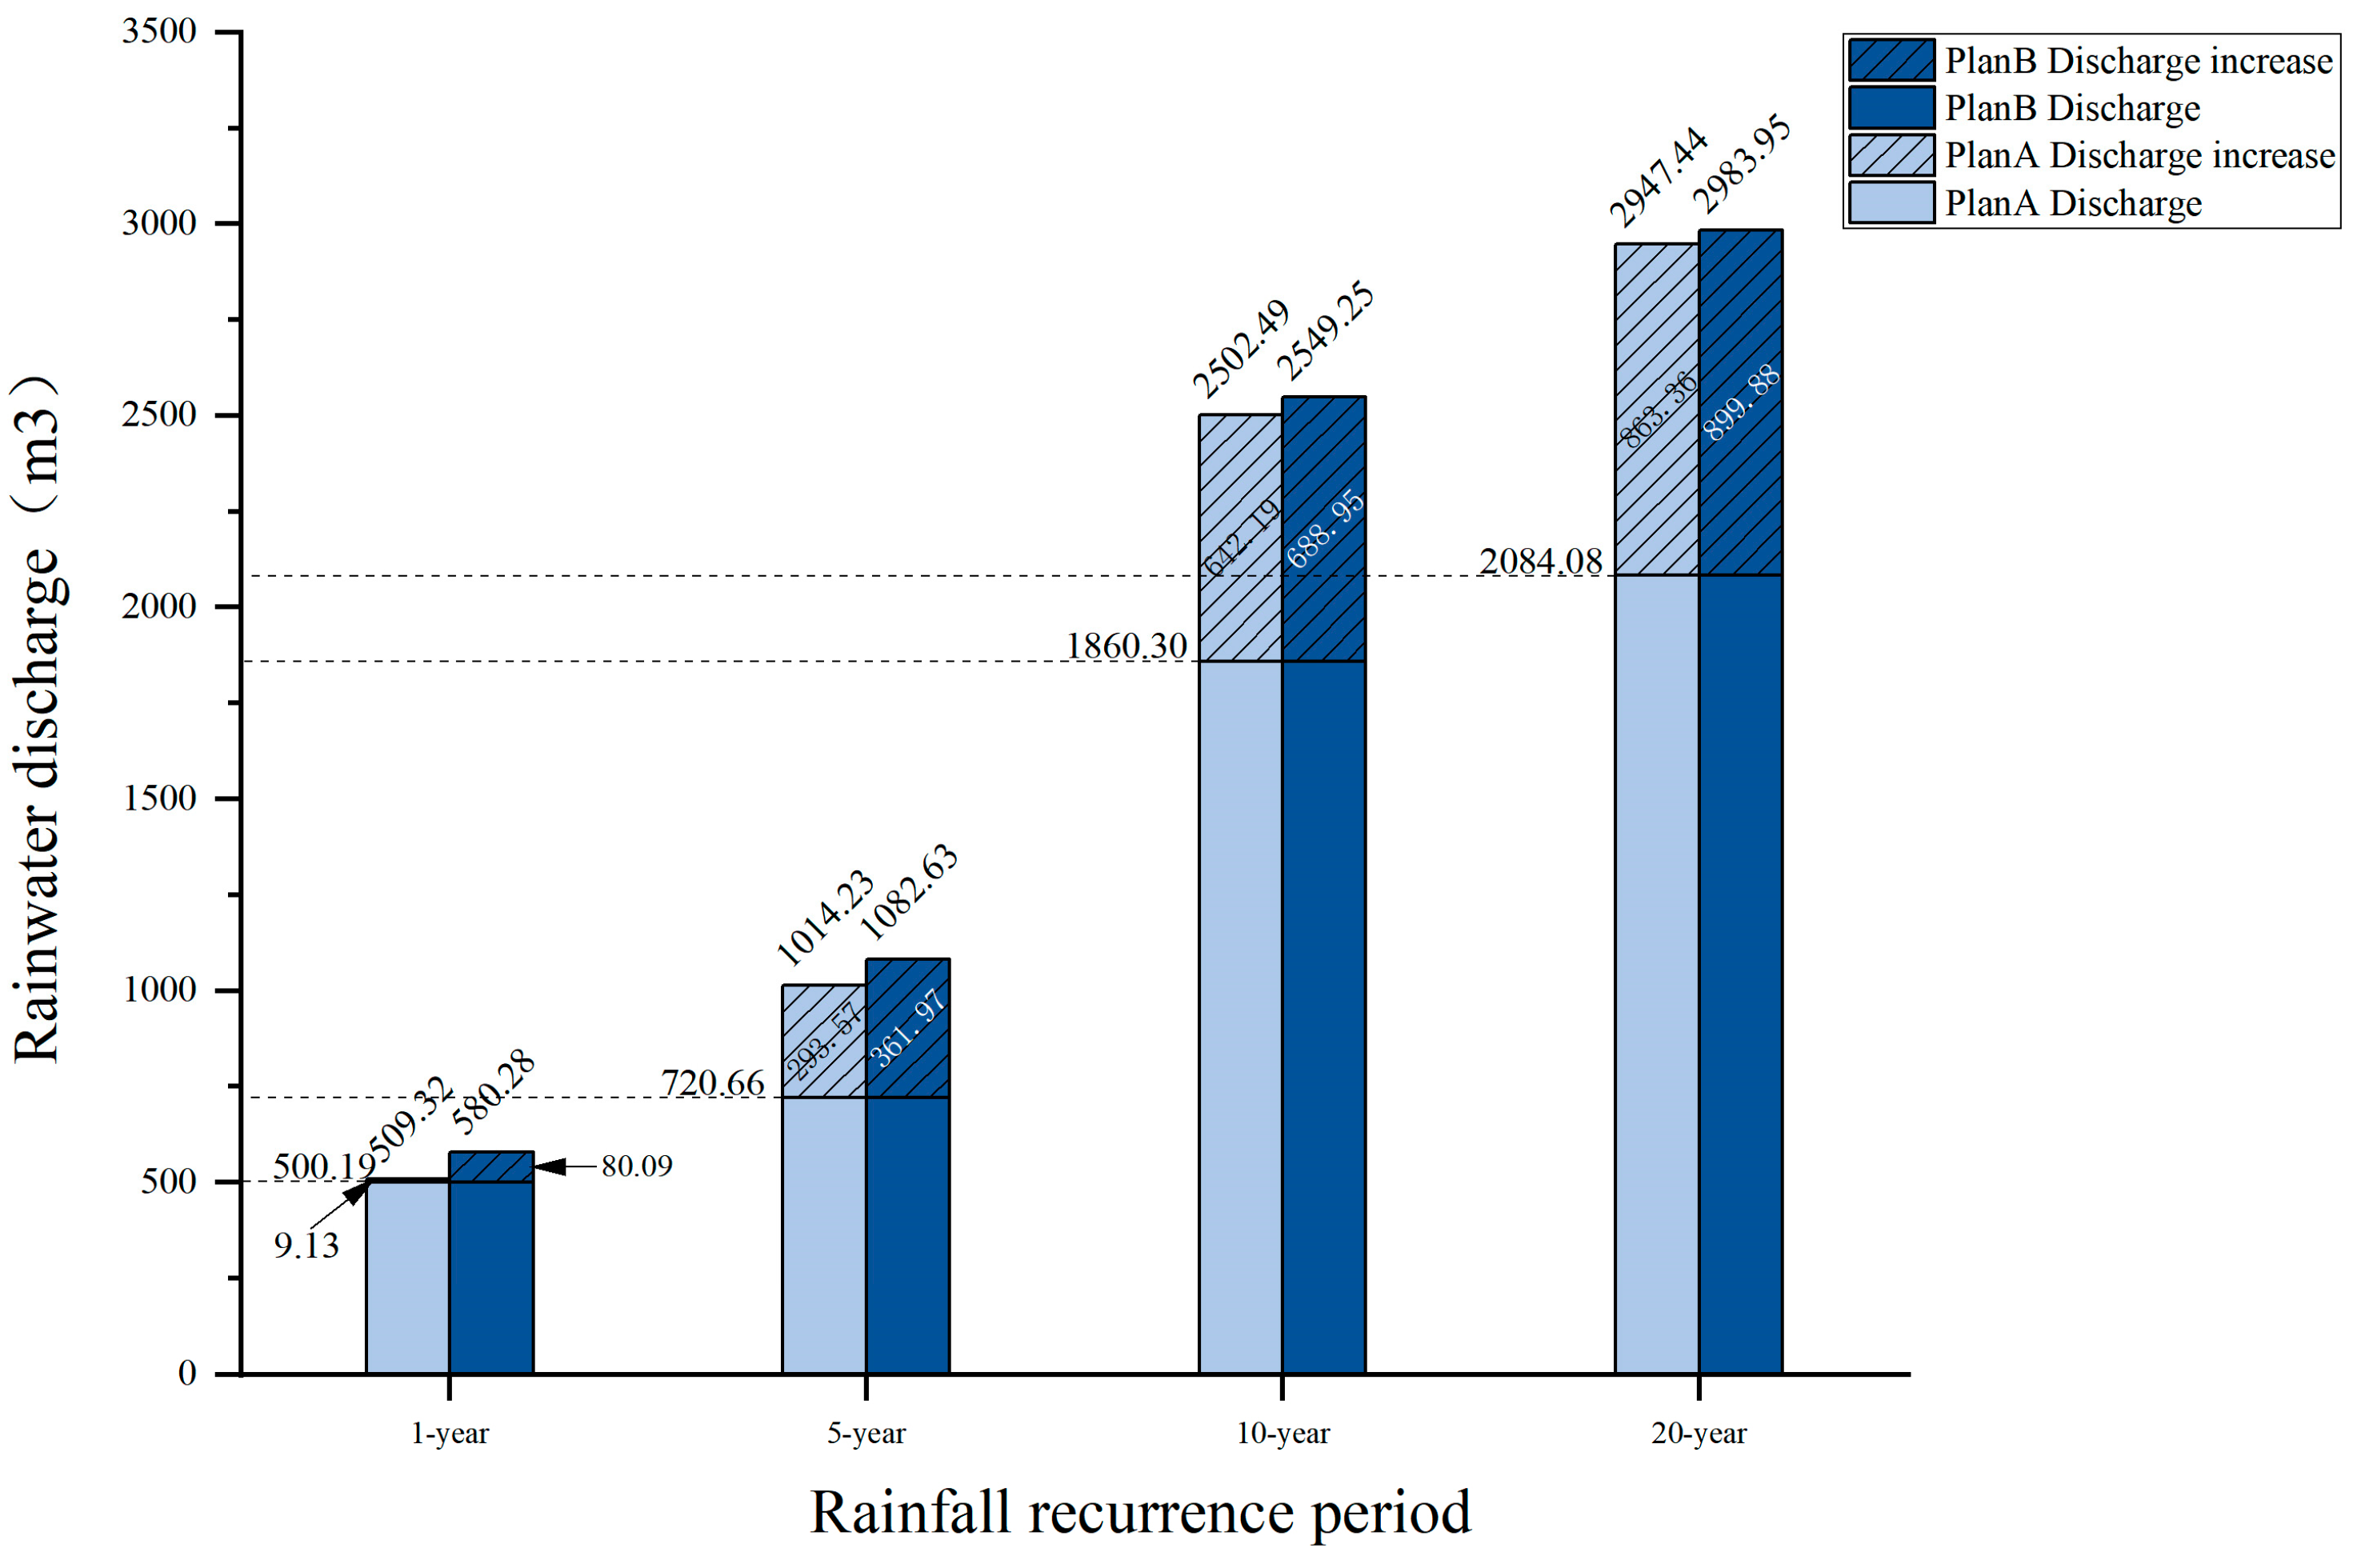
From Figure 9 and Table 5, it can be seen that the optimized solution significantly increased the Tdv by 1.8–50.2% under different recurrence periods. In addition, Figure 10 shows that there was a significant plateau period in the drainage rate under the current site conditions, and the duration of the plateau period gradually increased with the increase of the rainfall return period. This indicated that the drainage pipes in the current system were at full capacity, with rainwater reaching the full pipe flow state. Subsequent rainfall either accumulated within the pipes or overflowed, causing the drainage system to reach its maximum instantaneous discharge capacity. A longer plateau period means a longer duration of water accumulation, further exacerbating the risk of waterlogging. After optimization, the plateau period in the runoff curve disappeared and the peak discharge rate (Pdr) increased by a factor of 1 to 5.5, from an initial value of 0.09–0.1 m3/s to approximately 0.65 m3/s. This marked improvement in discharge performance was primarily attributable to the optimized design of the sub-catchments, which enabled prompt conveyance of surface runoff into the drainage network; simultaneously, the optimized pipeline layout effectively prevented in-pipe water stagnation and clogging, ensuring efficient stormwater conveyance. The original low Pdr was due to outdated design and limited capacity of the existing drainage system, which failed to adequately collect and convey surface runoff.
Figure 9 shows that at a 1-year return period, Tdv under Plan B was 14.19% higher than that of Plan A. As the return period increased, this difference decreased, and by 20 years, Tdv under Plan B was only 1.75% higher than that of Plan A.
Furthermore, comparing the occurrence times of Prf and Pdr for Plan A and Plan B, we found that at 1 year, the time difference between Prf and Pdr was 25 min for Plan A and 20 min for Plan B. At 5 years, 10 years, and 20 years, both Plan A and Plan B maintained a consistent 20-min time difference between Prf and Pdr.
(3)
Runoff-Discharge Analysis
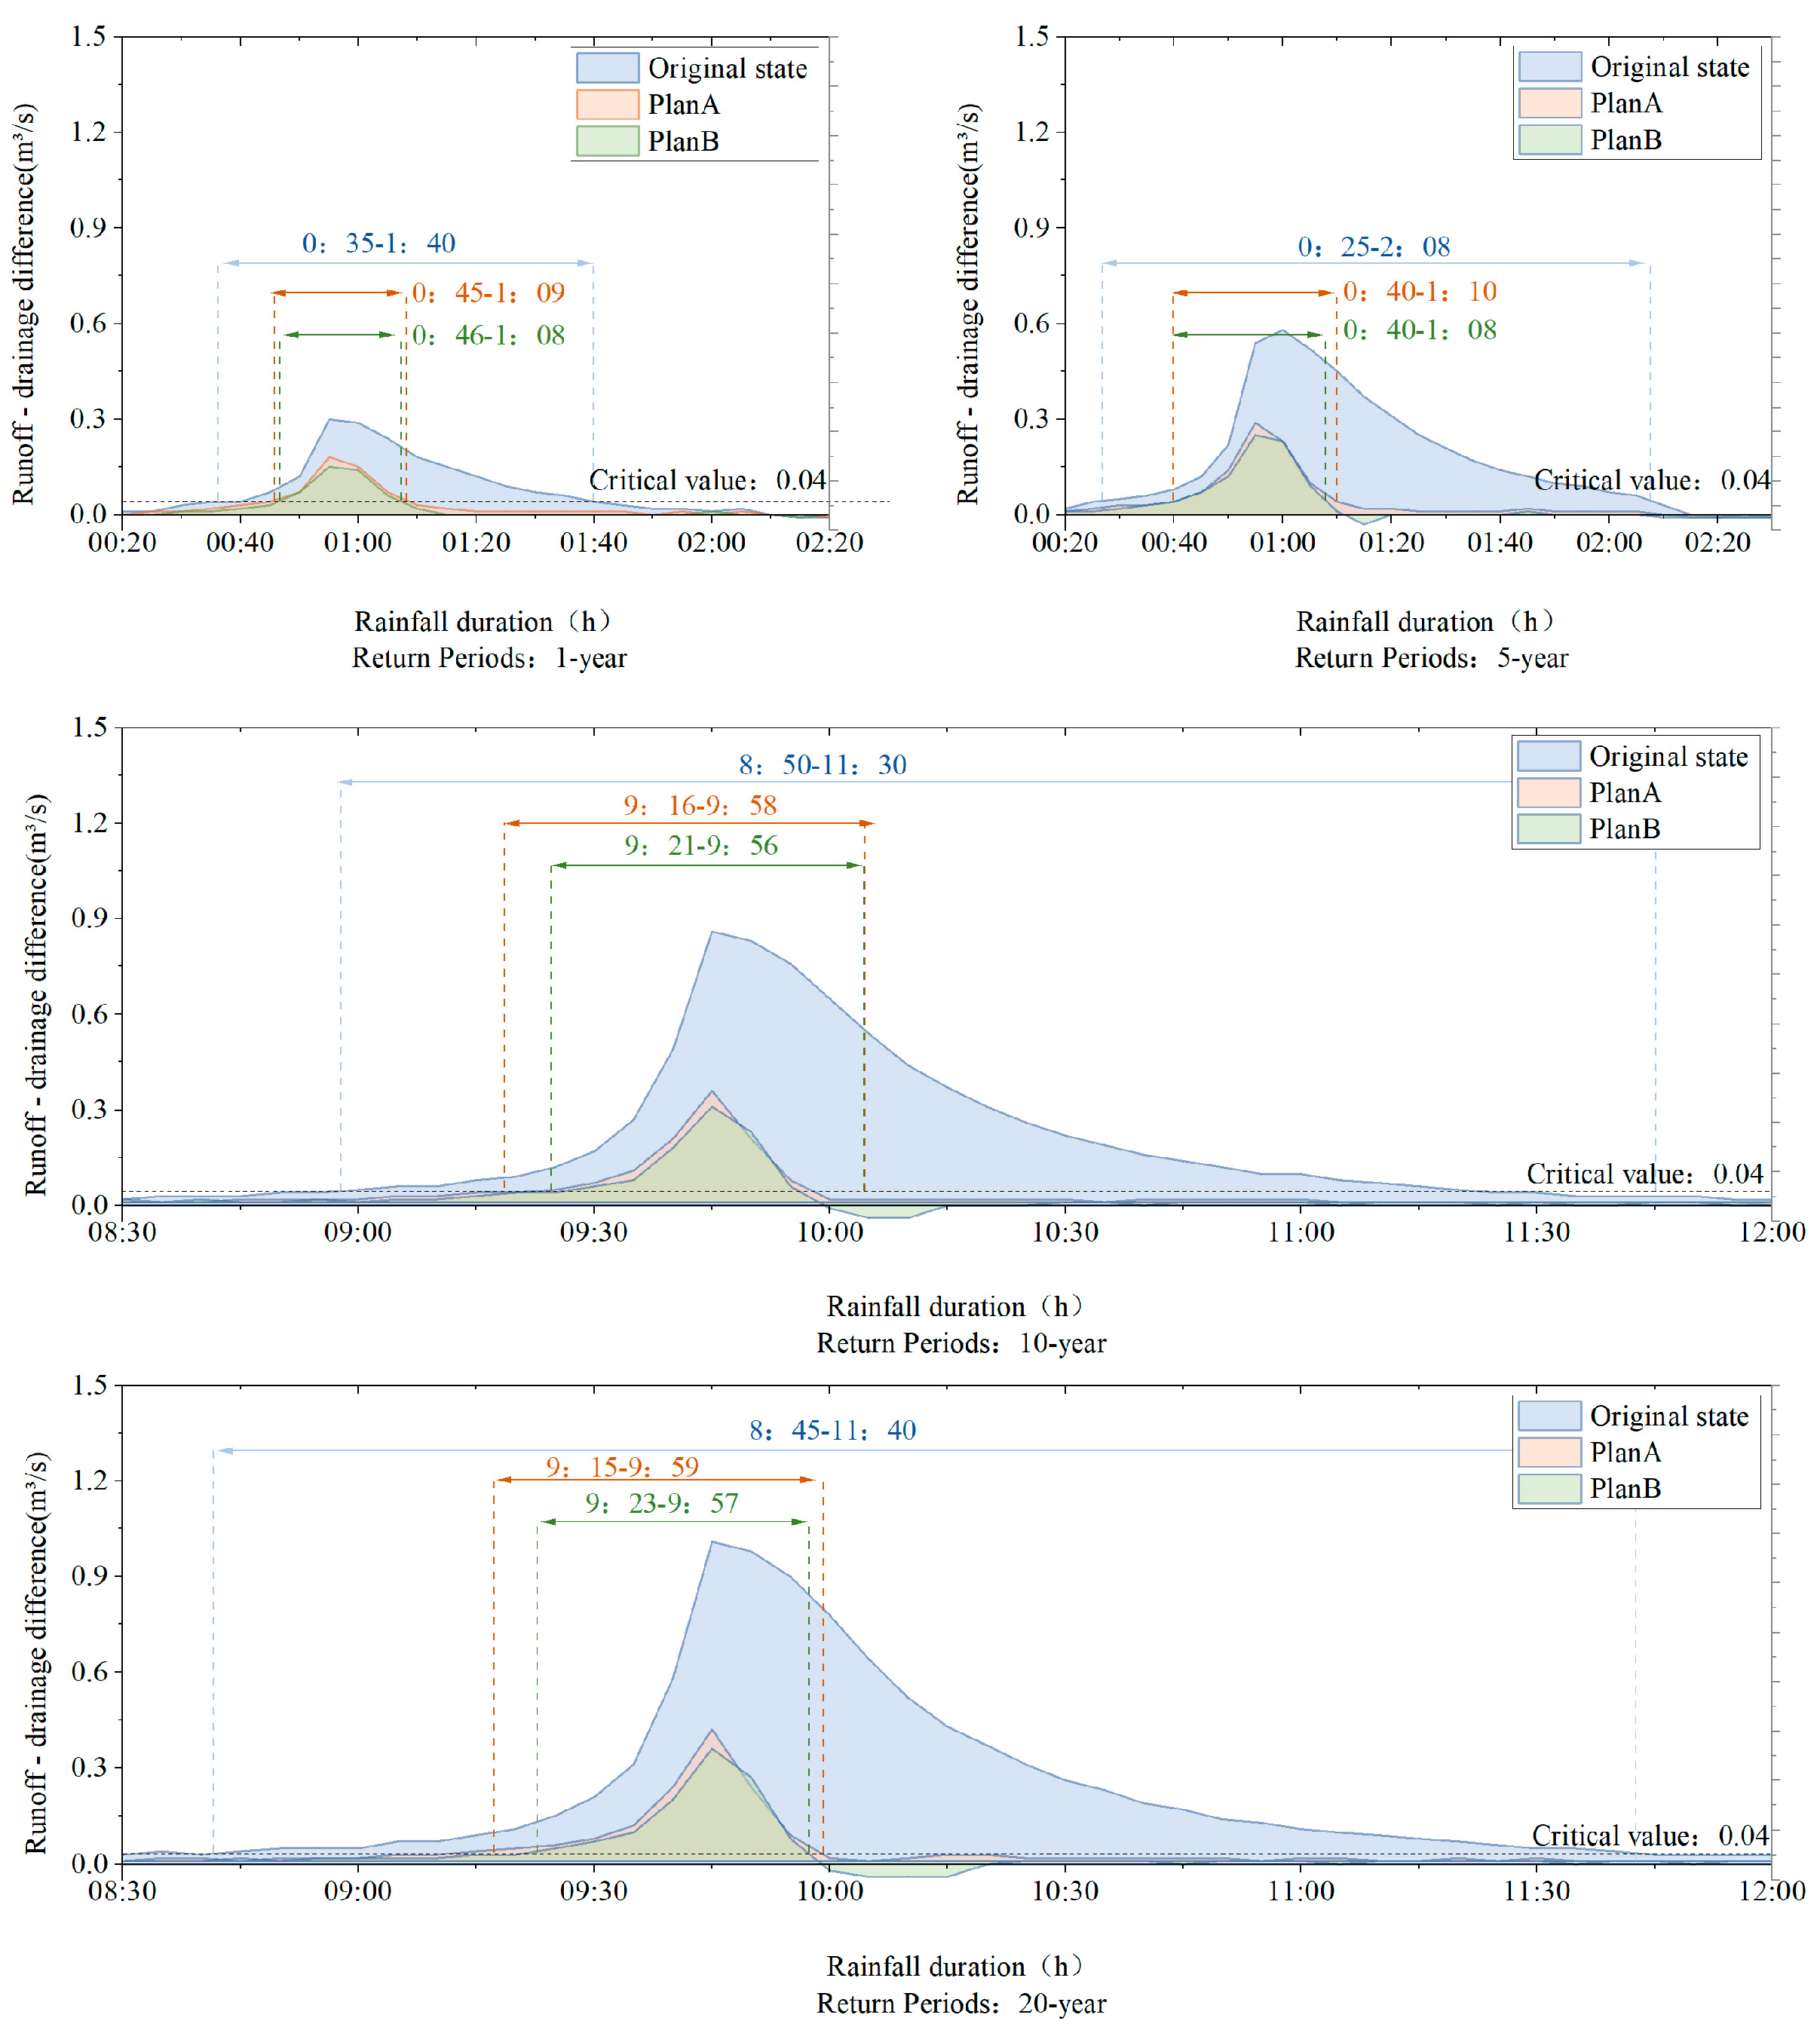
Runoff-discharge analysis was used to estimate the risk of waterlogging by counting the difference between Trv and Tdv during the rainfall process (Siyuan and Jian, 2020) [32]. The local soil in Shijiazhuang was measured to be wet trapping loess-like chalky soil with an infiltration rate of 6 × 10⁻⁶ m/s. The site was calculated to infiltrate approximately 0.04 m3 of rainwater per second. Therefore, waterlogging risk existed only if the runoff-discharge rate difference exceeded this threshold. We used 0.04 as the baseline to calculate the characteristic peak width, with a greater peak width indicating a longer duration of waterlogging risk.
Figure 11 shows that, compared to the original state, the optimized scheme significantly reduced the characteristic peak widths, thereby effectively lowering the risk of waterlogging. Under return periods of 1, 5, 10, and 20 years, the characteristic peak widths were reduced by 41–43 min, 73–75 min, 118–125 min, and 131–141 min, respectively. Moreover, under the same return period conditions, Scheme B consistently exhibited smaller characteristic peak widths than Scheme A (with differences of less than 10 min), indicating that, based solely on this metric, Scheme B had a slightly lower waterlogging risk than Scheme A. However, due to site scale limitations, the overall difference was not significant.

3.2.2. Full Pipe Flow Analysis

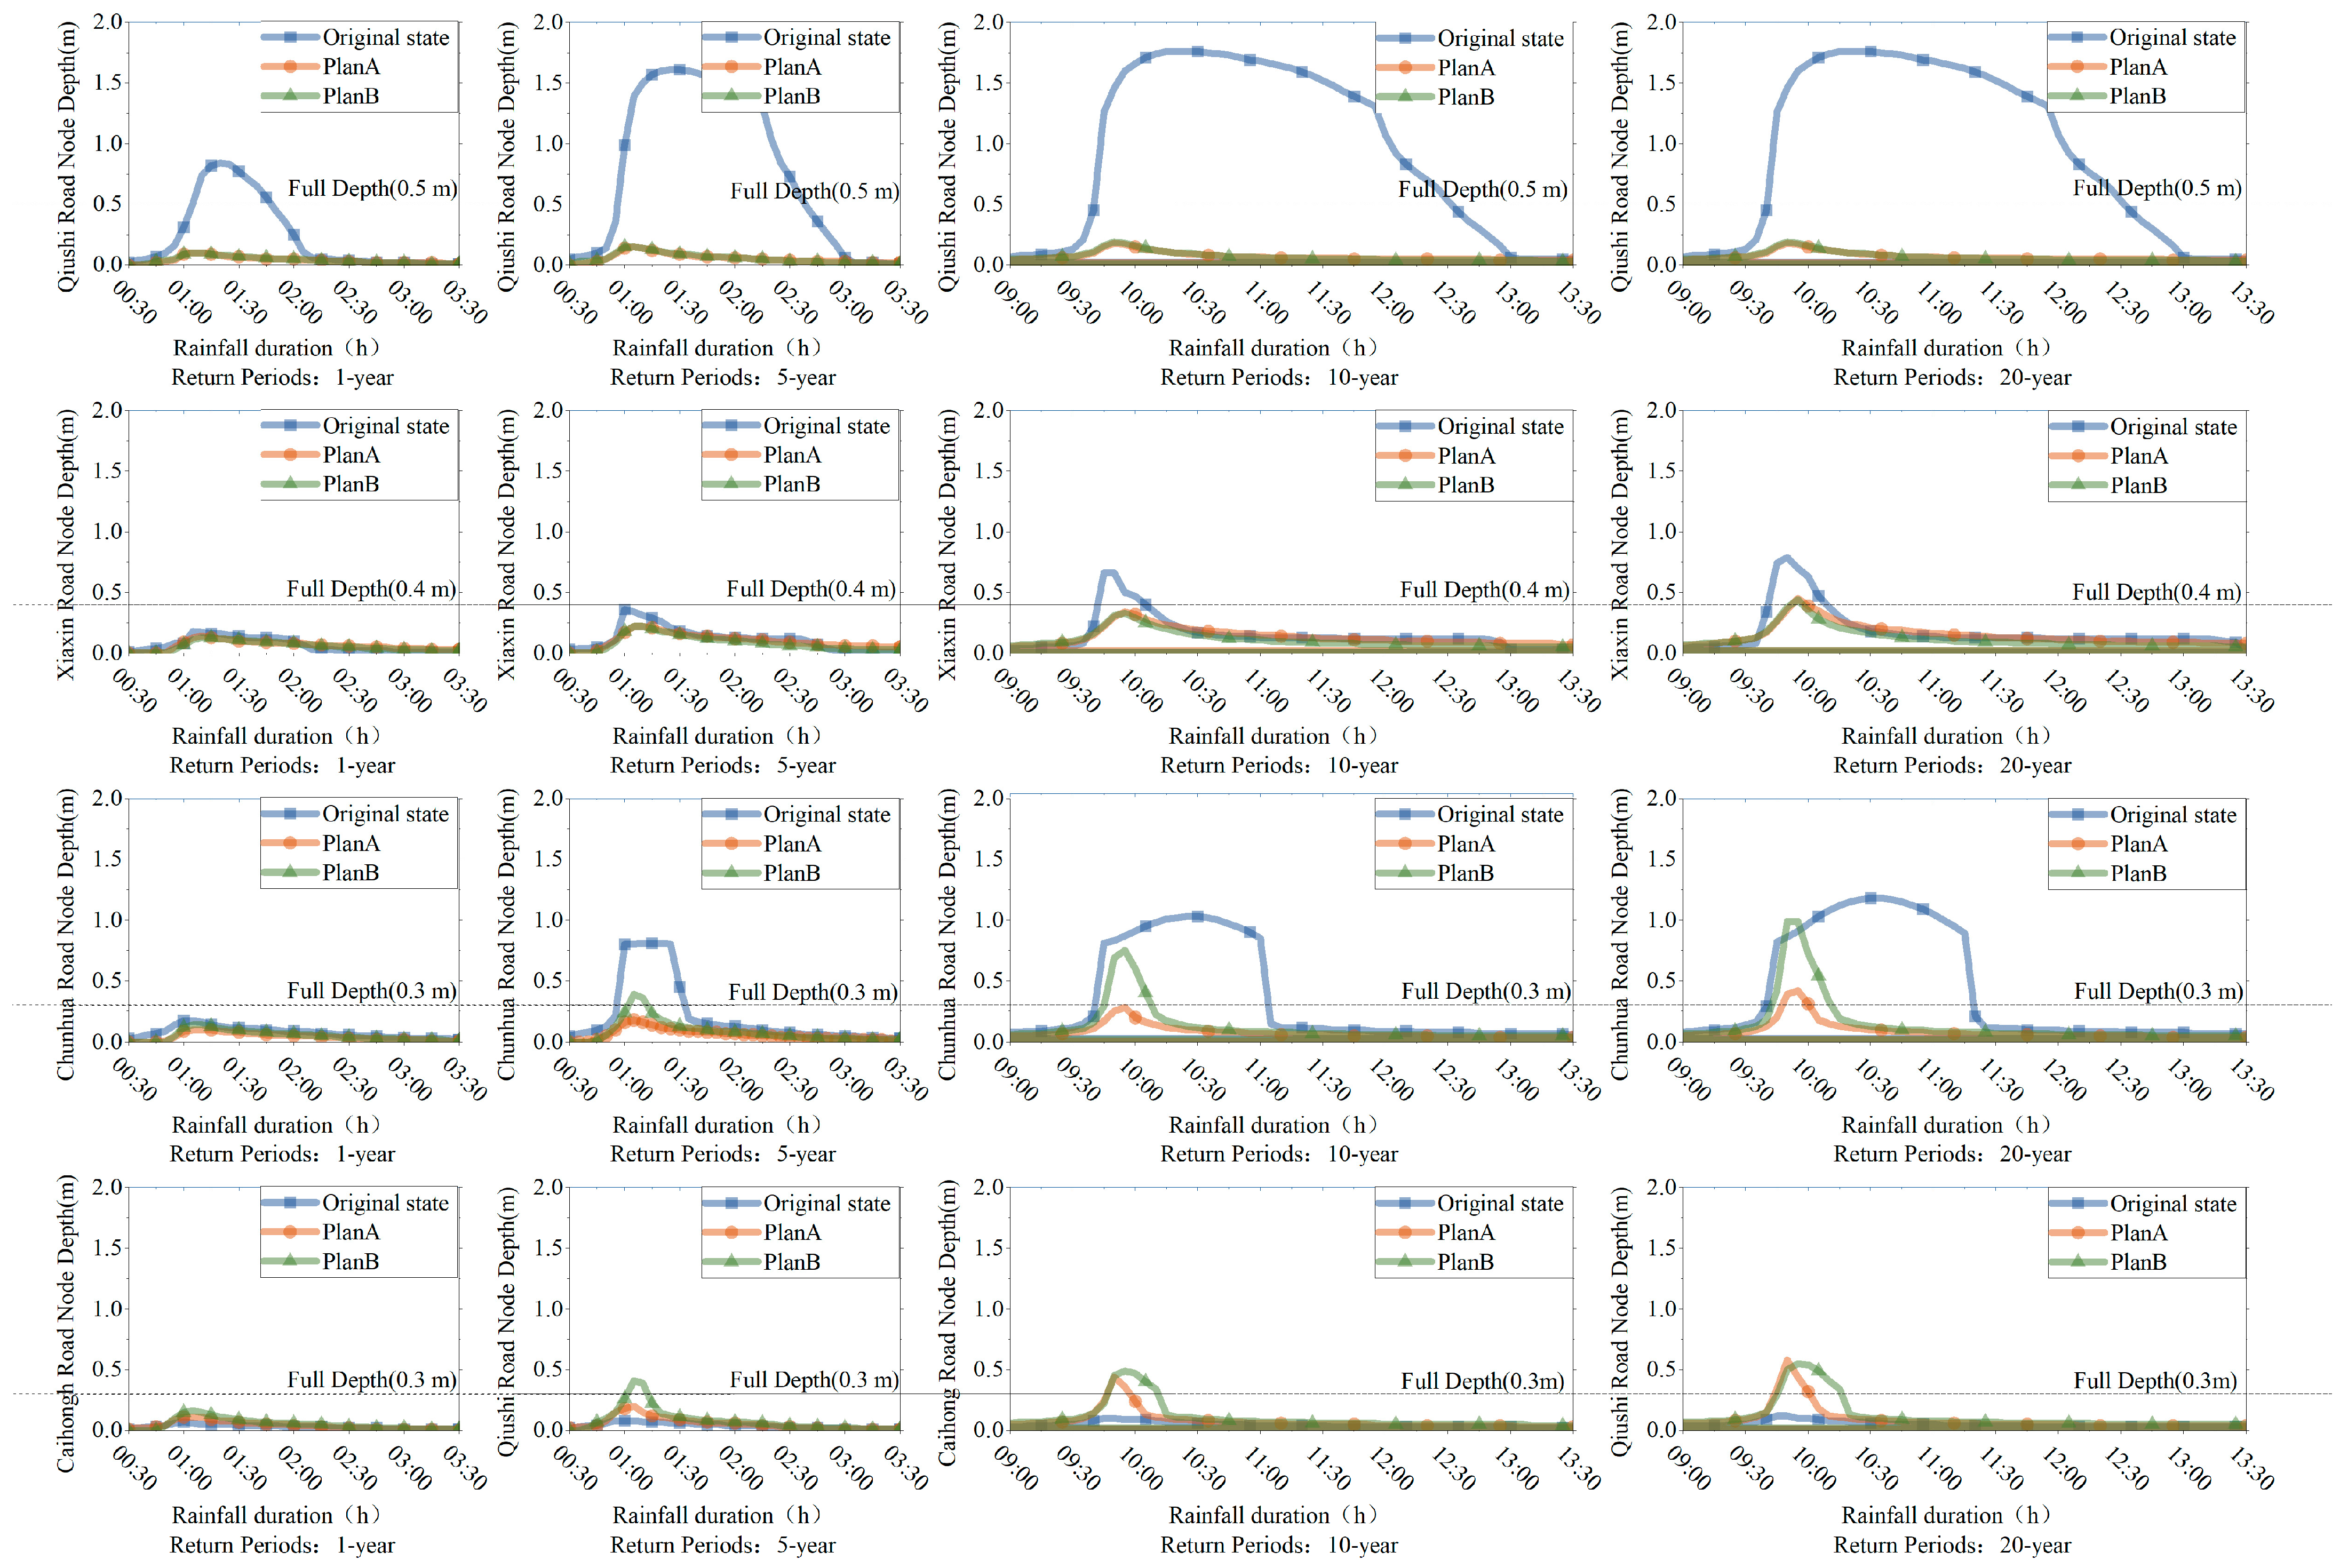
When the Node Hydraulic Depth (NHD) in the drainage pipe reaches the Maximum Hydraulic Depth (MHD) in the pipe, the condition is known as “Full Pipe Flow (FPF)”. If the NHD exceeds the MHD, it indicates that the drainage capacity of the pipe is saturated and there is a risk of rainwater overflow. This study selected the end stormwater pipeline nodes of Qiushi Road, Xiaxin Road, Chunhua Road, and Caihong Road as references. The MHD of four stormwater pipelines are 0.5 m, 0.4 m, 0.3 m, and 0.3 m. We characterized their pipe carrying capacity by comparing the differences between NHD and MHD in different plans. In Figure 12, the dotted line represents the MHD of stormwater; curves below the dotted line indicate that the current drainage condition has not yet reached a state of FPF, whereas curves above the dotted line indicate that the period is in a state of FPF, posing risks of rainwater overflow, flooding, and potential infrastructure damage and economic losses. In the original state, despite the indicated MHD values, the effective discharge rate did not exceed 0.1 m3/s. This limited discharge capacity can be attributed to the original design parameters of the stormwater network—particularly, the connection method and the pipe diameters. In the original state, these stormwater pipes are ultimately connected to sewer pipelines with diameters ranging from 200 to 300 mm. These factors hindered the efficient collection and conveyance of surface water. After the intervention measures, improvements in the network layout—such as optimized pipe slopes, enhanced connectivity, and, where applicable, increased effective diameters—resulted in a significant improvement in discharge performance (as shown in Figure 10). Different colored columns represent the duration for which the pipes are in a state of FPF under that plan or original state. Different peak y-values represent the maximum instantaneous NHD in different plans or original state. Higher values indicate more risk of rainwater pipe rupture or overflow.
A comparison of the duration and peak value of the FPF status under different return periods for the same stormwater pipe revealed that the FPF status improved after the optimization of Qiu Shi Road. Both optimized plans effectively reduced the NHD compared to the original state, which greatly reduced the load pressure on the drainage network. Shahin Road had a FPF state only for return periods of 10 years and 20 years. Although both two plans provided some relief from the original state, they still had a FPF state that lasted 5 min and both reached the maximum NHD (Plan A = 0.45 m, Plan B = 0.44 m) at 9:55 with a return period of 20 years. Except for the return period of 1 year, Chunhua Road experienced varying degrees of FPF under other return periods: At a return period of 5 years, this condition experienced 30 min of FPF. Plan B optimization alleviated the FPF status by 25 min, reducing the peak by 0.42 m. Under the optimization of plan A, the FPF status completely disappeared. At a return period of 10 years, the original state experienced 75 min of FPF. Plan B alleviated the FPF status by 60 min, reducing the peak by 0.28 m. Under Plan A’s optimization, the FPF status completely disappeared. At a return period of 20 years, the current condition experienced 120 min of FPF. Plan B alleviated the FPF status by 95 min, reducing the peak by 0.28 m. Plan A alleviated the FPF status by 110 min, reducing the peak by 0.76 m. Caihong Road represents a unique case. Initially, the stormwater pipes serving this road catered to a sub-catchment area of only 518 m2. After spatial re-planning, however, the area covered by these pipes expanded dramatically to 2876 m2 under Plan A and 3382 m2 under Plan B. Consequently, the volume of discharge that needed to be managed increased substantially, causing the optimized discharge curve to exceed the original-state curve. Through analysis, we found that with a return period of 5 years, plan B experienced FPF status, with the highest NHD reaching 0.41 m. With a return period of 10 years, both plans experienced FPF status, but Plan B faced more risks (lasting 15 min longer than Plan A, with a peak 0.05 m higher than Plan A). With a return period of 20 years, the duration of FPF status for both plans increased, with Plan B lasting 10 min longer than Plan A and the peak of plan A being 0.03 higher than Plan B. Overall, optimizing sub-catchment areas helps to alleviate the majority of pipe drainage pressure, and the pipe drainage pressure of Plan A was significantly less than that of plan B.
The findings of this study are limited to the small urban area examined. Although Plans A and B achieved similar overall optimization, each exhibited distinct advantages. In larger or more complex urban settings, the performance differences between these plans may be more pronounced. To fully understand the impact of these optimization strategies, future research should explore their application across diverse geographic regions and under a variety of conditions. Based on the two analyses presented, this study found that while Plan B offered a slight advantage in the runoff-discharge assessment, it also exhibited significant issues in the FPF analysis. In particular, the stormwater pipelines on Chunhua Road and Rainbow Road faced an elevated risk of overflow and pipe failure under Plan B. Consequently, this study selected the more robust Plan A as the final preferred option for the “BMPs-Planning” phase.

3.3. Parametric Design in “LID-Design” Phase

3.3.1. LID Facilities Layout Based on Grasshopper

To enhance the site’s capacity for rainwater infiltration and absorption and further reduce the risk of urban space waterlogging, considering the current site condition, we arranged LID facilities in the form of RGs combined with PPs based on Plan A.
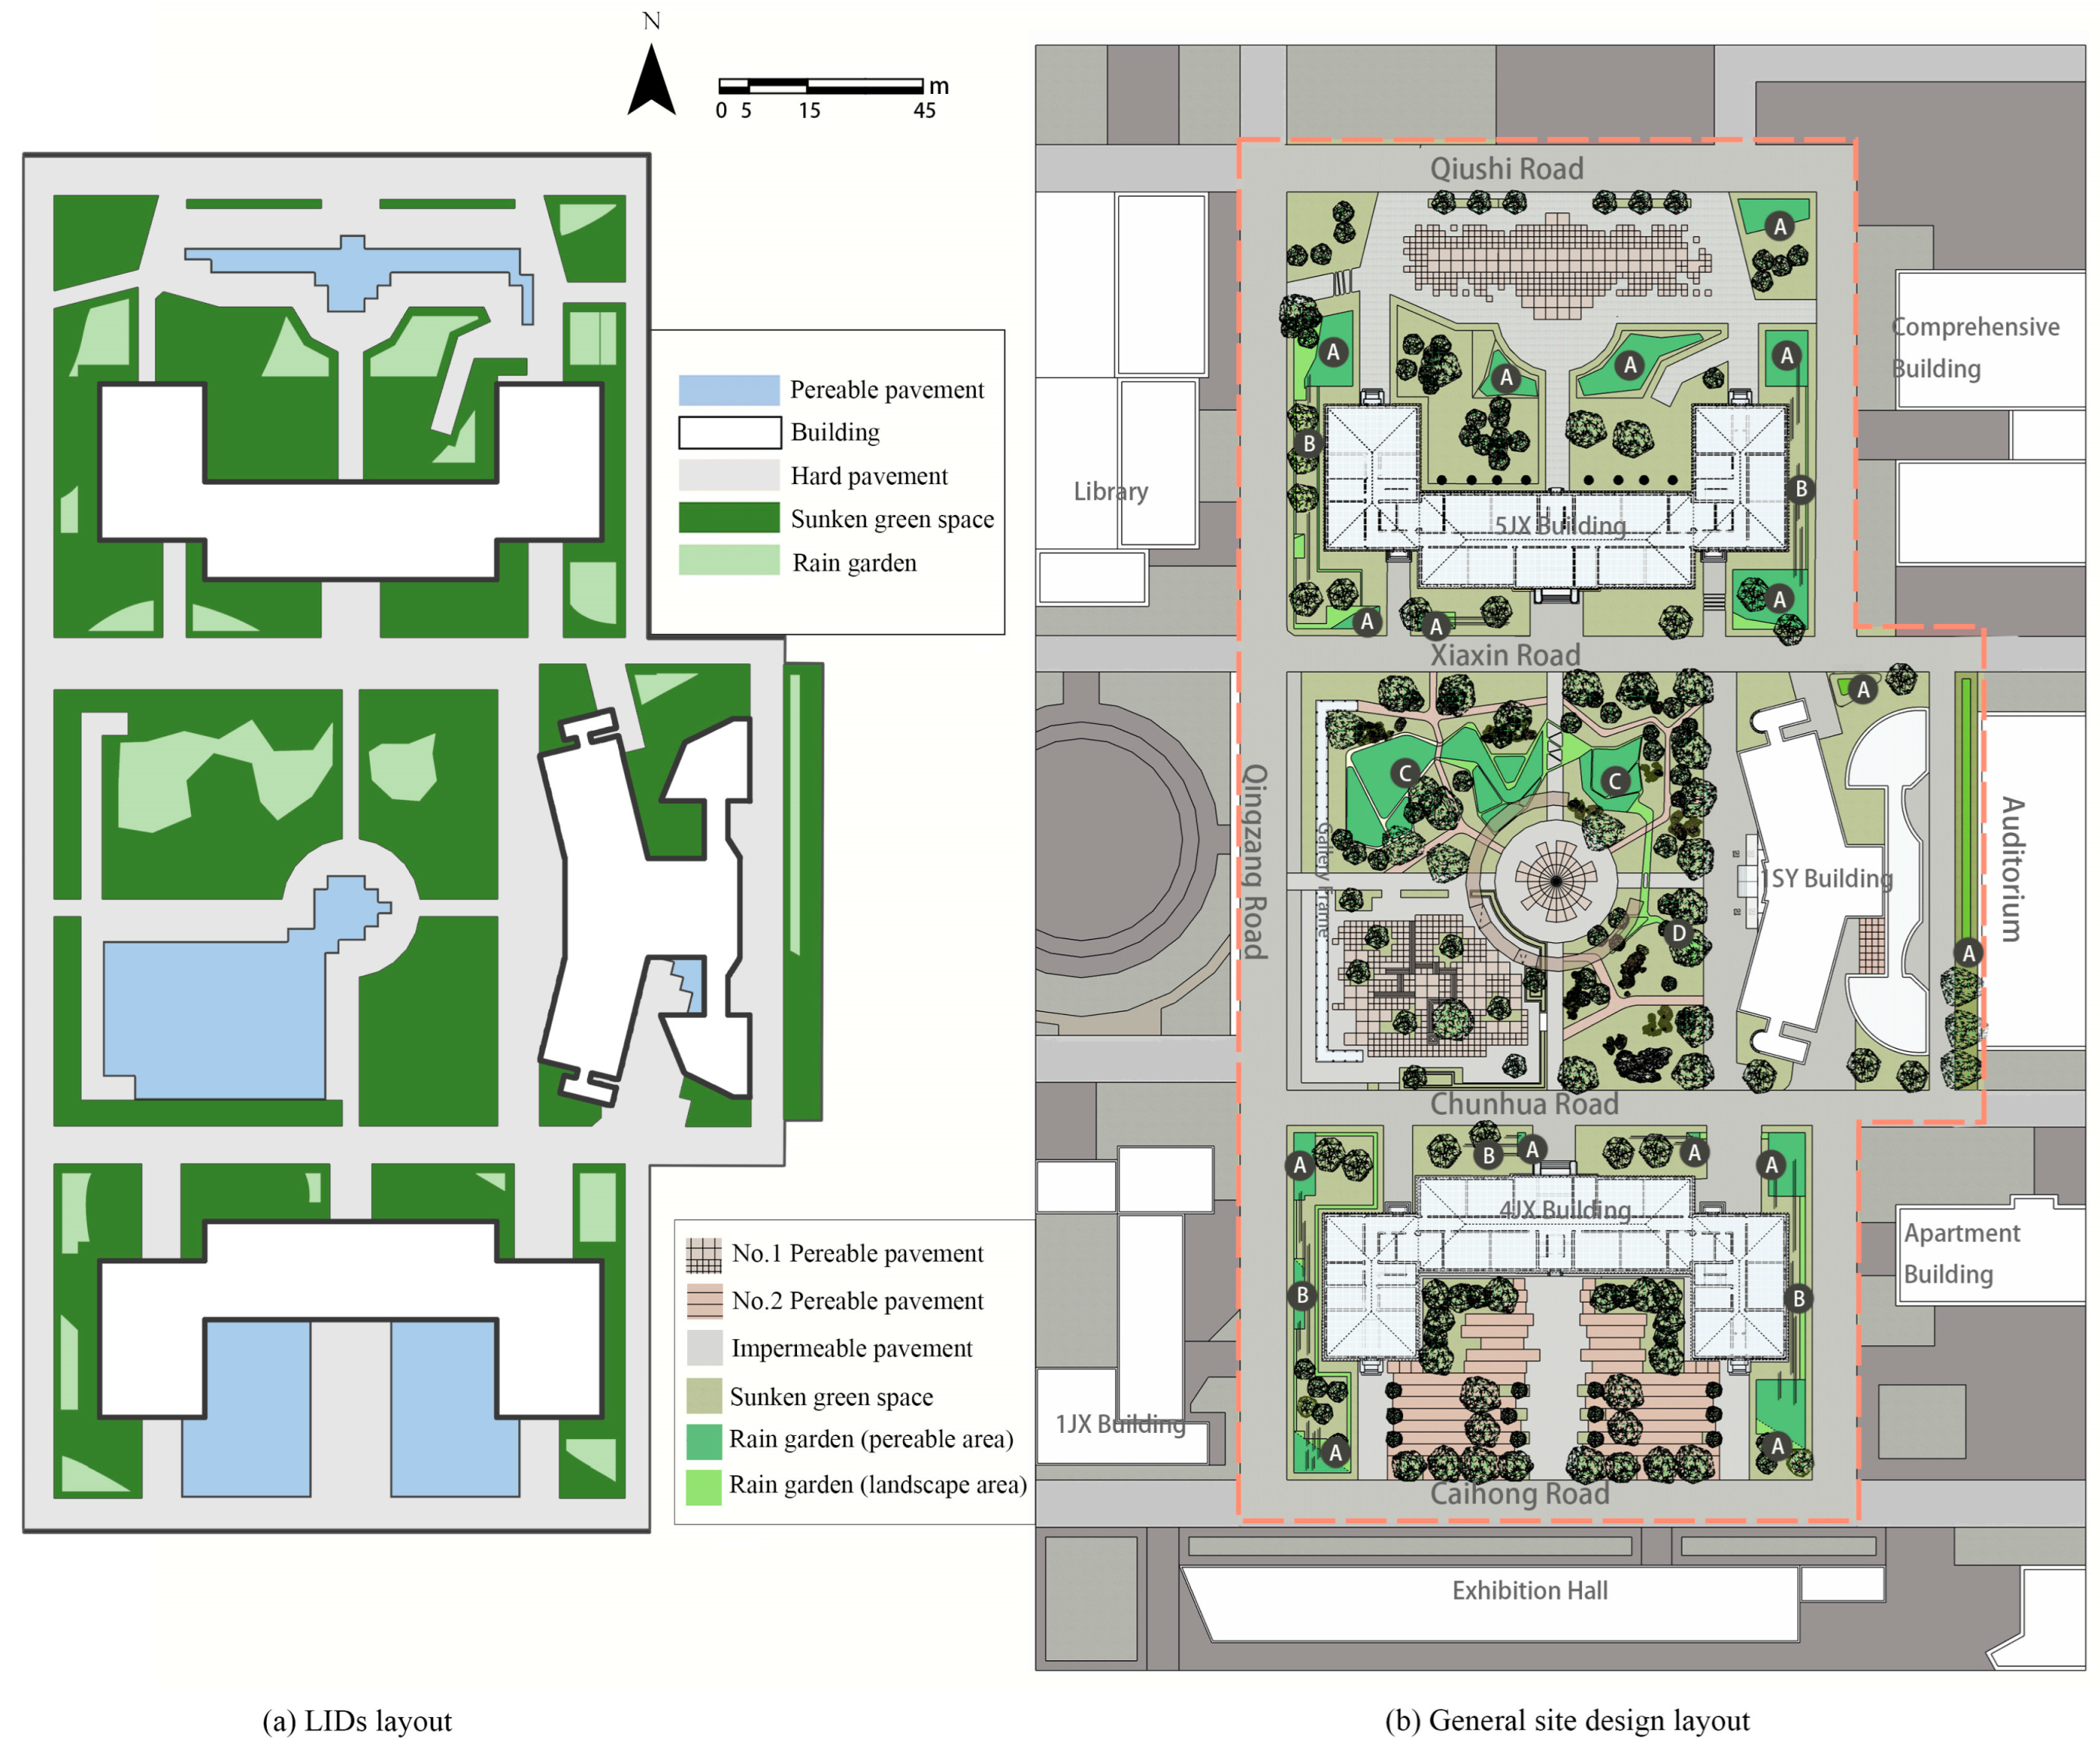
Based on Grasshopper analysis, a total of 21 areas of RGs were identified (see Figure 13a). The total area was 1090 m2, accounting for 13.9% of the green space area and 5.1% of the site area. The placement of RGs avoided all areas unfavorable for rainwater infiltration and ensured the maximum usable rate of the site. The more dispersed the facility arrangement, the more beneficial it is to maximize the infiltration function of RGs [4]. PPs were placed at five locations with a total area of 2290 m2, accounting for 67.8% of the total LID facilities area and 10.7% of the site area. The ratio of the area with PPs to the area without was 1:1.2, meeting the basic requirements of Shijiazhuang’s sponge city construction [26]. Additionally, the placement of PPs was far from drainage points, which could maximally reduce rainwater runoff, allowing rainwater to be quickly discharged from critical locations or directly infiltrate [7]. Through parametric analysis and design, the ratio of the area of RGs to PPs was 1:2.1, which roughly aligned with the conclusions on LID facilities combination arrangement by Li, Q., F. Wang, Y. Yu, Z. Huang, M. Li, and Y. Guan [4] and Gao, J., J. Li, Y. Li, J. Xia, and P. Lv [15], indicating that parametric analysis and design methods can assist urban planners and designers in finding the optimal arrangement of LID facilities.
Although this study did not include additional hydraulic simulations to quantify flood reduction, the design rationale was supported by existing literature. Previous studies have shown that similar LID configurations can achieve notable reductions in peak runoff volumes and delays in runoff peaks. Thus, while Grasshopper served primarily as a tool for optimizing the LID layout, the strategic dispersion of RGs and the targeted placement of PPs are expected to deliver significant flood mitigation benefits. Future work incorporating detailed hydraulic simulations is recommended to quantitatively validate the flood reduction performance of this design.

3.3.2. Landscape Design

The landscape design of RGs aligns with the environment. The RGs (A) are influenced by the enclosure of buildings and roads, characterized by small area, varied quantity, and fragmented shape. While this facilitates the infiltration function of RGs, it brings challenges to landscape development. To address these issues, we conducted an overall design based on green space during landscape designing, connecting multiple RGs into a visual unity without affecting their function, using rectangular line elements to link RGs within various green spaces into a cohesive landscape. Furthermore, the strip stone landscape (B) arranged in the green space not only enriched the landscape levels but also extended the runoff length of rainwater in the green space, thereby enhancing the rainwater retention and purification function. The central green space (C), with its larger area and irregular shapes of RG, adopted more natural landscape design elements, integrating paths, plants, and rocks to create a naturally flowing leisure experience. For RGs with poor boundary shapes, plant arrangements were used to blur their boundaries, integrating them with other landscape elements into a unified landscape node. Area (D) was significantly influenced by plants. Some collection points could not be arranged as RGs due to plant root restrictions, so we used micro-topography adjustment to divert rainwater from these points into RGs.
In terms of road pavement design, the main challenge was the transition between PPs and other types of pavements. Therefore, this study drew inspiration from Grasshopper’s parametric analysis of hard pavement, using square grids as design elements to create a gradient effect between permeable pavements and other pavements. Additionally, several green patches were added to the existing plaza. They could not only be used for rainwater infiltration when rainfall was low, but also enrich the original landscape level.

4. Discussion

Due to the uncertainty of the planning and design process, the specificity of the practice site, and the barriers between interdisciplinary research, spatial optimization research conducted under a goal-oriented approach often generates “wicked problems”, where different optimization paths will lead to vastly different results. “Fail-to-safe” designed experiments have become an effective method to address this dilemma [34]. This theoretical and practical framework follows the general process of knowledge creation and verification in the “experimental paradigm”: proposing propositions/hypotheses—experimental verification—conclusion derivation” [35,36]. Planning and design as spatial optimization steps are integrated within interdisciplinary theories to form new targeted practical procedures. We clarify and systematically elaborate the scientific practical process and methodological experience of integrating BMPs-LIDs into small-scale space planning and design thinking.
Theoretical and practical feedback innovation in the “BMPs-Planning” phase is essential for micro-scale research. It starts from the essence of waterlogging, “runoff and detention”, taking into account the various stages of urban space rainwater discharge [37]. Currently, most research on urban micro-scale stormwater management focuses on the application of single technologies or specific types of facilities, with insufficient interdisciplinary research and a lack of systematic integrated design [10,17,32,38,39]. Researchers often overlook the basic conditions within the site space, and in larger study areas, these conditions are often abstracted into parameters or estimated using simple methods [22,40,41,42]. For example, in some engineering projects or studies, the division of sub-catchments lacks detailed planning, ignoring the impact of spatial division on runoff paths. Subsequently, the design parameters of stormwater facilities are often estimated based on the distribution of drainage outlets and site topography, which may lead to discrepancies in the design and planning of drainage solutions. Sub-catchments, as fundamental models for stormwater runoff, should not be simply estimated. Instead, considering them during the design phase can directly guide and manage stormwater.
One of the main reasons for the extensive use of estimation and empirical methods in stormwater facility planning and design is that precise calculations require substantial knowledge and effort. Many stormwater facility designs are not completed by professional drainage designers. For example, in smaller construction or renovation projects, these tasks may be handled by landscape designers or architects. Designers may not have enough time or knowledge to accurately complete the design of LID facilities. Therefore, it is essential to parametrize the design process [42], as this not only helps improve the quality of LID facility designs but also facilitates interdisciplinary knowledge exchange.
Through the process from “BMPs-Planning” to “LID-Design,” we creatively integrated BMPs-LID theory with spatial planning and design, using the deductive method of the experimental paradigm to derive a theoretical and practical framework suitable for solving urban legacy space waterlogging issues. Previously, scholars who delved into low-impact development mostly came from water supply and drainage as well as hydraulic engineering backgrounds, with their focus often being on technical innovation and application, where a site was merely one area sample for practical application. However, this framework explores more possibilities for localized research from the perspective of urban space planners and designers, viewing planning as a comprehensive management strategy, and design as a scientific practice with aesthetic characteristics. Therefore, combining BMPs-LID concepts and completing spatial optimization from a local planning-design perspective becomes the optimal path for interdisciplinary solving spatial issues.
This study, by clarifying the related theories and experimental applications of BMPs and LID facilities, further expands the research methods and perspectives of urban planning and design based on hydrological issues. It provides a theoretical and practical framework for low-impact development planning and design for other micro-scale urban spaces at risk of rainwater issues. The parametric design process also provides the possibility of batch micro-renewal for future urban spaces with flooding risks, greatly reduces the cost of interdisciplinary communication among designers, and breaks down the micro-scale empiricism of aesthetic design, thus designing urban spaces that are functional and aesthetically appealing.
However, there are some limitations in this study. First, the small size of the study site imposed constraints on factors such as site topography, underlying surface, spatial layout, and drainage facilities, making it necessary to further explore the applicability of the findings in other sites. Second, although the simulation identified the advantages and disadvantages of both proposals, the relatively small site area resulted in limited differences in our comparison of the two approaches. This was because the large proportion of green space in this case led to certain similarities between the green space balance proposal and the reduced drainage distance proposal. Finally, during the LID facilities design phase, only a parametric design program was developed to ensure the theoretical optimal performance, without validation or correction in real-world cases. This aspect will be verified in future research.

5. Conclusions

Urban micro-renewal, as an inevitable stage in the evolution of metropolitan planning and construction, presents both theoretical and practical challenges for contemporary urban planners seeking to address hydrological issues in urban spaces. In response, this study introduced an innovative two-step framework—“BMPs management-planning” and “LID-Design”—which achieved more efficient waterlogging mitigation than approaches focusing solely on LID facilities layout optimization. Through our optimization study:
  • At the BMP-P stage: SWMM simulation results indicated that the proposed spatial planning scheme—incorporating low-impact engineering measures such as adjusting topographic gradients, adjusting the curb arrangement, redistributing infiltration areas (e.g., green spaces), and adjusting drainage outlets—significantly alleviated waterlogging in existing urban spaces. Under 1-year, 5-year, 10-year, and 20-year return period rainfall conditions, Total runoff volume (Trv) was reduced by 31.5–35.7%, and Peak runoff volume (Prv) decreased by 19.4–32.4%. At the same time, the previously saturated in situ drainage rate issue was addressed, resulting in a 1.8–50.2% increase in Total discharge volume (Tdv). Consequently, urban waterlogging was substantially mitigated.
  • By comparing the two optimization scenarios, each with a different focus, we found that Plan A was more suitable for situations where small urban micro-spaces had ample green areas but insufficient pipeline drainage capacity. In such cases, Plan A allowed rainwater to be discharged more smoothly and reduced the incidence of full pipe flow. Under all return periods, the total duration of full pipe flow at all nodes in Plan A was 45–485 min shorter than that of the original site and 20–35 min shorter than that of Plan B. In contrast, Plan B was more appropriate for scenarios where the pipelines already met drainage demands and the goal was to rapidly discharge rainwater. Under these conditions, Plan B further decreased runoff volume and increased drainage volume. At the 10-year and 20-year return periods, Plan B provided an additional 3.84–4.15% increase in Reduction Total runoff volume (RTrv) and 1.75–2.51% increase in Total discharge volume (Tdv) compared to Plan A, indicating greater efficiency in such contexts.
  • In the LID-D stage, utilizing a Grasshopper-based parametric design procedure for LID facilities, the optimized deployment of Rain Gardens (RGs) and Permeable Pavements (PPs) accounted for 5.1% and 10.7% of the site area, respectively. This allocation effectively meets the immediate urban rainwater treatment needs at minimal cost. Moreover, by employing a parametric design approach, multiple small urban spaces can be optimized in batches, significantly enhancing the efficiency of both design and construction.

Author Contributions

Conceptualization, Z.H., Y.S. and Y.F.; Data curation, Z.H. and Y.S.; Formal analysis, Z.H., Y.S. and Y.F.; Funding acquisition, Z.H., Y.S. and B.Z.; Investigation, Z.H. and Y.S.; Methodology, Z.H., Y.S. and Y.F.; Project administration, Z.H., Y.S., R.G., H.Z., L.Z. and B.Z.; Resources, Z.H. and Y.S.; Software, Z.H., Y.S. and Y.F.; Supervision, Z.H. and Y.S.; Validation, Z.H., Y.S. and Y.F.; Visualization, Z.H. and Y.S.; Writing—original draft, Z.H. and Y.S.; Writing—review & editing, Z.H., Y.S., R.G., H.Z., L.Z. and B.Z. All authors have read and agreed to the published version of the manuscript.

Funding

This research was funded by the Research Funds for China-Pakistan Horticulture Research and Demonstration Centre, grant number HZAU 901-11050020116 and the Research Funds for Hebei Oriental University, grant number XJZD2025014.

Data Availability Statement

Data is contained within the article.

Conflicts of Interest

Author Lianhai Zhao was employed by the company Shandong Jianzhu University Design Group Co., Ltd. The remaining authors declare that the research was conducted in the absence of any commercial or financial relationships that could be construed as a potential conflict of interest.

Abbreviations

The following abbreviations are used in this manuscript:
BMPBest Management Practice
BMPsBest Management Practices
LIDLow Impact Development
SWMMStorm Water Management Model
PPsPermeable Pavements
RGsRain Gardens
MHDMaximum Hydraulic Depth
NHDNode Hydraulic Depth
FPFFull Pipe Flow
PrfPeak Rainfall
PrvPeak Runoff Volume
PrrPeak Runoff Rate
PdrPeak Discharge Rate
TdvTotal Discharge Volume
TrvTotal Runoff Volume
RTrvReduction Total Runoff Volume

Appendix A

Table A1. Data required for advance preparation.
Data Prepared for “BMPs-Planning” Phase (Input to SWMM)
Name UnitValue Source Name UnitValueSource
Sub-catchment
Areaha-CAD MeasurementImpervious Depression Storagemm-on-site surveying
Characteristic WidthM-on-site surveying/CAD MeasurementPermeable Depression Storagemm-on-site surveying
Slope%-DEM elevationPercentage of Impervious Area without Depression Storage%-on-site surveying
Percentage of Impervious Area%-CAD MeasurementSub-area Computation--on-site surveying
Imperviousness N Value-0.015Fangyi, H. [43]Computation Percentage%-on-site surveying
Permeability N Value-0.6Fangyi, H. [43]Infiltration-HORTONFangyi, H. [43]
Infiltration Model
Maximum Infiltration Ratemm/h76.2Fangyi, H. [43]Decay Constant1/h7Fangyi, H. [43]
Minimum Infiltration Ratemm/h3.3Fangyi, H. [43]
Nodes
Invert ElevationM-CAD MeasurementPonding Aream2-on-site surveying
Maximum DepthM-CAD Measurement
Pipes
Pipe Shape--on-site surveyingRoughness Coefficient-0.013SWMM manual
Maximum DepthM-CAD MeasurementAverage Loss Coefficient-2SWMM manual
LengthM-CAD Measurement
Data Preparation for “LID-Design” Phase (input to Grasshopper)
Elevation Information--on-site surveyingRunoff Pathways--Based on elevation information
Sub-catchment
Plant Locations--on-site surveyingBuilding Locations--on-site surveying
Pipeline Locations--on-site surveyingPermeable Substrate Locations--on-site surveying
Pavement Locations--on-site surveying
Rainfall Runoff Coefficient
Green Space-0.1–0.15Reference Relevant Standards [26] Depthm0.2Reference Relevant Standards [26]
Roads-0.8–0.9Reference Relevant StandardsPlaza Boundary--on-site surveying
Plazas-0.5–0.9Reference [26] Relevant Standards closest drainage outlet\location of green area--on-site surveying
Design Rainfall Amountmm26.1Reference [26] Relevant Standards [26] Permeable Paving Ratio%50Reference Relevant Standards [26]
Catchment Areaha-on-site surveying

References

  1. Hussain, R.; Wu, R.-S.; Abbas, T. Rainwater harvesting potential and utilization for artificial recharge of groundwater using recharge wells. Processes 2019, 7, 623. [Google Scholar] [CrossRef]
  2. Bąk, J.; Barjenbruch, M. Benefits, inconveniences, and facilities of the application of rain gardens in urban spaces from the perspective of climate change—A review. Water 2022, 14, 1153. [Google Scholar] [CrossRef]
  3. Jia, H.; Wang, Z.; Mao, X.; Xu, C. SWMM-based methodology for block-scale lid-bmps planning based on site-scale multi-objective optimization: A case study in tianjin. Front. Environ. Sci. Eng. 2017, 11, 1. [Google Scholar] [CrossRef]
  4. Wang, F.; Yu, Y.; Huang, Z.; Li, M.; Guan, Y. Comprehensive performance evaluation of lid practices for the sponge city construction: A case study in Guangxi, China. J. Environ. Manag. 2019, 231, 10–20. [Google Scholar] [CrossRef]
  5. Li, J.; Gao, X.; Yao, Y.; Jiang, C. Comprehensive analysis of waterlogging control and carbon emission reduction for optimal lid layout: A case study in campus. Environ. Sci. Pollut. Res. 2022, 29, 87802–87816. [Google Scholar] [CrossRef]
  6. Tarr, K.R. Incorporating Sustainability in Infrastructure Design: A Case Study of Phoenix; Arizona State University: Tempe, AZ, USA, 2024. [Google Scholar]
  7. Wu, J. Preliminary study on the landscape design of sponge campus based on lid concept—A case study of landscape design in wuhan university of technology. In IOP Conference Series: Earth and Environmental Science; IOP Publishing: Bristol, UK, 2021; Volume 621, p. 012109. [Google Scholar] [CrossRef]
  8. Xie, J.; Wu, C.; Li, H.; Chen, G. Study on storm-water management of grassed swales and permeable pavement based on SWMM. Water 2017, 9, 840. [Google Scholar] [CrossRef]
  9. Jaszczak, A.; Kristianova, K.; Pochodyła, E.; Vaznonienė, G. New revolution-green solutions in urban design. In Presented at IOP Conference Series: Materials Science and Engineering; IOP Publishing: Bristol, UK, 2020; Volume 960, p. 022014. [Google Scholar]
  10. Jia, H.; Lu, Y.; Yu, S.L.; Chen, Y. Planning of lid–bmps for urban runoff control: The case of beijing olympic village. Sep. Purif. Technol. 2012, 84, 112–119. [Google Scholar] [CrossRef]
  11. Zhang, K.; Chui, T.F.M. A comprehensive review of spatial allocation of lid-bmp-gi practices: Strategies and optimization tools. Sci. Total Environ. 2018, 621, 915–929. [Google Scholar] [CrossRef]
  12. Jin, M.; Tian, G.; Bai, T.; Wang, G.; Zheng, J.; He, R. Influence of spatial layout on urban rainfall runoff. Bull. Soil Water Conserv. 2018, 38, 33–39. [Google Scholar] [CrossRef]
  13. Zeng, Z.; Jiang, Y.; Han, M.; Jin, J. Influence of catchment area on selection of sensitive parameters for SWMM simulation of rainwater runoff. Water Resour. Power 2022, 40, 10–13+22. [Google Scholar] [CrossRef]
  14. Bai, Y.; Li, Y.; Zhang, R.; Zhao, N.; Zeng, X. Comprehensive performance evaluation system based on environmental and economic benefits for optimal allocation of lid facilities. Water 2019, 11, 341. [Google Scholar] [CrossRef]
  15. Gao, J.; Li, J.; Li, Y.; Xia, J.; Lv, P. A distribution optimization method of typical lid facilities for sponge city construction. Ecohydrol. Hydrobiol. 2021, 21, 13–22. [Google Scholar] [CrossRef]
  16. Kourtis, I.; Kopsiaftis, G.; Bellos, V.; Tsihrintzis, V. Calibration and validation of SWMM model in two urban catchments in athens, greece. In Proceedings of the International Conference on Environmental Science and Technology (CEST), Rhodes, Greece, 31 August–2 September 2017. [Google Scholar]
  17. Lee, J.-M.; Hyun, K.-H.; Choi, J.-S.; Yoon, Y.-J.; Geronimo, F.K.F. Flood reduction analysis on watershed of lid design demonstration district using SWMM5. Desalination Water Treat. 2012, 38, 326–332. [Google Scholar] [CrossRef]
  18. Chen, Y.; Samuelson, H.W.; Tong, Z. Integrated design workflow and a new tool for urban rainwater management. J. Environ. Manag. 2016, 180, 45–51. [Google Scholar] [CrossRef]
  19. Sai Kumar Manapragada, N.V. Approach to simulate the rainwater runoff at site level using rhino grasshopper. In A System Engineering Approach to Disaster Resilience: Select Proceedings of Vcdrr 2021; Springer: Berlin/Heidelberg, Germany, 2022; pp. 339–350. [Google Scholar]
  20. Waibel, C.; Bystricky, L.; Kubilay, A.; Evins, R.; Carmeliet, J. Validation of grasshopper-based fast fluid dynamics for air flow around buildings in early design stage. In Presented at Building Simulation; IBPSA: Ottawa, ON, Canada, 2017; pp. 7–9. [Google Scholar] [CrossRef]
  21. Li, X.; Yu, S.; Jing, J.; Ni, N. Domestic application review of grasshopper parametric design method based on bibliometric analysis. Packag. Eng. 2023, 44, 34–41. [Google Scholar] [CrossRef]
  22. Lin, C.; Dong, Y.; Chen, H.; Li, X. Optimal calculation method of size of lid facilities for rainwater harvesting green space based on nsga-ii algorithm and application: A case study of nanyang academician town. Landsc. Archit. 2020, 27, 92–97. [Google Scholar]
  23. Diogo, A.F.; Barros, L.T.; Santos, J.; Temido, J.S. An effective and comprehensive model for optimal rehabilitation of separate sanitary sewer systems. Sci. Total Environ. 2018, 612, 1042–1057. [Google Scholar] [CrossRef]
  24. Freire Diogo, A.; Carmo, J.A.D. Peak flows and stormwater networks design—Current and future management of urban surface watersheds. Water 2019, 11, 759. [Google Scholar] [CrossRef]
  25. Gironás, J.; Roesner, L.A.; Rossman, L.A.; Davis, J. A new applications manual for the storm water management model (SWMM). Environ. Model. Softw. 2010, 25, 813–814. [Google Scholar] [CrossRef]
  26. Committee, S.C.M. Shijiazhuang Sponge City Planning and Design Guidelines. 2016. Available online: https://jz.docin.com/p-2369057293.html (accessed on 19 January 2025).
  27. Wang, C.; Li, F.; Han, Z.; Zhu, J.; Yang, J.; Liu, Z.; Qu, W. The effect of bioretention systems on stormwater runoff of Shijiazhuang. J. Irrig. Drain. 2022, 41, 87–94. [Google Scholar] [CrossRef]
  28. Wei, W. Renovation of Rainwater Garden in Shijiazhuang City Based on SWMM Model—Taking Zhaotuo Park as an Example. Master’s Thesis, Hebei University of Engineering, Handan, China, 2020. [Google Scholar]
  29. Xie, Y. The Method and Application of Urban Sewer System Simulation. Master’s Thesis, Tongji University, Shanghai, Chian, 2007. [Google Scholar]
  30. Zhou, Y.; Yu, M.; Chen, Y. Estimation of sub-catchment width in SWMM. China Water Wastewater 2014, 30, 61–64. [Google Scholar] [CrossRef]
  31. Ding, S.; Zeng, J. Waterlogging prevention and control scheme in waterfront area based on SWMM model—A case study of xinglin bay in xiamen. Chin. Landsc. Archit. 2020, 36, 70–75. [Google Scholar] [CrossRef]
  32. Lu, M.; Jiang, S.; Qiu, H. Rainwater regulation effect of lid facilities on urban roads based on SWMM: A case study of Wuhan industrial road. Huazhong Archit. 2021, 39, 58–64. [Google Scholar] [CrossRef]
  33. Wang, Z. Ecophronesis and actionable ecological knowledge. Urban Plan. Int. 2017, 32, 16–21. [Google Scholar] [CrossRef]
  34. Kato, S.; Ahern, J. ‘Learning by doing’: Adaptive planning as a strategy to address uncertainty in planning. J. Environ. Plan. Manag. 2008, 51, 543–559. [Google Scholar] [CrossRef]
  35. Yue, B.; Kang, S. Review of the types and paradigms of landscape planning theories. Landsc. Archit. 2020, 3, 63–68. [Google Scholar] [CrossRef]
  36. Wu, J. The Sustainable Runoff Regulation and Rainwater Landscape Construction Research of Old Blocks in Mountain City. Master’s Thesis, Southwest University, Chengdu, China, 2018. [Google Scholar]
  37. Saniei, K.; Yazdi, J.; MajdzadehTabatabei, M.R. Optimal size, type and location of low impact developments (lids) for urban stormwater control. Urban Water J. 2021, 18, 585–597. [Google Scholar] [CrossRef]
  38. Jiang, Y.; Qiu, L.; Gao, T.; Zhang, S. Systematic application of sponge city facilities at community scale based on SWMM. Water 2022, 14, 591. [Google Scholar] [CrossRef]
  39. Babaei, S.; Ghazavi, R.; Erfanian, M. Urban flood simulation and prioritization of critical urban sub-catchments using SWMM model and promethee ii approach. Phys. Chem. Earth Parts A/B/C 2018, 105, 3–11. [Google Scholar] [CrossRef]
  40. Liu, Y. Study on the Regulation of Stormwater Runoff in Sponge Reconstructed Community Based on SWMM. Master’s Thesis, Beijing University of Civil Engineering and Architecture, Beijing, China, 2020. [Google Scholar]
  41. Zhou, Y. Study on Sponge Reconstruction of Urban Infrastructure Based on SWMM. Master’s Thesis, Anhui Jianzhu University, Hefei, China, 2022. [Google Scholar]
  42. Guo, J.; Yang, T.; Chen, B.; Wang, Z. Rapid construction of SWMM model for municipal storm sewer system based on gis preprocessing. Water Wastewater Eng. 2019, 55, 131–134. [Google Scholar] [CrossRef]
  43. Hu, F. Study on Greenway Planning and Design in Shallow Mountainous Areas of North China Based on Stormwater Management—Taking Greenway Planning and Design of Shanqian Avenue in Luquan District of Shijiazhuang City as an Example. Master’s Thesis, Beijing Forestry University, Beijing, China, 2019. [Google Scholar]
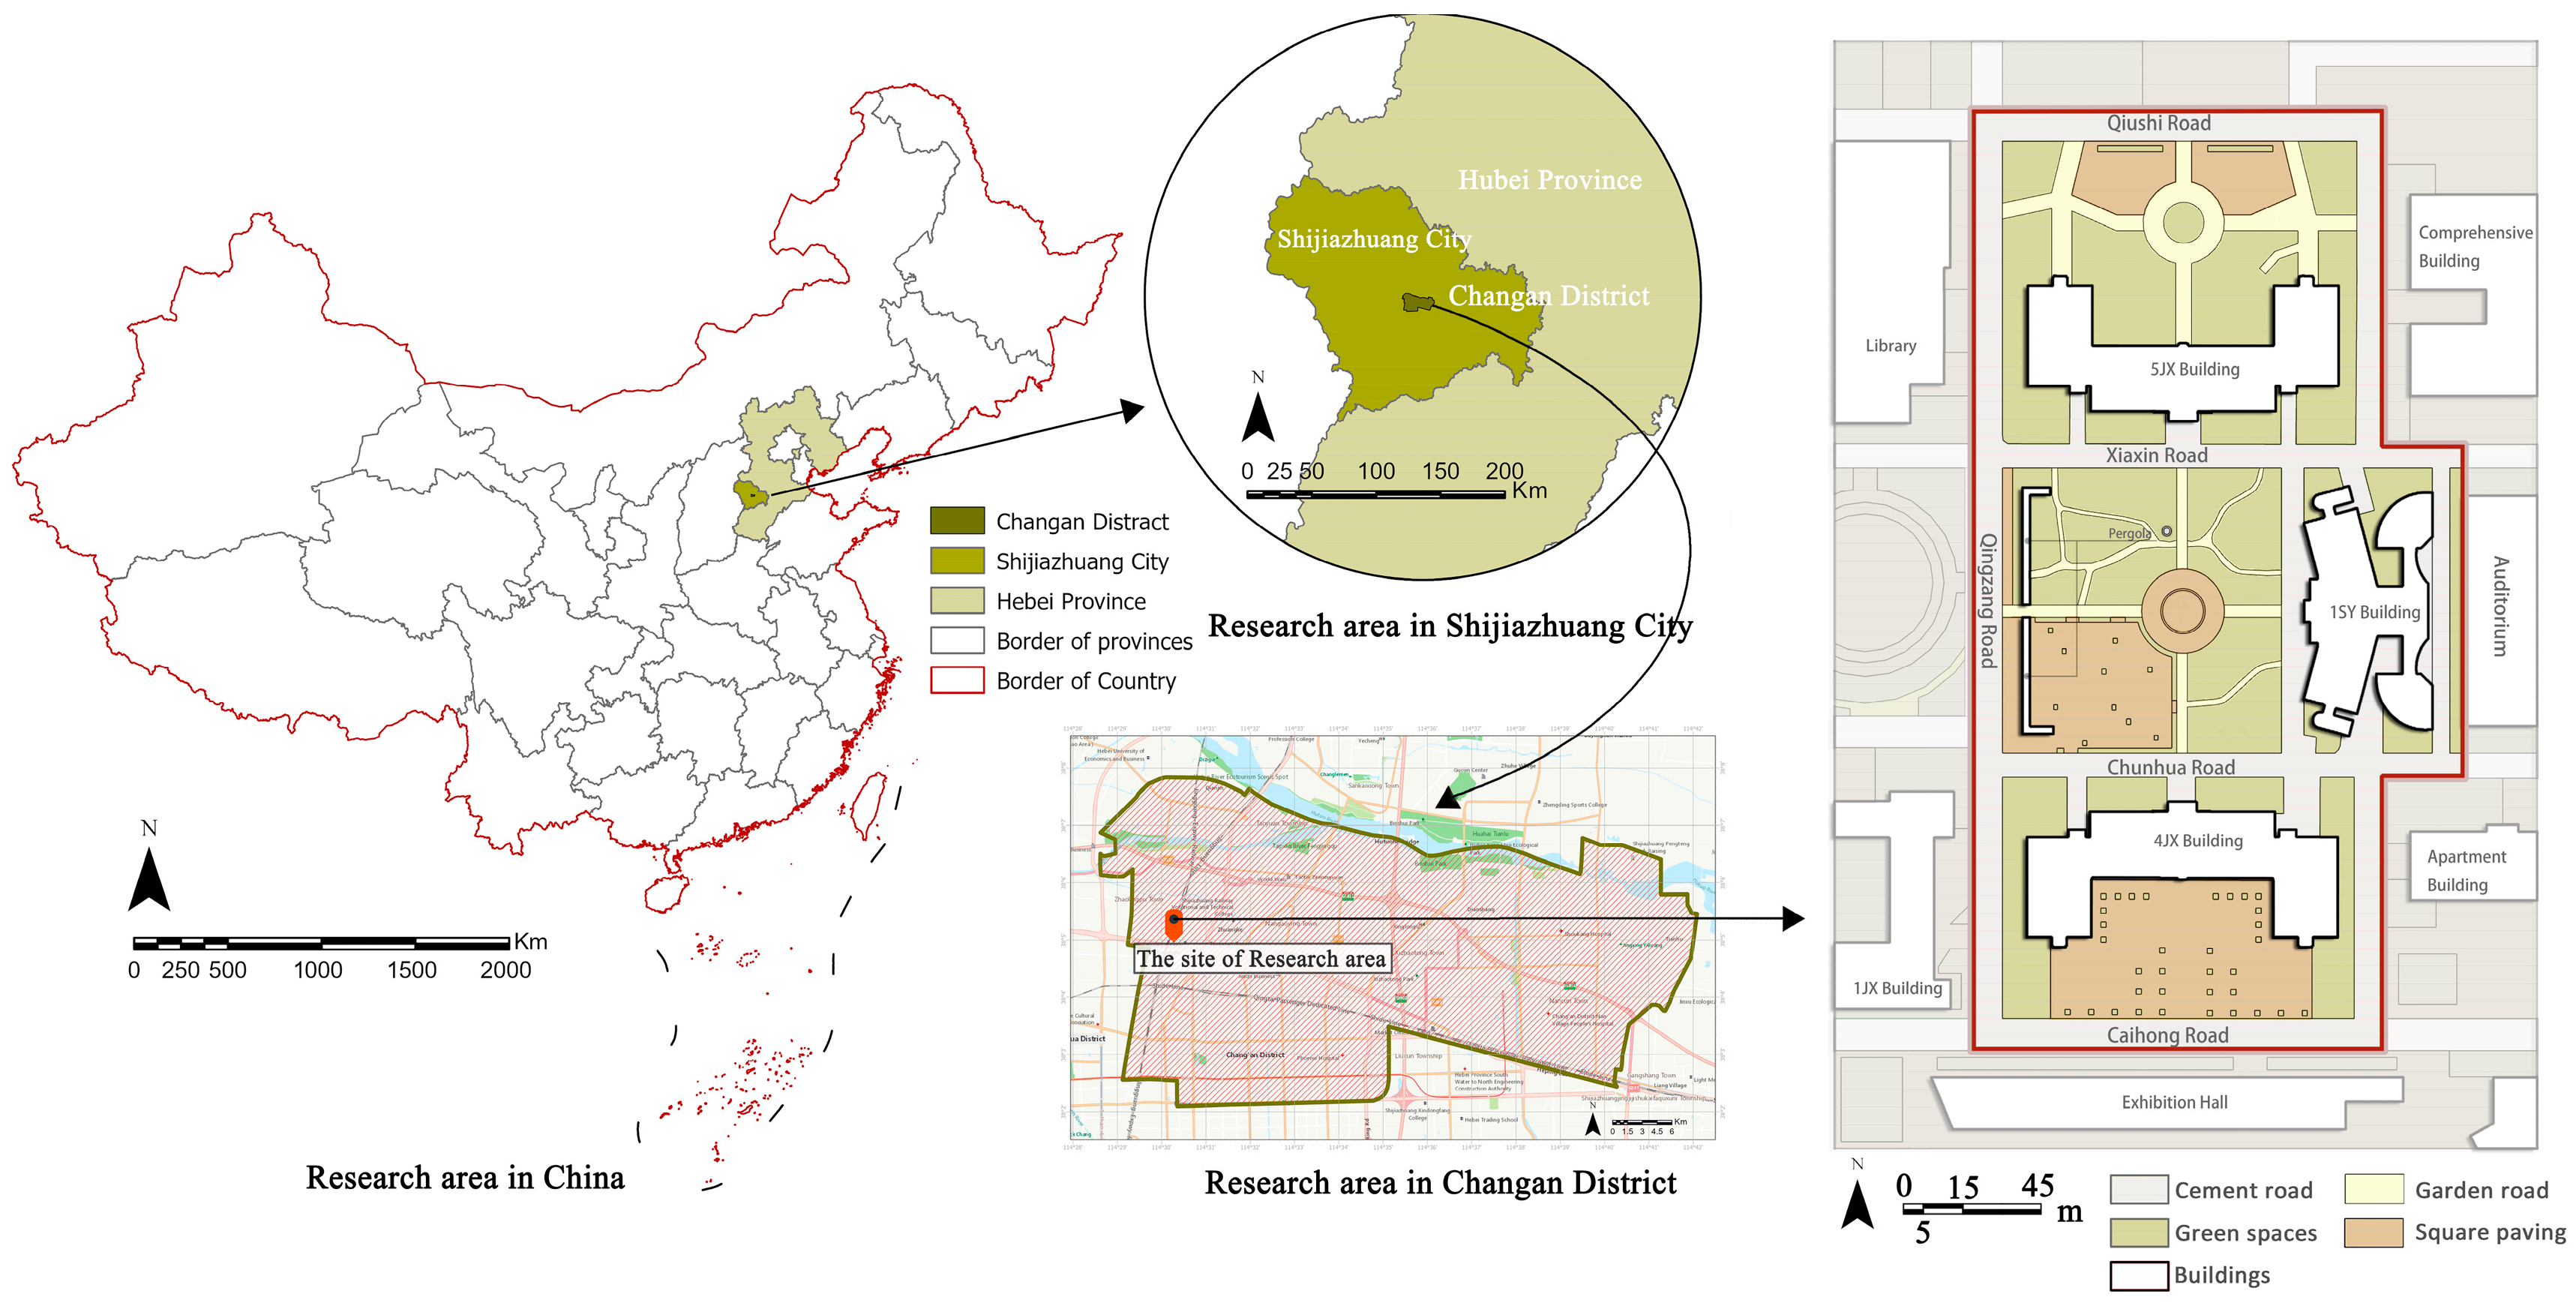
Figure 1. Research area.
Water 17 00992 g001
Figure 2. Study framework.
Water 17 00992 g002
Figure 3. Planning programs and status of the study area.
Water 17 00992 g003
Figure 6. Drainage pipe flow rate.
Water 17 00992 g006
Figure 7. Comparison of total runoff volume.
Water 17 00992 g007
Figure 8. Changes in runoff rate over time.
Water 17 00992 g008
Figure 9. Comparison of total discharge volume.
Water 17 00992 g009
Figure 10. Change in discharge rate over time.
Water 17 00992 g010
Figure 11. Runoff-Discharge Analysis.
Water 17 00992 g011
Figure 12. Analysis graph of node hydraulic depth-maximum hydraulic depth difference.
Water 17 00992 g012
Figure 13. LID facilities layout and general site design.
Water 17 00992 g013
Table 1. Comparison of optimization options.
PlanNumber of Sub-Catchments40–60% Permeable Area RatioAverage Feature WidthAverage Sub-Catchment Area
Plan A5453.6%16.9 m0.03972 ha
Plan B5538.8%17.35 m0.03889 ha
Table 2. Selection of LID facilities in the study area.
LID Facilities LID Facilities Configuration ScenariosSite ConstraintsUse or Not
Rain gardenDepressed green space for collecting runoff from surrounding impervious surfaces such as sidewalks, driveways, and rooftopsTopography: Factors such as terrain undulation, slope, and aspect affect the design and layout of rain gardens.
Soil Conditions: Soil texture, drainage characteristics, and water retention capacity influence the effectiveness of rain gardens.
use
Bioretention basinSmall isolated green space for collecting runoff from surrounding impervious surfaces such as sidewalks, driveways, and rooftopsSmall green areas near hard surfaces, predominantly with tree pits, all less than 1 m wide, and with complex underground piping, unsuitable for such installations.not
Permeable pavingImpervious surfaces requiring management of stormwater runoffPermeable pavement site constraints include underground infrastructure, groundwater level, soil conditions, ground slope, and load-bearing capacity. These factors influence its design and performance.use
Green roofUtilized in urban environments for commercial, residential, and public buildings to increase green space and reduce stormwater runoff.The buildings on the site are of old construction with insufficient structural strength. The roofs are primarily pitched roofs, making them unsuitable for installing such facilities.not
Vegetated swalePlaced along the edges or surrounding areas of roads, parking lots, residential areas, and commercial districts, they serve as linear structures designed to intercept and filter runoff.The site is densely developed with limited space, and the roads are in a heavily trafficked area. Additionally, there are many moisture-sensitive trees surrounding the green spaces, making it unsuitable for installing such facilities.not
Table 3. NSE Coefficient Model Test Results (Units of flow rate: m3/h).
TimeQiushi RoadXiaxin RoadChuanhua RoadCaihong Road
Simulated Flow RateMeasured Flow RateSimulated Flow RateMeasured Flow RateSimulated Flow RateMeasured Flow RateSimulated Flow RateMeasured Flow Rate
13:0012.612.26.125.822.6822.33.63.6
14:0013.32146.126.523.0422.73.63.6
15:0013.3213.75.765.423.423.43.242.9
16:0011.8811.25.4522.6823.42.882.5
17:0011.169.75.45.421.621.23.243.2
18:0012.611.96.486.821.9622.33.963.6
The value of NSE0.6990.7390.6910.629
Table 4. Runoff reduction percentage.
Return Periods1-Year5-Year10-Year20-Year
Total Runoff ReductionReduction PercentageTotal Runoff ReductionReduction PercentageTotal Runoff ReductionReduction PercentageTotal Runoff ReductionReduction Percentage
Plan A368.72 m334.3%670.02 m333.3%1549.88 m331.8%1782.81 m331.5%
Plan B353.19 m332.9%700.15 m334.8%1736.99 m335.7%2018.15 m335.6%
Table 5. Discharge increase percentage.
Return Periods1-Year5-Year10-Year20-Year
Total Discharge IncreaseIncrease PercentageTotal Discharge IncreaseIncrease PercentageTotal Discharge IncreaseIncrease PercentageTotal Discharge IncreaseIncrease Percentage
Plan A9.13 m31.8%293.57 m340.7%542.19 m329.1%863.36 m341.4%
Plan B80.09 m316%361.97 m350.2%688.95 m337%899.88 m343.2%
Disclaimer/Publisher’s Note: The statements, opinions and data contained in all publications are solely those of the individual author(s) and contributor(s) and not of MDPI and/or the editor(s). MDPI and/or the editor(s) disclaim responsibility for any injury to people or property resulting from any ideas, methods, instructions or products referred to in the content.