1. Introduction
In the context of increasingly strengthened global environmental governance, how to promote corporate sustainability through policy instruments has become a common concern for both academics and policy makers [
1,
2,
3]. As climate change, environmental pollution, and resource shortages become more prominent, enterprises, as the core actors in economic activities, are not only contributors to environmental problems but also key drivers of green development [
4,
5]. The rational design and effective implementation of policy tools can guide businesses to take environmental responsibility and promote green and low-carbon transitions, building on market mechanisms [
6]. Consequently, governments around the world have adopted various policy measures, such as environmental taxation, emission trading systems, and subsidy incentives, to achieve coordinated development between economic growth and environmental protection [
7].
Among various environmental policy instruments, environmental tax policies have become a typical representative of market-oriented environmental governance measures due to their ability to internalize external environmental costs [
8,
9]. Environmental tax policies increase the environmental compliance costs for enterprises by levying taxes and fees on behaviors such as pollution emissions and resource consumption, thereby incentivizing companies to reduce emissions and enhance environmental investments [
10]. Although theoretically environmental taxation can enhance corporate environmental responsibility, its actual effectiveness depends on policy design, enforcement intensity, and how enterprises respond to the policy [
11,
12]. In recent years, some studies have explored the impact of environmental tax policies, such as carbon taxes and pollution discharge fees, on corporate behavior, finding that different types of enterprises may exhibit varying adaptive capacities and innovation behaviors under environmental policies [
13,
14,
15]. However, there is still a lack of systematic research on how environmental tax policies affect the overall sustainability performance of enterprises, especially from an integrated perspective of ESG factors.
Environmental, Social, and Governance (ESG) criteria have emerged as a holistic framework for evaluating corporate performance beyond purely financial metrics. Environmental considerations relate to a firm’s resource usage, emissions, and overall impact on the natural environment. Social factors address how companies manage relationships with employees, suppliers, customers, and local communities, reflecting labor practices and broader societal responsibilities. Governance pertains to a firm’s leadership structure, board accountability, executive compensation, audits, and shareholder rights. By examining all three pillars—environmental, social, and governance—ESG evaluations offer insight into how companies balance economic objectives with sustainable development and social welfare.
As one of the government-led environmental tax policies, China’s water resources tax reform represents an important institutional innovation in the field of environmental governance in recent years [
16]. Since its initial pilot implementation on a small scale in 2016, the water resources tax reform has been gradually rolled out nationwide, aiming to regulate corporate water usage through market-oriented approaches, improve water resource efficiency, and promote ecological and environmental protection. Compared with the traditional water resources fee system, the water resources tax reform not only adjusts the water usage costs for enterprises but also optimizes the taxation mechanism and strengthens government supervision over corporate water usage behaviors [
17,
18]. Against this backdrop, whether the water resources tax reform effectively encourages enterprises to fulfill their environmental responsibilities and ultimately improves their overall ESG performance becomes a question worthy of in-depth exploration.
This paper takes China’s water resources tax reform as the research object and uses data from A-share listed companies in China from 2013 to 2023 to construct a difference-in-differences model, empirically analyzing the impact of the water resources tax reform on corporate ESG performance. The results show that this reform significantly improves corporate ESG performance, and this conclusion is supported by a series of robustness tests. Further mechanism analysis reveals that the water resources tax reform enhances corporate ESG performance through three main channels: (1) promoting breakthroughs in green technological innovation, driving progress in water-saving and environmental protection technologies; (2) increasing environmental investment, strengthening the construction of environmental protection facilities and enhancing sustainable development capabilities; (3) raising pressure in the capital market, increasing analyst attention, and encouraging enterprises to place greater emphasis on ESG information disclosure and governance improvements. Additionally, media attention plays a moderating role in this process, potentially amplifying policy effects by guiding public opinion supervision and reinforcing market expectations. Heterogeneity analysis shows that the water resources tax reform has a more significant impact on the ESG performance of non-state-owned enterprises and large enterprises, indicating differences in responses to environmental tax policies among different types of enterprises.
This study makes several important contributions to the literature on environmental policy and corporate sustainability. First, while prior research has extensively examined the impact of environmental regulations on corporate behavior, empirical evidence on the effects of fiscal instruments, such as water resources taxation, on firms’ ESG performance remains limited. By employing a difference-in-differences approach and leveraging a quasi-natural experiment, this study provides robust causal evidence on how resource-based taxation influences corporate sustainability outcomes. Second, unlike existing studies that often focus on direct regulatory compliance costs, our analysis uncovers the indirect yet substantial role of capital market pressure and media attention in reinforcing corporate ESG improvements, offering new insights into the broader institutional mechanisms shaping corporate environmental strategies. Third, this paper enriches the understanding of firm heterogeneity in responding to environmental policies by demonstrating that state-owned enterprises and larger firms are more responsive to the tax reform, highlighting the role of ownership structure and firm size in moderating policy effectiveness. These findings not only deepen the theoretical discourse on government-led environmental governance but also provide practical implications for policy makers seeking to design more effective fiscal tools to promote corporate sustainability.
This study not only enriches the theoretical understanding of the relationship between environmental tax policies and corporate sustainability but also provides important empirical support for policy makers. In the current global context, where challenges such as environmental pollution, resource scarcity, and climate change are becoming increasingly pressing, governments around the world are gradually strengthening their supervision of corporate environmental behavior and guiding enterprises toward green and low-carbon transitions through policy measures. However, achieving a balance between economic development and environmental protection remains a core issue that policy makers need to address. As an important practice in China’s recent environmental governance policies, the success of the water resources tax reform has significant practical implications not only for China but also offers a replicable policy framework for other developing countries and resource-intensive economies.
The remainder of this paper is structured as follows.
Section 2 reviews the relevant literature and develops the theoretical framework, outlining the expected effects of water resources tax reform on corporate ESG performance and introducing the institutional background of China’s water resources tax reform.
Section 3 formulates the research hypotheses.
Section 4 describes the data, key variables, and empirical methodology, including the difference-in-differences approach used to identify causal effects.
Section 5 presents the baseline regression results, robustness checks, and mechanism analyses, examining the role of green technological innovation, environmental investment, capital market pressure, and media attention. Then explores heterogeneity effects by firm characteristics, such as ownership structure and firm size.
Section 6 discusses the implications of the findings for environmental policy and corporate governance, and concludes with key takeaways and directions for future research.
2. Literature Review
As a market-based regulatory tool, the water resources tax reform aims to optimize water resource allocation, improve water resource efficiency, and guide enterprises in fulfilling their ESG responsibilities [
19]. The implementation of the water resources tax seeks to regulate water usage through price levers, enhance water use efficiency, and promote water environmental protection [
20]. Additionally, the water resources tax can generate synergistic effects with other energy and climate policies, such as carbon taxes [
21]. Existing research has provided important theoretical and empirical support for understanding the mechanisms of the water resources tax and its optimization pathways.
2.1. Policy Background of the Water Resources Tax Reform
The necessity for water resources tax reform primarily stems from the worsening issue of water scarcity on a global scale. As a fundamental natural resource, the rational development and efficient utilization of water resources are directly linked to the sustainable development of society and the economy [
22]. However, due to long-standing issues such as low water pricing, surging demand for irrigation and industrial water use, insufficient industrial wastewater treatment systems, and excessive emissions, many countries and regions face severe problems of water wastage, over-exploitation, and water pollution [
23,
24,
25]. Traditional administrative control models, such as water resource quota management and administrative approval, have, to some extent, controlled total water usage. However, due to the lack of effective market incentive mechanisms, they often fail to encourage enterprises and individuals to conserve water voluntarily [
26,
27]. Consequently, water resources tax reform based on market mechanisms has become an important global trend in water resource management in recent years.
As an important tool for government regulation of market behavior, tax policies have accumulated extensive international experience in the field of water resource management. European countries were among the first to implement water resources taxes and used relatively high tax rates to promote the adoption of industrial water-saving technologies [
28]. Countries such as Germany, the Netherlands, and Denmark have relatively mature water resources tax policies, characterized by differentiated tax rates for different types of water usage (e.g., industrial, agricultural, and residential) combined with pollution discharge fee systems to achieve sustainable water resource utilization. Studies have shown that after the implementation of Germany’s water resources tax policy, industrial enterprises widely adopted water-saving and wastewater recycling technologies to reduce their tax burdens [
29], while the Netherlands’ tiered water resources tax encouraged high-water-consuming industries to improve water use efficiency [
30]. Some scholars also use multi-criteria models to examine the quality of local governance [
31]. Therefore, a well-designed water resources tax policy can not only effectively control water demand but also drive technological innovation in related industries, reduce water pollution, and enhance overall water resource efficiency.
In contrast, China’s water resources tax reform has adopted a gradual approach, with pilot regions carefully considering local water resource endowments, economic development levels, and water usage structures. China has long implemented a water resource fee system. Since the promulgation of the Shanghai Deep Well Management Measures in 1979, water resource fees have been incorporated into the government’s collection plan. Subsequently, other provinces issued similar local regulations and began collecting water resource fees. At this stage, there was no nationally unified method for water resource fee collection, resulting in a relatively disorganized process. To address this issue, China enacted the Water Law in 1988, incorporating water resource fee collection into legal supervision and providing a legal basis for its implementation. Since the beginning of the 21st century, large-scale water consumption has coexisted with pollution-induced water shortages. To promote the intensive and circular utilization of water resources, the State Council issued the Regulations on Water Withdrawal Permits and Water Resource Fee Collection Management in 2006, integrating the management of water withdrawal permits with water resource fee collection while clearly defining the collection standards and procedures. In 2008, the Ministry of Finance, the Ministry of Water Resources, and the National Development and Reform Commission jointly issued the Measures for the Collection and Use of Water Resource Fees, further refining the water resource fee system. However, due to issues such as inconsistent fee standards and low water prices, the development and protection of water resources across different regions did not show significant improvement. In 2016, China launched its first water resources tax reform pilot program in Hebei Province, subsequently expanding it to several other provinces. The pilot policies were tailored to regional water supply and demand conditions, setting higher tax rates for areas with severe groundwater over-exploitation, while adopting differentiated tax policies for agricultural, industrial, and residential water usage to ensure fairness and feasibility in implementation. In November 2017, the State Council expanded the scope of the water resource tax reform by issuing the Implementation Measures for the Expansion of the Water Resource Tax Reform Pilot, bringing nine provincial-level administrative regions into the reform scope. In 2024, the Ministry of Finance, the State Administration of Taxation, and the Ministry of Water Resources issued the Implementation Measures for the Pilot Reform of Water Resource Tax, further expanding the pilot program nationwide. Research findings indicate that after the pilot program was implemented in Hebei, noticeable changes occurred in the water usage behaviors of enterprises and farmers. Some enterprises reduced their water consumption per unit of product through technological upgrades, while some agricultural producers decreased agricultural water usage by promoting water-saving irrigation techniques [
17,
32]. Additionally, since part of the revenue from the water resources tax was allocated to water ecosystem restoration, the declining trend of groundwater levels in the pilot regions was alleviated. This demonstrates that the water resources tax not only promotes water conservation but also provides stable fiscal support for improving the water resource environment [
33].
2.2. Theoretical Foundation of the Water Resources Tax Reform
Based on the Pigovian Tax theory, taxing activities that generate negative externalities (such as pollution or resource wastage) can internalize their social costs, thereby reducing market failures [
34]. While the goal of a Pigovian tax is to internalize externalities and promote efficient water use, setting a tax rate that is both effective and equitable is inherently challenging [
35]. In water resource management, over-extraction and wastage of water resources can lead to ecological damage and water scarcity, problems whose negative externalities are often not directly reflected in water prices. This makes it difficult for market mechanisms to effectively regulate water usage behavior. Water taxes often require supplementary policies to mitigate unintended social and economic consequences [
18]. Imposing taxes on water usage can internalize the external costs associated with overuse, thus promoting sustainable utilization. Some scholars, drawing on this theory, argue that taxing water consumption is more effective in promoting water conservation and reducing pollutant emissions compared to wastewater taxes [
36]. Other scholars suggest that an appropriate water resources tax can enhance the signal of water scarcity, encouraging users to focus more on water conservation while also generating fiscal revenue for governments to invest in water resource protection and infrastructure development [
37]. However, some researchers point out that accurately estimating the social costs of negative externalities and effectively translating them into tax rates remains a significant challenge in policy design [
38]. And setting excessively high tax rates can discourage industrial growth and risk wider economic and social harm, particularly in regions highly dependent on water-intensive industries [
39].
The Coase Theorem provides another perspective on market-based regulation of water resource allocation. In water resource management, if water rights are clearly defined and water users can freely trade these rights (e.g., in a water rights trading market), then even without a water resources tax, the market could achieve effective water resource allocation through supply and demand mechanisms. However, in reality, water rights are often unclear, and due to factors such as administrative controls and uneven geographic distribution, the transaction costs associated with water rights are relatively high, limiting the effectiveness of market mechanisms. Therefore, compared to fee-based approaches [
40], the water resources tax can be seen as an alternative regulatory tool that adjusts supply and demand relationships through taxation, leading to more rational water resource allocation. Existing research has shown that, under the determination of an optimal tax rate range [
41], tax policies play a positive role in promoting water conservation, reducing pollution, and enhancing social welfare [
42], and can significantly decrease ammonia-nitrogen emissions [
43]. Some scholars argue that combining water resources taxes with water rights trading can enhance policy flexibility, allowing for overall water usage to be regulated through taxation while enabling users to engage in water rights trading within a certain scope, thereby reducing the economic burden and administrative costs associated with taxation [
18].
Other scholars have explored water resources taxes from the perspective of behavioral economics, emphasizing that taxation influences water usage not only through price effects but also by altering long-term user habits via psychological expectations and information dissemination [
44]. Traditional economics assumes that consumers and enterprises are fully rational and will adjust their water consumption based on changes in water prices. However, research in behavioral economics has found that user responses may be influenced by cognitive biases, social norms, and other factors [
45]. Some studies indicate that the implementation of a water resources tax not only directly increases water usage costs but may also strengthen water conservation awareness through the “tax signal” effect [
18]. When users observe an increase in water resource taxes, they tend to perceive water scarcity as a serious issue, prompting them to adopt more proactive water-saving behaviors, even if their actual economic burden does not significantly increase. Furthermore, when governments implement water resources taxes, they can enhance policy effectiveness by guiding public awareness and promoting social responsibility for water conservation through information campaigns and educational initiatives [
46].
2.3. Policy Evaluation and Socioeconomic Impacts of the Water Resources Tax Reform
China’s water resources tax reform, which began as a pilot program in Hebei Province in 2016 and was subsequently expanded to multiple provinces nationwide, has revealed certain heterogeneities in implementation effects due to differences in economic structure, water demand, and water resource endowments across regions [
39]. In water-scarce northern regions, the tax policy has shown a more significant constraining effect on industrial and agricultural water usage, whereas in southern regions with relatively abundant water resources, the policy impact is weaker [
47]. The reform demonstrated more pronounced effects in its early stages, but these effects gradually diminished over time [
48]. Furthermore, some studies have pointed out that due to variations in tax rate design, collection methods, and complementary policies, the implementation of the water resources tax reform still faces challenges such as tax burden shifting, enterprise-adaptive adjustments, and increased regulatory costs [
37].
The water resources tax policy guides various industries to adjust their water usage more rationally by increasing water usage costs, thereby reducing inefficient and high-water consumption practices. Empirical studies have shown that after the implementation of the water resources tax, water consumption in high-water-consuming industries (such as textiles, chemicals, steel, and papermaking) has shown a downward trend, while the proportion of low-water-consuming, high-value-added industries has gradually increased [
49]. Other studies have also demonstrated that the water resources tax policy can enhance corporate information disclosure through green innovation channels [
50]. Following the pilot reform of the water resources tax in Hebei Province, China, some high-water-consuming manufacturing enterprises, facing rising water costs, were compelled to optimize their production processes and increase the proportion of recycled water usage to reduce their tax burdens [
51]. Some companies began adopting more refined water management approaches, such as water recycling and wastewater reuse, to improve water efficiency [
52].
From the perspective of industrial development, the water resources tax not only promotes innovation in corporate water-saving technologies but may also have profound impacts on industrial structure [
53]. Studies have shown that increasing environmental taxes significantly reduced emissions from industrial enterprises in China [
54]. Other research has demonstrated that replacing fees with taxes substantially enhances corporate green innovation levels and total factor productivity, providing empirical evidence for expanding the pilot scope of water resources tax reform [
52]. Due to the rising cost of water resources, some traditional high-water-consuming enterprises have been forced to upgrade their technologies and increase investment in water-saving equipment. Some high-water-consuming enterprises have significantly reduced water consumption per unit of product by adopting advanced production processes, such as dry processing and closed-loop cooling systems [
55]. The water resources tax reform may also, to a certain extent, promote the optimization and adjustment of industrial structures, driving the development of high-value-added, low-water-consuming industries [
56]. With the implementation of the water resources tax, the proportion of industries such as information technology, biomedicine, and new energy has increased in some regions, while the growth of water-intensive industries has been restrained. This indicates that the water resources tax plays a positive role in promoting the transition to a green economy [
16].
The implementation of the water resources tax may also exert significant pressure on some small- and medium-sized enterprises (SMEs), particularly those with relatively outdated production technologies and limited financial resources. For these enterprises, the increase in water resource taxes can directly raise production costs, thereby reducing their market competitiveness [
17]. Some studies have found that during the early stages of the water resources tax reform, certain enterprises reduced their production scales due to increased tax burdens, and in some cases, even faced bankruptcy risks. Some high-water-consuming enterprises exhibited a gradual “zombification” trend [
57]. This situation is particularly prominent in high-water-consuming industries, such as small dyeing and printing factories or small paper mills. If these enterprises are unable to reduce water consumption through technological upgrades, they may be eliminated from the market due to heavier tax burdens. Therefore, in policy design, how to promote water conservation and industrial upgrading while avoiding excessive impacts on SMEs has become a key issue that the government needs to carefully consider.
2.4. Limitations of Existing Research
In general, although water resources tax reform has become a research hotspot in environmental economics both domestically and internationally, existing studies still have certain limitations in terms of policy effect evaluation, mechanism analysis, and exploration of influencing factors. A systematic and in-depth theoretical and empirical framework has yet to be fully developed. Future research should focus more on assessing the long-term effects of policies, particularly the impact of water resources taxes on industrial restructuring, water-saving technological innovation, and water ecosystem health. Taking China’s water resources tax reform as an example, most existing studies concentrate on the pilot program implemented in Hebei Province. However, after this initial phase, China expanded the scope of the reform to include ten additional provinces, yet there is relatively little literature addressing this broader implementation. Moreover, the existing literature tends to focus more on regional development while paying less attention to the relationship between water resources tax reform and enterprise development. Future studies could incorporate micro-level data at the enterprise level to examine how enterprises respond to water resources tax reforms, thereby optimizing the implementation of tax policies. Such an approach would provide deeper insights into the mechanisms through which enterprises adapt to these reforms and help refine policy design for greater effectiveness.
Current research on water resources tax reform primarily focuses on its impact on water use efficiency, industrial water consumption structures, and the adoption of water-saving technologies by enterprises. Some studies have evaluated the suppressive effect of water resources taxes on water usage in high-water-consuming industries such as chemicals, steel, and textiles, while also exploring how tax policies guide enterprises to adopt water-saving technologies through price mechanisms. However, the water resources tax not only influences corporate water usage behavior but may also indirectly promote the sustainable development of enterprises across industries through mechanisms such as environmental responsibility pressure, capital market regulation, and incentives for corporate innovation.
The existing literature often regards the water resources tax as a simple “price regulation tool,” assuming its main function is to raise water prices and curb water wastage, while ignoring the profound impact that tax policies can have on corporate decision making and long-term strategic development. In fact, water resources tax reform not only affects the water costs for enterprises but may also shape their sustainability capabilities through various mechanisms. Therefore, there is a need for more systematic analyses of these mechanisms to provide a more comprehensive theoretical explanation of how the water resources tax influences corporate behavior, as well as to offer stronger empirical support for the design and evaluation of environmental economic policies.
4. Methods and Data
4.1. Data Scource
Our data processing procedure was divided into four stages: selecting sample industries, determining the observation period, collecting data, and eliminating data that did not meet the criteria. Given that China is the world’s largest developing country and faces numerous challenges in water resource management and water pollution control [
78] and considering that the China Securities Regulatory Commission has explicitly required listed companies to disclose ESG information, this study limits its research subjects to non-financial A-share companies listed on the Shanghai and Shenzhen Stock Exchanges.
The ESG performance data used in this study were obtained from the Huazheng ESG Rating Database. Given that China’s water resources tax reform policy was implemented in phases, with the pilot program starting in Hebei Province in July 2016 and expanding to nine additional provinces in November 2017, we selected the year 2018 as the baseline for comparison. To analyze the differences before and after the implementation of the policy, we extended the observation period five years backward and five years forward, selecting A-share non-financial companies listed on the Shanghai and Shenzhen Stock Exchanges during the period of 2013–2023 as the initial research sample. Companies listed in regions subject to the Expanded Implementation Measures for Water Resources Tax Reform Pilot Program were categorized into the experimental group. Specifically, this includes firms located in Hebei Province (starting from 2017 as the baseline) and the nine additional provinces—Beijing, Tianjin, Shanxi, Inner Mongolia, Shandong, Henan, Sichuan, Shaanxi, and Ningxia (starting from 2018 as the baseline). Companies outside these regions were classified into the control group. This classification allows for a robust comparison of the effects of the water resources tax reform on corporate ESG performance between the treatment and control groups.
The green patent data were collected using the Green Technology Patent Classification System provided by the China National Intellectual Property Administration (CNIPA). To quantify firms’ green technological innovation capabilities, we followed a systematic data processing procedure. Specifically, we first extracted the IPC (International Patent Classification) codes for green and low-carbon technologies from the Green and Low-Carbon Technology Patent Classification System published by CNIPA in 2022. These IPC codes cover a wide range of green and low-carbon technologies as defined in the classification system. Next, based on the extracted IPC codes, we categorized the authorized invention patents held by each sample company to determine whether they fell under the category of green technology. This classification process allowed us to assess the validity and relevance of a firm’s patents in terms of their contribution to green innovation. By identifying and quantifying the number of green patents maintained and effective during the year of observation, we established a reliable basis for evaluating corporate green technological innovation capabilities. This approach ensures that the analysis reflects the true extent of firms’ commitment to and progress in developing environmentally friendly technologies.
Environmental investment, capital market attention, and media attention data are sourced from the CNRDS database. Basic corporate data, including company age, size, board size, and the shareholding ratio of the largest shareholder and so on, are obtained from the CSMAR database.
We excluded financially abnormal observations, specifically those labeled as ST (Special Treatment), as well as observations with missing variables. Additionally, companies purely engaged in financial and insurance businesses were removed from the sample, along with delisted firms. To control for outliers, all continuous variables were Winsorized at the 1% and 99% levels. After applying these screening criteria, the final dataset consisted of an unbalanced panel of 36,394 firm-year observations spanning 5007 Chinese listed companies from 2013 to 2023. This robust dataset provided a comprehensive basis for analyzing the impact of water resources tax reform on corporate ESG performance while ensuring the reliability and validity of the results.
4.2. Main Variables
4.2.1. The Dependent Variable
The dependent variable in this study is corporate ESG performance. ESG performance encompasses three dimensions: environmental responsibility (E), social responsibility (S), and corporate governance (G). It not only influences a company’s long-term competitiveness but also plays a critical role in shaping the decision-making processes of key stakeholders, including investors, consumers, and government regulators. To comprehensively reflect corporate ESG performance, this study uses the ESG scores provided by the Huazheng ESG database as a proxy for ESG performance. The Huazheng ESG system is one of the most authoritative ESG evaluation frameworks in China, covering all listed companies. It adopts mainstream international ESG assessment methodologies while incorporating characteristics specific to the Chinese market, offering a systematic and objective standard for measuring ESG performance. Huazheng ESG scores are categorized into nine grades: C, CC, CCC, B, BB, BBB, A, AA, and AAA, which represent varying levels of ESG performance. In this study, we converted these grades into a numerical scale ranging from 1 to 9, where a higher score indicates superior ESG performance. This transformation facilitates quantitative analysis and comparison across firms.
While ESG scores have become a standard measure for assessing corporate sustainability practices, they are not without limitations. First, different rating agencies and data providers can use varying definitions, weighting methodologies, and information sources, leading to discrepancies across ESG metrics. This introduces a risk of measurement error if firm-level data are inconsistently collected or if certain aspects of ESG are over- or underemphasized. Second, as a composite measure, ESG scores inherently combine diverse dimensions—such as carbon emissions, board diversity, and community engagement—that might not equally apply to all industries or ownership types. Consequently, comparisons across heterogeneous firms may sometimes mask finer-grained nuances in specific ESG domains. Recognizing these potential pitfalls, we included firm-level controls in our regressions for major industry groupings and have made the scoring criteria used in our analysis as transparent as possible.
4.2.2. The Independent Variable
The independent variable in this study is the implementation of the water resources tax reform policy. This variable is represented by the interaction term in a difference-in-differences (DID) model, denoted as . Specifically, equals 1 if the firm is located in a pilot region subject to the water resources tax reform, and 0 otherwise. Given that the expansion of the water resources tax reform to 10 additional provinces occurred at the end of November 2017, we set the policy implementation year as 2018. Therefore, equals 1 for the years 2018 and onward, and 0 for earlier years. This approach allows us to capture the differential effects of the water resources tax reform on firms in treatment regions compared to those in control regions over time.
The pilot provinces total ten, namely: Hebei, Beijing, Tianjin, Shanxi, Inner Mongolia, Shandong, Henan, Sichuan, Shaanxi, and Ningxia. These provinces exhibit diverse industrial foundations and resource endowments. For instance, Hebei Province is characterized by a combination of heavy industries (such as steel and cement) and extensive agricultural activities in rural areas. Water consumption is relatively high, particularly in regions that rely on groundwater. Shanxi Province is known for its mining and coal industries, with a moderate level of water consumption; however, the industrial water use efficiency varies significantly across enterprises. Shandong Province, recognized for its coastal economy, features petroleum and petrochemical industries, electronics, and agriculture-intensive sectors. In recent years, Shandong has actively promoted industrial water-saving technologies. Beijing, on the other hand, has a city center that hosts a high concentration of technology and service-oriented enterprises. Although the overall per capita water consumption is relatively low, certain high-tech manufacturing parks still consume significant amounts of water. These provinces provide valuable contrasts in terms of industrial structure, corporate water use demands, and local water resource management practices, forming a solid foundation for analyzing the impact of water resource tax reform on corporate ESG performance.
4.2.3. Mediating Variables
The mediating variables in this study are the firm’s breakthrough green technological innovation (), environmental conservation investment (), and capital market pressure (). Breakthrough green technological innovation is measured by the number of authorized green invention patents of listed companies, which serves as a proxy variable for breakthrough green technological innovation. Environmental conservation investment is calculated as the total annual amount of expenses disclosed in the company’s annual report, including environmental cleanup fees, greening fees, and pollution discharge fees. Capital market pressure is calculated based on the total number of pages of research reports that securities analysts focus on regarding the company.
4.2.4. The Moderating Variable
The moderating variable in this study is media attention (). Media exposure refers to the frequency with which a company appears in traditional media, news reports, and online media, and it is an important indicator for measuring a company’s social influence and public attention. This study measures media exposure by counting the number of reports about the company published in national newspapers and online platforms during the year. Specifically, media attention is calculated based on the total number of news articles about a particular company published in more than 600 major newspapers across the country in a given year.
4.2.5. Control Variables
To mitigate the impact of confounding variables on the regression results and better identify the causal effects between explanatory variables and the explained variable, this study refers to existing literature on corporate governance and ESG performance and controls for the following firm-specific characteristics: firm age (); firm size (); debt-to-asset ratio (); return on assets (); board size (); revenue growth rate (); duality of chairman and CEO roles (); proportion of independent directors (); and shareholding percentage of the largest shareholder (). Additionally, this study includes firm fixed effects (), industry fixed effects (), and year fixed effects () in the regression model. The standard errors of all regression coefficients were clustered at both the firm and industry levels to further ensure the reliability of statistical inference regarding the regression estimates.
For all continuous variables without zero values, we applied a logarithmic transformation. For continuous variables containing zero values, we added 1 before applying the logarithmic transformation. Definitions for all variables are presented in
Table 1.
4.3. Descriptive Statistics
To provide a more intuitive understanding of the data characteristics, the descriptive statistics for all variables are presented in
Table 2. It provides the descriptive statistics for the main variables used in this study, including the ESG score, DID variable, the firm’s breakthrough green technological innovation, environmental conservation investment, capital market pressure, media attention and control variables. The sample comprises a total of 36,394 firm-year observations, spanning from 2014 to 2023. As shown, the average ESG score is 1.390 (log-transformed), with a standard deviation of 0.272, indicating moderate variation in sustainability practices across firms. These statistics provide an initial overview of the dataset.
5. Empirical Analysis
5.1. Model
We construct the following difference-in-differences model:
where
represents the individual firm,
represents the year;
denotes the firm’s ESG performance;
is the difference-in-differences term;
represents the set of control variables;
is the individual fixed effect;
is the time fixed effect;
is the industry fixed effect; and
is the random disturbance term.
To further investigate the mediating effects of breakthrough green technological innovation, corporate environmental protection investment, and capital market pressure on ESG performance, we refer to the mediation effect testing methods used in existing literature [
79]. The specific mediation effect models can be expressed as:
In the analysis of the impact of the water resources tax reform policy on ESG performance, further consideration is given to the interactive effect between media attention and the difference-in-differences term, as well as the resulting cyclical cumulative effect. Referring to the moderation effect testing methods used in existing literature [
80], the specific moderation effect model can be expressed as:
5.2. Benchmark Regression
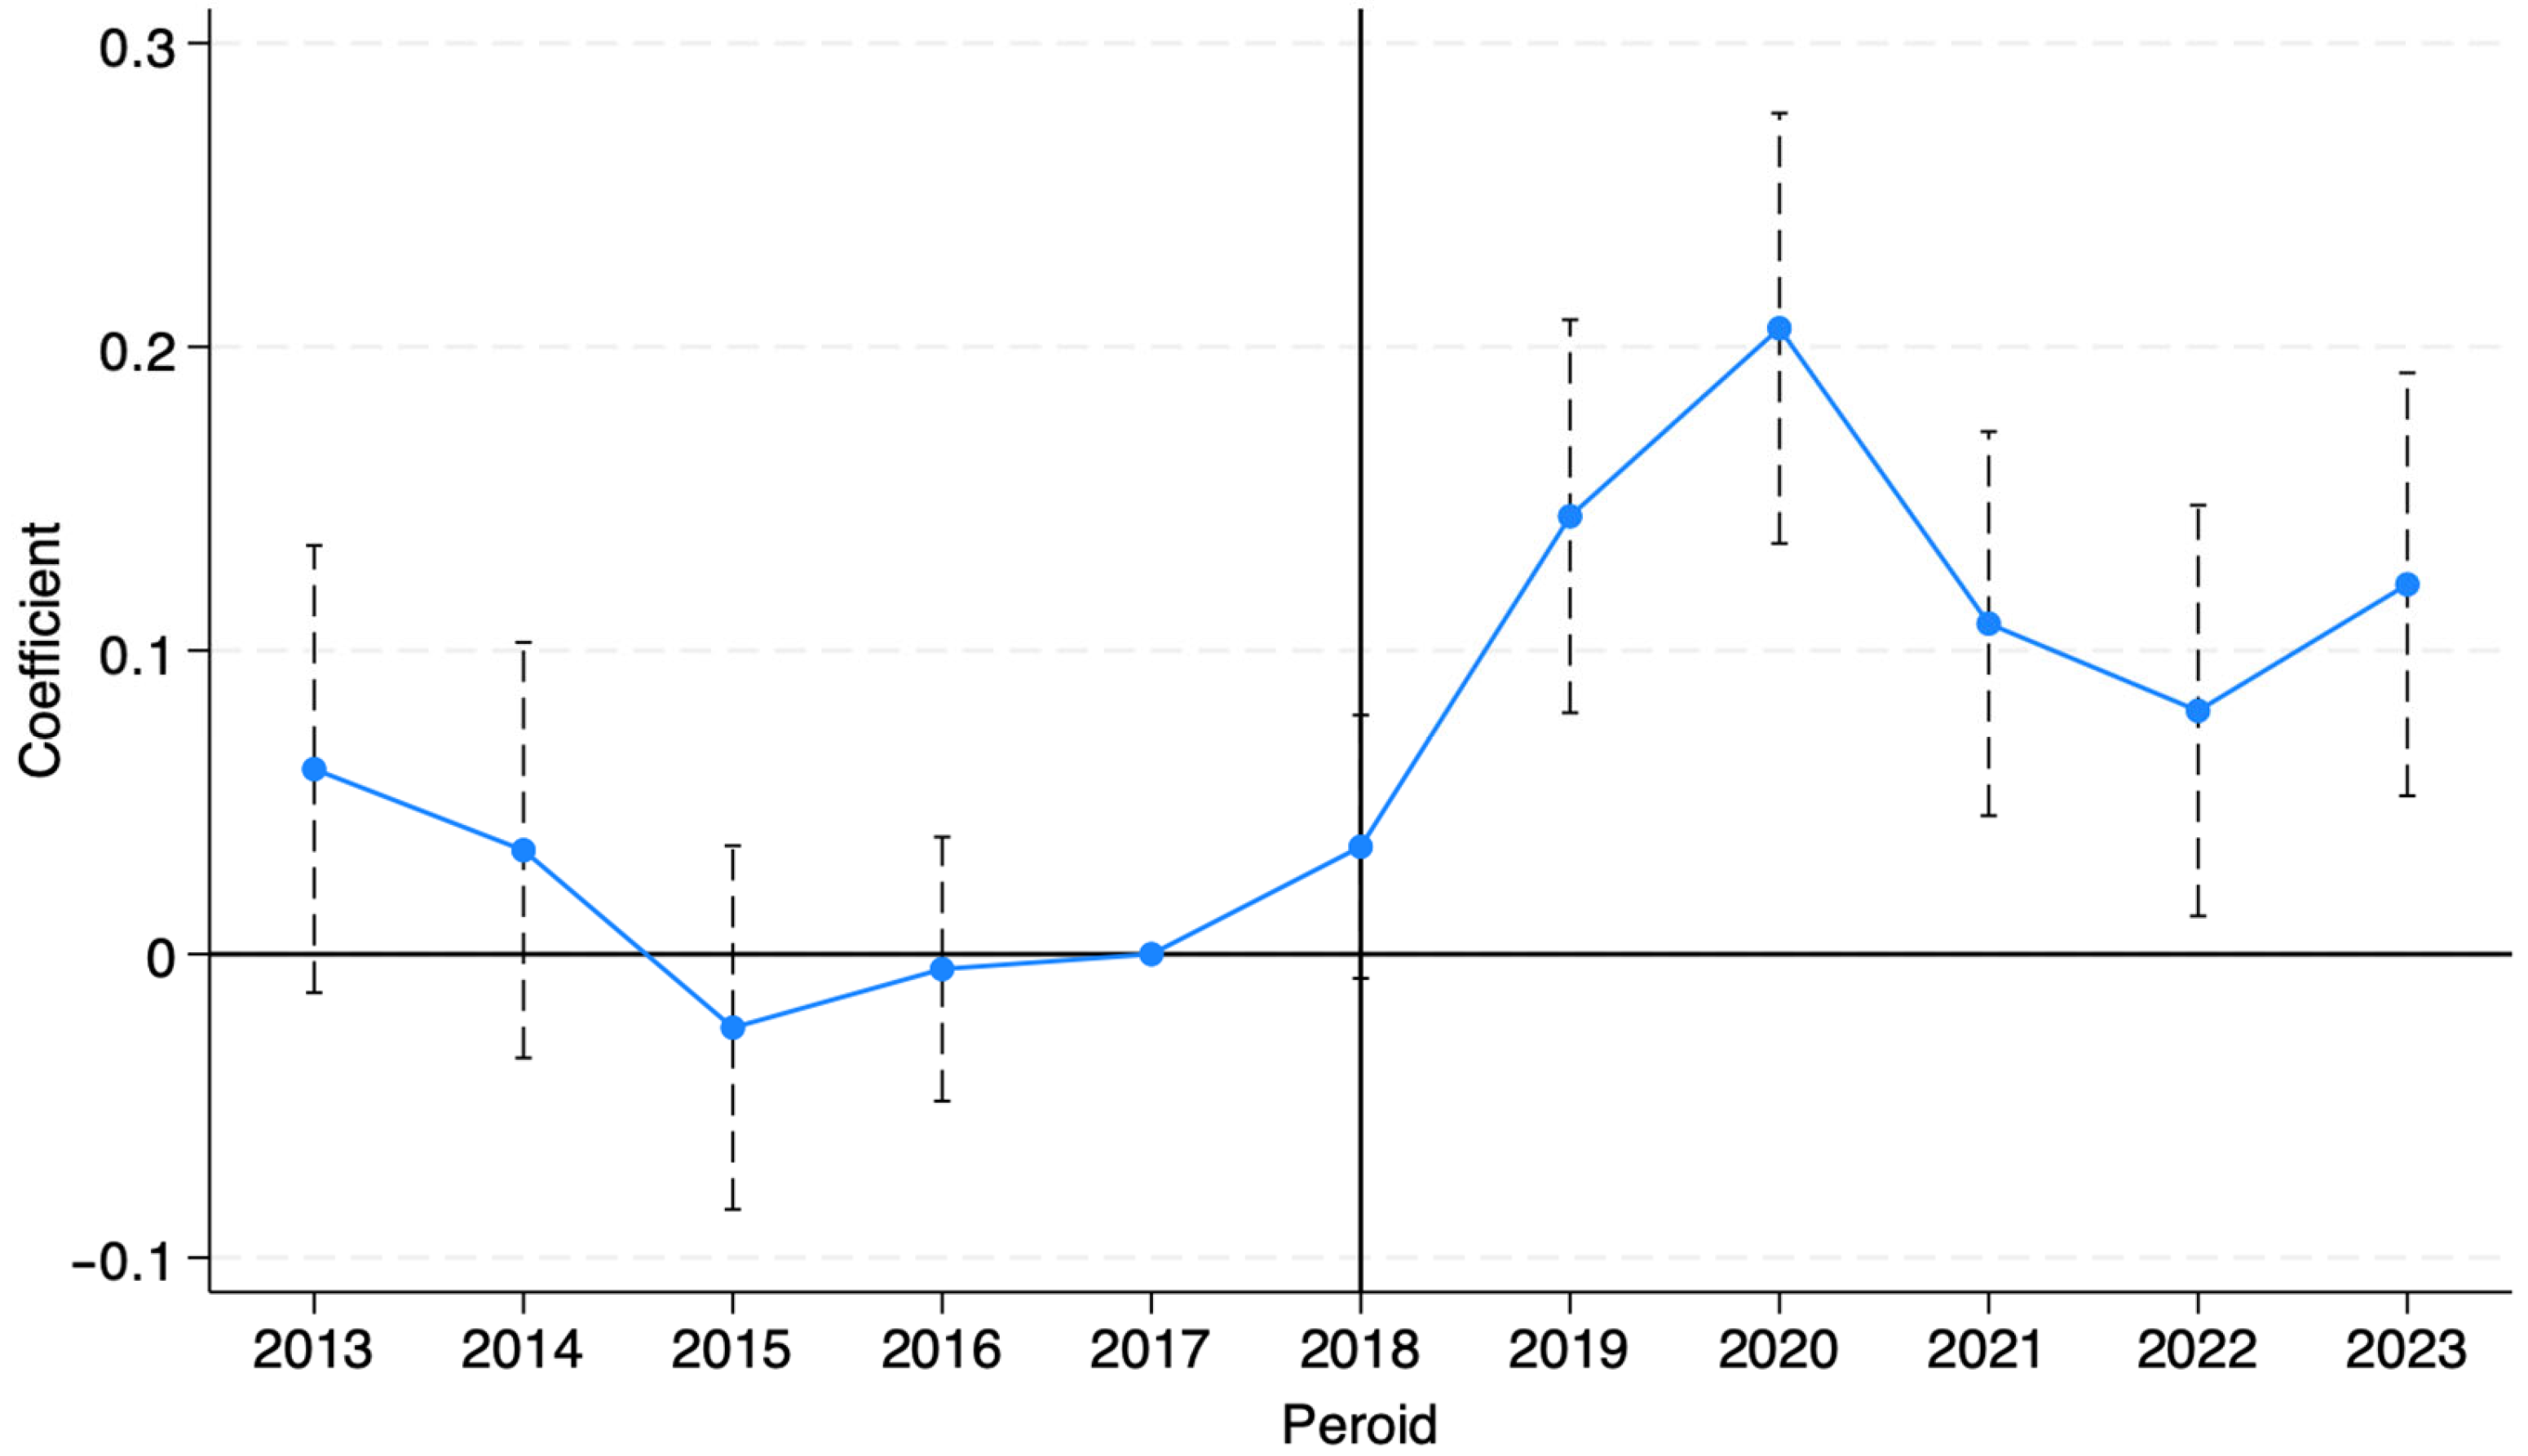
The implementation of the DID method requires satisfaction of the parallel trend assumption. Drawing on existing literature [
81], we conducted a parallel trend test using dynamic DID analysis. We set 2018 as the “
” dummy variable and created separate dummy variables for several years before (
) and after (
) the policy implementation, while excluding the year immediately preceding the policy (
). The annual dummy variables were then incorporated into the benchmark model to test for parallel trends. The results are shown in the figure below (
Figure 1):
From the figure, it is clearly observable that before 2018, the confidence interval includes 0, and the coefficients are not significant, which confirms the assumption that the treatment group and the control group had the same trend prior to the implementation of the water resources tax reform policy. After 2018, the coefficients become significant, indicating that the treatment group and the control group exhibit different trends, reflecting the effectiveness of the policy. This allows us to proceed with further regression analysis.
This paper examines the effects of different combinations of control variables and fixed effects, aiming to report benchmark regression results under stricter fixed effects. Specific model details are presented in
Table 3, where column (1) shows the results without including control variables, column (2) includes control variables, and column (3) further adds individual fixed effects, time fixed effects, and location fixed effects on top of the control variables. Standard errors are clustered at the firm level. From the results in
Table 3, it is evident that the difference-in-differences term is significantly positively correlated with ESG performance at the 1% level, confirming the validity of this study’s research hypothesis H1. Furthermore, the water resource tax reform policy led to an average increase of 0.21 in the ESG score (with a maximum score of 9).
5.3. The Robustness Test
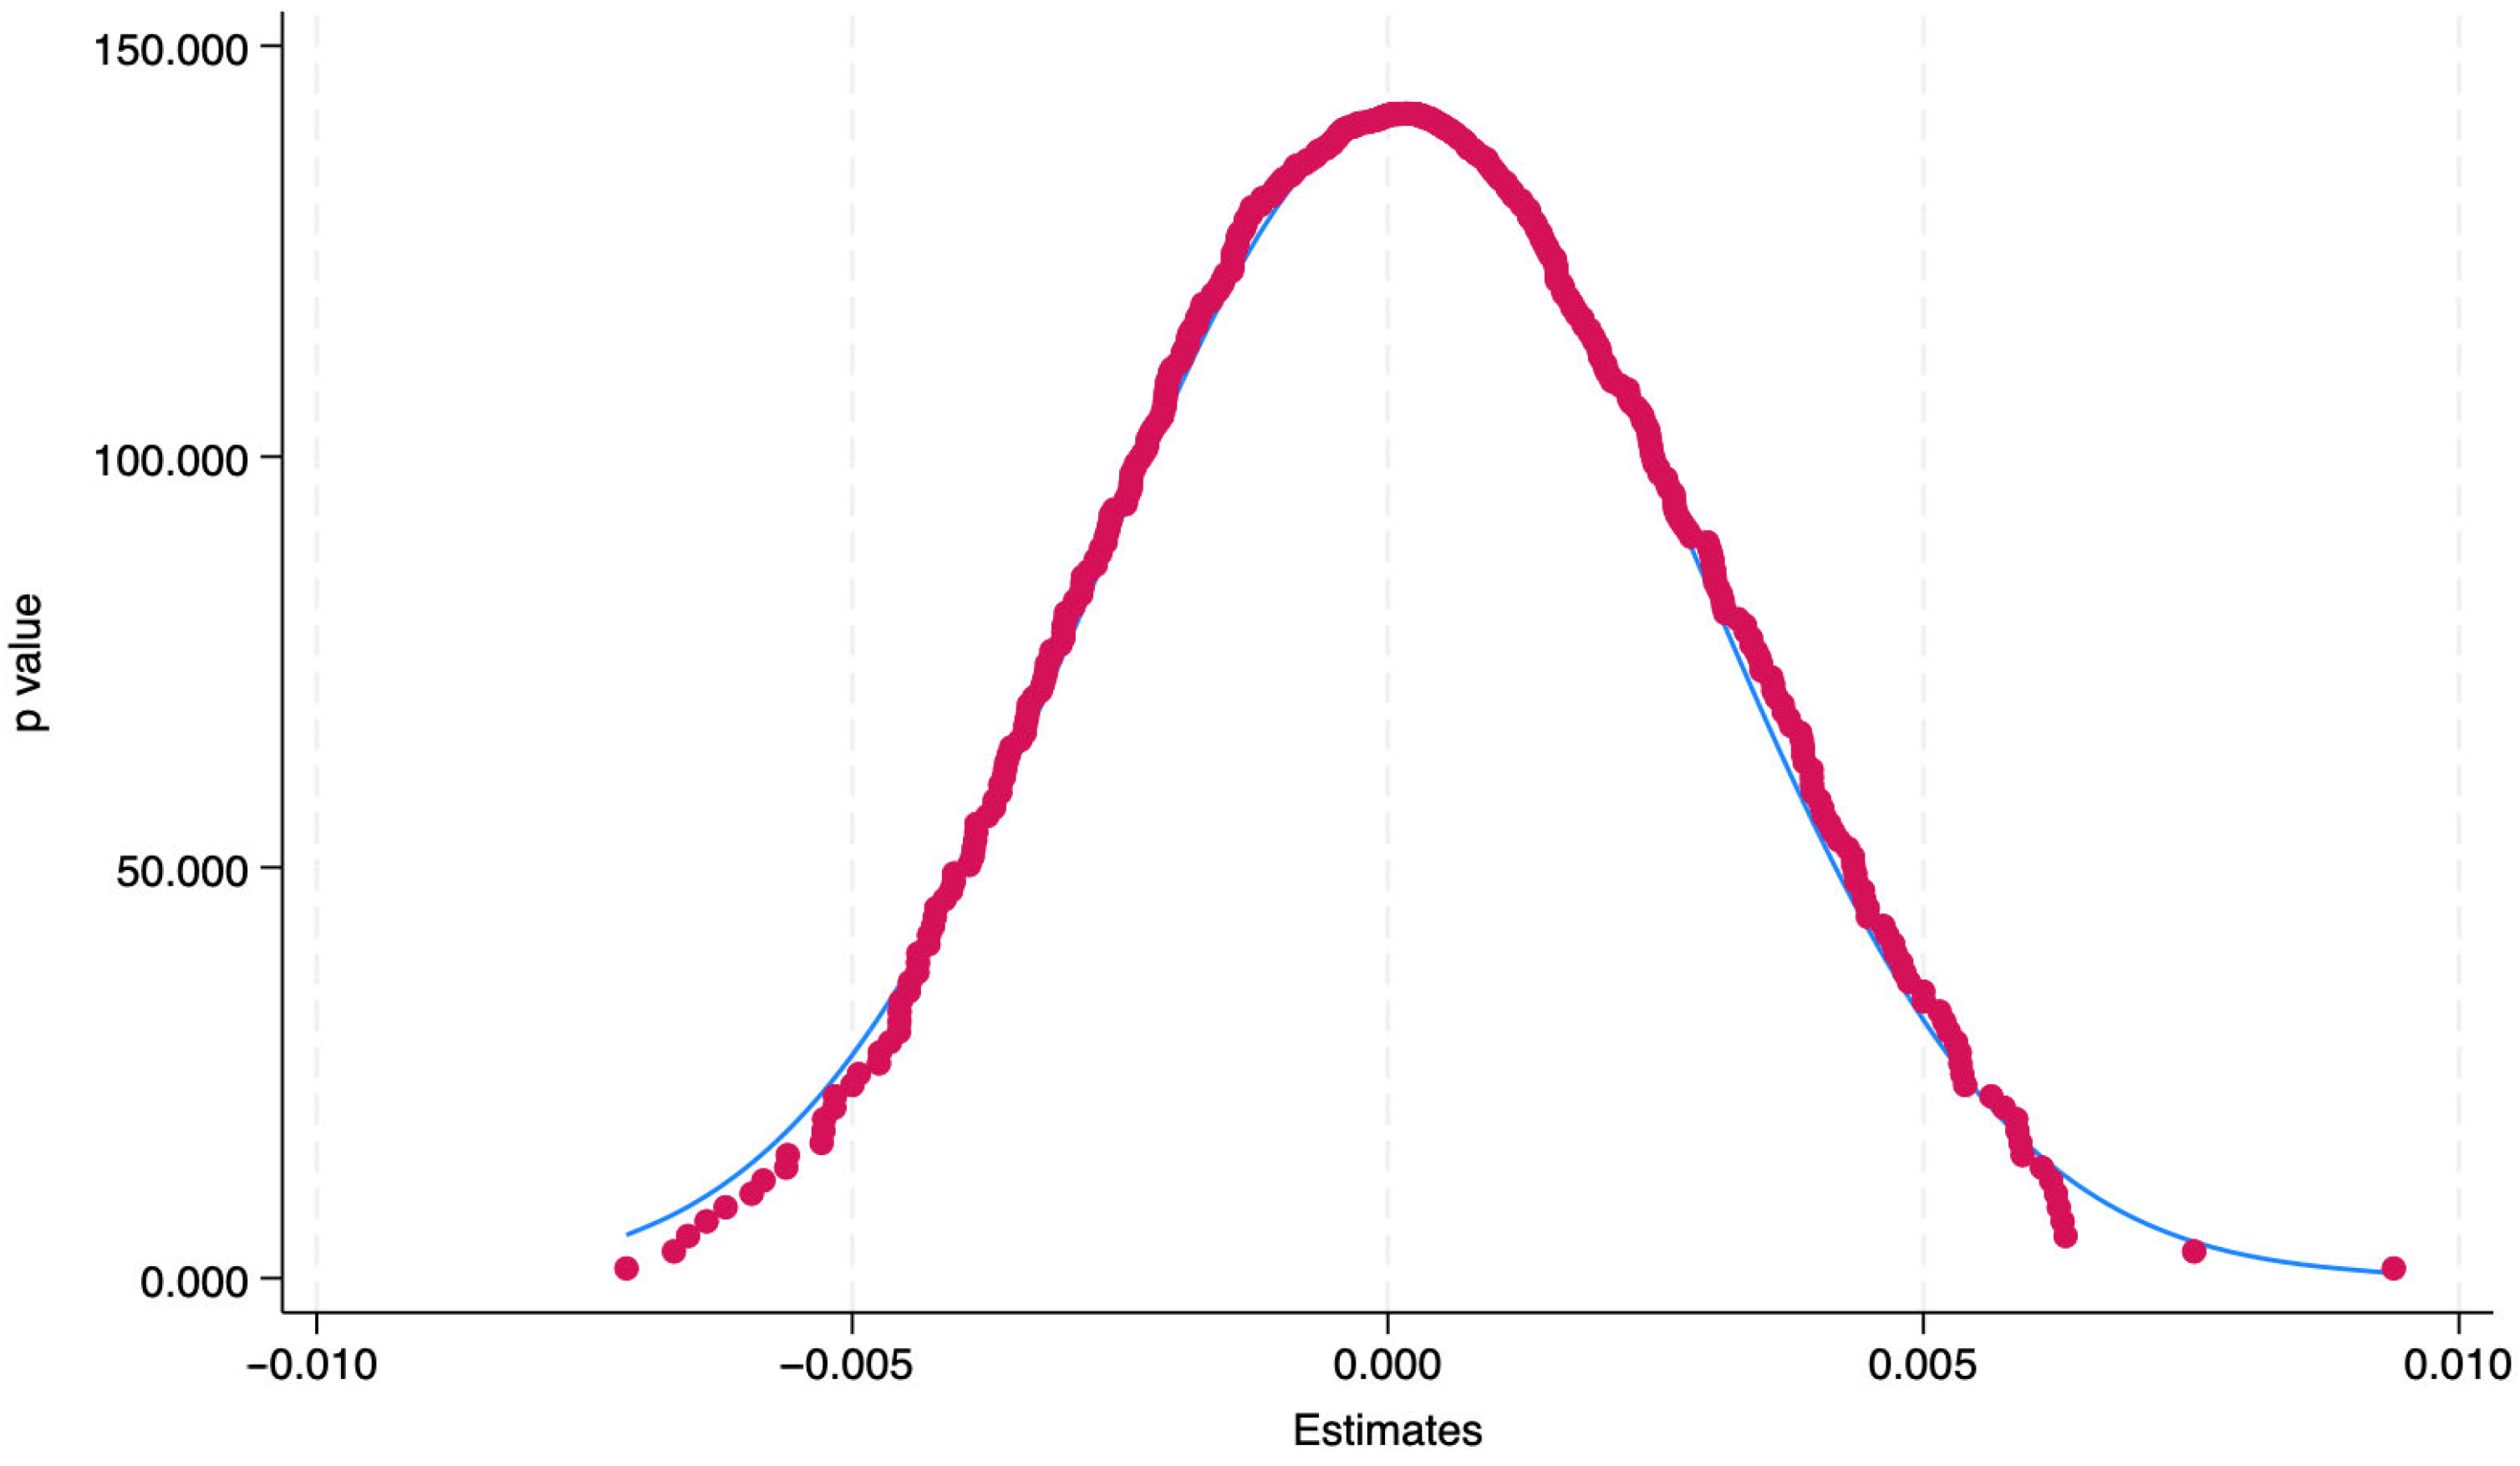
5.3.1. The Placebo Test
To rule out the potential issue of omitted variables, this paper conducts a placebo test by randomly generating firms in the pilot regions for the water resources tax reform. The estimation process for the randomization is repeated 500 times, and the
p-value plot of the estimated coefficients from the 500 simulation experiments is shown in the figure below (
Figure 2):
As shown in the figure, the estimates are symmetrically distributed around 0, and the
p-values are relatively larger near 0, indicating that the assumption of policy impact is not affected by random disturbances. Combined with the results from
Table 3, it can be concluded that the policy indeed had an effect on ESG performance, rather than being a false impression caused by data noise or model issues.
5.3.2. Variable Substitution
To avoid potential measurement bias in the variables affecting the research results, this study replaces the Huazheng ESG score with the Wind ESG score (
) and the Wind ESG rating (
) and conducts the regression analysis again. The results of the substituted variables are presented in columns (1) and (2) of
Table 4. As can be seen, the coefficient of the difference-in-differences term remains significantly positive, further validating the effectiveness of this study’s research hypothesis H1.
5.3.3. Propensity Score Matching
Since the scope of the water resources tax reform policy is defined by pilot regions, these regions may inherently include certain factors that could influence a company’s sustainability capabilities, leading to self-selection bias and endogeneity issues. To address this, we employed propensity score matching (PSM), using nearest-neighbor matching and selecting all control variables as covariates. The results are presented in column (3) of
Table 4.
5.4. The Mechanism Test
We tested the mediating effects of breakthrough green technological innovation, corporate environmental protection investment, and capital market pressure. The results are presented in columns (1)–(3) of
Table 5. These results support Hypotheses H2a, H2b, and H2c, indicating that the water resources tax reform policy improves corporate ESG performance by promoting breakthroughs in green technological innovation, increasing corporate environmental investments, and enhancing capital market pressure.
We tested the moderating effect of media attention, and the results are presented in column (4) of
Table 5. These results support Hypothesis H3, indicating that media attention strengthens the promoting effect of the water resources tax reform policy on corporate ESG performance.
5.5. Heterogeneity Analysis
Given that different enterprises have unique characteristics, this study examines how the water resources tax reform policy affects the ESG performance of firms with varying attributes in order to reduce heterogeneity bias. The analysis will be conducted based on the ownership nature and financial conditions of the enterprises. Additionally, this study will explore the potential reasons underlying these differences.
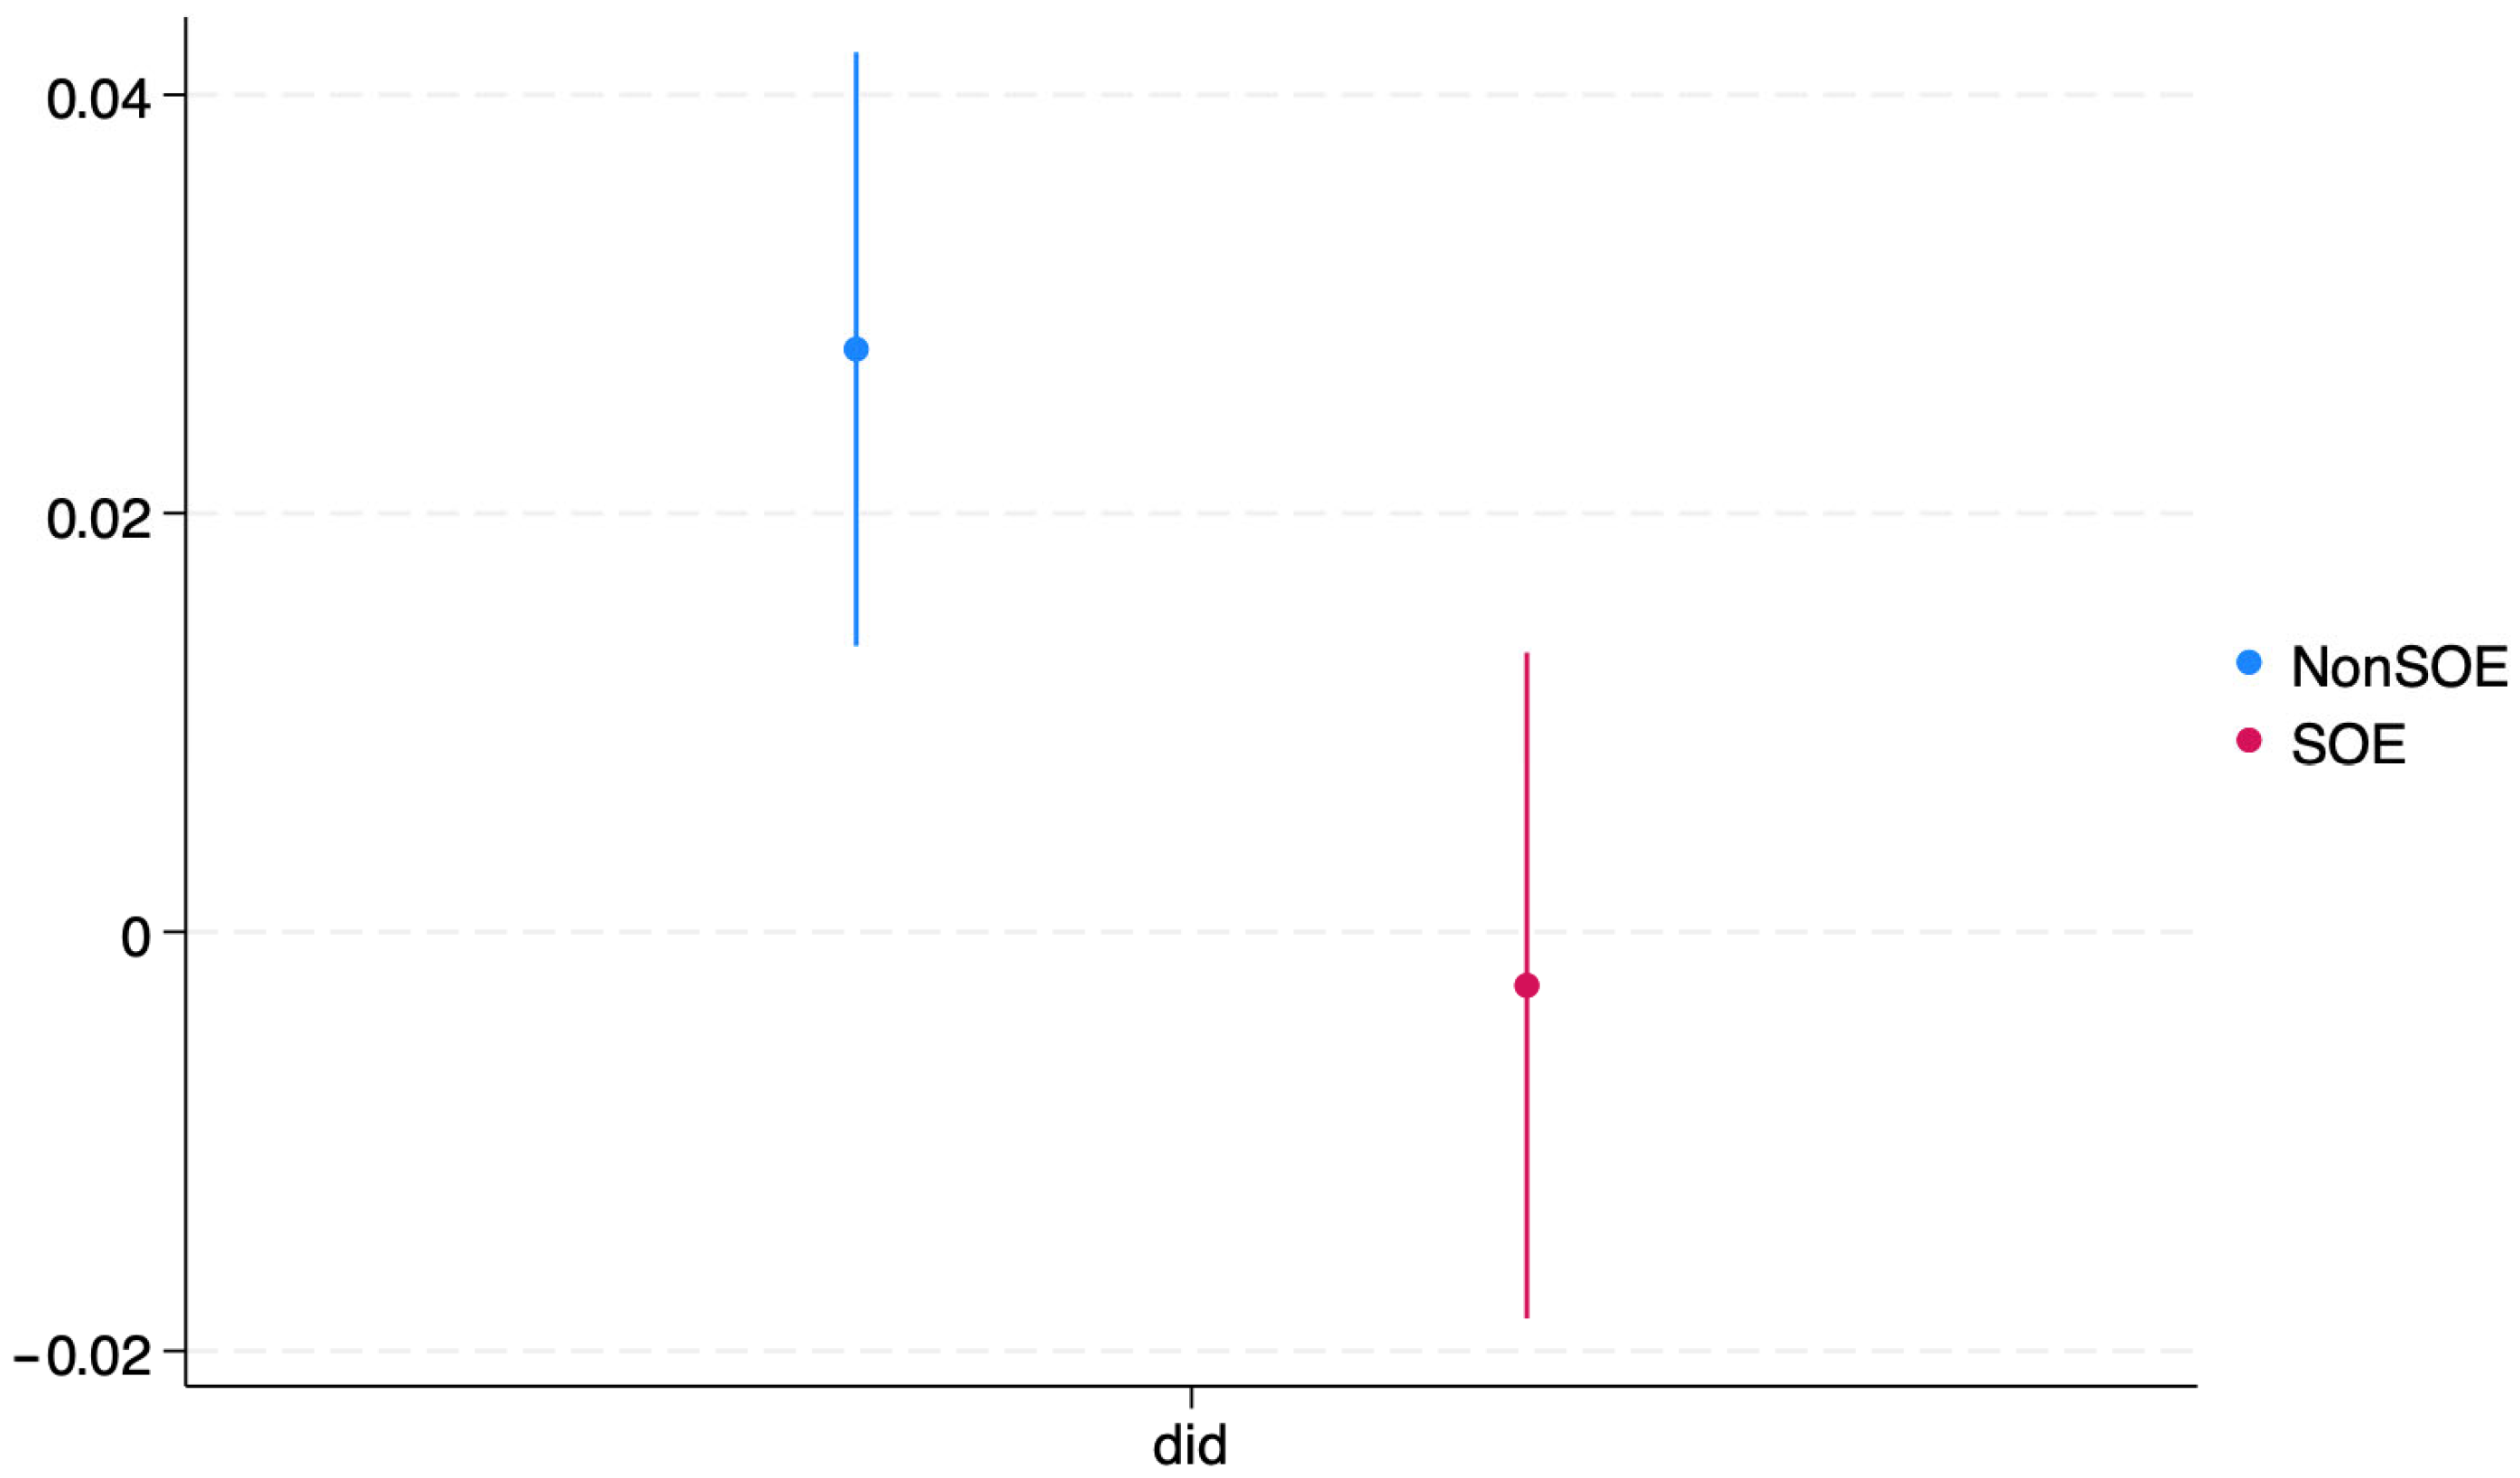
Differences in enterprise ownership may influence the role of the water resources tax reform policy in enhancing ESG performance. Therefore, this study divides the sample firms into state-owned enterprises (SOEs) and non-state-owned enterprises based on ownership characteristics to explore the impact of the water resources tax reform policy on the ESG performance of firms with different ownership structures. In China, SOEs hold a unique economic position, characterized by closer ties with the government, broader access to capital, more robust corporate governance systems, and a stronger sense of social responsibility. Thus, studying the impact of ownership nature on ESG performance is crucial for promoting green development. This study divides the entire sample into two subsamples based on whether the firm is an SOE and conducts group comparisons using the benchmark regression model.
Figure 3, as well as columns (1) and (2) of
Table 6, present the results of ESG performance for firms with different ownership natures under the influence of the difference-in-differences term.
Among the pilot provinces, the ownership structures of major enterprises vary across different regions. For example, Shanxi has a significant concentration of SOEs in the mining sector, with the province’s industrial focus centered on coal and mineral extraction, power generation, and related downstream heavy industries. In contrast, Shandong has a more diversified ownership structure, including private enterprises alongside some large SOEs, with key industries spanning petroleum and petrochemicals, electronics, agriculture, and a strong export-oriented manufacturing sector. Beijing is distinct in that many SOEs have their headquarters located in the city, alongside a significant presence of high-tech manufacturing, service industries, and a rapidly expanding fintech sector. These variations in ownership structures, dominant industries, and workforce characteristics may influence how enterprises manage resources and respond to environmental taxation. Family-owned businesses or private small- and medium-sized enterprises (SMEs) often lack substantial capital reserves, whereas large SOEs generally have more structured management systems and access to broader financing channels.
The research results indicate that the water resources tax reform policy has a significantly positive impact on the ESG performance of SOEs, whereas its effect on non-SOEs is not statistically significant overall. It is important to note, however, that “no significant effect” at the aggregate level does not necessarily mean that non-SOEs experience no impact whatsoever; rather, the effect may be less pronounced or more variable across different non-SOE subgroups (e.g., those operating in water-intensive sectors or in regions with stricter enforcement). Several factors may explain the stronger response among SOEs. First, SOEs generally carry broader social responsibilities and face higher government expectations regarding ESG performance. Their close ties to the government mean that environmental protection targets are often integrated into the performance evaluations of SOE managers, incentivizing proactive responses to policy changes. Second, SOEs may benefit from government support, such as environmental subsidies, low-interest loans, or tax preferences, which reduce the costs of adopting water-saving measures and other ESG initiatives. Additionally, SOEs frequently pursue longer-term development goals and emphasize corporate social responsibility to a greater extent, whereas some non-SOEs may focus on short-term profit objectives, lowering their responsiveness to policy directives. Despite the prominence of SOEs, non-SOEs still account for a substantial share of industrial output and water use in many provinces. Consequently, exclusive reliance on SOE-focused reforms may leave significant sustainability challenges unaddressed. Complementary strategies—such as providing financial or technical support tailored to the needs of smaller non-SOEs—could ensure that water resource tax reforms achieve broader and more equitable impacts across the corporate landscape. By acknowledging these variations in ownership structure and resource capacity, policy makers can more effectively design interventions that encourage all firms to improve their ESG performance.
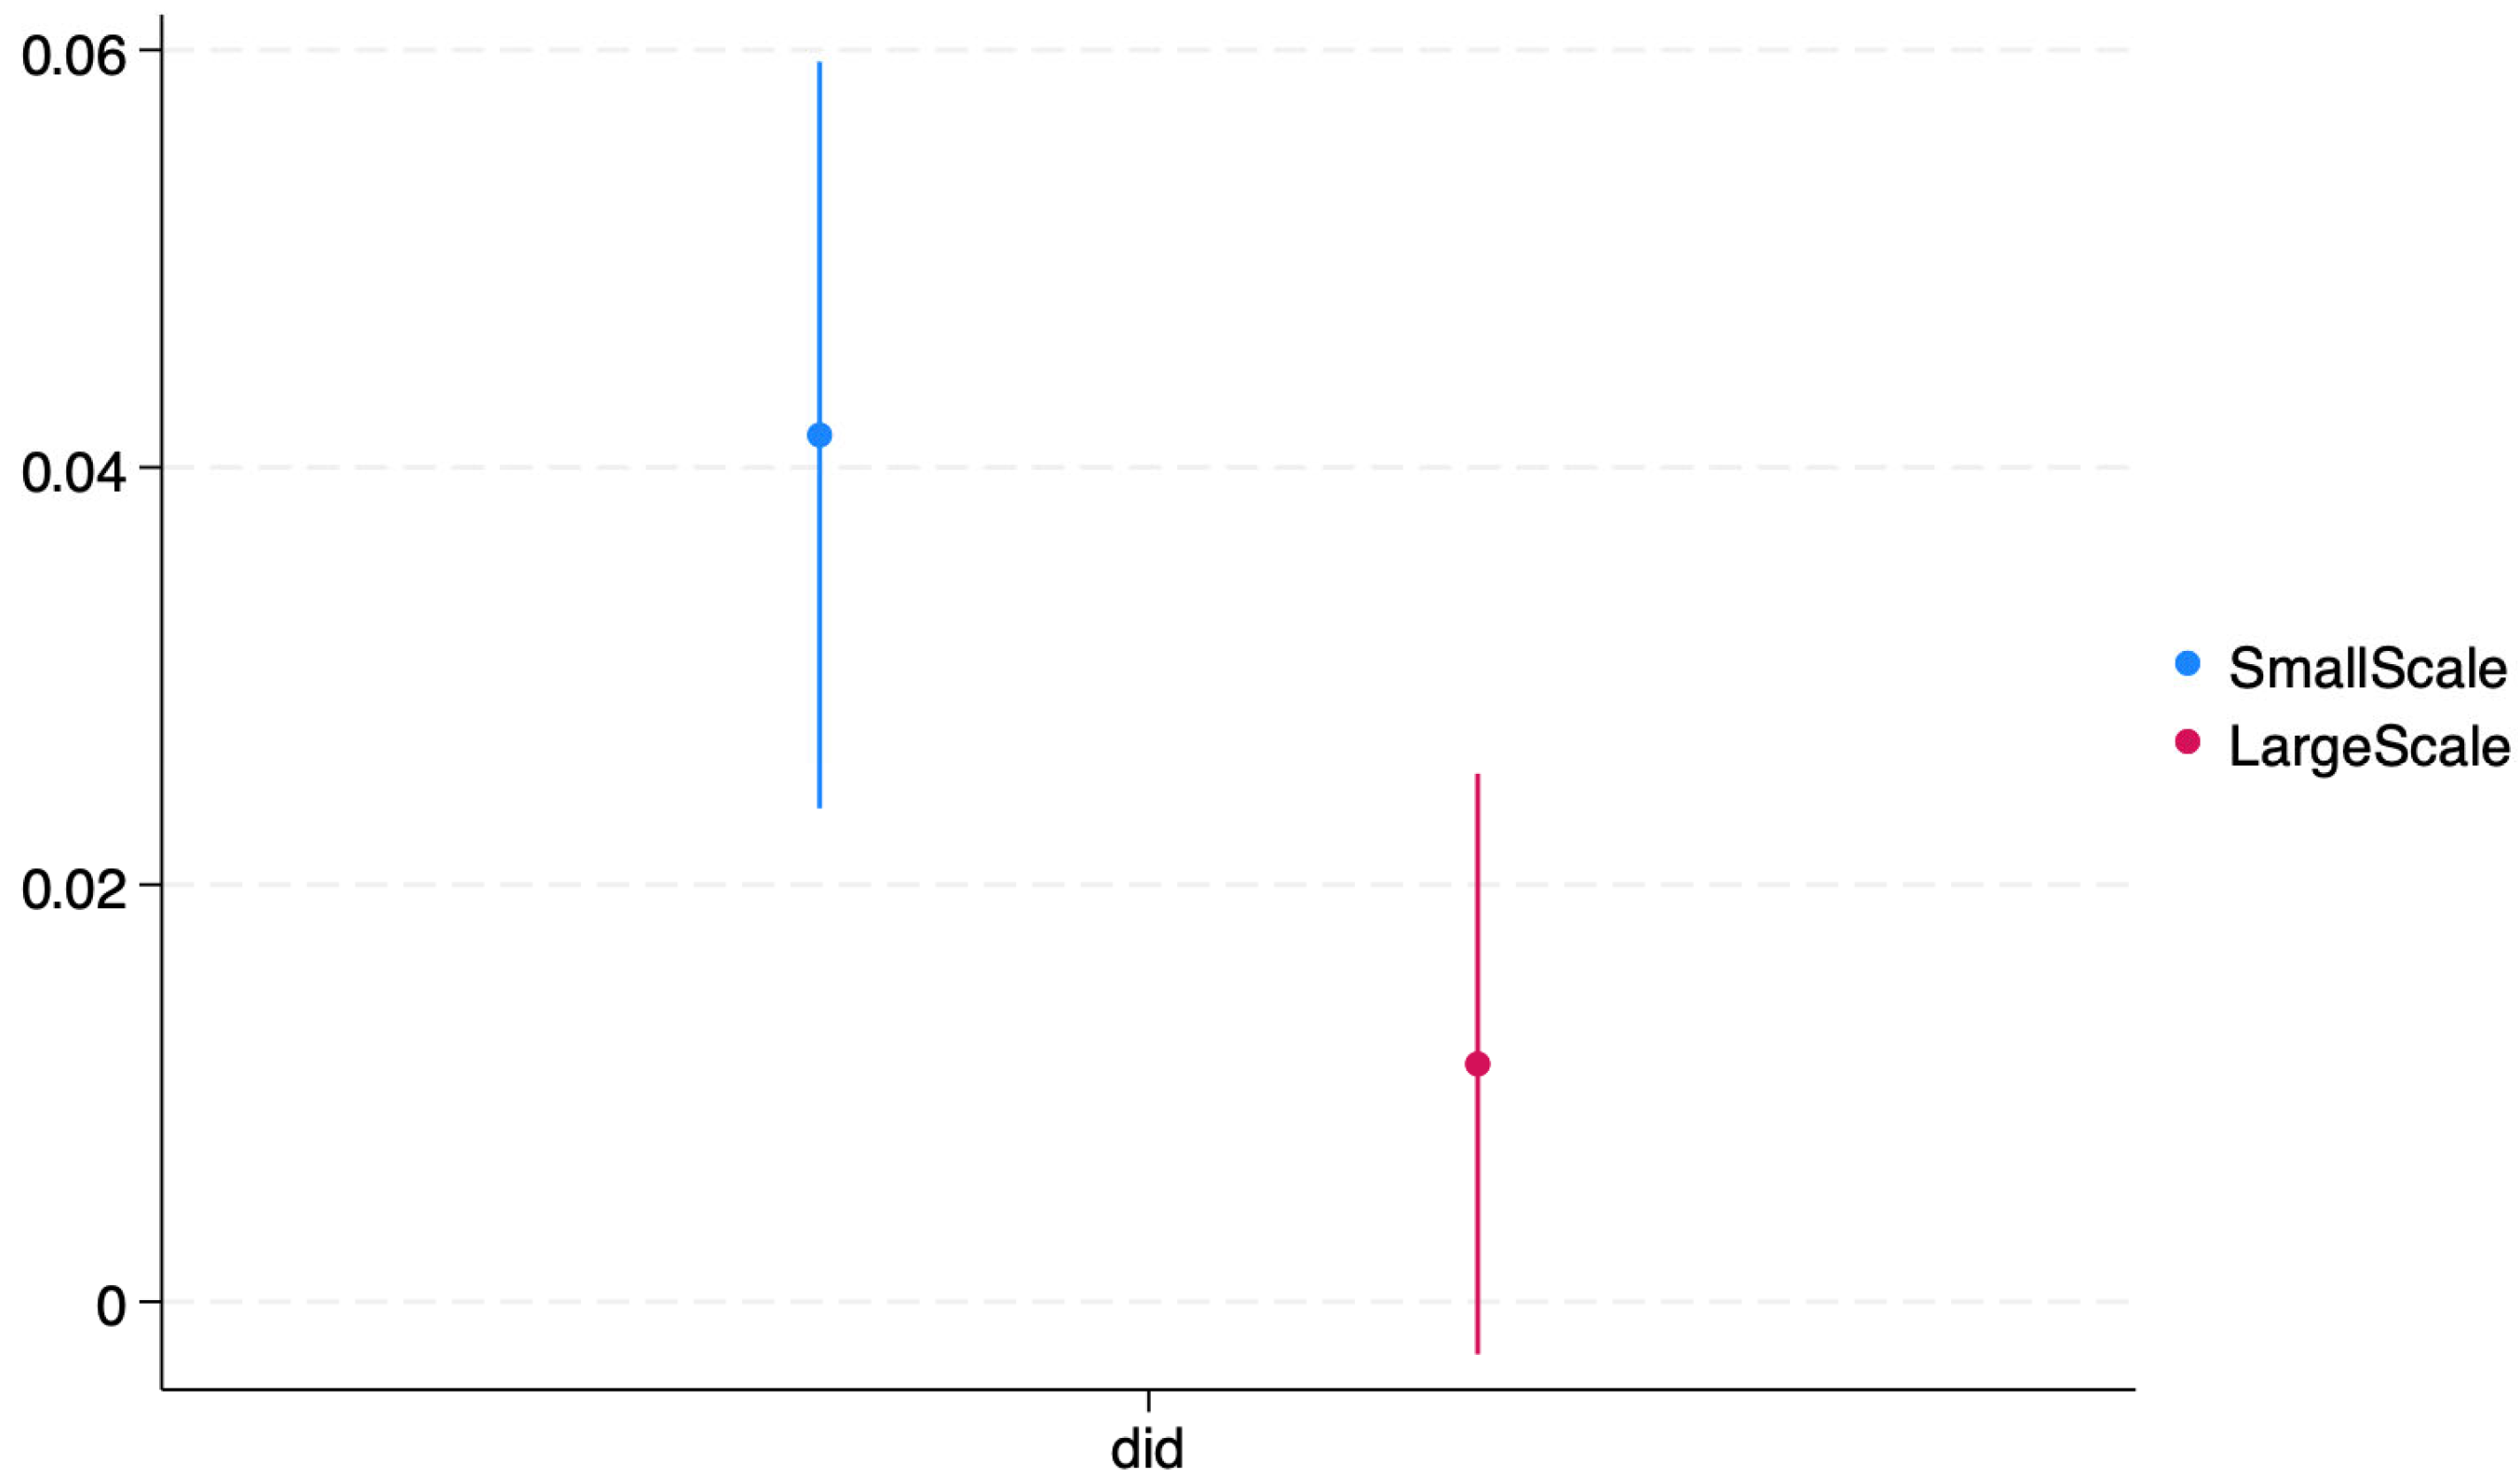
The water resources tax reform policy plays a positive role in enhancing corporate ESG performance, but this impact may vary depending on differences in firm size and operating performance. To investigate whether there are significant differences in the effect of the water resources tax reform policy on the ESG performance of firms of different sizes, this study uses the median firm size for each year as the classification criterion, dividing the sample into two groups: small firms and large firms. The analysis results are presented in
Figure 4 and columns (3) and (4) of
Table 6.
The research results indicate that the water resources tax reform policy has a significantly positive impact on the ESG performance of large firms, but no significant effect on small- and medium-sized enterprises (SMEs). This may be because large firms generally possess stronger financing capabilities and stable cash flows, enabling them to allocate more resources toward environmental governance, such as upgrading production equipment, optimizing energy structures, and enhancing pollution control capabilities. In contrast, SMEs often face financing constraints and struggle to bear the high costs associated with the environmental requirements imposed by the policy. Regulatory bodies and the public tend to hold large firms to higher environmental responsibility standards, motivating these companies to improve their ESG performance in order to avoid penalties, reputational damage, or investor pressure. On the other hand, SMEs, due to their smaller scale and limited influence, may experience less regulatory scrutiny, leading to weaker enforcement of the policy. Furthermore, large firms typically have dedicated ESG or sustainability departments with systematic environmental governance capabilities, allowing them to quickly adapt to policy requirements. SMEs, however, may lack such management systems, resulting in weaker policy responsiveness.
SMEs constitute a significant portion of the corporate landscape in each province. They also face unique challenges when adapting to water resources taxation and broader ESG expectations. Smaller firms often have lower profit margins and face difficulty obtaining credit or investment, making it challenging to implement water-saving technologies or adopt robust ESG practices. Many SMEs have fewer specialized staff and less in-house capacity to manage and report on water usage, carbon footprints, or other sustainability metrics. Consequently, compliance with new environmental regulations or taxes can be more burdensome. In some provinces, local governments offer subsidies, grants, or technical assistance to mitigate the impact of resource taxes on small businesses. SMEs in Hebei, for instance, may benefit from pilot programs that encourage technology upgrades in water-intensive processes. The introduction of water resource taxation poses both challenges and opportunities for SMEs. While it may impose higher costs in the short term, it can also motivate innovation, process improvements, and stronger collaboration within regional industry ecosystems—ultimately enhancing ESG metrics and driving more sustainable growth.
6. Conclusions
This paper investigates the impact of government-led environmental governance policies on corporate ESG performance, using China’s water resources tax reform as a research focus. Based on data from A-share listed companies in China between 2013 and 2023, a difference-in-differences model was employed for empirical analysis. This study finds that the water resources tax reform significantly improves corporate ESG performance, and this conclusion is robust to various sensitivity tests.
Further analysis uncovers the mechanisms through which the water resources tax reform influences corporate ESG performance: First, by promoting breakthroughs in green technological innovation, it drives advancements in environmental protection technologies within enterprises. Second, by increasing environmental investments, it encourages businesses to place greater emphasis on sustainable development. Lastly, by enhancing pressure in the capital market, it compels firms to proactively improve their ESG practices. Additionally, media attention plays a significant moderating role in this process, highlighting the critical influence of external oversight mechanisms on policy effectiveness.
The heterogeneity analysis reveals that the impact of the water resources tax reform on corporate ESG performance varies across firms, with SOEs and large firms benefiting more significantly. This may be attributed to the superior resource availability of SOEs and large firms, which enables them to better respond to policy changes.
In summary, the findings of this study not only validate the effectiveness of the water resources tax reform but also provide theoretical support for improving environmental governance frameworks while offering practical guidance for corporate green transformation pathways. Future research could further explore the mechanisms through which other environmental governance policies influence corporate ESG performance and examine differences across regions and industries, thereby providing policy makers with more comprehensive references for decision making.
The findings of this study offer valuable insights into the role of economic regulation in shaping corporate ESG performance. Unlike direct command-and-control regulations that impose strict compliance obligations, fiscal instruments such as resource taxation provide firms with economic incentives to adjust their environmental strategies while allowing for greater flexibility in implementation. The significant improvements in ESG performance following China’s water resources tax reform suggest that well-designed economic regulations can effectively internalize environmental externalities, aligning corporate incentives with sustainability goals. Moreover, the identified mechanisms—green technological innovation, environmental investment, and capital market pressure—highlight how economic regulation extends beyond direct cost imposition to influence corporate behavior through multiple channels. By altering firms’ cost structures and investment priorities, taxation-based policies encourage proactive environmental strategies rather than passive compliance. Additionally, the reinforcing role of media attention underscores the importance of complementary regulatory measures that enhance transparency and accountability. These findings suggest that economic regulations should not be viewed in isolation but rather as part of an integrated policy framework that includes financial incentives, disclosure requirements, and stakeholder engagement to maximize their effectiveness in promoting corporate sustainability.
Based on the research findings, this study offers several policy recommendations for government departments and regulatory agencies aiming to enhance corporate ESG performance through fiscal instruments. First, policy makers should consider expanding the scope and coverage of resource-based taxes, such as the water resources tax, while refining tax rates and exemptions to balance economic efficiency with environmental sustainability. The results indicate that such fiscal policies can effectively drive corporate green transformation, particularly by incentivizing green technological innovation and environmental investment. Second, given the significant role of capital market pressure and media attention in reinforcing firms’ ESG improvements, regulators should strengthen ESG disclosure requirements and promote transparent reporting mechanisms to enhance market oversight. Encouraging institutional investors to integrate ESG factors into investment decisions can further amplify market-driven sustainability efforts. Third, the observed heterogeneity in firms’ responses suggests that targeted policy support is needed for small and non-state-owned enterprises, which may face greater financial and operational constraints in adapting to environmental regulations. Tailored incentives, such as green financing schemes and tax credits for sustainability-related expenditures, can help bridge this gap. Finally, fostering a more active media environment that enhances public and stakeholder scrutiny of corporate ESG performance can serve as an additional mechanism to ensure that firms remain committed to their environmental and social responsibilities.
In addition to potential benefits, it is important to acknowledge that water resource taxation may inadvertently encourage noncompliance among certain firms, particularly those operating on narrow profit margins or lacking formal financial resources. If higher water-related costs erode profitability, these “marginal enterprises” may opt to evade taxes or shift portions of their operations into the informal sector, undermining the intended environmental and social benefits of the reform. This scenario resonates with studies on shadow economies, which suggest that stringent regulations, absent adequate enforcement and support structures, can incentivize businesses to reduce transparency and accountability. Consequently, policy makers might consider implementing mitigating measures—such as graduated tax rates, targeted subsidies, or improved compliance monitoring—that discourage informal practices while ensuring that legitimate businesses remain competitive. By addressing these risks, governments can help maintain a level playing field and better achieve the reform’s objective of promoting sustainable water use and corporate ESG improvements.
This study also has some limitations. While DID is well suited to identifying policy effects under certain conditions, future studies might explore complementary methods (e.g., event studies, synthetic control) or collect micro-level data on water usage to enrich the analysis and address any residual endogeneity concerns.

