Article

The Impact of Extreme Sea Level Rise on the National Strategies for Flood Protection and Freshwater in the Netherlands

1
Rijkswaterstaat, 3500 GE Utrecht, The Netherlands
2
MB-Water, 1019 XE Amsterdam, The Netherlands
3
Faculty of Civil Engineering and Geosciences, Delft University of Technology, 2628 CN Delft, The Netherlands
*
Author to whom correspondence should be addressed.
Water 2025, 17(7), 919; https://doi.org/10.3390/w17070919
Submission received: 12 February 2025 / Revised: 14 March 2025 / Accepted: 17 March 2025 / Published: 21 March 2025
(This article belongs to the Special Issue Climate Risk Management, Sea Level Rise and Coastal Impacts)

Abstract

:
This work investigates the impact of sea level rise (SLR) of up to 3 m on flood protection and freshwater availability in the Netherlands. We applied an exploratory modeling approach to consider the large degree of uncertainty associated with SLR. The results show the current degree of flood protection can be technically and financially maintained for up to three meters of SLR. A primary finding of this work is that a similar degree of safety against floods can be maintained. There are, however, several challenges: First, maintaining this degree of safety against floods requires considerable spatial allocations to maintain and upgrade flood defenses, often in populated areas with limited space. Second, the supply of sand for coastal nourishments will be challenging due to other functions in the North Sea (wind energy, shipping) and explosive remnants of war. Third, an acceleration in the rate of SLR may impact the overall feasibility of maintaining flood defenses. Maintaining the freshwater strategy will be challenging due to SLR-induced salt intrusion, which aggravates climate impacts including droughts. Continued flushing of salinized areas of regional water systems and polders with fresh river water will increasingly compete with other demands. Our analysis highlights the vulnerabilities of the flood protection and freshwater strategies and gives input to follow-up analyses on societal impact and perspectives of actions for adaptation.

1. Introduction

The Netherlands is a low-lying, densely populated, heavily urbanized and cultivated delta of the Rhine, Meuse, Scheldt and Ems rivers. It is strongly exposed to the influences of the adjacent North Sea. Currently, 26% of the area of the Netherlands is located under mean sea level, and in total, 60% of the area is prone to flood risk from the sea, lakes and rivers [1]. Apart from flood risk and coastal erosion, the Netherlands is exposed to saltwater intrusion and salinization of its surface waters and groundwater. Due to salinization, around half of the country is dependent on freshwater supplied by the Rhine and Meuse distributed through the highly managed surface water system.
Recent analyses of sea level observations indicate that the global mean sea level (GMSL) is rising, and there is a very high confidence that this rise is accelerating [2]. Rising sea levels with a likely accelerating rate are also observed along the Dutch coast [3,4]. Projections of SLR derived by the Royal Dutch Meteorological Institute [4] showed an SLR of up to approximately 3 m in 2200 (83rd percentile of ensemble model results for the SSP5-8.5 emission scenario). Van Dorland et al. [4] included several low-likelihood high-impact scenarios with an SLR of up to 17.5 m in 2300, which are considered ‘physically plausible and realistic but, based on present knowledge, highly uncertain and possibly unlikely’. A degree of SLR of several to multiple meters may raise several existential questions for the Netherlands since most of the country consists of an exposed river delta. The Netherlands has developed and implemented a set of thorough strategies to manage flood risks and optimize freshwater supply [5,6,7]. The current strategies already consider an SLR of 0.85 in 2100 [8], and the recent insights raise the question of whether and how long these strategies for flood protection and freshwater can remain effective against extreme SLR.
Earlier quantitative research that investigated the impacts of SLR on flood protection and freshwater availability was either focused on lower degrees of SLR, typically up to around 1 m [9,10,11,12]. Or research was based on more conceptual approaches, for example, using interviews with experts [13], explorations of long-term adaptation pathways [14] or developing storylines [15]. While these methods have demonstrated their value in making complex issues with high degrees of uncertainty accessible to policy makers, model-based quantitative assessments of the impact of extreme SLR on flood protection and freshwater availability are not yet available for the Netherlands. This work aimed to close this gap in the literature and is particularly novel as it presents a quantitative-model-based national assessment of the impacts of SLR of up to 3 m on the combined spectrum of coastal and fluvial flood protection and freshwater availability.
The Dutch government hence initiated the national Sea Level Rise Knowledge Programme [16], which aims to address the following questions:
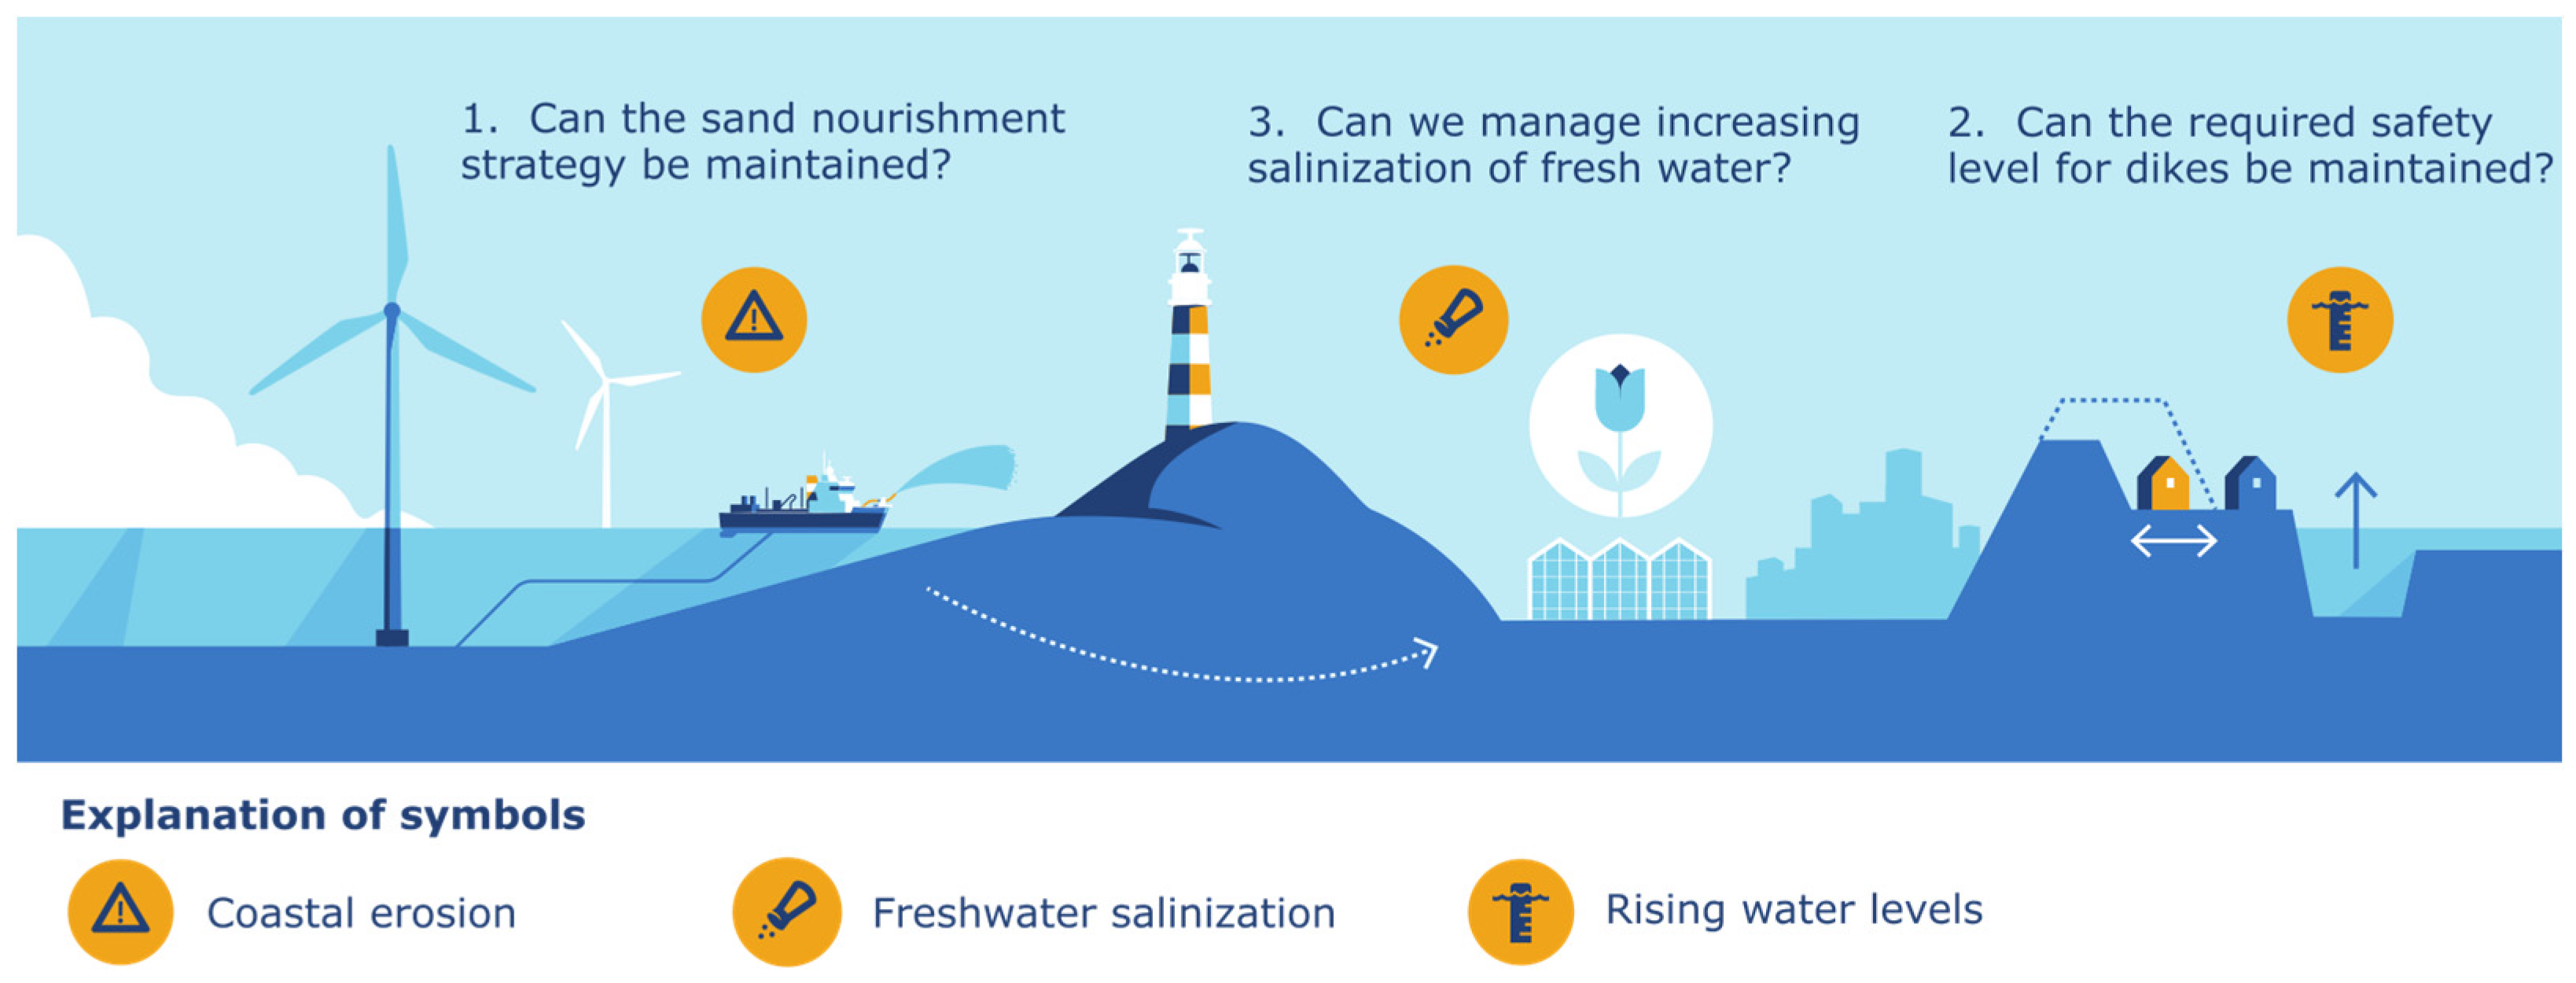
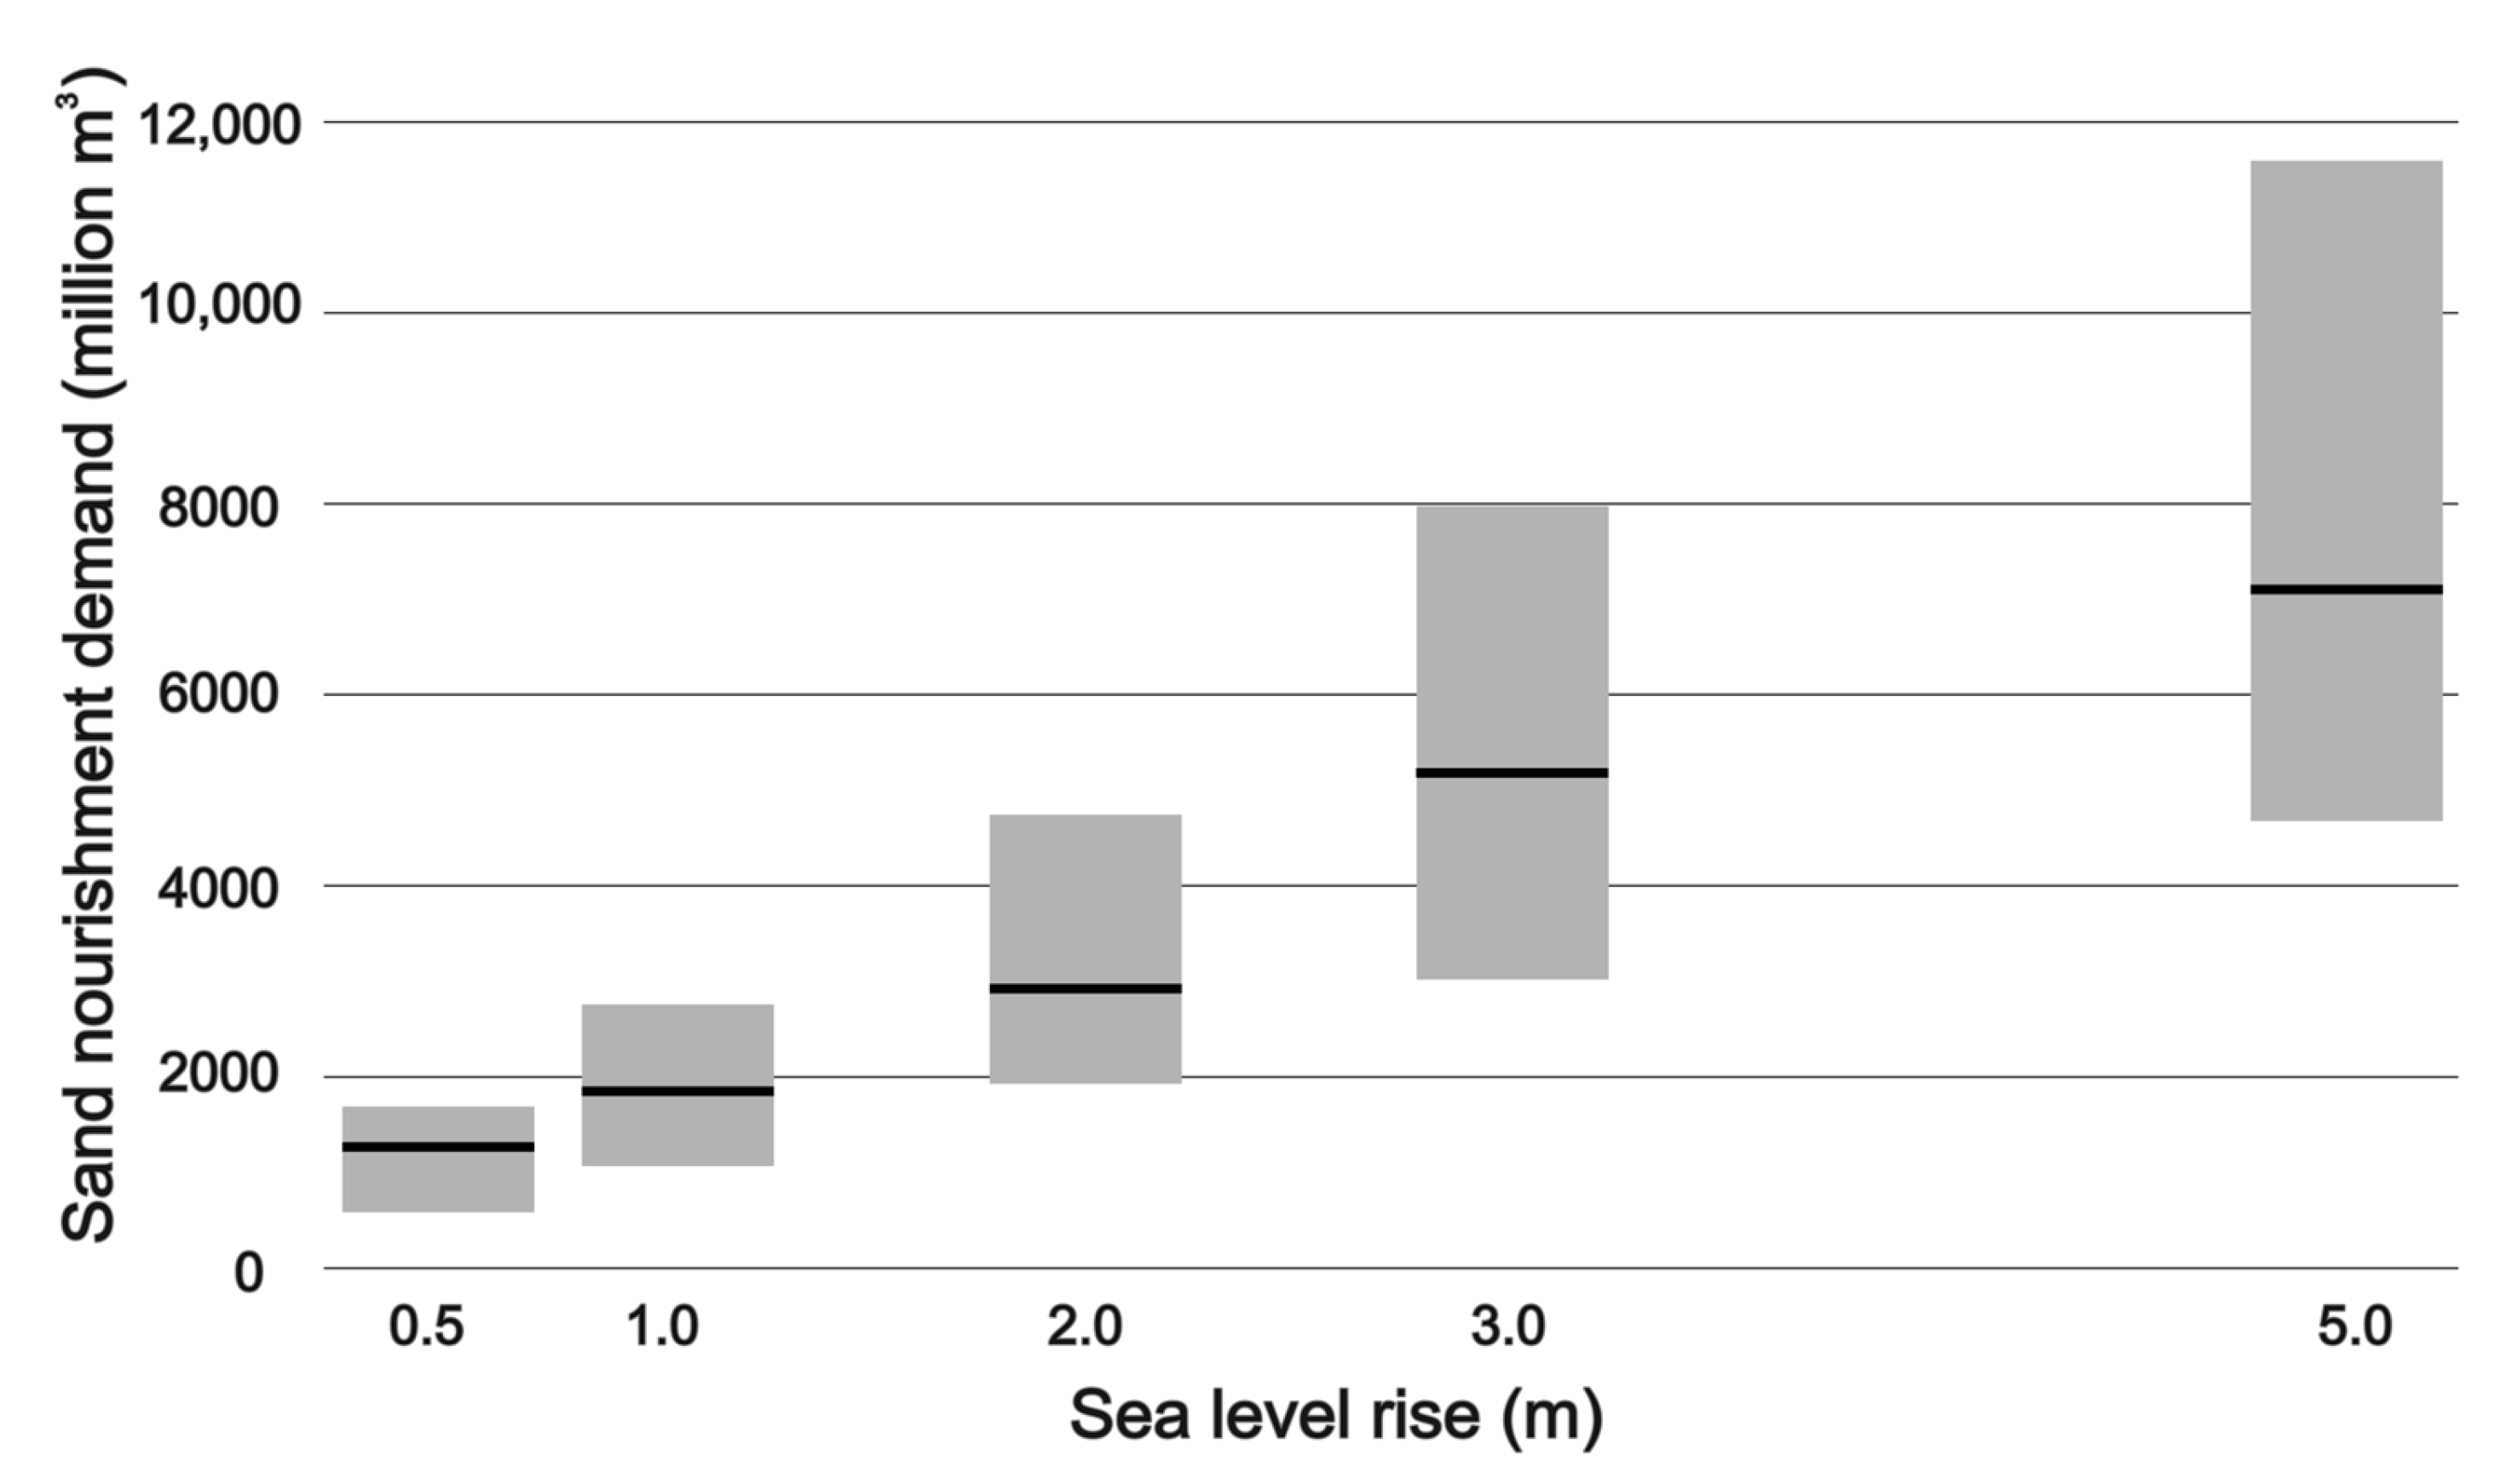
  • For ‘soft’ flood defenses (dunes), the key question is whether the foreshore sand nourishment strategy can be maintained. How much sand is required? And is this available?
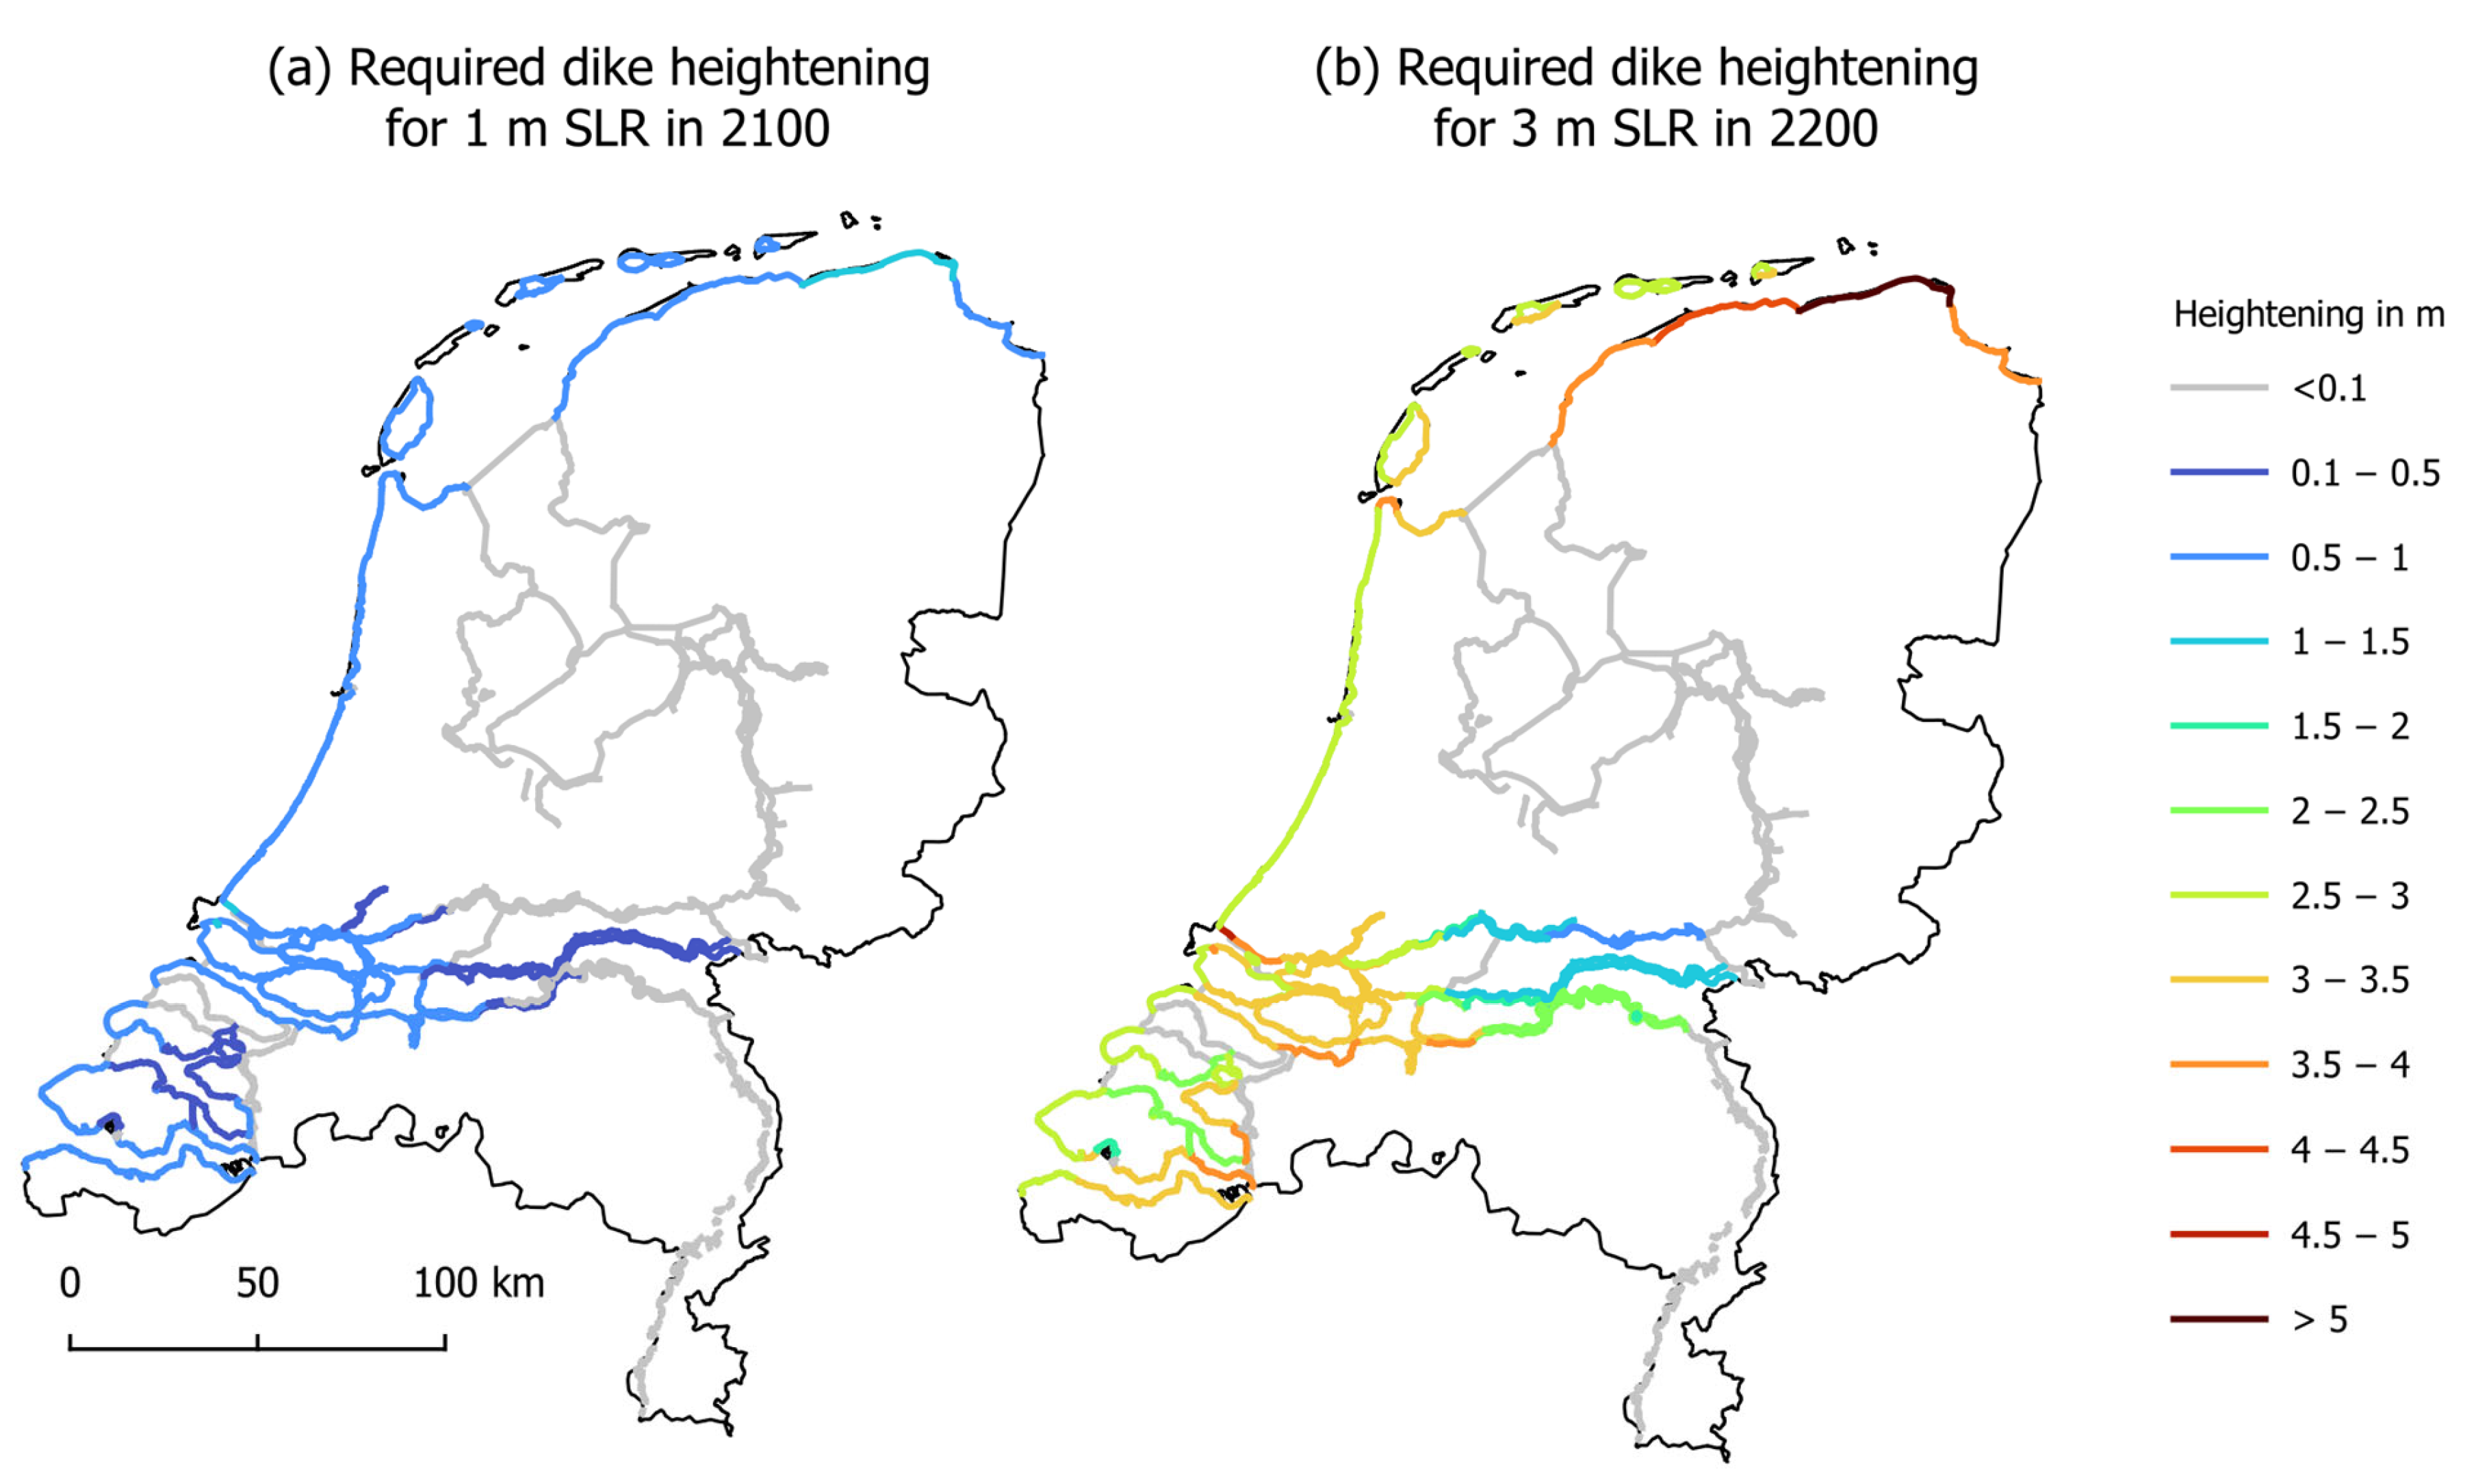
  • For ‘hard’ flood defenses (artificial structures), the key question is whether the required safety level can be maintained. Is the strengthening of dikes and other structures technically feasible? And what are the spatial consequences?
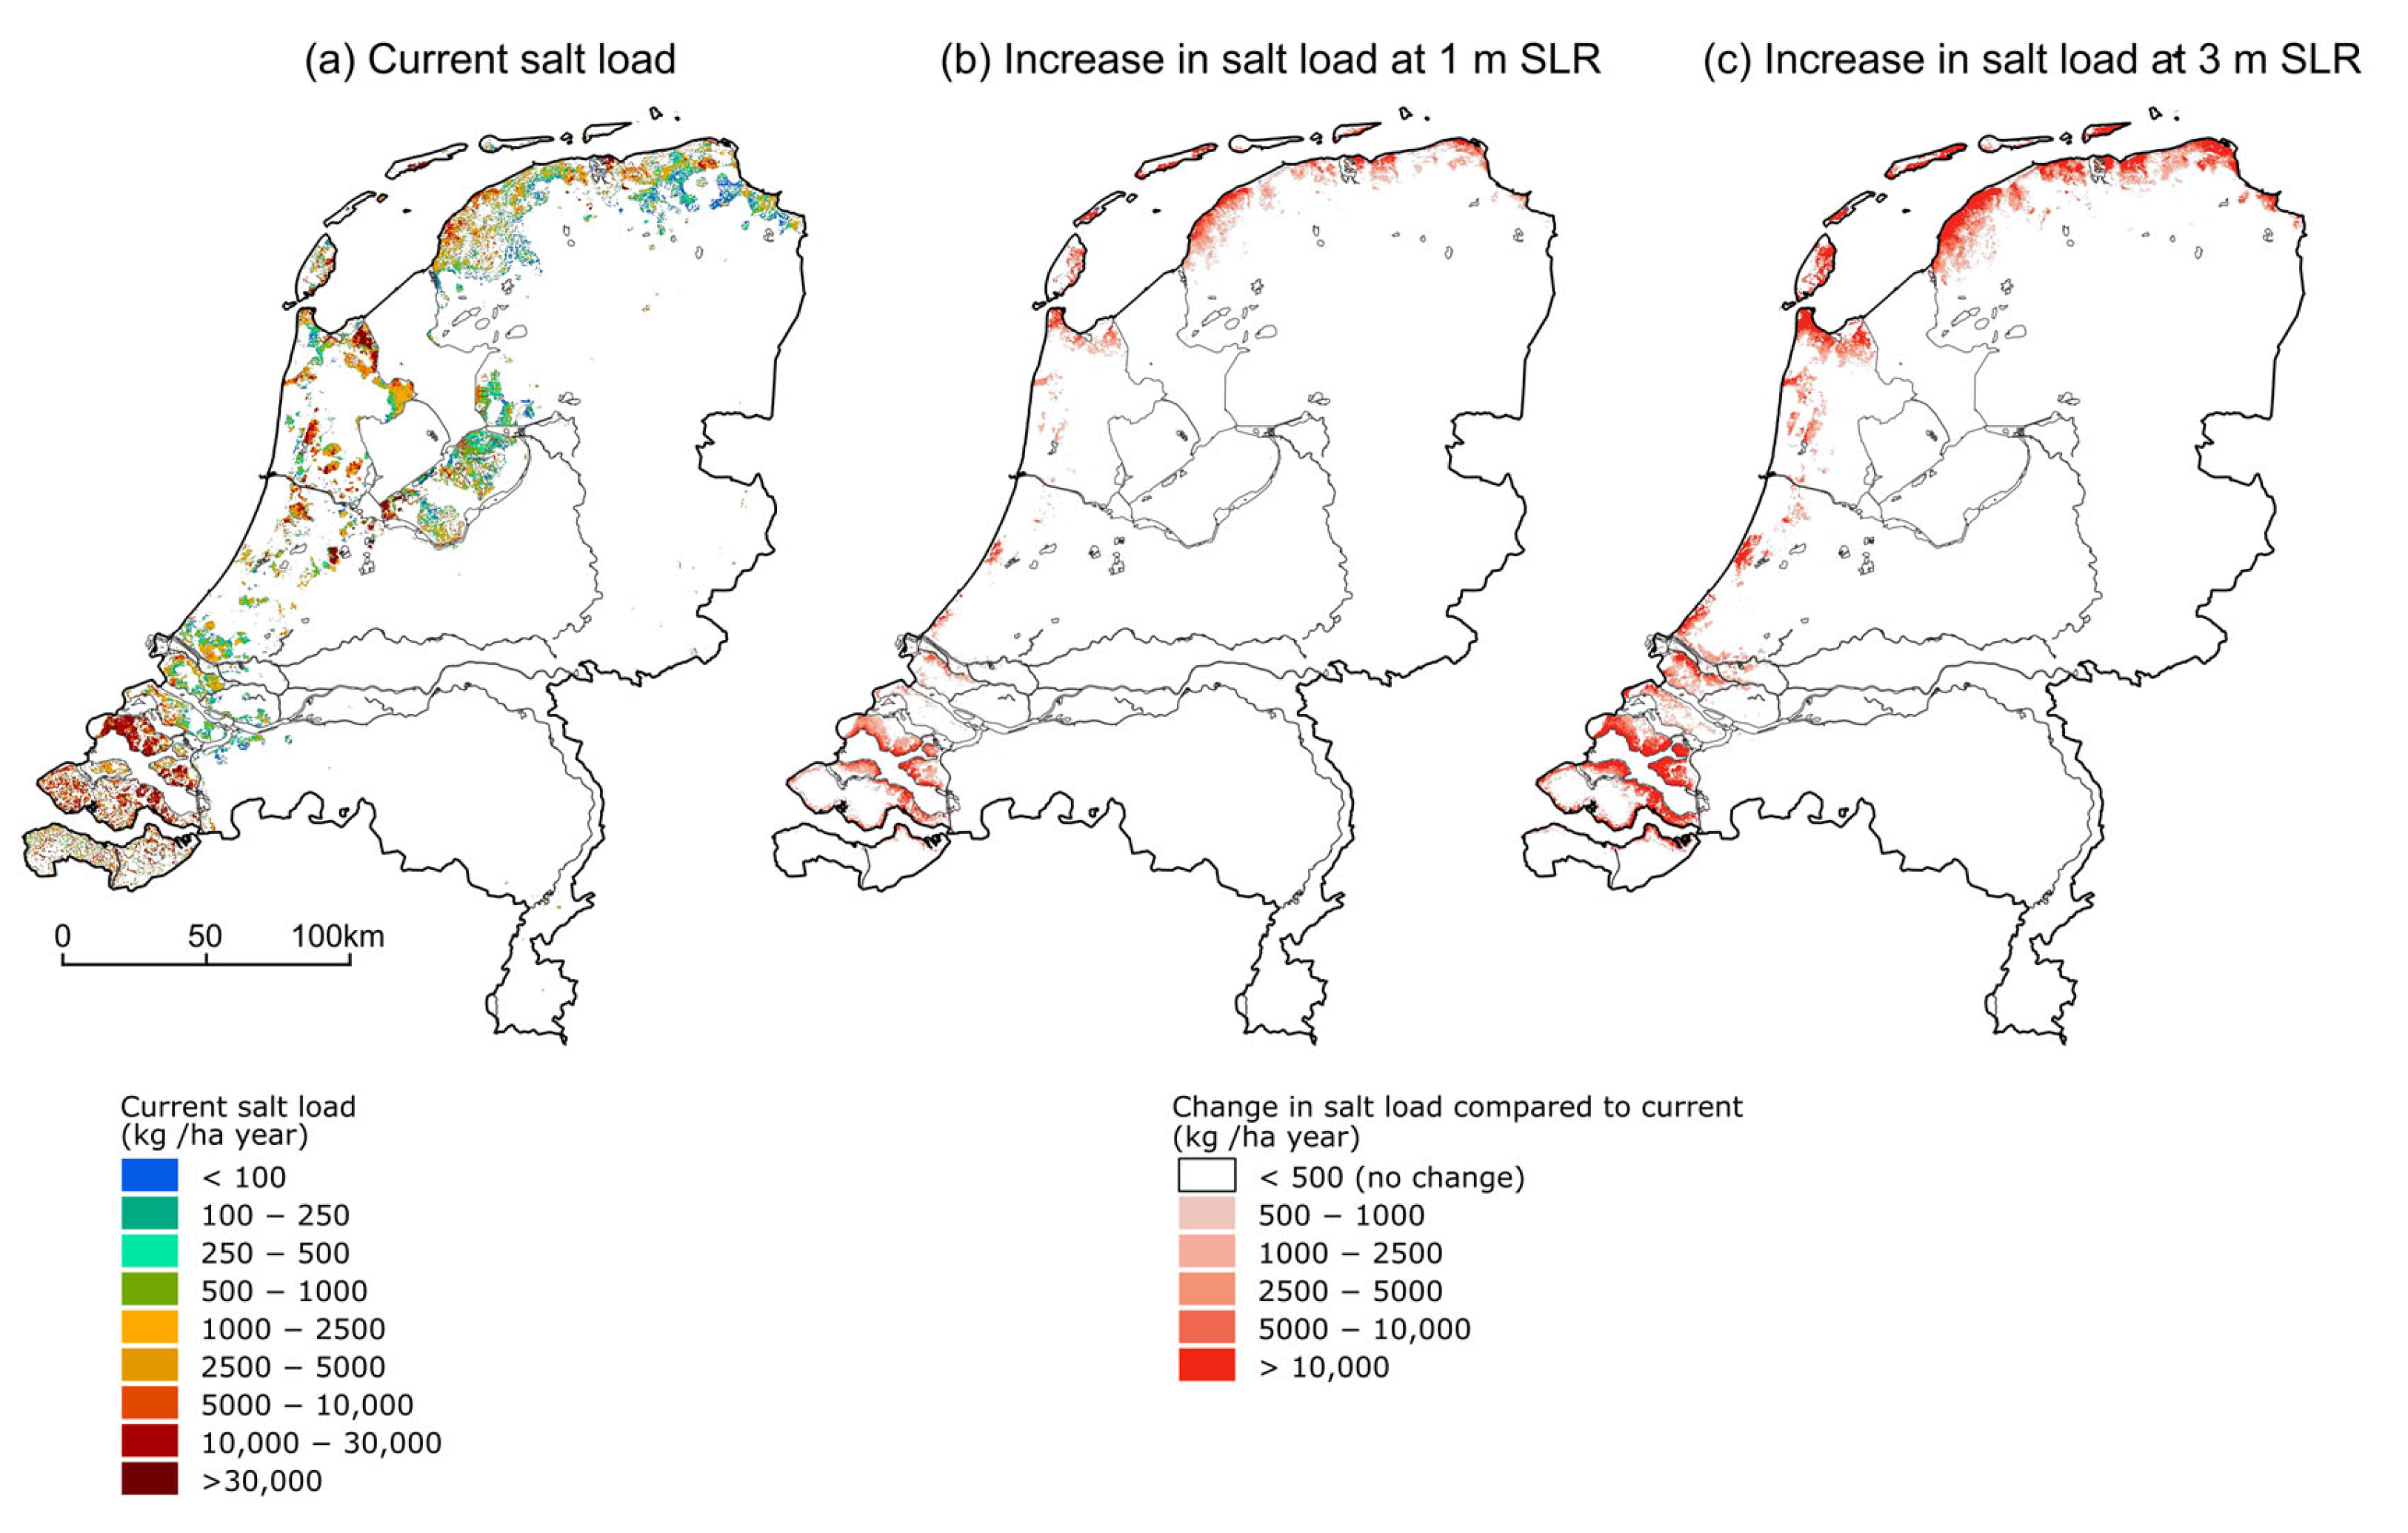
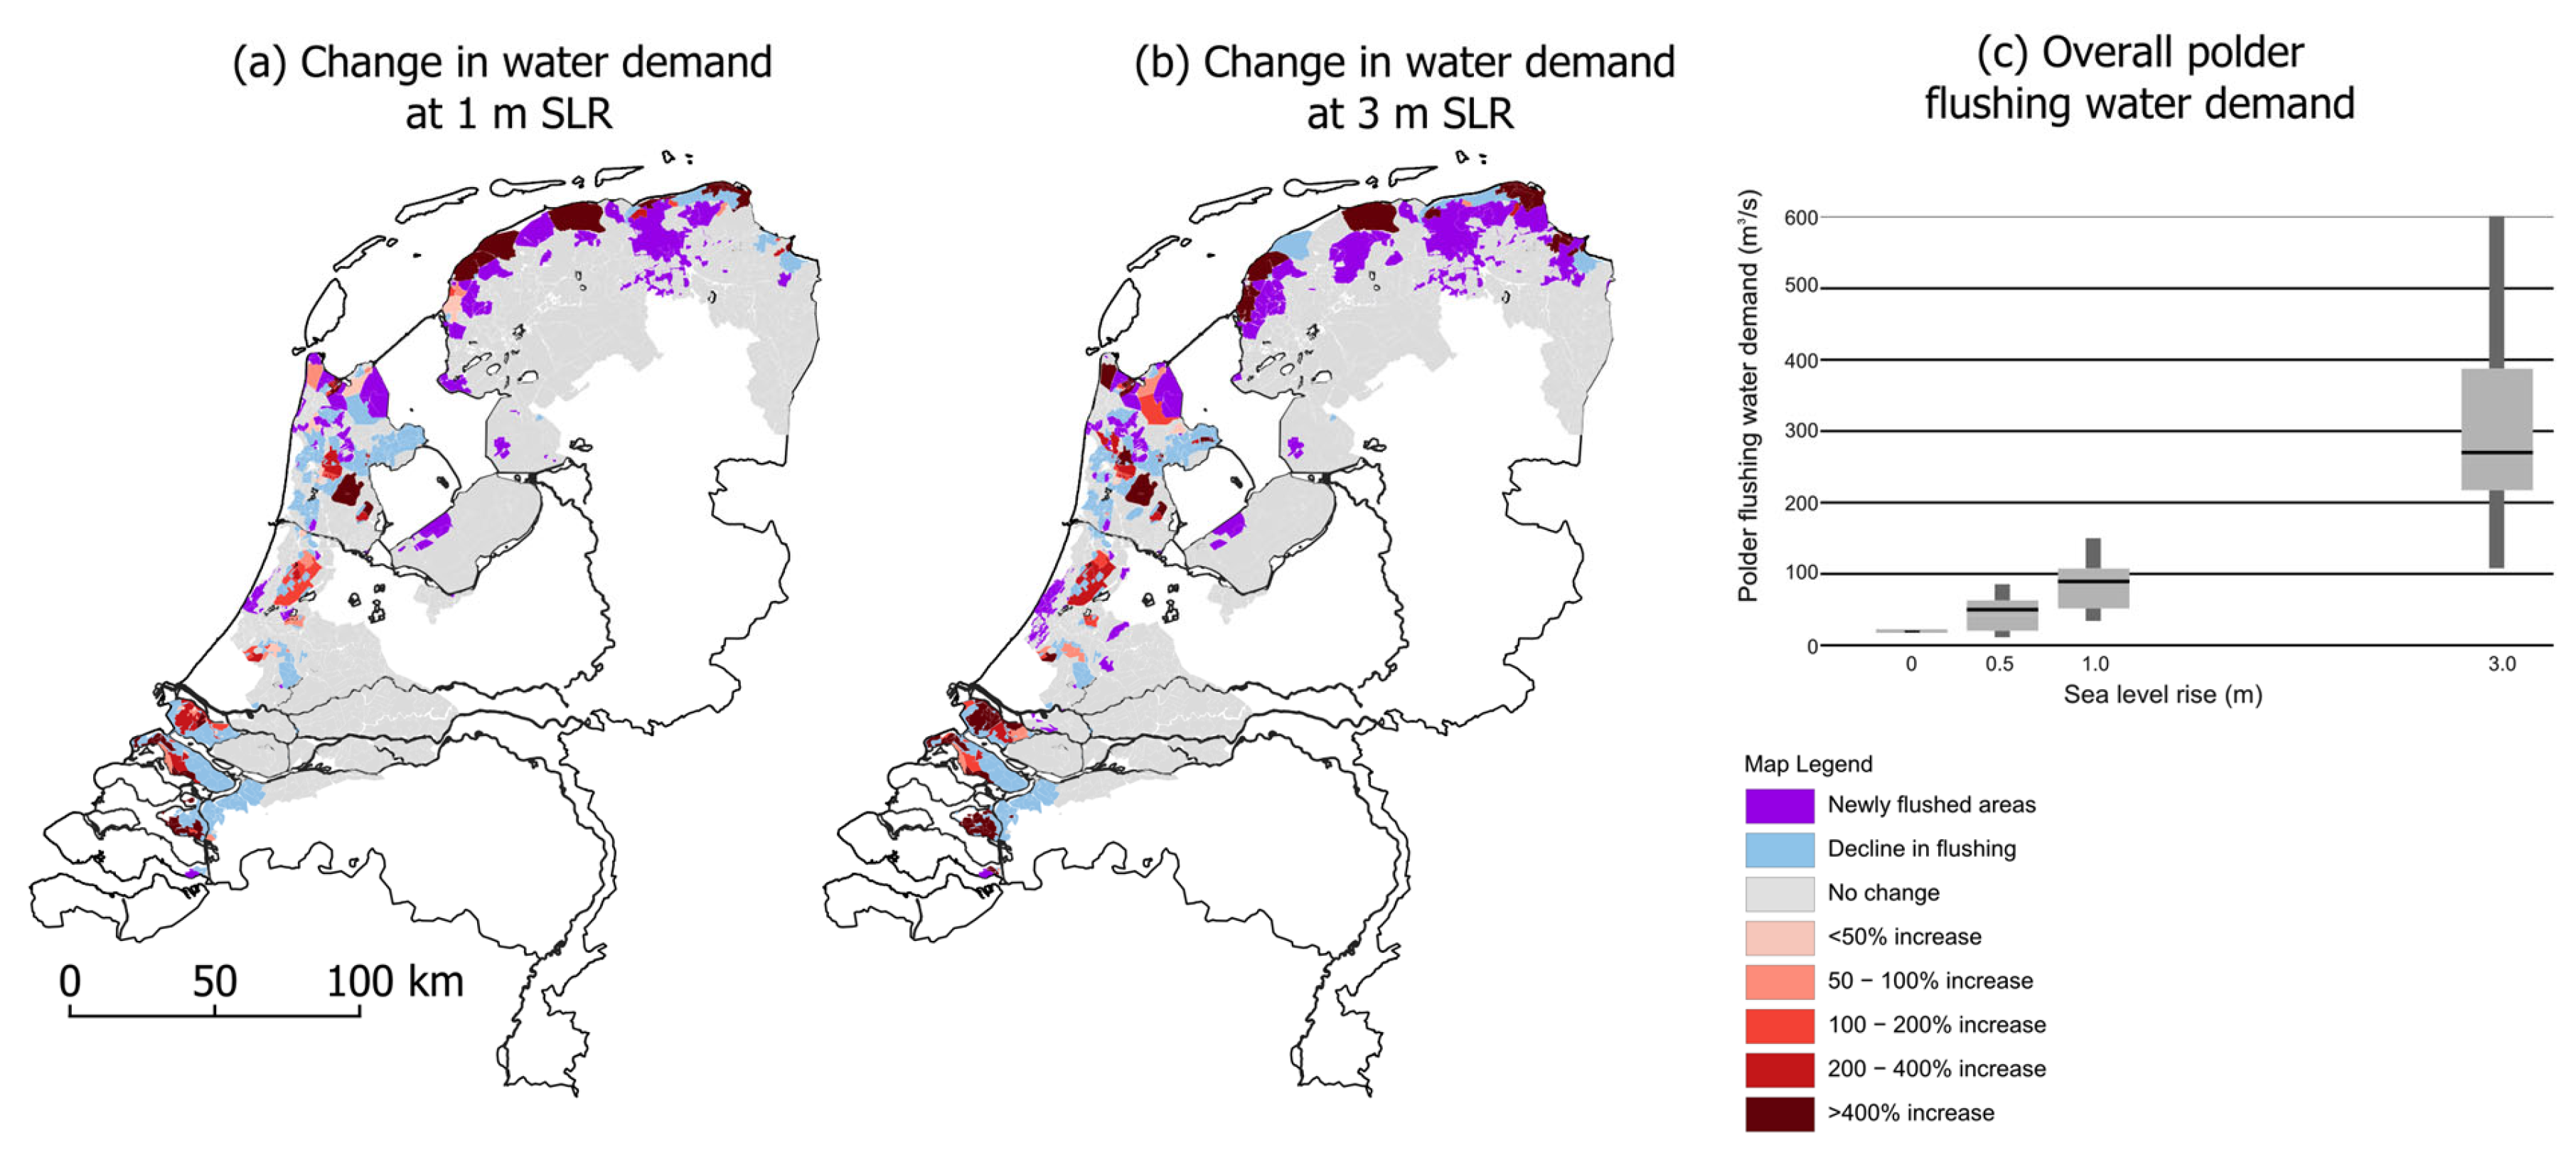
  • For freshwater, the key question is whether the supply and demand of freshwater can be balanced and keep freshwater intake structures safe from salinization, considering the increasing water demand required to counter saltwater intrusion.
These assessments consider combined hazards due to mean sea level rise, storm surges, tides, peak river discharges (fluvial high water) and wave impact (flood safety) and periods of drought and low river flow (freshwater) as indicated in Figure 1.
In this paper, we present the methodology and outcomes of the quantitative assessments of the impact of extreme SLR on the current national flood protection and freshwater strategies and discuss how these outcomes are used in the context of robust decision and policy making. This work specifically aims at identifying and quantifying the physical consequences of SLR of up to 3 m on the main Dutch water systems and their impact on the Dutch water strategies. It is noted that in the first stage of the Knowledge Programme, we quantified the possible effects of SLR for specific values of SLR (0.5, 1, 2 and 3 m), and we aimed at providing an assessment regardless of when such values may be reached. This circumvents the large uncertainty around the acceleration of the rate of SLR. Timelines of SLR were used to allow a combination with other developments which influence flood protection and freshwater availability including developments in river flow and land subsidence. This quantitative modeling assessment complements the work of a second research line within the national SLR knowledge program which uses an exploratory qualitative approach to assess long-term strategies for an SLR of up to 5 m [17].
The work presented here is structured as follows: First, we provide an overview of the current policies and strategies with respect to flood protection and freshwater availability. We then describe our modeling approach for flood protection (both coastal sand nourishment requirements and structural safety) and freshwater availability (salinization of both groundwater and surface water), followed by the main outcomes of these assessments. We conclude our work with several reflections on how these results can be used in Dutch climate change adaptation policy.

2. National Climate Adaptation: The Dutch Delta Policy

2.1. The Netherlands and the Dutch Delta Programme

The Netherlands is renowned for its advanced flood protection and water management systems. Around a third of the country lies below the current sea level, and it has developed an extensive network of dikes and storm surge barriers to prevent flooding. Freshwater availability is managed through canals and reservoirs which aim at directing water to ensure adequate supply for various uses. Both flood safety and water availability are increasingly under pressure due to climate change. In 2010, the Netherlands, therefore, implemented a national policy program for adaptation to climate change: the Delta Programme [18,19]. The Delta Programme focuses on the themes of flood protection, freshwater availability, and spatial planning and works towards a climate-resilient design of urban and rural areas across the Netherlands through a so-called Adaptive Delta Management (ADM) approach [20]. This approach combines short-term plans with long-term delta strategies, as well as a monitoring and evaluation process. Every six years, decisions are reviewed and, if needed, updated. The Delta Programme uses IPCC-based, regional climate projections for the Netherlands [21]. The Sea Level Rise Knowledge Programme aims to provide further insights into whether the current policies within the Delta Programme are effective for higher SLR, whether tipping points can be found, and, if so, which thematic strategies of the Delta Programme require adjustment.

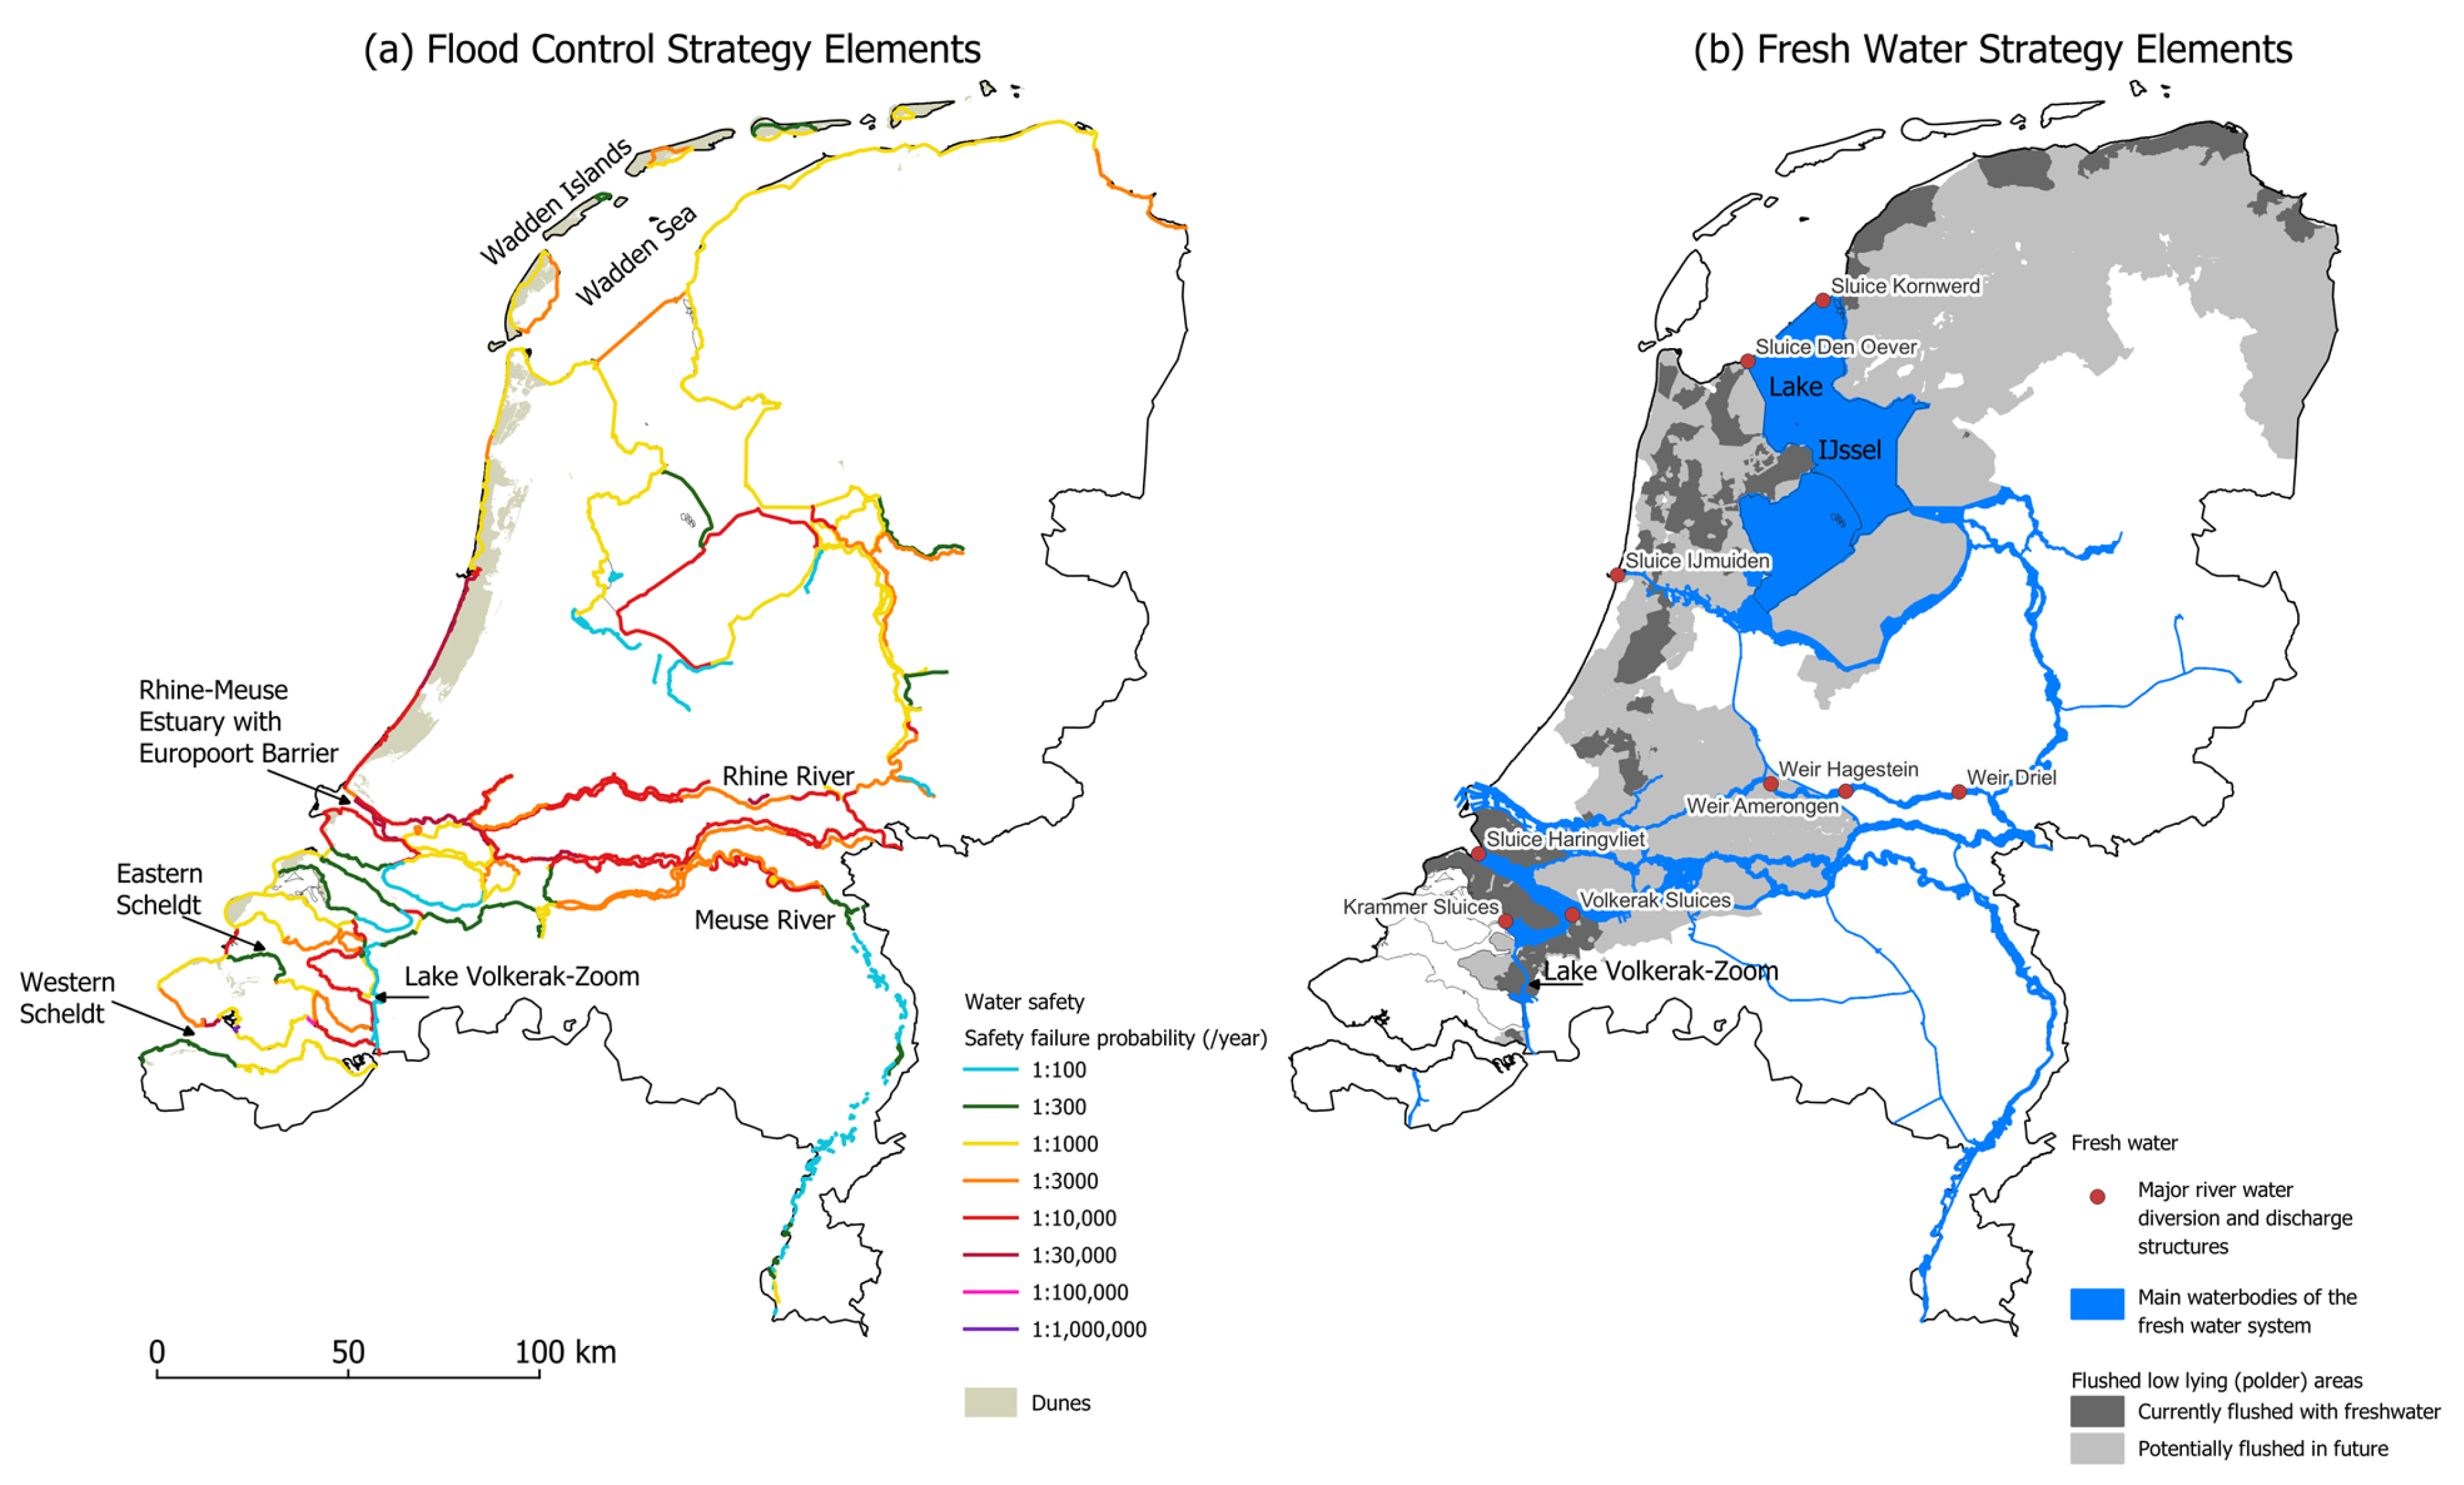
2.2. Flood Protection Strategy

The Dutch flood protection policy is risk-based, considering both the probability of flood hazard of a certain magnitude and the impact of flooding based on exposure (area and depth of inundation) and vulnerability (casualties and economic damage) [5]. The strategy is threefold: The first line of defense aims at preventing floods. The second line of defense aims at reducing exposure through spatial planning and design. The third line of defense aims at minimizing casualties (e.g., through early warning systems, evacuation). Traditionally, the first layer receives the most attention in the Dutch flood protection strategy. This first layer in the Netherlands consists of a network of primary flood defenses consisting of over 400 km2 of dunes, over 17,000 km of dikes and levees and about 25 barriers and dams. The required level of safety that primary flood defenses should provide is expressed as the probability of flooding per year for each segment of the enclosure (Figure 2).
A large part of the coastline is protected through natural dunes, which together with the beaches also provide important other ecosystem services (e.g., drinking water, recreation). Erosion in the coastal profile is compensated by regular sand nourishments on the shoreface and the beach. This aims to maintain the required safety level and leverage the natural, short- and long-term sediment transport dynamics cross-shore and alongshore in the beach zone and related aeolian sand transport in the dune zone [22]. This dynamic management is the preferred method for coastal protection in the Netherlands, with hard flood defenses (dikes and dams) and foreshore protection only in locations where nourishments or other sand-based solutions are technically or economically not feasible. As the sediment budget of the shallow coastal zone should remain intact, part of the policy also entails that sand mining is only allowed in deeper parts of the Dutch North Sea, beyond water depths of 20 m [23]. The safety against floods for the remaining ‘hard’ flood defenses was increased in the 20th century by reducing the effective length of the coastline following major coastal floodings. This involved the damming of the former Zuiderzee (in the year 1932) and closing some of the estuary branches of the Scheldt–Rhine–Meuse delta with dams, levees and dikes (1960–1986). In the Rotterdam area and Eastern Scheldt estuary, storm surge barriers have been constructed in combination with dikes along the estuary and riverbanks to allow for natural tidal dynamics and shipping passage, respectively.

2.3. Freshwater Strategy

The Dutch freshwater strategy relies on managing and directing freshwater in the surface water system towards dedicated lakes, canals and river branches where important freshwater intakes are located. Apart from the main surface waters, reclaimed land (so-called polders, indicated in grey in Figure 2) situated below sea level is prone to seepage of brackish groundwater. These polders are flushed with freshwater sourced from the main rivers [24]. The combined efforts to keep reservoirs fresh and up to required water levels and to flush saline groundwater seepage in polders put a considerable claim on freshwater resources, particularly during periods of low river flows and high evaporation. The volumetric water claim is expected to grow due to SLR. The overall freshwater policy ambition is to balance the overall water supply and demand such that actual water shortages only occur once per 20 years [25].
It is noted that, irrespective of climate change, low river discharges already lead to salt intrusion via the open river mouths of the Rhine–Meuse system [26]. Lakes and canals with shipping locks and sluices towards the sea are subject to salt intrusion as well [27]. Hence, technical measures (bubble curtains, innovative locking chambers, selective withdrawal concepts, etc. [28]) to prevent salt intrusion via locks and sluices are also part of the freshwater strategy, besides flushing.
Climate change is putting this freshwater management strategy further under pressure. Rising global temperatures lead to increased variability in seasonal precipitation and droughts, resulting in increasing summer water demand and periods of low river flows [21,29,30].

3. Methods

3.1. The Modeling Strategy

In our modeling strategy, we primarily focused on SLR but also considered other components of climate change, such as changes in temperature, precipitation and changing river flows. Current climate projections show that SLR beyond 2 m is a worst-case scenario that may occur on a time scale ranging between 150 years and three centuries, while for a best-case scenario, it may not occur before 2300 [4]. Under various low-likelihood high-impact scenarios that incorporate ice cliff instability, SLR beyond 17.5 m may even occur in 2300 [4,31], although recent modeling suggests that the Thwaites Glacier is likely less vulnerable to marine ice cliff instability than previous studies showed [32]. The ongoing scientific debate illustrates the high degree of uncertainty in the field of SLR: epistemic uncertainty is superimposed on the large uncertainty related to the economy, demography and land use over this time scale. This results in deep contextual uncertainties, a large system complexity and many resulting policy options (Figure 3). Ref. [20] recommended the Decision Making under Deep Uncertainty (DMDU) approach for exploring policy options, in order to research a broad range of assumptions and circumstances, preferably using exploratory modeling [33].

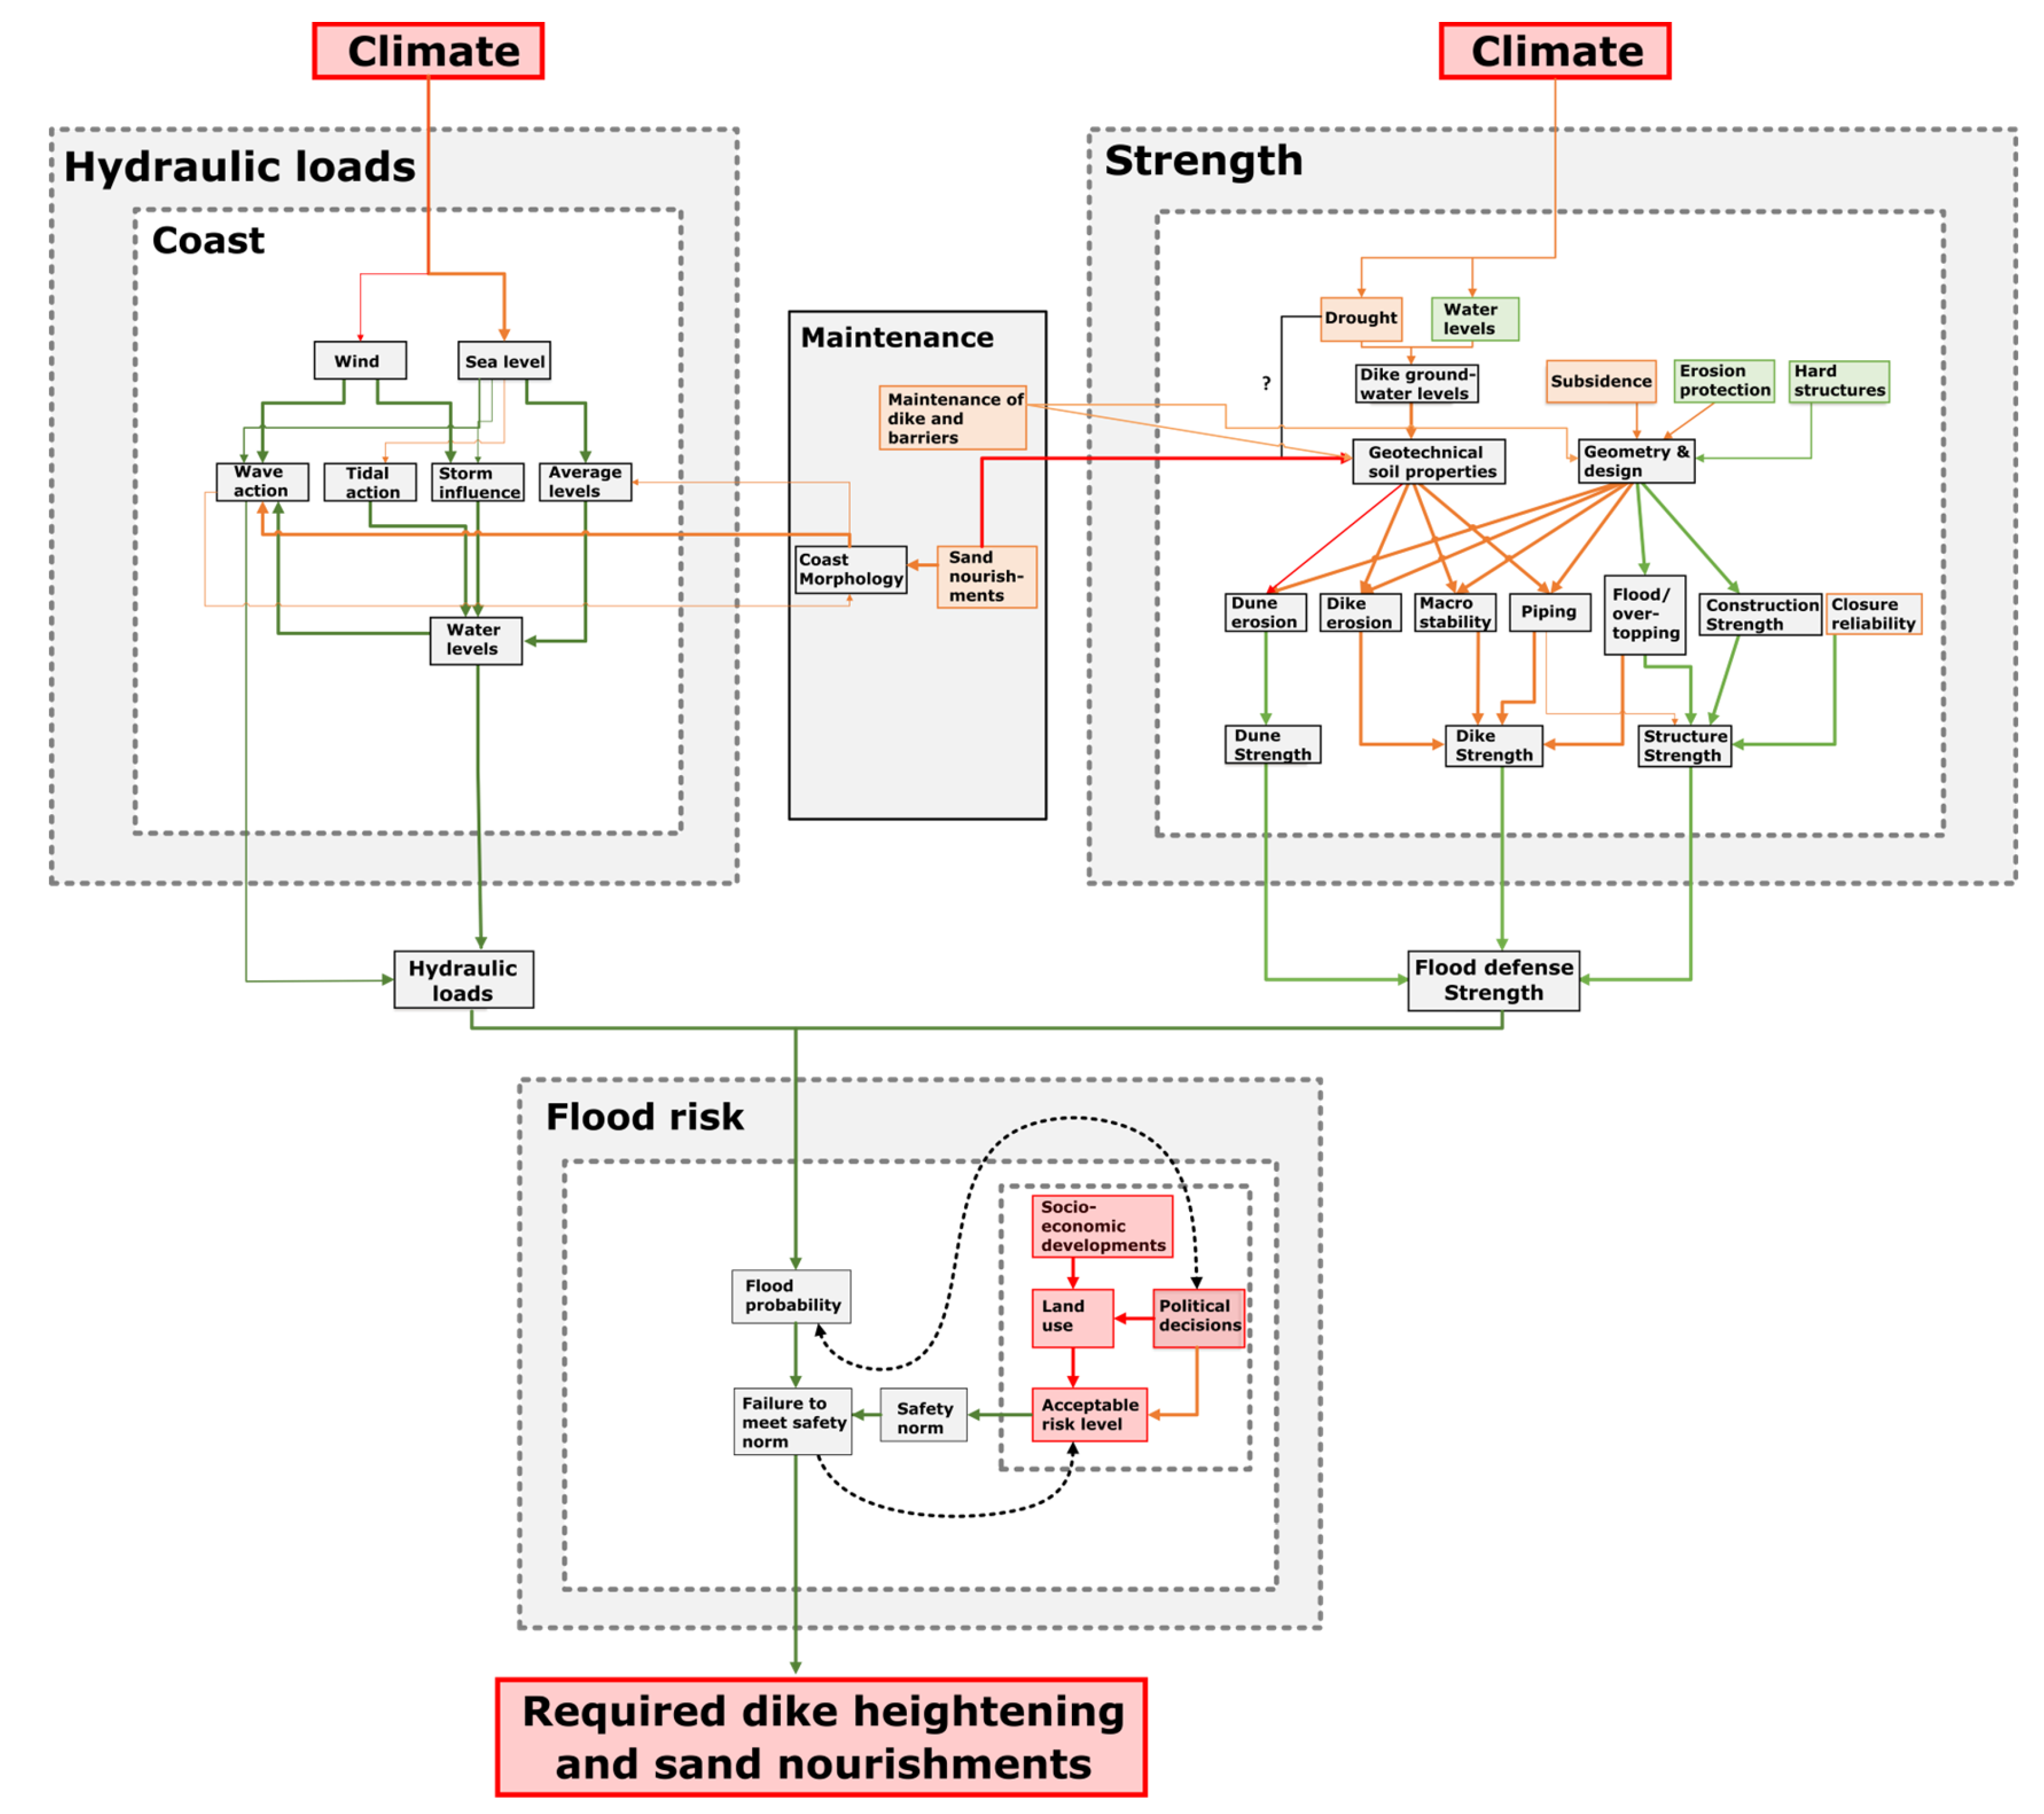
3.2. The Modeling Approach: From Conceptual Models to Numerical Models

The very first step consisted of inventorying relevant research questions and prioritizing the ones that would be addressed within the water system analyses. This step partially followed the Drivers, Pressures, State, Impact, and Response (DPSIR) framework and was carried out through workshops with various stakeholders [35]. The inventory was used to identify the relevant indicators or states S with which the effect of SLR can be described. The following step was to set up conceptual models of the water systems to be analyzed. Conceptual models are here defined as descriptions of physical and societal systems using box and arrow diagrams that summarize causal relations between quantities [36]. The goal of the conceptual models was to identify all pressures P that influence the states S, and to describe through what processes (physical, societal or other) the influence takes place. The arrow thickness indicates how dominant a certain causal relation is; the arrow color is an indicator for how well the relation can be conceptualized. Figure 4 presents an example of such a conceptual model.
This analysis facilitated the selection of the geographical extent and physical processes to be included. For instance, what are the various pressures P that the systems are subjected to? Which ones may be considered independent from each other? And which ones may be bundled together? Which ones may be considered stationary, and which ones must be considered transient? For example, an important pressure P with respect to freshwater availability is the incoming salt flux through shipping locks. The latter is in turn determined by the combination of mean sea level and tidal amplitude together with the intensity of ship passages across shipping locks of given dimensions. A crucial part of this stage was to define what physical processes must be considered in the models and how, and which ones may be neglected.
The next step consisted in translating the conceptual models into numerical models. Priority was given to re-using existing models as much as possible, as they have been calibrated and validated in the past. The constraint was that existing models must be found fit-for-purpose. Whenever models would be found unsuitable, priority would be given to developing new, suitable models based as much as possible on existing and familiar concepts.

3.3. Assessment of Flood Protection Under SLR

3.3.1. Timelines for Sea Level Rise

Four timelines were defined by the Royal Netherlands Meteorological Institute (KNMI) for this study [37]. KNMI combined the findings in the SROCC report Chapter 4 by Oppenheimer et al. [38] with expertise from probabilistic regional, north-west European SLR projections: 0.5 m and 1.0 m SLR both to occur in 2100 (based on low (RCP2.6) and high (RCP8.5) emission scenarios, respectively), and 2.0 m and 3.0 SLR both to occur in 2200 (based on moderate (RCP4.5) and high (RCP8.5) emission scenarios, respectively). These degrees of SLR represent the upper limit of an 83% confidence interval (corresponding to the upper limit of the likely range used by the IPCC). The derived timelines for SLR were recently compared to the KNMI’23 scenario [4], and the differences were very limited, i.e., less than 0.03 m in 2100 for RCP4.5 (SSP2-4.5) and RCP8.5 (SSP5-8.5) and less than 0.1 m for RCP2.6 (SSP1-2.6).

3.3.2. Sand Nourishments to Maintain ‘Soft’ Flood Defenses

Required sand nourishment volumes to accommodate for SLR were modeled using a conceptual box model based on observational data [39]. The uncertainty in the sediment demand was assessed by including both the area of the most likely active coastal zone as well a possible but less likely area of the active coastal zone [40].

3.3.3. Assessing the Flood Safety of ‘Hard’ Flood Defenses

The modeling strategy was based on standardized methods for assessing primary flood defenses [8]. It involves comparing hydraulic loads (the forces exerted by water on flood defenses) with a failure model of the flood defense. The failure model includes the dike profile (including the immediate foreshore) besides revetments, inner dike materials, soil properties and the effect of water pressure in the dike. The hydraulic loads are modeled with a combination of hydrodynamic models and wave models for up to thousands of various circumstances. Flood defenses can fail for a number of reasons [8]. This study focused on three primary failure processes: dike height (overtopping and overflow), slope stability and piping, consistent with policy analyses in which flood defenses are assessed under various climate scenarios.
The flood safety assessment followed a probabilistic approach using water level and wave load as the main stochastic variables. The total resulting hydraulic loads were simulated using several hydrodynamic models, including SOBEK3 [41] for rivers, IMPLIC [42] for the Eastern Scheldt and WAQUA for the Western Scheldt and Wadden Sea [43]. Waves were computed using the analytic 1-d model Bretschneider [44] for rivers or the spectral phase-averaged wave model SWAN [45,46]. These models use statistics derived from previous frequency analyses on historical records of measured seawater levels, wind and river discharges as input [47]. Wind–water level correlation was added [48,49]. The statistical analysis described seawater levels, river discharges and wind spanning from short return periods (T = 2 years) to extreme return periods (T = 100,000 years) and beyond through extrapolation.
The model output includes physical parameters required for water levels and waves for all locations stored in a database of physical stochastic variables, which is input to the probabilistic modeling tool Hydra-NL [50,51]. Hydra-NL computes the probability of occurrence of the various combinations, with the exception of hydraulic loads to the dunes that were calculated using the Riskeer software, version 22.1.2 [52]. The stochastic variables considered vary per water system (Table 1). The probabilistic failure analysis of existing structures leveraged the results of previous flood safety assessments, including VNK-2 which was completed in 2014 [53] and LBO1 which was completed in 2023 [54]. For dikes, the assessment included fragility curves for piping and macro-stability, and for dike height, an overtopping model was employed. Revetments were added as a cost factor for the total cost. For storm surge barriers and hard structures, a pragmatic approach based on height was employed, assuming that these structures will be replaced once before 2200, and the total cost for this was included.
The spatial and financial impact of strengthening flood safety structures has been further assessed with the cost model OKADER [55]. In places where available space was limited and a ‘traditional’ dike reinforcement was not possible, we assumed that either hard vertical structures will be constructed assuming a lifetime of 100 years, or buildings will be demolished to create space for dike reinforcement. In the latter case, the financial analyses included the cost of depreciation of existing houses.
The following additional assumptions were included in the modeling: (1) The SLR timelines described above allowed the combination of different degrees of SLR with climate scenarios of peak discharge of the Rhine and Meuse rivers, derived from earlier work by Hegnauer [56], and a reference scenario. Because the peak discharges derived by Hegnauer [56] have been specified for 2050 and 2085, they have been extrapolated to 2200 using projections in global temperature and the Clausius–Clapeyron relationship. The validity of this approach has been demonstrated for mid-latitudes by Pall et al. [57]. This resulted in peak discharges of 18,000 and 20,000 m3/s for the Rhine River and 4800 and 5300 m3/s for the Meuse River in 2100 and 2200. Additionally, it was assumed that the distribution of river flow over downstream tributaries will remain unchanged from the current situation. (2) Ground subsidence (e.g., due to peat oxidation and other processes) is included based on databases developed by Asselman et al. [58] and Van der Kraan [59]. (3) Three scenarios for seabed morphology (which influences wave-related load) were included, including a fixed seabed, a seabed rising with SLR, and a seabed evolution that follows observed trends [40]. (4) The closing level of the storm surge barriers was increased with SLR, keeping the closure frequency below 10/year.
Several aspects were carefully considered but not included in the modeling: (1) First, it was assumed that the consequences of flooding by SLR would remain roughly identical to the current impact to reduce the complexity of the numerical exercise. Although SLR leads to generally higher flood levels (increasing damage and casualties), flood defenses are designed to cope with relatively high water levels and wave action based on high tide levels combined with storm surge water levels which vary along the coast, ranging between 5 and 12 m above the mean (current) sea level. Flood safety designs prepared after 2009 are designed to cope with 1 m of SLR. (2) Second, SLR-induced changes in tidal amplitudes were not included. Although earlier modeling studies indicate that SLR may result in changes in tidal ranges (up to 0.15 m for an SLR of 2.6 m [60]), this effect is a relatively small fraction of the SLR increment and small compared to the impact of waves, (3) Third, it was assumed that frequencies of occurrence of wind events and resulting storm surges would not change with climate change [61]. However, the wave height will increase with SLR since wave conditions are depth-limited in general. More detail on all assumptions can be found in the technical background reports [62,63,64,65,66].

3.4. Assessment of Freshwater Availability Under SLR

Due to the considerable differences between salinization processes in different water systems, a combination of models was used to assess the impacts of SLR on freshwater resources: a nationwide groundwater flow model, different surface water models and a nationwide water balance model. The different variables used in the exploratory modeling are summarized in Table 2. The national integrated freshwater resources model [67] was deemed unsuitable for the current assessment due to data limitations and because salinization is not included. Moreover, the model would require the assessment of many parameters, highly uncertain under extreme climate conditions, and would require fully consistent hydro-meteorological forcing, which hampers sensitivity analysis for extreme SLR. Lastly, its extensive runtimes also make it ill suited for an exploratory modeling approach.

3.4.1. Groundwater Salinization

SLR impacts on groundwater were simulated with a high-resolution groundwater flow and salt transport model [24,68]. The model comprises a variable-density groundwater flow and salt transport. The impact of SLR is superimposed over ongoing groundwater salinization induced by land reclaiming projects in the past six centuries and the effects of historic and future land subsidence. In order to simulate this adequately, a transient scenario simulation was set up using a baseline scenario of moderate speed sea level rise (scenario “Modest”, SSP2.45). The groundwater model was used to simulate the increase in saline seepage (or salt load) to the surface water systems in reclaimed land. The increase in salt load was subsequently used to assess the increasing freshwater flushing rates required to meet salinity criteria.

3.4.2. Surface Water Salinization

The surface water bodies of the Rhine–Meuse Estuary (RME) are characterized by a high salinity gradient that required a detailed 3D hydrodynamic model setup in the D-Hydro software release 2022.01 [69]. In dynamic systems like the RME, the influence of the tidal cycle on SLR-induced seawater intrusion cannot be ignored and was therefore included in the simulations [70]. Storm surges can cause transient salinization events, but because of the relatively short duration of such events, these were not included in the simulations (unlike the simulations for flood safety). More critical for freshwater availability and salinization are long-term periods of drought with low river flows. In order to explore the sensitivity of freshwater intakes in the RME, the simulations were performed with river flows of 2000 m3/s (representative of summer average flows), 1000 m3/s (representative of current dry summers) and 500 m3/s (representative of low flows under future climate). The 500 m3/s scenario was included based on climate predictions for the Rhine showing that 7-day low flows can be between 10% and 30% lower than current 7-day low flows [29]. During the 2018 and 2022 summers, Rhine discharge was below 700 m3/s, which, combined with the Buitink et al. [29] simulations, makes a 500 m3/s scenario in 2100 plausible. Based on the above considerations, a model setup based on semi-steady-state simulations with a tidal cycle around a stationary mean sea level and a stationary freshwater inflow was found to be sufficient. For these simulations, an existing 3D hydrostatic model of the RME developed by Van der Kaaij [71] that was further adapted to include SLR was used. Further details on the model implementation are provided by Coonen et al. [72].
The other main freshwater systems in the Netherlands (Lake IJssel and Lake Volkerak-Zoom) are closed off from the sea by dams that limit salinization. Salt intrusion, however, still occurs via groundwater, and more importantly through ship locks. This type of saltwater intrusion is characterized by a semi-stationary horizontal salt gradient (without a substantial vertical salinity gradient). This gradient is largely controlled by river water inflow, water demand and saltwater leakage at locks. Saltwater can migrate further upstream due to wind-induced mixing. These systems are less dynamic than the tidally influenced RME, and simpler 1-dimensional box models based on an advection–dispersion equation were found sufficient, building upon the concepts developed by Nolte et al. [73] and Bonte and Zwolsman (2010). The systems are considered vertically mixed, and compartments are defined in the longitudinal direction to describe the horizontal gradient. A dispersion coefficient is defined as a calibration parameter in order to mimic the response of the salinity gradient to present-day situations [27,74]. The dispersion coefficient was chosen mostly independent of SLR and other climate effects. Details of the models for Lake IJssel and Lake Volkerak-Zoom can be found in the work of Boelens et al. [75] and Van der Heijden [76], respectively. This quasi-steady-state approach enables a systematic and relatively quick exploration of both climate sensitivity and various policy measures for all compartments of the surface water system.

4. Results

4.1. Flood Protection

4.1.1. Sand Nourishments of ‘Soft’ Flood Defenses

The model results show that it is technically feasible to maintain the current shoreline for the majority of the coastline and maintain the current level of flood hazard protection (expressed as a probability of flooding or dike failure), even with extreme levels of SLR of up to 3 m. Additional strengthening is, however, required in built-up areas and cities situated in the dune area where constructions prevent the growth of dunes.
The sand balance simulations show that cumulative nourishment volumes will increase with a factor of 1.5 to 3 for a 1 m SLR, and with a factor of 3 to 6 for an SLR of 5 m, compared to a scenario with no SLR (Figure 5). These estimates have a considerable degree of uncertainty, which is related to uncertainties in the rate of SLR, the evolution of natural morphological processes in the North Sea due to SLR, in particular the development of the active coastal zone, and policy choices on nourishments. When compared to the sediment available for extraction in the North Sea, it was found that the current legislation and regulations will result in a shortage of sediment. Especially near the Wadden Islands and the estuarine coast of Zeeland, more sediment will be needed than what is currently available in appointed (or ‘reserved’) zones for sand mining. Therefore, regulations regarding spatial reservations, unexploded ammunitions and mining depths should be changed to keep the feasibility of the nourishment strategy of the Netherlands.
Although there is a large degree of uncertainty, maintaining the ‘soft’ dune flood defenses has several advantages when compared to ‘hard’ flood defenses. One of the main advantages is that the sand nourishment strategy is relatively flexible and can be relatively easily adjusted to the rate of SLR. Additionally, sand nourishments leverage the natural geomorphological coastal processes that allow very local sand nourishments to be subsequently distributed along the coastline by natural processes [77].

4.1.2. Flood Safety of ‘Hard’ Flood Defenses

The simulations show that the required heightening and strengthening of dikes vary considerably (Figure 6). For an SLR of 3 m, dike segments that require heightening exceeding 5 m are found in the north of the Netherlands, decreasing to values between 1 and 4 m in the middle and south of the country, and gradually decreasing further inward along the Rhine and Meuse. Dike heightening exceeds the degree of SLR in areas where wave run-up is significant and wave growth is depth-limited, such as the northern Wadden Sea and the Western Scheldt. For instance, model results indicate that an increase of 7 m may be necessary in some places in the north of the country for an SLR of 3 m, of which about 5 m can be attributed to SLR, the remainder being due to the increased wave load (higher water heights mean that higher waves arrive at the dike; they are no longer attenuated by the foreshore). A recent wave modeling study shows that SLR not only increases the water depth therefore leading to higher waves, but also significantly increases the wave setup and decreases the bottom friction [78]. Morphologic growth of the seabed has a slight positive effect, with required dike heightening being generally about 1 m less than a scenario without seabed growth. Vegetation on the immediate foreshore (in coastal areas) has no significant impact on dike height but works positively on the stability of a steep sloping foreshore against erosion [79]. This is important since these steep foreshores have a major impact on the wave run-up and the wave impact on stone revetments (e.g., [80]).
Further inland along the Rhine and Meuse rivers, the influence of SLR gradually diminishes. However, the strengthening of the dikes remains necessary because of other effects such as soil subsidence and changes in peak river discharges. In these areas, the required increase in dike height is always smaller than SLR. Former sea dikes can cope with some level of SLR before they need to be strengthened again for higher SLR, since they were first robustly reinforced (1960–1980) before being (partially) closed off.
As the sea level rises, the closure frequency of storm barriers increases if their closure level remains fixed. Eventually, the closure level can be reached at almost each high water, thereby making the concept of a barrier irrelevant. Storm barriers are designed to close only for very strong storms (which occur rarely), to accommodate for other usages (shipping for the Europoort barriers, nature for the Eastern Scheldt barrier). For example, the closure frequency for the Europoort barrier is currently statistically once in 18 years and increases to every tidal cycle at 3 m SLR. In order to keep the closure frequency low enough, the closure level needs to increase with SLR. If the Europoort barrier closure level increases by 1.25 m under 2 m SLR, the closure frequency will become once per year. In that case, storm barriers still effectively close for extreme water levels corresponding to legal dike norms. However, the rising of the closure levels renders outer embankments more flood-prone. For areas protected by the combination of a storm surge barrier and dikes, the required increase in dike height is roughly equal to SLR. For most dike segments, the dike height is hardly affected by the closure level of the storm surge barrier since the closure level is still (much) lower than the critical seawater levels that comply with the legal safety norms of the dikes.
Although flood protection can be maintained at current safety levels through dike heightening, piping and stability berms, and strengthening of revetments, the implications for land use are considerable due to the space required for dike reinforcements. The footprint (width) of a dike increases by up to 90 m per meter of dike heightening, which can be difficult to achieve in densely built-up areas. Additionally, built-up areas located between dikes and open water (on relatively high areas of the floodplain) will be subject to more frequent flooding and increasing water depth. The cost analyses showed that the total cumulative nominal cost for 1 and 3 m SLR to maintain flood protection at the current safety level is around EUR 45 and 70 billion (up to 2200), respectively, compared to a baseline safety level in 2050. The total nominal annual costs are around EUR 0.3 and 0.5 billion per year, which is in the same order of magnitude as the currently estimated annual budget for flood protection for the period 2023–2050, thereby showing that maintaining adequate flood protection is financially achievable.

4.2. Freshwater Availability

4.2.1. Groundwater Salinization

Many parts of the western half of the country already experience salinization of soil and groundwater due to the seepage of brackish groundwater. This seepage is a result of the geologic past and human intervention such as land reclamation [81]. The modeling results show that seepage rates are expected to increase with SLR. The increasing seepage results in increasing salt loads from groundwater to surface water in a zone of up to 20 km from the coastline. Directly behind the coastline, the current salt loads range between 100 and 10,000 kg/ha/year (Figure 7a). This increases with values up to 10,000 kg/ha/year for 3 m SLR (Figure 7c). Generally, the highest increases are observed in areas that currently also experience high salt loads (Figure 7c). Salinization of surface water is mitigated by flushing with freshwater sourced from the rivers Rhine and Meuse. The required flushing volume in polder areas varies considerably geographically (Figure 8a and Figure 8b for SLR of 1 and 3 m, respectively). Interestingly, there are also polder areas where flushing water demands decrease with SLR, or initially increase (at 1 m SLR) and then decrease (at 3 m SLR). This is the result of autonomous freshening of groundwater in certain areas and slow response in groundwater due to historic changes in water management (which can take up to centuries). The total flushing water demand, however, increases at a higher rate than the salt load itself: about 4.5-fold by 1 m SLR, about 14-fold by 3 m SLR (Figure 8c). The factor by which flushing increases depends on the allowed maximum salt levels in surface waters. The freshwater flushing calculations assumed that concentrations are not allowed to increase beyond currently acceptable concentrations. If salt levels in surface waters are allowed to increase, lower flushing volumes are required. This shows there is a close trade-off between accepting a certain degree of salinization and freshwater availability.

4.2.2. Salinization of Surface Water Systems

In the open Rhine–Meuse Estuary, SLR leads to a change in the balance between sea-level-induced pressure and river-discharge-driven counterpressure on the salt gradient (Figure 9). This causes a shift in the position of the transition zone between freshwater and saltwater landwards with 2 to 5 km per meter SLR for a given discharge-driven counterpressure. Keeping the transition zone between freshwater and saltwater at the same position under SLR requires higher river discharges. A 1 m increase in SLR requires about 500 m3/s river discharge to keep the transition zone at the same location. This essentially aggravates the sensitivity of the system to low discharge conditions, in line with sensitivity relations such as those presented by Ralston [82] and data and model analyses reported by Dijkstra et al. [83] and Van den Brink et al. [26].
The modeling for the lakes and canals (the strategic freshwater reservoirs) indicates that salt intrusion through shipping locks is the largest salinization pressure, in contrast to the contribution of groundwater seepage. This salt pressure may be reduced through specific measures at locks [28]. Interestingly, the salt intrusion through shipping locks is determined primarily by the dimensions of the shipping lock, followed by the intensity of ship passages, with SLR playing a somewhat smaller role. In other words, socioeconomic factors are more determining for salt intrusion in these reservoirs than SLR.
As salt intrusion increases, the required flushing increases substantially, putting an additional demand on freshwater resources. With all these factors combined, continuing the current practice under SLR would result in a significant increase in the quantity of freshwater required for the flushing of polder areas and other water systems and mitigating saltwater intrusion in rivers. As climate change is expected to also result in warmer and drier summers with increased evaporation and lower freshwater inflow, it is quite evident that the amount of freshwater required for flushing will be increasingly unavailable during dry summers. The pressure on the national water balance due to flushing may in theory be alleviated by accepting higher chloride levels. This would, however, potentially impact agricultural productivity, drinking water production and freshwater ecosystems.

5. Discussion

The time frame over which an SLR of up to 3 m may occur extends over several centuries. This raises the question of whether the current study can provide sufficiently plausible results for testing the strategies for flood defense and freshwater availability, considering the time frame of several centuries, changes in land use and associated deep uncertainty: Are the results sufficiently accurate to initiate a social and political debate? We approached this dilemma by exploring a wide range of conditions to account for the many uncertainties and yet remain detailed and robust enough to provide quantitative information, consistent with the exploratory modeling approaches for policy making under deep uncertainty [20,33].
Throughout the whole process of defining the modeling strategy, choosing the models and analyzing the results, several safeguards have been organized to try to mitigate bias. The first safeguard was the use of models that mostly rely on numerically resolving the physical laws of conservation of mass and momentum. The models fall into two categories: The first category includes operational models that have been used on a regular basis to simulate present-day situations, in regular, intermediate (up to approximately 1 per 100 years) and more extreme conditions. The performance of these models under regular and intermediate conditions is relatively well known, and users have a relatively high level of confidence in these models. The second category includes new models that were built specifically for this project and were validated using existing model output for moderate degrees of SLR before being applied to higher levels of SLR. These models are considered to exhibit enough sensitivity to changes in forcing conditions. As SLR increases, the level of confidence in the models may decrease, but the general agreement is that the models are reliable for SLRs of up to 2 or even 3 m.
The second and most important safeguard is the involvement of many experts with various backgrounds: The research team included about twenty experts who supported the process of identification of relevant research questions and setting up of the conceptual models. Once the results became available, more than 300 different experts with varying backgrounds were consulted to assess the plausibility of the results. Independent scientific committees of researchers from organizations (academia and engineering firms) not involved in the study were set up and asked to review the modeling strategy and main results [84,85]. Because of the deep uncertainty associated with the SLR of up to 3 m, we considered the involvement of experts from diverging backgrounds critical to assess the value of our modeling efforts: Which results can be considered plausible, and which results remain too uncertain? Our strategy of involving a wide range of experts aligns with the approach advocated by Melsen [86], who showed that a diversity of opinions, perspectives and approaches is crucial for assessing the robustness of modeling results.
Yet, several uncertainties and limitations remain, as not all assumptions are valid everywhere. A thorough review by the Dutch Expertise Netwerk for Water Safety (ENW) and the Dutch Expertise Netwerk for Fresh Water Availability (ENZD) identified areas where further work is required [84,85]. For instance, there may be locations where increased loads on dikes due to SLRs may disrupt the stability of clay layers due to hydraulic heave. This has not yet been considered in the approach because we assumed that dikes would fail by other mechanisms before heave could result in the failure of clay layers. This is definitely a valid point of criticism that may locally lead to other conclusions than the ones presented thus far. Another uncertainty that requires further attention is whether storm surge barriers have sufficient structural strength to meet the increasing hydraulic loads under sea level rise. The latter was not considered in this study as the financial consequences of strengthening a storm surge barrier were considered far less material than those of nationwide dike reinforcements. Additionally, overtopping of storm surge barriers with increasing SLR may necessitate replacement or other measures to be implemented before the technical life span. In addition to these specific technical aspects, the ENW noted that although the results showed that flood protection levels can technically be maintained on a national scale, the required measures may be locally or regionally unacceptable by society. The review of the freshwater assessment by ENZD [77] highlighted that the models applied are considered to be fairly reliable, but also provided several observations that highlighted the limitations of the freshwater assessment. A primary finding was that for freshwater, the future developments in the Rhine are highly important to counter the effects of SLR. Another limitation was that our work did not assess morphological changes in the river system, nor did it include an assessment of potential impacts of future land use. Both will have major impacts on freshwater availability and freshwater demand.
Overall, the reviews highlight that the longevity of the current strategies depends on more than just technical feasibility. Examples of other aspects include ecological and biodiversity impact, use of energy and resources, intrinsic vulnerability, etc. The Sea Level Rise Knowledge Programme will continue, and some of these uncertainties will be investigated in the near future in order to further improve and refine the results obtained so far.
The goal of our modeling effort was to provide quantitative information to assess whether the strategies for flood protection and freshwater availability of the Dutch Delta Programme can be maintained. A range in the uncertainty of the results is acceptable given the far future where the calculated effects will occur, and also considering other climate pressures on the Dutch water system [87]. Further refinements will be investigated in the future before measures are decided upon, specifically within the Dutch Delta Programme with its 6-year cycle of Plan, Do, Check, Act.

6. Conclusions and Outlook

The approach presented in this article has led to the first quantitative, nationwide assessment of the influence of SLR on the Netherlands. The modeling results show that SLR will require higher flood defenses throughout the country. The required increase in dike height is generally at least as high as SLR with clear exceptions in the estuaries. The results further show no hydraulic tipping points in the flood defense strategy, and the current degree of flood protection can be technically and financially met for up to 3 m of SLR. Maintaining these strategies comes with considerable effort. Firstly, maintaining this degree of safety against floods requires considerable spatial allocations to maintain and periodically upgrade dikes, levees, etc., that are often located in densely populated urban areas. Secondly, meeting the volume of sand required for coastal nourishments will be challenging due to the presence of current spatial allocations at the North Sea for other functions (wind energy, shipping) and explosive remnants of war. Third, an acceleration in the rate of SLR may impact the overall feasibility of maintaining flood defenses as the availability of human resources and materials may become a limiting factor. These aspects will be investigated further in the next phase of the knowledge program.
The freshwater water systems were found to be vulnerable to SLR and the resulting salinization. Initially, they can be kept fresh by increasing the flushing with fresh river water. However, from 2 to 3 m SLR, there will come a point when there will be insufficient river water to keep both surface water systems and polders fresh. A parallel activity in our research program consists of assessing the impacts of SLR on a much wider range of areas: financial cost, biodiversity and impacts on different economic sectors. This is done both for the direct impact of SLR and for potential adaptation measures.
The modeling results discussed in the paper will feed the policy-making process over the coming years to counter the effects of SLR. The results presented here provide an overview of the longevity of flood protection and freshwater strategies and which short-term decisions will have to be made, for example, on dike reinforcement or water diversions. Follow-up work includes an assessment of measures for extending the longevity of the flood safety and freshwater availability strategies. This includes measures such as additional water storage for both flood protection and water availability, additional storm surge barriers in the Rhine–Meuse Estuary, and land use changes that can tolerate higher salinity to reduce the freshwater requirement to counter salinization.
These results will be combined with long-term adaptation scenarios for the Netherlands, which can be divided roughly into ‘retreat/accommodate’ options or ‘protect’ options to assess options at 3 to 5 m SLR. The combination of our quantitative assessment of the longevity of strategies and long-term adaptation options will be used to develop adaptation pathways [18,88]. These provide an overview of the relationship between near-term decisions and long-term adaptation options, which also helps in identifying low-regret short-term decisions while preserving options in an uncertain future [18]. The results presented here will ultimately find their way into Dutch water policy following the structured approach of Adaptive Delta Management [20,89]. This involves further technical, socioeconomic, ecological and cost–benefit investigations to assess which measures and innovative solutions are fit-for-purpose in the near future while keeping options open for future adaptation.

Author Contributions

Conceptualization, S.v.G., R.W., Q.L. and M.B. (Meinte Blaas); methodology, Y.F., M.B. (Meinte Blaas), R.W. and Q.L.; software, Y.F., M.B. (Meinte Blaas), R.W. and Q.L.; validation, Y.F., M.B. (Meinte Blaas), R.W. and Q.L.; formal analysis, Y.F., M.B. (Meinte Blaas), R.W., Q.L., L.B., R.S., R.V. and M.B. (Matthijs Bonte); investigation, Y.F., M.B. (Meinte Blaas), R.W., Q.L., L.B., R.S., R.V. and M.B. (Matthijs Bonte); resources, S.v.G.; data curation, Y.F.; writing—original draft preparation, Y.F., M.B. (Matthijs Bonte), M.B. (Meinte Blaas), Q.L., R.S., R.V. and S.v.G.; writing—review and editing, M.B. (Matthijs Bonte) and S.v.G.; visualization, M.B. (Matthijs Bonte); supervision, S.v.G.; project administration, S.v.G.; funding acquisition, S.v.G. All authors have read and agreed to the published version of the manuscript.

Funding

This research was funded by the Ministry of Infrastructure and Water Management, The Netherlands.

Data Availability Statement

The model results shown in Figure 6, Figure 7, Figure 8 and Figure 9 are available as downloadable GIS files or a GIS webserver via www.klimaateffectatlas.nl. Accessed on 16 March 2025.

Acknowledgments

We acknowledge the support of the following colleagues, consultants and researchers during the research program: Marit Zethof, Jan Stijnen, Bastiaan Kuijper, Cees Oerlemand, David Knops of HKV; Maarten Jansen, Tim van Engelen, Bert van den Berg of Witteveen+Bos, Joost Delsman, Marcel Taal, Ilja America, Arno Nolte, Ymkje Huismans, Otto Weiler, Arnout Bijlsma, Bennie Minnema, Tobias Mulder, Ellen Quataert, Ad van der Spek, Bas Huisman, Edwin Elias, Zheng Bing Wang, Nienke Vermeer of Deltares; Maarten Spijker, Simon Muurman, Ruben Boelens, Meike Coonen, Jip Grootveld of Hydrologic; Michiel van Reen, Sanne van der Heijden, Jos van der Baan, Jelmer Cleveringa of Arcadis. We also thank the many experts that have been consulted throughout this research. We finally thank Annemiek Roeling of the Ministry of Infrastructure and Water Management for her valuable comments on the draft manuscript. This work has been funded by the Dutch Ministry of Infrastructure and Water Management. We also thank the three anonymous reviewers.

Conflicts of Interest

The authors declare no conflicts of interest.

Abbreviations

The following abbreviations are used in this manuscript:
SLRSea Level Rise
ENWDutch Expertise Netwerk for Water (Flood) Safety
GMSLGlobal Mean Sea Level
DMDUDecision Making under Deep Uncertainty
DPSIRDrivers, Pressures, State, Impact, and Response
KNMIRoyal Netherlands Meteorological Institute
RCPRepresentative Concentration Pathway
SSPShared Socioeconomic Pathway
RMERhine–Meuse Estuary

References

  1. Pieterse, N.; Knoop, J.; Nabielek, K.; Pols, L.; Tennekes, J. Overstromingsrisicozonering in Nederland; PBL Netherlands Environmental Assessment Agency: The Hague, The Netherlands, 2009. [Google Scholar]
  2. IPCC. The Ocean and Cryosphere in a Changing Climate: Special Report of the Intergovernmental Panel on Climate Change, 1st ed.; Cambridge University Press: Cambridge, UK, 2022; ISBN 978-1-009-15796-4. [Google Scholar]
  3. Stolte, W.; Baart, F.; Muis, S.; Hijma, M.; Taal, M.; Le Bars, D.; Drijfhout, S. Zeespiegelmonitor 2022; Deltares: Delft, The Netherlands, 2023. [Google Scholar]
  4. Van Dorland, R.; Beersma, J.; Bessembinder, J.; Bloemendaal, N.; Drijfhout, S.; Groenland, R.; Haarsma, R.; Homan, C.; Keizer, I.; Krikken, F.; et al. KNMI National Climate Scenarios 2023 for the Netherlands—Version 2; KNMI: De Bilt, The Netherlands, 2024; p. 374. [Google Scholar]
  5. ENW. Fundamentals of Flood Protection; Ministry of Infrastructure and the Environment: Hague, The Netherlands, 2017; ISBN 978-90-8902-160-1. [Google Scholar]
  6. Ministry of Infrastructure and Water Management Now for the Future—National Delta Program 2024; Ministry of Infrastructure and Water Management: Hague, The Netherlands, 2023.
  7. Ten Brinke, W.B.M.; Bannink, B.A.; Ligtvoet, W. The Evaluation of Flood Risk Policy in the Netherlands. Proc. Inst. Civ. Eng.—Water Manag. 2008, 161, 181–188. [Google Scholar] [CrossRef]
  8. Slomp, R. Flood Risk and Water Management in the Netherlands—A 2012 Update; Rijkswaterstaat: Utrecht, The Netherlands, 2012. [Google Scholar]
  9. Haasnoot, M.; Kwadijk, J.; Alphen, J.; Le Bars, D.; Hurk, B.; Diermanse, F.; Van der Spek, A.; Oude Essink, G.; Delsman, J.; Mens, M. Adaptation to Uncertain Sea-Level Rise; How Uncertainty in Antarctic Mass-Loss Impacts the Coastal Adaptation Strategy of the Netherlands. Environ. Res. Lett. 2020, 15, 034007. [Google Scholar] [CrossRef]
  10. Hinkel, J.; Lincke, D.; Vafeidis, A.T.; Perrette, M.; Nicholls, R.J.; Tol, R.S.J.; Marzeion, B.; Fettweis, X.; Ionescu, C.; Levermann, A. Coastal Flood Damage and Adaptation Costs under 21st Century Sea-Level Rise. Proc. Natl. Acad. Sci. USA 2014, 111, 3292–3297. [Google Scholar] [CrossRef] [PubMed]
  11. Kwadijk, J.C.J.; Haasnoot, M.; Mulder, J.P.M.; Hoogvliet, M.M.C.; Jeuken, A.B.M.; van der Krogt, R.A.A.; van Oostrom, N.G.C.; Schelfhout, H.A.; van Velzen, E.H.; van Waveren, H.; et al. Using Adaptation Tipping Points to Prepare for Climate Change and Sea Level Rise: A Case Study in the Netherlands. Wires Clim. Change 2010, 1, 729–740. [Google Scholar] [CrossRef]
  12. Taherkhani, M.; Vitousek, S.; Barnard, P.L.; Frazer, N.; Anderson, T.R.; Fletcher, C.H. Sea-Level Rise Exponentially Increases Coastal Flood Frequency. Sci. Rep. 2020, 10, 6466. [Google Scholar] [CrossRef]
  13. Tol, R.S.J.; Bohn, M.; Downing, T.E.; Guillerminet, M.; Hizsnyik, E.; Kasperson, R.; Lonsdale, K.; Mays, C.; Nicholls, R.J.; Olsthoorn, A.A.; et al. Adaptation to Five Metres of Sea Level Rise. J. Risk Res. 2006, 9, 467–482. [Google Scholar] [CrossRef]
  14. Muccione, V.; Haasnoot, M.; Alexander, P.; Bednar-Friedl, B.; Biesbroek, R.; Georgopoulou, E.; Le Cozannet, G.; Schmidt, D.N. Adaptation Pathways for Effective Responses to Climate Change Risks. Wires Clim. Change 2024, 15, e883. [Google Scholar] [CrossRef]
  15. Koks, E.E.; Le Bars, D.; Essenfelder, A.H.; Nirandjan, S.; Sayers, P. The Impacts of Coastal Flooding and Sea Level Rise on Critical Infrastructure: A Novel Storyline Approach. Sustain. Resilient Infrastruct. 2023, 8, 237–261. [Google Scholar] [CrossRef]
  16. Ministry of Infrastructure and Water Management Kennisprogramma Zeespiegelstijging—Deltaprogramma. Available online: https://www.deltaprogramma.nl/kennisprogramma-zeespiegelstijging (accessed on 7 February 2025).
  17. van Alphen, J.; van der Biezen, S.; Bouw, M.; Hekman, A.; Kolen, B.; Steijn, R.; Zanting, H.A. Room for Sea-Level Rise: Conceptual Perspectives to Keep The Netherlands Safe and Livable in the Long Term as Sea Level Rises. Water 2025, 17, 437. [Google Scholar] [CrossRef]
  18. Van Alphen, J.; Haasnoot, M.; Diermanse, F. Uncertain Accelerated Sea-Level Rise, Potential Consequences, and Adaptive Strategies in The Netherlands. Water 2022, 14, 1527. [Google Scholar] [CrossRef]
  19. Zevenbergen, C.; Khan, S.A.; van Alphen, J.; Terwisscha van Scheltinga, C.; Veerbeek, W. Adaptive Delta Management: A Comparison between the Netherlands and Bangladesh Delta Program. Int. J. River Basin Manag. 2018, 16, 299–305. [Google Scholar] [CrossRef]
  20. Bloemen, P.J.; Hammer, F.; van der Vlist, M.J.; Grinwis, P.; van Alphen, J. DMDU into Practice: Adaptive Delta Management in the Netherlands. In Decision Making Under Deep Uncertainty: From Theory to Practice; Marchau, V.A.W.J., Walker, W.E., Bloemen, P.J., Popper, S.W., Eds.; Springer International Publishing: Cham, Switzerland, 2019; pp. 321–351. [Google Scholar]
  21. Van Der Wiel, K.; Beersma, J.; Van Den Brink, H.; Krikken, F.; Selten, F.; Severijns, C.; Sterl, A.; Van Meijgaard, E.; Reerink, T.; Van Dorland, R. KNMI’23 Climate Scenarios for the Netherlands: Storyline Scenarios of Regional Climate Change. Earth’s Future 2024, 12, e2023EF003983. [Google Scholar] [CrossRef]
  22. Lodder, Q.; Huismans, Y.; Elias, E.; de Looff, H.; Wang, Z.B. Future Sediment Exchange between the Dutch Wadden Sea and North Sea Coast-Insights Based on ASMITA Modelling. Ocean. Coast. Manag. 2022, 219, 106067. [Google Scholar]
  23. Brand, E.; Ramaekers, G.; Lodder, Q. Dutch Experience with Sand Nourishments for Dynamic Coastline Conservation—An Operational Overview. Ocean. Coast. Manag. 2022, 217, 106008. [Google Scholar] [CrossRef]
  24. Delsman, J.R.; Mulder, T.; Verastegui, B.R.; Bootsma, H.; Zitman, P.; Huizer, S.; Essink, G.H.O. Reproducible Construction of a High-Resolution National Variable-Density Groundwater Salinity Model for the Netherlands. Environ. Model. Softw. 2023, 164, 105683. [Google Scholar]
  25. Ministerie van Infrastructuur en Waterstaat. Strategiedocument Zoetwater Hoofdwatersysteem 2021—Publicatie—Deltaprogramma; Ministerie van Infrastructuur en Waterstaat: The Hague, The Netherlands, 2021. [Google Scholar]
  26. Van den Brink, M.; Huismans, Y.; Blaas, M.; Zwolsman, G. Climate Change Induced Salinization of Drinking Water Inlets along a Tidal Branch of the Rhine River: Impact Assessment and an Adaptive Strategy for Water Resources Management. Climate 2019, 7, 49. [Google Scholar] [CrossRef]
  27. Bonte, M.; Zwolsman, J.J.G. Climate Change Induced Salinisation of Artificial Lakes in the Netherlands and Consequences for Drinking Water Production. Water Res. 2010, 44, 4411–4424. [Google Scholar] [CrossRef]
  28. PIANC. Saltwater Intrusion in Inland Waterways; PIANC: Brussels, Belgium, 2021; ISBN 978-2-87223-014-3. [Google Scholar]
  29. Buitink, J.; Tsiokanos, A.; Geertsema, T.; ten Velden, C.; Bouaziz, L.; Weiland, F.S. Implications of the KNMI’23 Climate Scenarios for the Discharge of the Rhine and Meuse; Deltares: Delft, The Netherlands, 2023. [Google Scholar]
  30. IPCC. Climate Change 2022—Impacts, Adaptation and Vulnerability: Working Group II Contribution to the Sixth Assessment Report of the Intergovernmental Panel on Climate Change, 1st, ed.; Pörtner, H.-O., Roberts, D.C., Eds.; Cambridge University Press: Cambridge, UK, 2022; ISBN 978-1-009-32584-4. [Google Scholar]
  31. DeConto, R.M.; Pollard, D. Contribution of Antarctica to Past and Future Sea-Level Rise. Nature 2016, 531, 591–597. [Google Scholar] [CrossRef]
  32. Morlighem, M.; Goldberg, D.; Barnes, J.M.; Bassis, J.N.; Benn, D.I.; Crawford, A.J.; Gudmundsson, G.H.; Seroussi, H. The West Antarctic Ice Sheet May Not Be Vulnerable to Marine Ice Cliff Instability during the 21st Century. Sci. Adv. 2024, 10, eado7794. [Google Scholar] [CrossRef]
  33. Bankes, S. Exploratory Modeling for Policy Analysis. Oper. Res. 1993, 41, 435–449. [Google Scholar] [CrossRef]
  34. Marchau, V.A.W.J.; Walker, W.E.; Bloemen, P.J.T.M.; Popper, S.W. Introduction. In Decision Making Under Deep Uncertainty: From Theory to Practice; Marchau, V.A.W.J., Walker, W.E., Bloemen, P.J.T.M., Popper, S.W., Eds.; Springer International Publishing: Cham, Switzerland, 2019; pp. 1–20. ISBN 978-3-030-05252-2. [Google Scholar]
  35. Nolte, A.; Vergrouwen, S.; Legat, A.; Geurts, D. Vraagarticulatie en Aanzet Modelinstrumentarium voor het Kennisprogramma Zeespiegelstijging Spoor 2 Systeemverkenningen Zoetwater; Deltares: Delft, The Netherlands, 2021; p. 177. [Google Scholar]
  36. Beers, P.J.; Bots, P.W.G. Eliciting Conceptual Models to Support Interdisciplinary Research. J. Inf. Sci. 2009, 35, 259–278. [Google Scholar] [CrossRef]
  37. Vos, R. Time Lines for Track 2 of the Knowledge Program Sea Level Rise (in Dutch); Rijkswaterstaat: Lelystad, The Netherlands, 2021. [Google Scholar]
  38. Oppenheimer, M.; Glavovic, B.C.; Hinkel, J.; van de Wal, R.; Magnan, A.K.; Abd-Elgawad, A.; Cai, R.; Cifuentes-Jara, M.; DeConto, R.M.; Ghosh, T.; et al. Sea Level Rise and Implications for Low Lying Islands, Coasts and Communities Supplementary Material. In IPCC Special Report on the Ocean and Cryosphere in a Changing Climate; Pörtner, H.O., Roberts, D.C., Masson-Delmotte, V., Zhai, P., Tignor, M., Poloczanska, E., Mintenbeck, K., Alegría, A., Nicolai, M., Okem, A., et al., Eds.; Cambridge University Press: Cambridge, UK; New York, NY, USA, 2019; pp. 321–445. [Google Scholar]
  39. Rijkswaterstaat. Kustgenese 2.0: Kennis voor een veilige kust; Rijkswaterstaat: Hague, The Netherlands, 2020. [Google Scholar]
  40. Taal, M.; Quataert, E.; Van der Spek, A.; Huisman, B.; Elias, E.; Wang, S.; Vermeer, N. Eindrapport Fase 1 Zandige Kust: Sedimentbehoefte Nederlands Kustsysteem—Publicatie—Deltaprogramma; Rijkswaterstaat: Utrecht, The Netherlands; Deltares: Delft, The Netherlands, 2023. [Google Scholar]
  41. Wesselius, C.; Fujisaki, A. Landelijk SOBEK model in SOBEK 3 (LSM3); Deltares: Delft, The Netherlands, 2020. [Google Scholar]
  42. Schrijver, M.; Saman, K.; Lievense, P. Het Gebruik van Het Model Implic Bij Het Bepalen van de Prestatiepeilen; Rijkswaterstaat: Hague, The Netherlands, 2009. [Google Scholar]
  43. Gautier, C.; Groeneweg, J. Achtergrondrapportage HR2011 voor zee en Estuaria; Deltares: Delft, The Netherlands, 2019. [Google Scholar]
  44. Bretschneider, C.L. Generation of Waves by Wind: State of the Art; National Engineering Science Company: Islamabad, Pakistan, 1964. [Google Scholar]
  45. Anonymous SWAN–User Manual, SWAN Cycle III, Version 41.20 AB. Available online: https://swanmodel.sourceforge.io/online_doc/swanuse/swanuse.html (accessed on 16 March 2025).
  46. Holthuijsen, L.H. Waves in Oceanic and Coastal Waters; Cambridge University Press: Cambridge, UK, 2010. [Google Scholar]
  47. Roscoe, K. Assessment of the Still-Water-Level 1/10,000 Years Return Values Used in the Current Hydraulic Boundary Conditions; Deltares: Delft, The Netherlands, 2009. [Google Scholar]
  48. Geerse, C.P.M.; Duits, M.T.; Kalk, H.J.; Lammers, I.B.M. Wind-Waterstandstatistiek Hoek van Holland; HKV en Rijkswaterstaat: Lelystad, The Netherlands, 2002. [Google Scholar]
  49. Caires, S. Extreme Wind Statistics for the Hydraulic Boundary Conditions for the Dutch Primary Water Defences. SBW-Belastingen: Phase 2 of Subproject ‘Wind Modelling’; Deltares: Delft, The Netherlands, 2009; p. 1200264-005. [Google Scholar]
  50. Duits, M. Hydra-NL Voor Kennisprogramma Zeespiegelstijging. Testrapport—Versie 2.8.1; HKV: Lelystad, The Netherlands, 2021. [Google Scholar]
  51. Geerse, C.P. Hydra-Zoet for the Fresh Water Systems in the Netherlands-Probabilistic Model for the Assessment of Dike Heights. In PR2168 HKV Rapport voor Rijkswaterstaat, Waterdienst; HKV: Lelystad, The Netherlands, 2011. [Google Scholar]
  52. Deltares. Riskeer; Deltares: Delft, The Netherlands, 2023. [Google Scholar]
  53. Jongejan, R.B.; Maaskant, B. Applications of VNK2, a Fully Probabilistic Risk Analysis for All Major Levee Systems in The Netherlands. In Comprehensive Flood Risk Management: Research for Policy and Practice; Schweckendiek, T., Klijn, F., Eds.; Taylor & Francis Group: Abingdon, UK, 2013; pp. 693–700. ISBN 978-0-415-62144-1. [Google Scholar]
  54. Informatiehuis Water Waterveiligheidsportaal. Available online: https://waterveiligheidsportaal.nl/home#!/home (accessed on 11 March 2025).
  55. Kolen, B.; Capsers, J.; Pol, J. Actualisatie OKADER; HKV: Lelystad, The Netherlands, 2021. [Google Scholar]
  56. Hegnauer, M. Statistiek Extreme Hoogwaters Rijn en Maas op Basis van Geschaalde KNMI14 Scenario’s; Deltares: Delft, The Netherlands, 2020. [Google Scholar]
  57. Pall, P.; Allen, M.R.; Stone, D.A. Testing the Clausius–Clapeyron Constraint on Changes in Extreme Precipitation under CO2 Warming. Clim. Dyn. 2007, 28, 351–363. [Google Scholar] [CrossRef]
  58. Asselman, A.; Levelt, O.; Van der Kraan, A. Bodemdaling in Het Rivierengebied. Technische Analyses Voor DPR. Versie 2.; Deltares: Delft, The Netherlands, 2014. [Google Scholar]
  59. Van der Kraan, A. Zettingsverwachting Primaire Waterkeringen. Achtergrondplaatje van NAM/RWS. Zettingsverwachting Geschat Op Basis van Metingen (HHSK), Ervaring/Metingen (WSHD En WSRL) En de Gegevens Uit Het Achtergrondplaatje (Overige Waterschappen); Deltares: Delft, The Netherlands, 2011. [Google Scholar]
  60. Röbke, B.R.; Elmilady, H.; Van der Wegen, M.; Taal, M.D. Long-Term Morphological Response to Sea Level Rise and Different Sediment Strategies in the Western Scheldt Estuary (The Netherlands)|Deltares; Deltares: Delft, The Netherlands, 2020. [Google Scholar]
  61. Sterl, A.; Bakker, A.M.R.; van den Brink, H.W.; Haarsma, R.; Stepek, A.; Wijnant, I.L.; Winter, R.C. de Large-Scale Winds in the Southern North Sea Region: The Wind Part of the KNMI’14 Climate Change Scenarios. Environ. Res. Lett. 2015, 10, 035004. [Google Scholar] [CrossRef]
  62. Zethof, M.; Stijnen, J.; Kuijper, B.; Knops, D.; Van Den Berg, B. Systeemanalyse Waterveiligheid—Deelrapport Rijn-Maasmonding En Rivierengebied; HKV: Lelystad, The Netherlands; Rijkswaterstaat: The Hague, The Netherlands, 2023. [Google Scholar]
  63. Zethof, M.; Stijnen, J.; Kuijper, B.; Oerlemans, C.; Jansen, M.; Van Engelen, T.; Knops, D.; Van Den Berg, B. Systeemanalyse waterveiligheid Zuidwestelijke Delta—KP ZSS—Publicatie—Deltaprogramma; HKV: Lelystad, The Netherlands; Rijkswaterstaat: The Hague, The Netherlands, 2023. [Google Scholar]
  64. Zethof, M.; Jansen, M.; Van Engelen, T.; Knops, D.; Stijnen, J.; Van Den Berg, B. Systeemanalyse Waterveiligheid Waddenzee en Eems-Dollard—KP ZSS—Publicatie—Deltaprogramma; HKV: Lelystad, The Netherlands; Rijkswaterstaat: The Hague, The Netherlands, 2023. [Google Scholar]
  65. Zethof, M.; Jansen, M.; Van Den Berg, B.; Knops, D.; Stijnen, J. Systeemanalyse waterveiligheid Harde waterkeringen kust—KP ZSS—Publicatie—Deltaprogramma; HKV: Lelystad, The Netherlands; Rijkswaterstaat: The Hague, The Netherlands, 2023. [Google Scholar]
  66. Zethof, M.; Stijnen, J. Systeemanalyse Waterveiligheid Bovenregionale Synthese—KPZSS—Publicatie—Deltaprogramma; HKV: Lelystad, The Netherlands; Rijkswaterstaat: The Hague, The Netherlands, 2023. [Google Scholar]
  67. Mens, M.; Minnema, B.; Overmars, K.; van den Hurk, B. Dilemmas in Developing Models for Long-Term Drought Risk Management: The Case of the National Water Model of the Netherlands. Environ. Model. Softw. 2021, 143, 105100. [Google Scholar] [CrossRef]
  68. Delsman, J.; America, I.; Mulder, T. Kennisprogramma Zeespiegelstijging, Spoor II: Grondwaterverzilting En Watervraag Bij Een Stijgende Zeespiegel; Deltares: Utrecht, The Netherlands, 2022. [Google Scholar]
  69. Deltares Specificaties Zesde-Generatie Modellen Met D-HYDRO; Deltares: Delft, The Netherlands, 2019.
  70. Matsoukis, C.; Amoudry, L.O.; Bricheno, L.; Leonardi, N. Numerical Investigation of River Discharge and Tidal Variation Impact on Salinity Intrusion in a Generic River Delta Through Idealized Modelling. Estuaries Coasts 2023, 46, 57–83. [Google Scholar] [CrossRef]
  71. Van der Kaaij, T.; Chavarrias, V.; Kranenburg, W. RMM 3D, een Nieuw 3D Model van de RijnMaasMonding in D-HYDRO; Deltares: Delft, The Netherlands, 2022. [Google Scholar]
  72. Coonen, M.; Muurman, S.; Spijker, M.; Van Der Baan, J.; Van Reen, M. Kennisprogramma Zeespiegelstijging, Spoor II: Systeemanalyses Zoetwater Regio Rijn-Maasmonding; Arcadis: Amsterdam, The Netherlands; Hydrologic: Amersfoort, The Netherlands, 2023. [Google Scholar]
  73. Nolte, A.; Weeber, M.; Geurts, D.; Pans, S.; Vreeken, D.; Weiler, O. Klimaatrobuustheid van het Waterbeheer van het Volkerak-Zoommeer; Deltares: Delft, The Netherlands, 2020. [Google Scholar]
  74. Leenen, J.D. Wind Induced Diffusion in a Shallow Lake, a Case Study. Hydrobiol. Bull. 1982, 16, 231–240. [Google Scholar] [CrossRef]
  75. Boelens, R.; Spijker, M.; Van Der Heijden, S.; Van Reen, M. Kennisprogramma Zeespiegelstijging, Spoor II Systeemanalyses Zoetwater Regio IJsselmeer—Markermeer; Arcadis: Amsterdam, The Netherlands; Hydrologic: Amersfoort, The Netherlands, 2023. [Google Scholar]
  76. Van Der Heijden, S.; Van Der Baan, J.; Van Reen, M. Kennisprogramma Zeespiegelstijging, Spoor II: Systeemanalyses Zoetwater Regio Volkerak-Zoommeer; Arcadis: Amsterdam, The Netherlands; Hydrologic: Amersfoort, The Netherlands, 2023. [Google Scholar]
  77. van Slobbe, E.; de Vriend, H.J.; Aarninkhof, S.; Lulofs, K.; de Vries, M.; Dircke, P. Building with Nature: In Search of Resilient Storm Surge Protection Strategies. Nat. Hazards 2013, 66, 1461–1480. [Google Scholar] [CrossRef]
  78. Rijnsdorp, D.P.; van Rooijen, A.; Reniers, A.; Tissier, M.; de Wit, F.; Zijlema, M. Including the Effect of Depth-Uniform Ambient Currents on Waves in a Non-Hydrostatic Wave-Flow Model. Coast. Eng. 2024, 187, 104420. [Google Scholar] [CrossRef]
  79. Vuik, V. Building Safety with Nature: Salt Marshes for Flood Risk Reduction; Delft University of Technology: Delft, The Netherlands, 2019. [Google Scholar]
  80. Willemsen, P.W.J.M.; Borsje, B.W.; Vuik, V.; Bouma, T.J.; Hulscher, S.J.M.H. Field-Based Decadal Wave Attenuating Capacity of Combined Tidal Flats and Salt Marshes. Coast. Eng. 2020, 156, 103628. [Google Scholar] [CrossRef]
  81. Post, V.E.A. Groundwater Salinization Processes in the Coastal Area of the Netherlands Due to Transgressions during the Holocene; Vrije Universiteit Amsterdam: Amsterdam, The Netherlands, 2004. [Google Scholar]
  82. Ralston, D.K.; Geyer, W.R.; Lerczak, J.A. Subtidal Salinity and Velocity in the Hudson River Estuary: Observations and Modeling. J. Phys. Oceanogr. 2008, 38, 753–770. [Google Scholar] [CrossRef]
  83. Dijkstra, Y.M.; Schuttelaars, H.M.; Kranenburg, W.M. Salt Transport Regimes Caused by Tidal and Subtidal Processes in Narrow Estuaries. J. Geophys. Res. Ocean 2022, 127, e2021JC018391. [Google Scholar] [CrossRef]
  84. ENW. Advies Tussenbalans Kennisprogramma Zeespiegelstijging; Expertise Netwerk Waterveiligheid: Utrecht, The Netherlands, 2023. [Google Scholar]
  85. ENZD. Kennisprogramma Zeespiegelstijging; Expertise Netwerk Zoetwater en Droogte: Utrecht, The Netherlands, 2024. [Google Scholar]
  86. Melsen, L.A. It Takes a Village to Run a Model—The Social Practices of Hydrological Modeling. Water Resour. Res. 2022, 58, e2021WR030600. [Google Scholar] [CrossRef]
  87. Bartholomeus, R.P.; van der Wiel, K.; van Loon, A.F.; van Huijgevoort, M.H.J.; van Vliet, M.T.H.; Mens, M.; Geffen, S.M.; Wanders, N.; Pot, W. Managing Water across the Flood–Drought Spectrum: Experiences from and Challenges for the Netherlands. Camb. Prism. Water 2023, 1, e2. [Google Scholar] [CrossRef]
  88. Haasnoot, M.; Brown, S.; Scussolini, P.; Jimenez, J.A.; Vafeidis, A.T.; Nicholls, R.J. Generic Adaptation Pathways for Coastal Archetypes under Uncertain Sea-Level Rise. Environ. Res. Commun. 2019, 1, 071006. [Google Scholar] [CrossRef]
  89. Gersonius, B.; Rijke, J.; Ashley, R.; Bloemen, P.; Kelder, E.; Zevenbergen, C. Adaptive Delta Management for Flood Risk and Resilience in Dordrecht, The Netherlands. Nat. Hazards 2016, 82, 201–216. [Google Scholar] [CrossRef]
Figure 1. Key research questions for the national Sea Level Rise Knowledge Programme.
Water 17 00919 g001
Figure 2. Map of the Netherlands showing the main components of the flood protection (a) and fresh water (b) strategies: Colored lines: trajectories for primary flood defenses (dunes, levees, dikes, storm-surge barriers and dams). The color indicates the flood safety level expressed as the tolerable chance of flooding/failure in events per year. Dark blue: main surface water system comprising the main rivers and lakes that serve as freshwater reservoirs and supply water to low-lying polder areas in the current situation (indicated by dark grey shading) to mitigate salinization and polders located in areas that may be flushed in future due to SLR (indicated by light grey shading).
Water 17 00919 g002
Figure 3. What to do—and when—depends on the type of decision, complexity, uncertainty and policy options which are represented by the three axes in the cube. Three domains in the cube are identified: (1) short-term policy decisions (yellow domain), (2) scenario planning (pink domain), and (3) DMDU approaches (green domain). Developing adaptation strategies for SLR falls in the DMDU domain due to the long time frame, many policy options, system complexities and resulting high degree of uncertainty (modified from [34]).
Water 17 00919 g003
Figure 4. Example of cause-and-effect diagram used to derive the conceptual model for flood risk. The thickness of the line indicates the relative influence of a relationship (thicker line implies a stronger relationship). The color of the line indicates whether processes and relationships can be simulated with models: Green lines indicates that relationships and processes which can be simulated well with existing models, red lines indicate that processes cannot be simulated, orange lines indicate that processes can partially be simulated.
Water 17 00919 g004
Figure 5. Sand nourishment volumes required under different levels of SLR. Grey bar indicates uncertainty range. Black line indicates expected sand nourishment volume.
Water 17 00919 g005
Figure 6. Required dike heightening for SLR of 1 m (a) and 3 m (b). These scenarios include dike heightening due to increasing river flows and land subsidence (modified from Zethof and Stijnen [66]).
Water 17 00919 g006
Figure 7. Impacts of SLR on groundwater seepage salt loads: Panel (a) shows the current salt loads from groundwater to surface water. Panel (b) shows the increase in salt load at 1 m SLR. Panel (c) shows the increase in salt load at 3 m SLR. Modified from [68].
Water 17 00919 g007
Figure 8. Impacts of SLR on polder flushing water demand: Panel (a) shows the relative change in polder flushing at 1 m SLR. Panel (b) shows the relative change in polder flushing at 3 m SLR. Panel (c) shows overall polder flushing water demand as a function of SLR calculated with a Monte Carlo Analyses of the groundwater flow model. Modified from [68]. The flushing water demand is shown as a box plot: The box shows the interquartile range of flushing demand, the line within the box represents the median flushing demand and the lines outside the box represent the minimum and maximum values. Details on the Monte Carlo analyses are provide in [68].
Water 17 00919 g008
Figure 9. Impacts of SLR on saltwater intrusion in the Rhine–Meuse Estuary. Columns represent the current sea level (left column) and an SLR of 1 m (middle column) and 3 m (right column). Rows represent different river flows (Q), as indicated by Rhine inflow in the Netherlands at the border city of Lobith of 2000 m3/s (upper row, representative of current average summer flow), 1000 m3/s (middle row, current drought conditions) and 500 m3/s (lower row, potential future drought conditions). Modified from [72].
Water 17 00919 g009
Table 1. Complexity per water system, number of stochastic variables for the flood protection assessment. An x in the table indicates that a variable is included in the flood safety assessment for a specific water body. For example, for lakes wind speed and lake level is included in the modeling.
VariableRiverRiver to Sea and Storm Surge BarrierRiver to Lake and Storm Surge BarrierLakeSeaEstuary
with Storm Surge Barrier
Dunes
Wind speed and directionxxxxxx
River dischargexxx
Seawater level x xxx
Lake level xx
Barrier position xx x
Table 2. Complexity per water system and number of stochastic variables for the freshwater salinization assessments. An x in the table indicates that a variable is included in the flood safety assessment for a specific water body. For example, for the open Rhine-Meuse Estuary, sea level, river flow, water demand and tidal action is included in the modeling.
Sea LevelRiver FlowWater DemandRainfall EvaporationShipping-Related Salt Intrusion at LocksTidal ActionSaline Discharge to Surface Water from Polder Discharge
Groundwater salinizationxxxx
Open Rhine–Meuse Estuaryxxx x
Closed surface water systemsxxxxx x
Disclaimer/Publisher’s Note: The statements, opinions and data contained in all publications are solely those of the individual author(s) and contributor(s) and not of MDPI and/or the editor(s). MDPI and/or the editor(s) disclaim responsibility for any injury to people or property resulting from any ideas, methods, instructions or products referred to in the content.

