Abstract
In this study, we conducted a comprehensive analysis of surface water area changes in 9235 small and medium-sized reservoirs across China from 1985 to 2021. Using Landsat and Sentinel-2 satellite data, our investigation delved into the spatiotemporal changes in these reservoirs and explored reservoir-based droughts. Using a robust algorithm, we examined the spatial and temporal patterns of surface water area (SWA) change on a national scale. While cumulative SWA remained stable at the national level, our analysis revealed diverse variations in individual catchments. To improve our understanding of reservoir-based hydrological drought, we introduced the Standardized Area Index (SAI). This index serves as a metric for quantifying drought severity and reveals a distinct north–south divide in China. The study shows that water-scarce northern regions experience prolonged and severe droughts, necessitating increased conservation efforts. Conversely, the water-rich southern region prioritizes increasing reservoir capacity. Our findings underscore the importance of small and medium-sized reservoirs in shaping China’s water resources landscape. Furthermore, this study provides valuable insights into the nuanced characteristics of droughts, facilitating the development of regionally tailored water management strategies.
1. Introduction
Reservoirs are crucial for water resource management and provide various societal and economic benefits, such as hydroelectricity generation, flood control, and water diversion [1,2]. The current increase in reservoir construction is due to the need to adapt to climate change and meet the demands of a growing global population, and it is expected to continue in the coming decades [3,4]. As reservoirs continue to be essential components of water infrastructure, a better understanding of reservoir spatiotemporal changes becomes imperative for ensuring sustainable water management [5,6].
Significant progress has been made in understanding variations in surface water area. Databases such as those containing static information on the location, nominal surface area, and spatial extent of surface waters worldwide [7,8] have been instrumental in this regard. Similarly, global datasets specific to reservoirs, such as those provided by ICOLD and GRanD [9,10], have been useful for studying surface water areas on a broad scale. However, the current body of knowledge primarily concentrates on the static state without providing significant insights into the temporal fluctuations in surface water areas. Recent remote sensing initiatives aimed at addressing these gaps have been made possible by accessible cloud computing platforms such as Google Earth Engine [11,12]. These platforms provide robust computing capabilities for studying global variations in surface water area, offering comprehensive information about surface water on a large scale [13,14]. However, existing cloud computing-based efforts have mainly focused on large reservoirs. Several datasets have been dedicated to analyzing surface water spatiotemporal changes in large reservoirs. For instance, Zhao et al. [15] conducted a comprehensive study, which generated valuable datasets that supported further investigations into the variations and trends in major water bodies. Similarly, Yao et al. [16] meticulously constructed a long-term area time series for 428 reservoirs and lakes, focusing on larger water bodies and recovering inundation areas from Landsat-based images contaminated by clouds. Khandelwal et al. [17] adopted a global perspective and mapped the areal extent and temporal variations in reservoirs at a spatial resolution of 500 m with 8-day intervals from 2000 to 2015. Tortini et al. [18] contributed to the global dataset landscape by providing information on the surface water area of 347 lakes and reservoirs. These studies have enriched our understanding of surface water spatiotemporal changes, particularly in the context of larger water bodies. Some studies provide time series of imagery-based surface water area estimates for medium and small-sized reservoirs worldwide [19,20].
Despite the availability of extensive datasets and well-established methods, there are still fundamental gaps in our understanding of surface area spatiotemporal changes over medium and small-sized reservoirs on a large scale. The magnitude of seasonal variations in these reservoirs is poorly understood. These knowledge gaps introduce uncertainties in characterizing hydrological budgets, developing land surface models, and understanding the responses and contributions of reservoirs to climate change [21,22].
Monitoring surface area variations is also crucial for drought assessment, particularly for a type known as reservoir-based drought (RBD). Unlike traditional droughts [23,24], which are measured through precipitation and soil moisture, RBDs present a unique challenge due to limitations in regular monitoring methods. The absence of a clear perspective on RBDs, especially concerning small and medium-sized reservoirs, creates a vital knowledge gap that hampers effective water resource management and drought mitigation. In China, there are over tens of thousands small and medium-sized reservoirs that pose a challenge to ensuring water security due to diverse terrains and climates [25,26]. These reservoirs are crucial for irrigation, hydroelectricity generation, and societal well-being but are susceptible to RBDs. Therefore, it is crucial to understand the spatiotemporal changes in these reservoirs, particularly their surface water variations, to ensure sustainable water management and reduce drought risks in China and beyond. Although significant, our understanding of the spatiotemporal changes in these reservoirs and the suitability of satellite area variations for drought monitoring remains limited.
This study uses high-resolution satellite remote sensing data to investigate the variations in surface water areas of small and medium-sized reservoirs in China. The aim is to provide a comprehensive view of their spatiotemporal changes, including seasonal variations and long-term trends. A novel tool, the Standardized Area Index (SAI), was developed based on the surface water area time series as a quantitative measure of reservoir-based drought. This tool is compared with the Standardized Precipitation Index (SPI), which has been widely used in drought monitoring and assessment, aiming to accurately evaluate the duration and intensity of drought events, thereby improving the accuracy of drought assessments. The method and development of the SAI are expected to have a significant impact on sustainable water resource management and enhance drought preparedness, ultimately providing a safer future for water-dependent communities.
2. Materials and Methods
2.1. Study Area
This study covers 9295 medium and small–sized reservoirs (sizes varying from 0.01 to 100 km2) located throughout China, which play a vital role in the country’s water landscape. These reservoirs serve essential functions, such as crop irrigation and hydroelectricity generation. The data for these reservoirs were obtained from the GRanD database [11,27]. The database provides a range of attributes for reservoir shapefiles, including important details such as dam geolocations (latitude and longitude), reservoir extents and areas, dam heights, and storage capacity. The analysis revealed significant differences in water area, storage capacity, and primary function among the selected reservoirs. Figure 1 presents the spatial distribution of the finalized reservoirs with their static mean surface water areas. Reservoirs in China are mainly concentrated in the eastern and middle regions, indicating their strategic placement for water management. On average, these reservoirs have a median area of 0.33 km2 and a total water area of 17,596 km2.
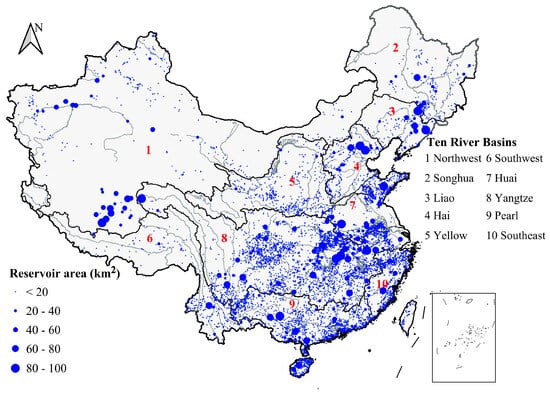
Figure 1.
Mapped locations of small and medium-sized reservoirs in China.
The distribution of reservoirs in ten major river basins in China is shown in Table 1. The ’Northwest River Basins’ and ’Southwest River Basins’, respectively, refer to the river basin areas in the corresponding regions of China. The Yangtze River Basin has the highest number of studied reservoirs (3797), while the Liao River Basin has the lowest (165). The Huai River Basin has the largest median water area (0.35 km2), and the Yellow River Basin has the smallest (0.20 km2). The Yangtze River Basin also has the largest total water area (6173 km2), followed by the Pearl River Basin (2608 km2). Other significant contributors are the Northwest River Basin (2134 km2) and the Yellow River Basin (604 km2).

Table 1.
Information on the studied reservoirs distributed in the ten river basins in China.
This dataset provides a basis for investigating the behavior of reservoirs in China.
2.2. Methods
2.2.1. Reservoir Surface Water Area Data Acquisition
Based on the 35 years of reservoir surface area data interpreted from Landsat and Sentinel-2 images by Donchyts et al. [28,29], this study employs an advanced algorithm specifically designed to extract water body information from satellite images, even in the presence of cloud cover. Utilizing this algorithm, we examine changes in reservoir water area over the past 35 years using medium-resolution satellite imagery from NASA’s Landsat and the European Space Agency’s Copernicus Sentinel missions [30,31]. The code for this algorithm is publicly accessible and can be executed on the Google Earth Engine (GEE) platform. Previous studies have validated the performance of this algorithm, demonstrating its accuracy in mapping the water areas of 768 reservoirs of various sizes and geographic locations [29].
This study is based on the GRanD database and extracts information on 9295 medium and small reservoirs in China (ranging in size from 0.01 to 100 km2) [13,27]. It filters the monthly surface area dataset of reservoirs produced by Donchyts et al. to obtain the 35 years of monthly surface area time series for these 9295 medium and small reservoirs in China.
2.2.2. Characterizing Reservoir-Based Droughts by Developing a Standardized Area Index
This study introduces a Standardized Area Index (SAI) derived from satellite-based monthly reservoir water areas, analogous to the widely used Standardized Precipitation Index (SPI) for drought monitoring. SPI-like drought categories are then assigned based on SAI thresholds: mild (−1 to −1.5), moderate (−1.5 to −2), severe (−2 to −2.5), and extreme (below −2.5) (Table 2) [32,33].

Table 2.
Reservoir-based drought classification.
The calculation formula for the SAI is as follows:
where SA represents the monthly surface area of the reservoir, μ represents the long-term average of the reservoir’s surface area, and σ represents the standard deviation of the reservoir’s surface area.
SAI = (SA − μ)/σ
Droughts are further characterized by duration (the number of months between onset and termination), maximum intensity (the minimum SAI value during the drought), and mean intensity (the average SAI value during the drought) (Figure 2). Droughts are identified as periods when the SAI remains negative, with onset defined as the first negative month and termination as the first positive month, or the study period’s end for ongoing droughts. This methodology facilitates standardized drought assessment and characterization using readily available satellite data, offering valuable insights into reservoir water spatiotemporal changes and their implications for regional droughts.
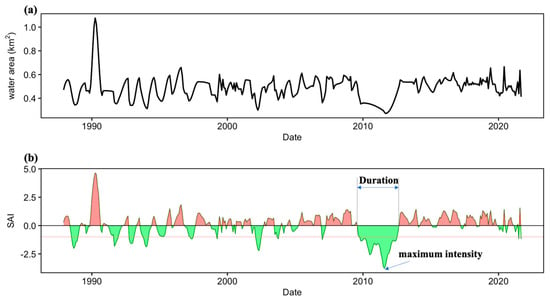
Figure 2.
An example of the illustration of the reservoir-based drought using the Standardized Area Index based on the monthly satellite-based reservoir water area time series. ((a). Reservoir surface water area change; (b). Reservoir SAI change.)
2.2.3. Reservoir SPI Calculation
This study collected monthly precipitation data from 613 meteorological stations across China (1987–2021), sourced from the China Meteorological Data Service Network (Figure 3a). A 10 km buffer zone was established around each station to extract information on small and medium-sized reservoirs within the buffer (Figure 3b). Reservoir SPI values were randomly calculated based on station data, and the SPII index (Standardized Precipitation Impact Index) values were compared with the SAI (Surface Area Index) values of the reservoirs.
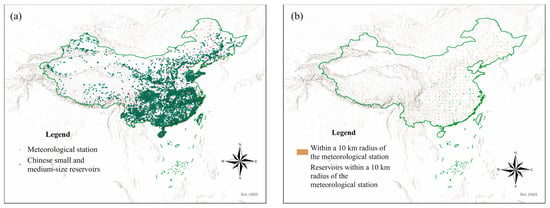
Figure 3.
The extraction of meteorological station locations and medium and small reservoirs within the buffer zone ((a) the locations of meteorological stations and medium and small reservoirs in China; (b) the extraction of medium and small reservoirs within the 10 km buffer zone of meteorological stations).
Drought intensity was assessed using a monthly calibrated SPI [1]. The methodology comprises the following steps:
1. Monthly Precipitation Series Extraction
For each month (), a historical precipitation series is constructed as follows:
where denotes the precipitation in the i-th year for month .
2. Gamma Distribution Parameter Estimation
Gamma distributions are independently fitted to monthly precipitation series as follows:
where , and is the monthly mean precipitation.
3. Zero-Precipitation Adjustment
For months with zero precipitation years, a corrected probability is applied as follows:
where is the number of zero precipitation years in month .
4. Cumulative Probability Calculation
5. Standardization
where is the inverse standard normal distribution function.
The criteria for drought assessment are presented in Table 3.

Table 3.
SPI drought classification.
3. Results
3.1. Surface Water Area Variations in Medium and Small-Sized Reservoirs in China
We leveraged existing datasets generated by these global efforts on mapping dams and reservoirs, extracting data for the 9295 reservoirs within China’s borders. This allowed us to create detailed monthly area time series for each medium and small-sized reservoir (with sizes of up to 100 km2) utilizing the combined power of Sentinel-2 and Landsat satellites. Donchyt et al. utilized data from multiple Landsat and Sentinel satellites to ensure frequent observations and to capture rapid changes in reservoir area. For validation, Donchyt et al. leveraged existing studies that conducted rigorous comparisons of satellite-derived surface water area with in situ water level and storage measurements for hundreds of reservoirs across diverse regions. These studies demonstrated high accuracy (r2 > 0.7 in 67% of cases), confirming that satellite-derived surface area can effectively serve as a proxy for storage spatiotemporal changes in many situations [29].
To begin investigating the patterns of reservoir surface area change, it is crucial to first understand the overall changes in surface area of reservoirs across China. To achieve this, we aggregated the surface area time series of individual reservoirs to obtain a national total surface area time series for all reservoirs. Additionally, we calculated the cumulative area of reservoirs in each of China’s ten major river basins, as illustrated in Figure 3a. The median surface area of reservoirs in this study is 0.33 km2 as we focus on small and medium-sized reservoirs. The time series also show a seasonal signal of reservoirs, which is reflected in the total reservoir surface area time series. However, the magnitude of this change appears to be small relative to the total area. The small cumulative change in surface area is not unexpected, as reservoirs throughout the country exhibit diverse patterns that are frequently linked to alterations in surface water supply caused by both natural and human factors. When various time signals are combined at the national or basin level, they are anticipated to partially cancel each other out. However, this finding is still significant as it provides the most comprehensive estimate of the surface area change in small and medium-sized reservoirs in China to date. A spatial and temporal analysis was conducted on the cumulative reservoir water surface area in the ten major river basins in China (Figure 4b–e). The results indicate that the Yangtze River Basin accounts for the largest proportion, approximately 38% of the national total, followed by the Pearl River Basin with 15%, the Huai River Basin with 11%, and the Northwest Region with about 9%. The Yellow River Basin and the Southwest Basin accounted for the smallest proportion at only 3%. For the time-varying analysis, we selected four specific years (1990, 2000, 2010, and 2020) because they represent significant temporal milestones, capturing long-term trends and changes in reservoir surface areas. These years provide decade-based snapshots that reflect both historical and recent developments. Our analysis found that the annual changes in the cumulative water surface area of reservoirs in different basins were minimal. It is worth noting that the Yangtze River basin has consistently maintained its dominance over the years, indicating its significant contribution to the overall cumulative reservoir area. Despite potential regional and temporal fluctuations, the contribution of annual changes remained stable across basins.
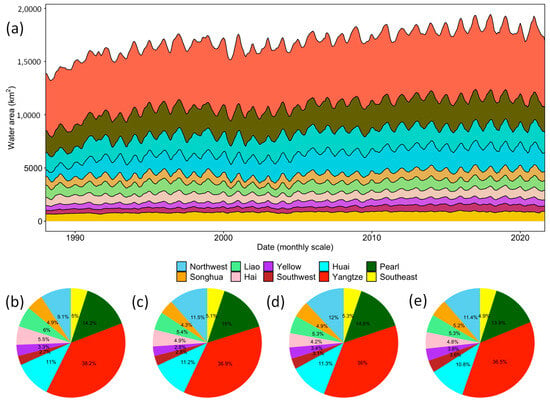
Figure 4.
(a) Accumulated time series of surface area for medium and small-sized reservoirs in ten major river basins in China. (b–e) Relative contribution of total reservoir areas of each river basin to total areas in China in 1990, 2000, 2010, and 2020, respectively.
Next, we investigated the variability in individual water body scales, which represents the opposite end of the spectrum. Figure 5 presents a detailed analysis of annual and seasonal trends, as well as area changes in small and medium-sized reservoirs across Chinese river basins. The extent of area change, defined as the difference between maximum and minimum surface areas, is shown in Figure 5a. There is a correlation between reservoir size and the amplitude of area changes. Larger reservoirs tend to exhibit more significant variations. The magnitude of change generally falls within a single order of magnitude, with smaller variations below 1 km2. Particularly pronounced variations of around 50 km2 are prevalent in the middle and lower reaches of the Yangtze River, as well as in the southern regions of the Pearl River Basin. The Hai River Basin, among other northern basins, shows larger fluctuations in reservoir area, which may be due to human water usage. Figure 5b displays covariate changes, with most reservoirs having a coefficient of variation (CV) below 20. Reservoirs in the northern regions (the geographic region north of the Qinling–Huaihe Line, encompassing the Yellow, Haihe, and Liaohe River basins), particularly in the Yellow River and Hai River basins, exhibit greater variability in their CV. This increased variability is likely due to human factors, specifically the influence of water usage practices. Upon examining Figure 5c,d, which represent intra and inter-annual variations, respectively, it is evident that both exhibit similar spatial characteristics. However, a detailed examination does not reveal any strong discernible patterns, which emphasizes the complexity of the factors influencing these temporal variations.
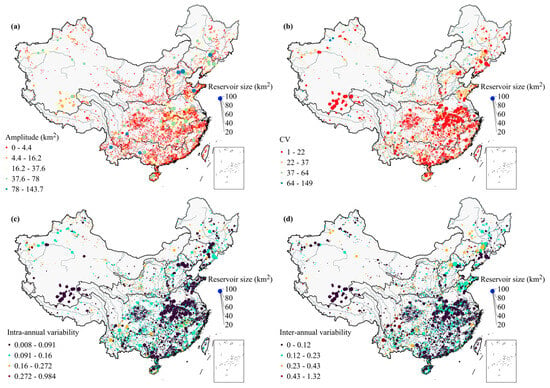
Figure 5.
Intra-annual trend, inter-annual trend, magnitude of area changes, and covariate changes in surface area spatiotemporal changes in small and medium-sized reservoirs in China. (a) Extent of reservoir area change. (b) Coefficient of variation (CV) of reservoir area. (c) Intra-annual variation in reservoirs. (d) Inter-annual variation in reservoirs.
3.2. Comparison of SAI and SPI Values
A total of 271 medium and small reservoirs were extracted within the 10-kilometer buffer zone centered around the meteorological stations (Figure 3b). To evaluate the performance of different drought indices in hydrological monitoring, we conducted a detailed comparative analysis of the SAI values of the reservoirs and the SPI values of the meteorological stations, with the results from six example reservoirs illustrated in Figure 6. The results indicate significant differences between the SAI and SPI values in monthly drought assessments.
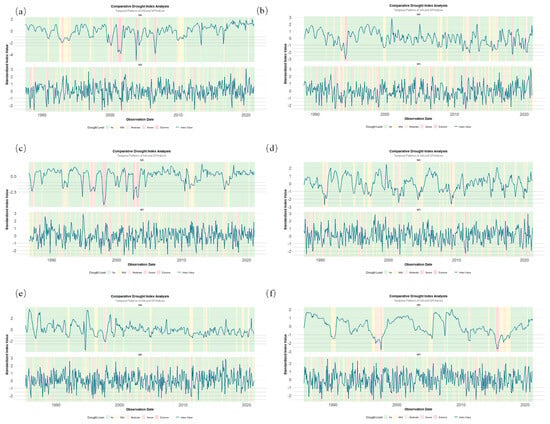
Figure 6.
Comparison of SAI and SPI. Panels (a–f) correspond to reservoirs coded as 0000711, 0002742, 0029556, 004033, 0045740, and 0054859, respectively.
Figure 7 displays drought detection results for six reservoirs. Based on comparative analyses of Figure 6 and Figure 7, the Standardized Area Index (SAI) demonstrates unique feasibility and applicability in drought monitoring, particularly offering critical reference values for large-scale regional water resource assessments. The key findings are summarized as follows: 1. The Conservative Nature of the SAI: The conservative characteristic of the SAI (with an average of 55.2 fewer drought months than the SPI) stems from its direct observation of actual reservoir water storage. Unlike the SPI, which relies on indirect precipitation-based calculations, the SAI avoids non-linear error accumulation during the precipitation-to-storage conversion process. The SAI exhibits a consistently higher proportion of “no drought” classifications compared to the SPI (+5.6% to +12.3%), indicating stricter criteria for non-drought conditions. This conservatism provides a robust reference for setting water storage safety thresholds and reduces the risk of false alarms for drought. 2. The SPI’s Sensitivity to Precipitation Variability: The SPI’s drought detection is highly dependent on precipitation fluctuations (evidenced by its dispersed distribution in Figure 6), making it susceptible to short-term extreme weather events (e.g., sudden heavy rain or drought). For instance, in Reservoir_0002742, the SPI detected moderate drought at a significantly higher frequency (9.9%) than the SAI (4.2%), reflecting how precipitation data sensitivity may amplify the impact of short-term climatic anomalies. In contrast, the SAI leverages the long-term standardization of reservoir surface area (using 35-year historical μ and σ values), where the lagged response of reservoir storage to precipitation naturally buffers short-term meteorological fluctuations. 3. Scalability and Technical Advantages: The SAI, supported by the open-source algorithm on the Google Earth Engine platform, enables automated global reservoir monitoring (validated across 9295 reservoirs). Its monthly update frequency outperforms the SPI’s reliance on delayed meteorological station data integration. Additionally, the SAI’s 30-meter resolution allows for the precise monitoring of small reservoirs (≥0.01 km2), addressing spatial gaps in the SPI’s coverage, particularly in regions with sparse station networks (e.g., Western China).
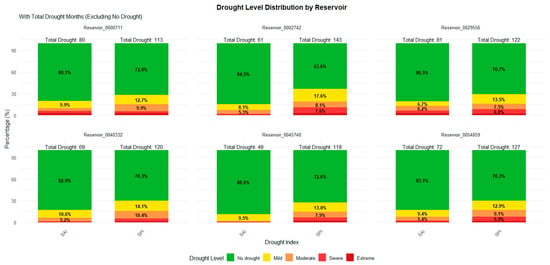
Figure 7.
Drought detection results for six reservoirs.
In conclusion, the SAI provides a more realistic and stable indicator of water resource conditions through direct physical observation, conservative threshold design, and high-resolution spatial coverage. While its conservatism may slightly delay drought warnings, it effectively mitigates the SPI’s overresponse to meteorological data volatility, ensuring more reliable drought assessment outcomes.
3.3. Reconstruction of Reservoir-Based Drought Characteristics
To identify hotspots of reservoirs showing prolonged and intense droughts, we reconstructed drought characteristics based on the SAI in the current climate (1985–2021) to understand drought variability across reservoirs. The duration, mean intensity, and maximum intensity for each drought spell at each reservoir were identified using the SAI. Figure 8 displays the spatial variability of total drought durations in China based on reservoir-based droughts from 1985 to 2021 based on the droughts identified by the reservoir satellite area SAI. The figure illustrates that there are significant differences in the spatial distribution of reservoir drought between the north and south of China. Generally, northern reservoirs experience higher frequency and duration of drought than southern reservoirs. Reservoir droughts in the Yellow River Basin, Huai River Basin, and Liao River Basin are the most severe, lasting more than 100 months on average. In contrast, reservoir droughts in the Yangtze River Basin, Pearl River Basin, and Southwest China are relatively mild, with an average drought duration of less than 50 months. The northern region has an arid climate with less precipitation and greater evaporation, resulting in a prominent contradiction between water supply and demand. Additionally, the northern region has a higher population density, a higher level of economic development, and a strong demand for water resources, exacerbating the occurrence of reservoir drought. The spatial variability of drought in Chinese reservoirs has significant implications for water resource management. In the northern region, it is necessary to strengthen the conservation and protection of water resources, rationally allocate water resources, and improve water resource utilization efficiency. In the southern region, reservoir management should be enhanced to improve reservoir storage capacity and reduce the risk of reservoir drought.
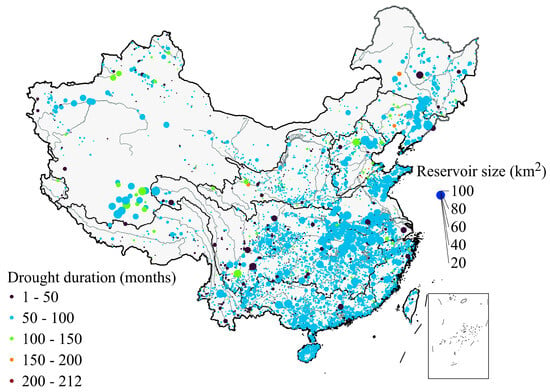
Figure 8.
Durations of droughts between 1985 and 2021 determined using the Standardized Area Index derived from monthly time series of satellite-based reservoir water areas.
To analyze the variability of drought across reservoirs under different drought conditions, we examined the characteristics of each drought category. Figure 9 and Figure A1 show the maximum attributes of extreme and mild droughts for each reservoir across the country, including the longest duration, maximum intensity, and average intensity of extreme drought events experienced by each reservoir. The figure illustrates that extreme droughts in most reservoirs lasted from one to six months, with some lasting from six to fifteen months, primarily in the northern part of the Hai and Huai River Basins and the northwestern part of the Songhua River Basin. There were also isolated cases lasting one to two years. For mild droughts, the longest duration is typically concentrated in 1–6 months. The number of reservoirs with a mild drought lasting 6–20 months has increased in the Northwest Basin despite an overall decrease in their number. Extreme droughts in the region are mainly of maximum intensity ranging from −2.5 to −2.9, with a few reservoirs below −3.6. In contrast, the Yangtze River Basin exhibits greater variability, particularly in its middle and lower reaches. The maximum intensity of mild droughts is typically concentrated between −1 and −1.5, indicating spatial variations.
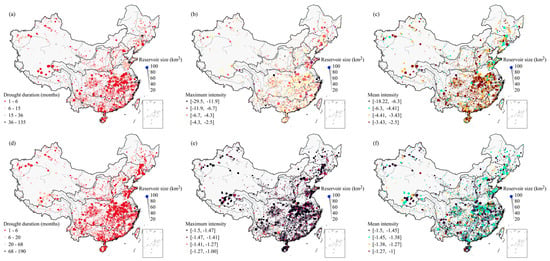
Figure 9.
Reconstruction of drought characteristics (duration, maximum intensity, and mean intensity) using Standardized Area Index (SAI) from monthly satellite-based reservoir surface area time series during 1985–2021 period. Panels (a–c) represent drought characteristics of extreme drought, and panels (d–f) represent drought characteristics of mild drought.
To further investigate, we divided Chinese reservoirs into ten basins and categorized them for a spatial analysis of drought characteristics. Figure 10 shows the spatial variability of drought characteristics under extreme droughts and mild droughts, and readers can find the other two types of droughts in Figure A2. For each category, the figure shows the maximum value of the duration, maximum intensity, and mean intensity of droughts experienced by reservoirs in each river basin. The maximum duration of extreme droughts is generally between 1 and 6 months for most basins, with some extreme droughts lasting up to 12 months or even longer. The Huai River Basin exhibited the largest variability in maximum durations, followed by the Southwest Basin, Southeast River, and the Songhua River Basin. The other basins experienced relatively small changes, generally under 4 months. The maximum duration of mild droughts is generally between 1 and 2 months for most basins. The maximum intensity of extreme droughts is primarily distributed in the range of −2.0 to −3.0 across most basins, indicating severe dryness. We found that the Northwest Basin, Southwest Basin, and Songhua River Basin have the highest variability in terms of the maximum intensity, while the Yangtze and Pearl River basins have the lowest variability. The maximum intensity of mild droughts is generally less severe than that of extreme droughts, ranging from −1 to −1.5 for most basins. The Southwest River Basin stands out with the largest variation in the maximum intensities for mild droughts. The overall pattern of mean intensity across basins is similar to that of maximum intensity, with slightly lower values. This is because the mean intensity considers the average dryness throughout the drought event, while the maximum intensity represents the most severe conditions experienced at any given time. The findings imply that Chinese reservoirs exhibit spatial variability in drought characteristics, with differences among river basins. The Huai River Basin shows significant variability in extreme drought durations, while the Northwest Basin, Southwest Basin, and Songhua River Basin demonstrate higher variability in extreme drought intensity. Mild droughts generally have shorter durations and less severe intensities. Understanding these spatial patterns is crucial for effective water resource management and drought mitigation strategies in different regions.
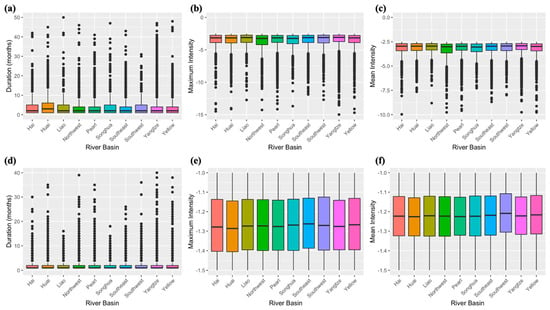
Figure 10.
A boxplot of drought characteristics under extreme (a–c) and mild drought (d–f) conditions (duration, maximum intensity, and mean intensity) using the Standardized Area Index (SAI) from monthly satellite-based reservoir surface area time series during the 1985–2021 period in ten major river basins in China.
4. Discussion
4.1. Spatiotemporal Changes in China’s Medium and Small-Sized Reservoirs
Our study explores the spatiotemporal changes in China’s reservoirs, focusing on both drought characteristics and changes in the surface water area of small and medium-sized reservoirs. We used satellite data and the Standardized Area Index (SAI) to reveal patterns of spatial and temporal variability, providing insights into water resource management and drought mitigation strategies. Figure 1 displays the spatial distribution of these reservoirs, highlighting their strategic locations for effective water resource management, which are concentrated in the eastern and central regions. The analysis of small and medium-sized reservoirs, as shown in Figure 4, provides a more detailed understanding of their spatiotemporal changes. Large reservoirs exhibit greater variations in size, up to 50 square kilometers, indicating regional differences. The Hai River Basin, like other northern basins, experiences significant fluctuations that may be related to human water use patterns, highlighting the complex interplay of natural and anthropogenic factors.
4.2. SAI Introduction and Reservoir Drought Characteristics
This study presents a detailed investigation of drought spatiotemporal changes in China’s reservoirs using satellite-acquired surface water area data and a novel Standardized Area Index (SAI). Although the SPI has some value in short-term meteorological drought monitoring, the SAI has shown greater superiority in identifying continuous dry periods and water resource scheduling.
Regional variations in reservoir spatiotemporal changes are more pronounced, particularly in basins such as the Hai River, which exhibit large fluctuations that may be attributed to human water use patterns. This underscores the complex interplay between natural and anthropogenic factors that influence reservoir spatiotemporal changes. The SAI has proven to be a valuable tool in characterizing drought severity within the reservoir system. By establishing clear thresholds, droughts can be categorized into four classes: mild, moderate, severe, and very severe. Figure 8 highlights the sharp contrast between the north and south. Reservoirs in the Yellow, Huai, and Liao River basins experience long droughts, often lasting more than 100 months, which is consistent with the region’s arid climate of low precipitation and high evaporation. In contrast, droughts in the southern basins, such as the Yangtze and Pearl River basins, are less severe, averaging less than 50 months. This difference highlights the significant influence of climatic conditions on drought vulnerability.
However, it is important to note that human activities also contribute significantly to the occurrence of droughts in the northern region due to a higher population density and intensive economic activities. Therefore, integrated water resources management strategies that consider both climatic and human factors are crucial. To reveal the nuances of droughts of varying severity, we analyzed the characteristics of extreme and mild droughts separately. Figure 10 and Figure A1 vividly depict the spatial distribution of drought duration and intensity. Extreme droughts typically last from one to six months, and in some cases, up to two years, and are mainly concentrated in the north. Regional differences are evident under the maximum drought intensity, with the highest levels occurring in the northwest, southwest, and Songhua River basin. Mild droughts, on the other hand, are shorter in duration and less intense, typically lasting less than two months, with a maximum intensity concentrated between −1 and −1.5. However, there has been an increase in the number of reservoirs in the Northwest Basin experiencing mild droughts lasting 6 to 20 months. This highlights the need for targeted mitigation strategies in specific regions.
4.3. Limitations, Implications, and Future Directions
Although our study offers valuable insights into reservoir spatiotemporal changes and drought characterization, we acknowledge its limitations. We recognize that using surface area alone as a proxy for drought severity provides only a one-sided perspective. Our analysis does not explore the intricate interactions between factors such as water intake, evaporation, and reservoir capacity. It is essential to recognize these limitations when interpreting study results in an integrated context. In this study, we calculated the Standardized Area Index (SAI) on a monthly basis. Further investigation could explore different time scales to capture changes at finer or wider intervals. Analyzing the validity of the SAI at different time scales could improve its applicability and robustness in drought monitoring. This approach allows for a more comprehensive assessment of reservoir spatiotemporal changes at different temporal resolutions. In-depth comparisons with traditional drought indices, such as the standardized runoff index (SRI), could enhance our understanding of drought severity. Future research could explore how the SAI aligns with or complements these indices to provide a more comprehensive assessment of reservoir-based drought. Incorporating various indices could enhance the drought resilience of monitoring systems.
Future research efforts should aim to explore other parameters beyond surface area to gain a more comprehensive understanding of reservoir-based drought. To achieve this, it is recommended to incorporate water intake, evapotranspiration rates, and reservoir capacity into the analysis. By doing so, a more nuanced picture of drought severity can be obtained. Additionally, an integrated approach is necessary to investigate the drivers behind regional differences in drought characteristics. Integrating climatic, topographic, and anthropogenic factors can reveal the complexities that influence reservoir spatiotemporal changes. Extending this study to a global scale could provide valuable insights. Assessing reservoir spatiotemporal changes in various regions with different climatic conditions and reservoir sizes can contribute to a more complete understanding. Assessing the applicability of the findings to large reservoirs worldwide can improve the generalizability of the results and their implications for global water management.
5. Conclusions
This study presents a comprehensive survey of 9295 small and medium-sized reservoirs in China, ranging in size from 0.01 to 100 km2, over a 36-year period (1985–2021). The study reveals complex patterns of surface water spatiotemporal changes and hydrologic droughts, providing important insights into water resource management. High-precision satellite data extraction techniques were used to reveal subtle regional variations that were masked by the stable national cumulative surface area. To measure the severity of hydrological droughts, we propose the Standardized Area Index (SAI), which categorizes drought events into four classes: mild, moderate, severe, and extreme. We derived several key findings:
1. The national total surface area time series for all reservoirs, including small and medium-sized ones, reveals a seasonal signal, though the cumulative change in surface area is relatively small due to the diverse and often opposing patterns of surface water supply across the country. The Yangtze River Basin accounts for the largest proportion of the national total reservoir area at approximately 38%, followed by the Pearl River Basin (15%), the Huai River Basin (11%), and the Northwest Region (9%). The Yellow River Basin and the Southwest Basin contribute the least at only 3%. Analyzing data from key years (1990, 2000, 2010, and 2020) showed that annual changes in the cumulative water surface area of reservoirs across different basins are minimal, with the Yangtze River Basin consistently maintaining its dominance. Despite regional and temporal fluctuations, the contribution of annual changes remains stable across basins, highlighting the resilience of the reservoir systems.
2. While the stable national cumulative surface area demonstrates the remarkable resilience of reservoir networks, this macro-stability masks critical north–south divergences demanding customized management. There are more severe reservoir droughts in the north. In the Yellow River Basin, Huai River Basin, and Liao River Basin, the mean cumulative drought duration of reservoir groups at the regional scale exceeds 100 months, while in southern regions, such as the Yangtze River Basin, Pearl River Basin, and southwestern regions, the average duration of reservoir droughts is less than 50 months. The maximum intensity of extreme droughts in some northern reservoirs ranges from −2.5 to −2.9, with some reservoirs even exceeding −3.6. The maximum intensity of mild droughts is typically between −1 and −1.5. Additionally, there are spatial differences in drought duration and intensity. The duration of extreme droughts in the north usually ranges from 1 to 6 months, with some areas experiencing durations of 6 to 15 months, and in rare cases, 1 to 2 years. The duration of mild droughts generally ranges from 1 to 6 months, with some reservoirs in the northwestern basins experiencing durations of 6 to 20 months.
These findings have significant implications for customized water management strategies. Three-tiered adaptive management should be prioritized as follows: 1. Northern basins require drought-focused interventions emphasizing precautionary allocation and demand-side governance to break escalating scarcity cycles. 2. Southern basins demand capacity reinforcement strategies preserving their compensatory buffer functions. 3. Interregional coordination must institutionalize water security solidarity mechanisms, transforming localized resilience into collective insurance against systemic shocks. Future studies should consider additional parameters, such as water inflow, evapotranspiration, and reservoir capacity, to provide more comprehensive information. Investigating the drivers of regional change and the potential impacts of climate change on future drought patterns will also be critical to the development of long-term water management plans.
Author Contributions
Conceptualization, Z.L. and L.T.; methodology, S.X. and L.T.; software, C.L. and L.T.; formal analysis, J.L.; investigation, D.T.; resources, D.T.; data curation, Z.L. and L.T.; writing—original draft preparation, Z.L. and L.T.; writing—review and editing, Z.L. and L.T.; visualization, Z.L. and L.T.; funding acquisition, S.X., C.L. and L.T. All authors have read and agreed to the published version of the manuscript.
Funding
This research was funded by the “Science and Technology Research Project of the Jiangxi Provincial Department of Education (Grant No. GJJ211945)”, the “Science and Technology Research Project of the Jiangxi Provincial Department of Education (No. GJJ201919).
Data Availability Statement
The data are unavailable due to privacy or ethical restrictions.
Conflicts of Interest
The authors declare no conflicts of interest.
Correction Statement
This article has been republished with a minor correction to the Funding statement. This change does not affect the scientific content of the article.
Appendix A
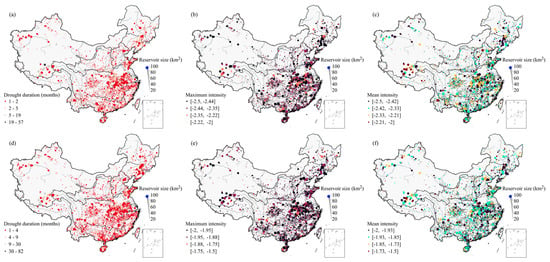
Figure A1.
Reconstructions of drought characteristics (duration, maximum intensity, and mean intensity) using the Standardized Area Index (SAI) from monthly satellite-based reservoir surface area time series during the 1985–2021 period. Panels (a–c) represent the drought characteristics of severe drought, and panels (d–f) represent the drought characteristics of moderate drought.
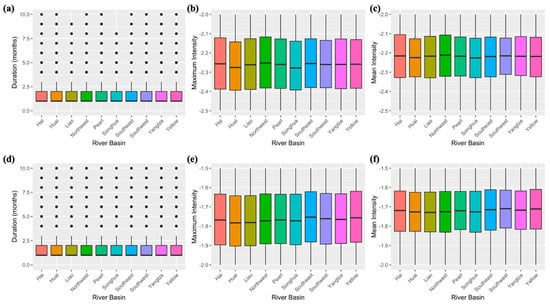
Figure A2.
A boxplot of the drought characteristics under severe (a–c) and moderate drought (d–f) conditions (duration, maximum intensity, and mean intensity) using the Standardized Area Index (SAI) from monthly satellite-based reservoir surface area time series during the 1985–2021 period in ten major river basins in China.
References
- Intralawan, A.; Wood, D.; Frankel, R.; Costanza, R.; Kubiszewski, I. Tradeoff analysis between electricity generation and ecosystem services in the lower Mekong Basin. Ecosyst. Serv. 2018, 30, 27–35. [Google Scholar] [CrossRef]
- Busker, T.; de Roo, A.; Gelati, E.; Schwatke, C.; Adamovic, M.; Bisselink, B.; Pekel, J.-F.; Cottam, A. A global lake and reservoir volume analysis using a surface water dataset and satellite altimetry. Hydrol. Earth Syst. Sci. 2019, 23, 669–690. [Google Scholar] [CrossRef]
- Gutenson, J.L.; Tavakoly, A.A.; Wahl, M.D.; Follum, M.L. Comparison of generalized non-data-driven lake and reservoir routing models for global-scale hydrologic forecasting of reservoir outflow at diurnal time steps. Hydrol. Earth Syst. Sci. 2020, 24, 2711–2729. [Google Scholar] [CrossRef]
- Shen, Y.; Liu, D.; Jiang, L.; Nielsen, K.; Yin, J.; Liu, J.; Bauer-Gottwein, P. High-resolution water level and storage variation datasets for 338 reservoirs in China during 2010–2021. Earth Syst. Sci. Data 2022, 14, 5671–5694. [Google Scholar] [CrossRef]
- Shin, S.; Pokhrel, Y.; Miguez-Macho, G. High-resolution modeling of reservoir release and storage spatiotemporal changes at the continental scale. Water Resour. Res. 2019, 55, 787–810. [Google Scholar] [CrossRef]
- Yassin, F.; Razavi, S.; Elshamy, M.; Davison, B.; Sapriza-Azuri, G.; Wheater, H. Representation and improved parameterization of reservoir operation in hydrological and land-surface models. Hydrol. Earth Syst. Sci. 2019, 23, 3735–3764. [Google Scholar] [CrossRef]
- Pekel, J.-F.; Cottam, A.; Gorelick, N.; Belward, A.S. High-resolution mapping of global surface water and its long-term changes. Nature 2016, 540, 418–422. [Google Scholar] [CrossRef]
- Hou, J.; van Dijk AI, J.M.; Beck, H.E.; Renzullo, L.J.; Wada, Y. Remotely sensed reservoir water storage spatiotemporal changes (1984–2015) and the influence of climate variability and management at a global scale. Hydrol. Earth Syst. Sci. 2022, 26, 3785–3803. [Google Scholar] [CrossRef]
- Klein, I.; Mayr, S.; Gessner, U.; Hirner, A.; Kuenzer, C. Water and hydropower reservoirs: High temporal resolution time series derived from MODIS data to characterize seasonality and variability. Remote Sens. Environ. 2021, 253, 112207. [Google Scholar] [CrossRef]
- Mulligan, M.; vanSoesbergen, A.; Sáenz, L. GOODD, a global dataset of more than 38,000 georeferenced dams. Sci. Data 2020, 7, 31. [Google Scholar] [CrossRef]
- Lehner, B.; Liermann, C.R.; Revenga, C.; Vörösmarty, C.; Fekete, B.; Crouzet, P.; Döll, P.; Endejan, M.; Frenken, K.; Magome, J.; et al. High-resolution mapping of the world’s reservoirs and dams for sustainable river-flow management. Front. Ecol. Environ. 2011, 9, 494–502. [Google Scholar] [CrossRef]
- Gorelick, N.; Hancher, M.; Dixon, M.; Ilyushchenko, S.; Thau, D.; Moore, R. Google Earth Engine: Planetary-scale geospatial analysis for everyone. Remote Sens. Environ. 2017, 202, 18–27. [Google Scholar] [CrossRef]
- Lehner, B.; Messager, M.L.; Korver, M.C.; Linke, S. Global hydro-environmental lake characteristics at high spatial resolution. Sci. Data 2022, 9, 351. [Google Scholar] [CrossRef]
- Tourian, M.J.; Elmi, O.; Shafaghi, Y.; Behnia, S.; Saemian, P.; Schlesinger, R.; Sneeuw, N. HydroSat: Geometric quantities of the global water cycle from geodetic satellites. Earth Syst. Sci. Data 2022, 14, 2463–2486. [Google Scholar] [CrossRef]
- Zhao, G.; Li, Y.; Zhou, L.; Gao, H. Evaporative water loss of 1.42 million global lakes. Nat. Commun. 2022, 13, 3686. [Google Scholar] [CrossRef] [PubMed]
- Yao, F.; Wang, J.; Wang, C.; Crétaux, J.-F. Constructing long-term high-frequency time series of global lake and reservoir areas using Landsat imagery. Remote Sens. Environ. 2019, 232, 111210. [Google Scholar] [CrossRef]
- Khandelwal, A.; Karpatne, A.; Ravirathinam, P.; Ghosh, R.; Wei, Z.; Dugan, H.A.; Hanson, P.C.; Kumar, V. ReaLSAT, a global dataset of reservoir and lake surface area variations. Sci. Data 2022, 9, 356. [Google Scholar] [CrossRef]
- Tortini, R.; Noujdina, N.; Yeo, S.; Ricko, M.; Birkett, C.M.; Khandelwal, A.; Kumar, V.; Marlier, M.E.; Lettenmaier, D.P. Satellite-based remote sensing data set of global surface water storage change from 1992 to 2018. Earth Syst. Sci. Data 2020, 12, 1141–1151. [Google Scholar] [CrossRef]
- Cooley, S.W.; Ryan, J.C.; Smith, L.C. Human alteration of global surface water storage variability. Nature 2021, 591, 78–81. [Google Scholar] [CrossRef]
- Li, Y.; Gao, H.; Zhao, G.; Tseng, K.H. A high-resolution bathymetry dataset for global reservoirs using multi-source satellite imagery and altimetry. Remote Sens. Environ. 2020, 244, 111831. [Google Scholar] [CrossRef]
- Bonnema, M.; David, C.H.; Frasson RP, D.M.; Oaida, C.; Yun, S.H. The global surface area variations of lakes and reservoirs as seen from satellite remote sensing. Geophys. Res. Lett. 2022, 49, e2022GL098987. [Google Scholar]
- Chen, T.; Song, C.; Ke, L.; Wang, J.; Liu, K.; Wu, Q. Estimating seasonal water budgets in global lakes by using multi-source remote sensing measurements. J. Hydrol. 2021, 593, 125781. [Google Scholar] [CrossRef]
- Yang, S.; Yang, D.; Chen, J.; Zhao, B. Real-time reservoir operation using recurrent neural networks and inflow forecast from a distrib-uted hydrological model. J. Hydrol. 2019, 579, 124229. [Google Scholar] [CrossRef]
- Xiao, M.; Nijssen, B.; Lettenmaier, D.P. Drought in the Pacific Northwest, 1920–2013. J. Hydrometeorol. 2016, 17, 2391–2404. [Google Scholar] [CrossRef]
- Wanders, N.; Wada, Y. Human and climate impacts on the 21st century hydrological drought. J. Hydrol. 2015, 526, 208–220. [Google Scholar] [CrossRef]
- Hao, Z.; Aghakouchak, A. Multivariate standardized drought index: A parametric multi index model. Adv. Water Resour. 2013, 57, 12–18. [Google Scholar] [CrossRef]
- Messager, M.L.; Lehner, B.; Grill, G.; Nedeva, I.; Schmitt, O. Estimating the volume and age of water stored in global lakes using a geo-statistical approach. Nat. Commun. 2016, 7, 13603. [Google Scholar] [CrossRef]
- Donchyts, G.; Winsemius, H.; Baart, F.; Dahm, R.; Schellekens, J.; Gorelick, N.; Iceland, C.; Schmeier, S. High-resolution surface water spatiotemporal changes in Earth’s small and medium-sized reservoirs. Sci. Rep. 2022, 12, 13776. [Google Scholar] [CrossRef]
- Donchyts, G.; Baart, F.; Winsemius, H.; Gorelick, N.; Kwadijk, J.; van de Giesen, N. Earth’s surface water change over the past 30 years. Nat. Clim. Change 2016, 6, 810–813. [Google Scholar] [CrossRef]
- Wilson, A.M.; Jetz, W. Remotely sensed high-resolution global cloud spatiotemporal changes for predicting ecosystem and biodiversity distributions. PLoS Biol. 2016, 14, e1002415. [Google Scholar] [CrossRef]
- Markert, K.N.; Markert, A.M.; Mayer, T.; Nauman, C.; Haag, A.; Poortinga, A.; Bhandari, B.; Thwal, N.S.; Kunlamai, T.; Chishtie, F.; et al. Comparing sentinel-1 surface water mapping algorithms and radiometric terrain correction processing in southeast asia utilizing google earth engine. Remote Sens. 2020, 12, 2469. [Google Scholar] [CrossRef]
- Aadhar, S.; Mishra, V. High-resolution near real-time drought monitoring in South Asia. Sci. Data 2017, 4, 170145. [Google Scholar] [CrossRef] [PubMed]
- Mishra, A.K.; Singh, V.P. A review of drought concepts. J. Hydrol. 2010, 391, 202–216. [Google Scholar] [CrossRef]
Disclaimer/Publisher’s Note: The statements, opinions and data contained in all publications are solely those of the individual author(s) and contributor(s) and not of MDPI and/or the editor(s). MDPI and/or the editor(s) disclaim responsibility for any injury to people or property resulting from any ideas, methods, instructions or products referred to in the content. |
© 2025 by the authors. Licensee MDPI, Basel, Switzerland. This article is an open access article distributed under the terms and conditions of the Creative Commons Attribution (CC BY) license (https://creativecommons.org/licenses/by/4.0/).