Abstract
Prioritizing agricultural land use is a significant challenge for sustainable development in the rapidly urbanizing, semi-arid riverine basins of South Asia, especially under climate variability and water scarcity. This study introduces a systematic framework combining remote sensing and geospatial data with the Soil and Water Assessment Tool (SWAT) model, morphometric analysis, and VIKOR-based Multi-Criteria Decision Analysis (MCDA) to effectively identify Agricultural Land Prioritization (AgLP) areas in the Upper Kansai Basin, India, while reducing the environmental impact, in line with Sustainable Development Goals (SDGs). The SWAT model simulation reveals varied hydrological patterns, with basin water yields from 965.9 to 1012.9 mm and a substantial baseflow (~64% of total flow), emphasizing essential groundwater–surface water interactions for sustainable agriculture. However, the discrepancy between percolation (47% of precipitation) and deep recharge (2% of precipitation) signals potential long-term groundwater challenges. VIKOR analysis offers a robust prioritization framework, ranking SW4 as the most suitable (Qi = 0.003) for balanced hydrological and morphometric features, in agreement with the SWAT outcomes. SW4 and SW5 display optimal agricultural conditions due to stable terrain, effective water retention, and favorable morphometric traits (drainage density 3.0–3.15 km/km2; ruggedness 0.3–0.4). Conversely, SW2, with high drainage density (5.33 km/km2) and ruggedness (2.0), shows low suitability, indicating risks of erosion and poor water retention. This integrated AgLP framework advances sustainable agricultural development and supports SDGs, including SDG 2 (Zero Hunger), SDG 6 (Clean Water), SDG 13 (Climate Action), and SDG 15 (Life on Land). Incorporating hydrological dynamics, land use, soil properties, and climate variables, this approach offers a precise assessment of agricultural suitability to address global sustainability challenges in vulnerable riverine basins of developing nations.
1. Introduction
The agricultural sector faces unprecedented challenges in meeting food demands for the growing populations in developing nations [1,2]. Riverine corridors, rich in fertile soils and freshwater, are crucial for agricultural production and socio-economic development [3]. However, production has declined in urbanized riverine areas due to climate change and improper land use, threatening food security for over 30% of the global population [4,5]. This underscores the need to identify suitable Agricultural Land Prioritization (AgLP) areas while mitigating environmental impacts [6].
AgLP is essential for promoting sustainable production at local, watershed, and state levels [7]. Watershed prioritization supports groundwater development, surface water management, and soil conservation in urbanized riverine basins [6,8,9,10,11,12,13,14]. In this regard, drainage patterns offer crucial insights into slope variation, geological structures, and environmental processes, with direct applications in runoff estimation, flood discharge prediction, and groundwater recharge assessment. Prioritizing watersheds through morphometric analysis enables the examination of linear, aerial, and relief features [15,16,17], though this approach alone may overlook regional variations in geology, soil types, and land use/land cover (LULC).
The constraints of conventional field-based methods necessitate the integration of Remote Sensing (RS), Geographic Information Systems (GIS), and Multi-Criteria Decision Analysis (MCDA) to develop robust land suitability assessment systems [15]. RS offers comprehensive capabilities for mapping surface features within a GIS framework [18], while advances in multispectral Landsat sensors have produced vital datasets for assessing LULC in stressed urban regions [19,20,21,22,23,24]. The Shuttle Radar Topography Mission (SRTM) has proven particularly valuable for identifying drainage basins and their features in geologically complex regions [25].
From an agricultural perspective, the combination of morphometric analysis and the Soil and Water Assessment Tool (SWAT) provides a powerful framework for developing effective conservation strategies. The SWAT effectively predicts yields of water, sediment, nutrients, and other parameters using spatially dispersed data [26], with demonstrated success in watershed hydrology applications [27,28,29,30,31]. The model’s effectiveness in humid tropical conditions enables the robust assessment of the potential impact of land use changes on flow dynamics [32].
Integrating the SWAT with morphometric analysis provides a comprehensive framework for understanding agricultural landscapes in semi-arid regions. This approach is essential for future agricultural practices, as it accounts for soil moisture dynamics, groundwater flow patterns, surface runoff characteristics, and the physical attributes of drainage basins. While morphometric analysis identifies areas susceptible to erosion, the SWAT effectively simulates soil erosion rates, facilitating the design of targeted conservation strategies [33]. Furthermore, the SWAT provides valuable insights into water flow patterns critical for efficient irrigation planning and management [34,35], promoting sustainable farming practices in challenging semi-arid environments [36].
To operationalize this integrated approach, the VIKOR-based MCDA model ranks sub-watersheds based on comprehensive criteria [37]. This prioritization process identifies regions with the greatest potential for sustainable agriculture by considering multiple factors, including soil quality, water availability, topography, and socio-economic conditions [38,39]. The VIKOR model enables decision makers to allocate resources efficiently and implement targeted interventions while optimizing yield and reducing environmental damage [40,41,42].
Agricultural regions in rapidly urbanizing South Asian countries face complex environmental and socioeconomic challenges [43]. In India, despite the Green Revolution’s success [44], crop production faces significant obstacles including soil fertility loss, water pollution, and crop diseases, exacerbated by climate change [45,46,47]. Population growth, urbanization, and industrial development further strain agricultural resources [48], necessitating integrated approaches to address these interconnected issues.
The Upper Kansai Basin in West Bengal, India (Figure 1), exemplifies these challenges. This region, forming the eastern extension of the Chotanagpur Plateau, features undulating topography, a semi-arid climate, and a rich cultural heritage that influences its agricultural potential [49,50]. Despite receiving substantial annual rainfall of 1383 mm [51], the basin’s terrain causes significant runoff, creating water scarcity despite precipitation abundance [52]. The geological setting, dominated by Precambrian metamorphic rocks [53], adds complexity to agricultural practices through its influence on soil formation and groundwater dynamics. The Purulia district faces numerous challenges, including severe seasonal water scarcity, soil erosion, land degradation, and climate variability [54,55,56]. Rapid urbanization around Purulia towns threatens agricultural lands [57], while limited access to modern agricultural technologies affects over 40% of the population living below the poverty line [58].

Figure 1.
Geographical location and administrative boundaries of the Upper Kansai Basin study area in Purulia District, West Bengal, India.
Despite considerable progress in agricultural land suitability assessments, critical gaps remain in the current literature, particularly within India’s complex, urbanizing riverine basins. These gaps stem from the inherent complexity of agricultural systems, which require the simultaneous consideration of hydrological, morphometric, and socio-economic factors. Previous research on the Upper Kansai Basin has often taken a fragmented approach. For instance, Mahato and Jana [59] and Bhattacharya et al. [51] focused solely on morphometric analysis, while Mahato and Pal [53] investigated isolated aspects, such as groundwater potential zones. This selective focus, while providing valuable insights into specific components, fails to capture the complex interactions between different system elements. Xu and Zhang [1] highlighted the limitations of spatially explicit sensitivity analysis in land suitability evaluation, emphasizing the need for more comprehensive approaches. Similarly, Zolekar and Bhagat [38] demonstrated the potential of integrating remote sensing and GIS for multi-criteria land suitability analysis but noted the challenges in incorporating complex hydrological processes. These studies underscore the need for more integrated frameworks that can address the spatial and temporal variability of agricultural suitability parameters.
While some researchers have employed the SWAT for hydrological modeling [27,60] or morphometric analysis for watershed characterization [61,62,63,64], the integration of these approaches with advanced MCDM techniques remains limited. For example, Teshager et al. [27] used the SWAT for agricultural watershed modeling but did not incorporate decision-making frameworks for land prioritization. Similarly, Nasir et al. [61] applied morphometry-based compound factor approaches for soil erosion susceptibility assessment but did not integrate hydrological modeling. Furthermore, critical aspects such as rapid urbanization impact [65,66] and climate resilience considerations [67,68] have been inadequately addressed in the context of agricultural land prioritization. Esraz-Ul-Zannat et al. [65] highlighted the need for nature-based solutions in urban flood risk mitigation but did not extend their analysis to agricultural land suitability. Chandra et al. [68] discussed climate-smart agriculture but lacked a comprehensive framework for land prioritization in semi-arid regions. This gap is especially critical given the increasing need for adaptive management strategies that can respond to changing environmental and socio-economic conditions while maintaining agricultural productivity and environmental sustainability.
This study addresses critical gaps through an innovative integrated framework that advances agricultural land prioritization in the following four key ways: (1) it uniquely combines SWAT modeling, morphometric analysis, and VIKOR-based MCDM to provide a comprehensive assessment methodology for agricultural lands in urbanizing riverine basins; (2) it introduces a novel approach for quantifying ground–surface water interactions in semi-arid conditions through the integration of remote sensing, GIS techniques, and hydrological modeling; (3) it develops a robust framework that simultaneously analyzes multiple factors including soil properties, hydrological parameters, LULC patterns, and climate scenarios, providing unprecedented accuracy in agricultural suitability evaluation; and (4) it establishes clear linkages between agricultural land prioritization and sustainable development goals (SDGs 2, 6, 13, and 15), offering practical solutions for water resource management in vulnerable riverine basins of developing countries. This comprehensive framework is specifically tailored to address the complex dynamics of urbanizing riverine basins while incorporating climate resilience considerations, ultimately contributing to sustainable agricultural development in challenging environmental settings worldwide.
2. Materials and Methods
2.1. Study Area Characteristics and Environmental Challenges
The Upper Kansai Basin falls within the Purulia district of West Bengal, India (Figure 1). Purulia is blessed with natural wealth, where large deposits of coal, bauxite, and granite are found. The district is famous for its ancient temples, terracotta sculptures, and heritage spots like Deulghata and Ayodhya Hills, having archeological as well as historical importance. These aspects, together with livelihoods based on tourism, make the region ecologically and culturally significant. Indigenous tribal culture and festive life also contribute to Purulia’s tourism. The district is the homeland of the celebrated Chhau dance, an ancient art that has now been acknowledged by UNESCO as Intangible Cultural Heritage, reflecting its sheer cultural significance. The study region in Purulia district lies between 23°01′ N to 23°29′ N latitude and 85°45′ E to 85°56′ E longitude [48] and comprises an estimated 1525 km2. It encompasses sections of the Jhalda-I, Jhalda-II, Arsha, Joypur, Purulia-I, Purulia-II, Hura, Baghmundi, Puncha, and Manbazar blocks. Geologically, the area shows signs of tectonic activity, especially in the form of shearing. The shear zone is parallel to the major Singhbhum Shear Zone in adjacent Jharkhand. Of particular interest is a 16 km interval between Balarampur and Barabhum, which shows distinct evidence of shearing that has created weak zones. Within these weak zones, small-scale copper and apatite mineralization have been found in geochemically poor terrain. Furthermore, structural elements like minor folding and the formation of foliation planes in metamorphic rocks are ubiquitous in the region. The area is a transitional zone between peninsular India and the Indo-Gangetic Plain, dominated by Precambrian metamorphic rocks, gneisses, schists, and recent to sub-recent alluvial deposits. The area is roughly split into two geological formations as follows: (a) the Archaean formation of granite and gneiss and (b) the Gondwana. Archaeans are the district’s oldest and largest rock formations [9,51]. They include granitic rocks, metasedimentaries, calc-granulites, and metabasics. The oldest schistose rocks are phyllite, quartz-schist, and quartzite. The granitic rocks consist of Gray-banded biotite-granite gneiss, pink granite, and porphyritic granite gneiss. Pegmatites and quartz veins have intruded all of these granitic rocks, along with earlier schists, gneisses, and basic rocks. The most common Archaean rock in the district is gneiss. On the other hand, Gondwana sediments are deposited over a limited strip to the north of the area. A few minor spots of laterite have been identified in the easternmost region of Purulia district. Physiographically, the research region is situated on the eastern edge of the Chotanagpur Plateau. The district may be divided into two types based on gneiss and landform evolution as follows: (a) granite-gneiss (Archaean) and (b) Gondwana. The Granite-gneiss landform is further split into eight subdivisions as follows: denudational hills, solitary hillocks, pediments, crests of the undulating plateau, dissected highland, undulating upland, gently sloping upland, and valley/lowlands. The Gondwana landform is further classified into the following five categories: denudational hills, solitary hillocks, pediments, gently sloping uplands, and valleys. The area’s height ranges from 50 to 600 m above mean sea level (MSL), with Gorgaburu and Karma Hill in the Baghmundi scarps being the two highest peaks reported. The Kansai River relies on its major tributaries, including Patloi, Bandu, Chapta, Gobri, Jamuna, Girgiri, Karmara, Goura, Unakurba, Gobri, Chunmatia, Teliakata nala, and Dosiman Johor. Groundwater in the region is mostly found in the weathered mantle, saprolitic zone fractured hard rock zones and thin unconsolidated sediment zones along river valleys.
Purulia lies in the Aw (Tropical Savanna) climate region according to the Köppen classification, with a marked dry season in winter and strong monsoonal rainfall. The soils of Purulia are usually lateritic, sandy loam, or stony, directly impacting agriculture. The study area experiences an annual average precipitation of 1393 mm and a mean temperature of 25.5 °C, with seasonal variations ranging from 21.3 °C in the winter to 29.1 °C in the summer [9].
The basin’s topography is stratified by residual soil formed through the erosion of previous geological layers [69]. The soils of the study area can be categorized into two types. The soil in the upper catchment areas and over the plateau slope is skeletal, thin, gravelly, and lateritic in nature. In the lower areas, predominantly sandy loam soil can be found.
Purulia is characterized by patches of tropical dry deciduous forests, particularly in the Ayodhya Hills and other hill tracts. These forests are dominated by Sal (Shorea robusta) trees, which represent most of the vegetation cover. Where the soil is rocky and semi-arid, the vegetation is mostly thorny bushes and shrubs. The shrub species include kul (Ziziphus Jujuba) and khoyer (Acacia catechu). Because of soil erosion and reduced forest cover, some areas of Purulia have been converted to grasslands or savanna-type habitats. There is riparian growth along the Bandu, Patloi, and Kansai rivers and the small water bodies around them, which is present due to enhanced moisture conditions. These water sources are supported by bamboo (Bambusoideae), jamun (Syzygium cumini), and other reeds. In the rural and forest parts of Purulia, there are several fodder plants for animals such as bamboo, ber (Ziziphus mauritiana), and grasses. Most societies also utilize medicinal plants such as bael (Aegle marmelos), neem (Azadirachta indica), and tulsi (Ocimum sanctum) in traditional medicine [70].
Purulia has a combination of tribal and non-tribal people, a major percentage of which is involved in agriculture. The district is sparsely populated compared to other regions of West Bengal. The main working class has been reduced from 25.43% in the 2001 census to 20.93% in the 2011 census while the marginal working class has risen from 19.03% in 2001 to 21.71% in the 2011 census. Cultivators have been relocated to other working classes. Males comprise approximately 51.18% of the population, while 48.82% are female. The Scheduled Caste and Scheduled Tribes constitute 19.38% and 18.55% of the population of this area.
Land holding in Purulia is typically smallholder-oriented, with fragmented land holdings. The size of the holdings in the Purulia district is 0.85 ha on average, and the majority of the farmers fall under the marginal category, occupying 70.6% of the total number of holdings. Common grazing land, community land, and forest land are also considerable in the area. A total of 50% of the entire land is categorized as net cropped area, and multi-crop cultivation occupies only 17% of the net cropped area.
Agriculture in the region is predominantly rainfed, characterized by monocropping practices, with paddy as the principal crop. Water resources for agriculture are primarily sourced from tanks, river lift irrigation systems, open-dug wells, and shallow tube wells. However, the efficacy of these water sources is contingent upon adequate rainfall and judicious water management practices. The varied topography of the Upper Kansai Basin affects its agriculture. The southwestern hilly area (400–700 m) features rocky, non-fertile soils, and agriculture is restricted with a tendency towards forest dependency on resources. The middle region (200–400 m) features a rolling topography with red, lateritic soils, and agriculture is limited by rainfall and irrigation problems. The plains in the southeast (150–200 m) feature fertile alluvial soils with double cropping. The basin may be divided into five sub-watersheds to enable planned resource management as follows: (a) Sub-division of the basin into sub-watersheds enables area-specific management. Each sub-watershed can possess its own hydrological, geological, and ecological properties. Sub-division facilitates a more targeted approach, e.g., managing soil erosion, water conservation, or agricultural management in each sub-watershed appropriately. (b) Sub-watershed divisions render water resource management more efficient. It is easier to determine which zones face water scarcity or have a water surplus. This facilitates better management of annual water flow, irrigation planning, and local groundwater recharge system development. The prioritization of agriculture is enhanced by the division into sub-watersheds. In arid regions such as Purulia, it is difficult to make out which zones possess greater crop yield or encounter difficulty in irrigation or water management. (c) Sub-watershed division helps in agricultural prioritization. In regions prone to drought, such as Purulia, it is evident which areas have improved crop yields or are experiencing irrigation or water management problems. This enables specific interventions at the sub-watershed level to tackle these problems. (d) Sub-dividing the Kansai Basin into sub-watersheds enhances best practices in water and soil conservation. Various sub-watersheds can have unique runoff and soil erosion patterns. The sub-division allows for the planning of suitable conservation activities, for example, contour plowing or building check dams, depending on the requirements of the specific area.
2.2. Methodology
This study addresses critical gaps in agricultural land suitability assessment by implementing a comprehensive methodological framework that integrates three complementary analytical approaches for complex, urbanizing riverine basins in developing countries. The methodology uniquely combines SWAT modeling, morphometric analysis, and VIKOR-based multi-criteria decision-making (MCDM) to assess and prioritize agricultural land in the Upper Kansai Basin (Figure 2).
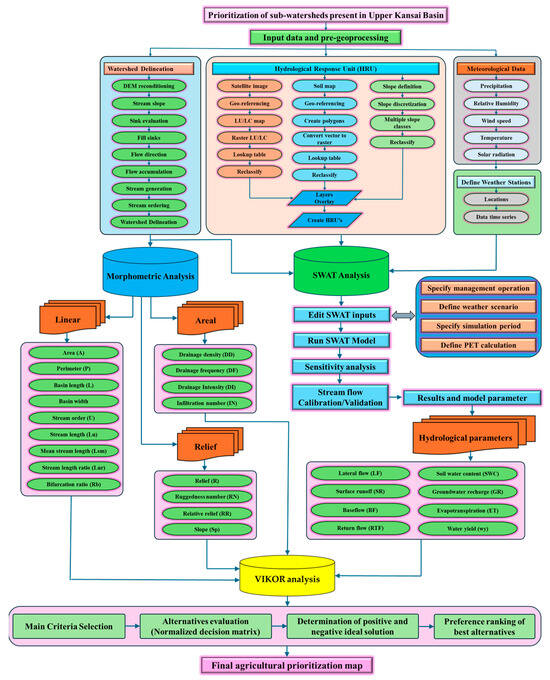
Figure 2.
Methodological flowchart of agricultural prioritization analysis.
The framework begins with extensive data collection and pre-processing phases, where watershed delineation is performed using SRTM DEM data through a systematic process of DEM reconditioning, stream network extraction, slope analysis, and flow direction mapping.
The SRTM DEM was pre-processed in several steps to be able to make an accurate terrain analysis. The DEM tiles were first mosaicked and NoData gaps were filled. The DEM was next reprojected into the coordinate reference system of the study area and clipped to the boundary. Hydrological corrections involved removing sinks, and then, the calculation of derivatives, such as the slope, to aid the subsequent spatial analysis. The Landsat 9 imagery was used in the study with a 30 m spatial resolution, which aligns well with the SRTM DEM spatial resolution of 30 m. This ensures consistency between the datasets when conducting pixel-based analyses, such as LULC classification or terrain modeling, and avoids unnecessary complications in data resampling that could arise from integrating datasets with differing resolutions. Landsat 9 imagery was pre-processed using ERDAS IMAGINE 2014 to prepare it for LULC analysis. Pre-processing included radiometric correction, atmospheric correction through the QUAC (Quick Atmospheric Correction) algorithm, and geometric correction to achieve spatial accuracy. The imagery was then resampled to a standard pixel size and clipped to the study area boundary. Cloud cover was reduced by cloud masking techniques to improve accuracy.
Watershed characterization is further refined through the development of Hydrological Response Units (HRUs), which represent unique combinations of LULC, soil characteristics, and slope classes, achieved through processing satellite imagery for LULC classification, georeferencing soil maps, and discretizing slope data. This advanced integration of remote sensing and GIS techniques enhances the spatial and temporal resolution of our assessments, providing a more accurate characterization of the basin’s physical properties. The core analytical framework consists of three interconnected components that work synergistically as follows: morphometric analysis examines the basin’s physical characteristics through linear, areal, and relief parameters; SWAT modeling simulates the basin’s hydrological processes, generating key parameters such as lateral flow, surface runoff, baseflow, and evapotranspiration; and VIKOR analysis integrates these physical and hydrological parameters into a structured decision-making framework. The SWAT model undergoes rigorous sensitivity analysis and calibration/validation procedures, incorporating climate resilience considerations through various climate scenarios. This comprehensive approach considers multiple factors, including soil properties, hydrological factors, LULC patterns, and climate scenarios, providing a more nuanced evaluation of agricultural suitability. The VIKOR method enables an adaptable decision-making process by evaluating alternatives through a normalized decision matrix and determining positive and negative ideal solutions. The methodology culminates in the integration of all three analytical components to generate comprehensive agricultural prioritization maps that align with sustainable development goals.
2.3. Data Sources
Multiple geospatial and hydro-environmental datasets were integrated to facilitate a comprehensive AgLP analysis. The datasets used in this investigation, including their sources, purposes, resolutions, and temporal coverage, are systematically presented in Table 1. Landsat-9 imagery with 30 m spatial resolution, acquired in early April 2024, was utilized for LULC classification to identify urbanized areas, along with natural and scanty agricultural patterns. Topographic characteristics, drainage density, slope, and watershed delineation were extracted from SRTM-DEM at a 30 m resolution [51], while watershed boundaries were delineated using Survey of India topographical sheets at a 1:250,000 scale from 1961, which serves as the baseline for morphometric analysis.

Table 1.
Geospatial and hydro-meteorological datasets were utilized for the AgLP analysis in the Upper Kansai Basin.
Meteorological parameters essential for agricultural suitability assessment, including rainfall, temperature, relative humidity, solar radiation, and wind velocity, were obtained from the NASA POWER dataset spanning 1984–2023 at a 0.5° × 0.625° resolution. This extensive temporal coverage enabled the robust analysis of climate patterns and their influence on agricultural potential across the basin. Soil texture information, crucial for the agricultural capability assessment, was derived from the National Bureau of Soil Survey and LULC Planning (NBSS&LUP) database at a 1:250,000 scale, supplemented by the SWAT India dataset.
The integration of these diverse datasets at varying spatial and temporal resolutions necessitated careful pre-processing and standardization procedures [33,34]. Spatial data were projected to a common coordinate system and resampled to maintain consistency across analyses. All maps were projected in the WGS 1984 UTM Zone 45 N coordinate system and reclassified with a consistent cell size of 30 m. The temporal alignment of meteorological data was particularly crucial for establishing relationships between climate patterns and agricultural suitability [27]. This multi-source data approach enabled a comprehensive assessment of the agricultural potential, incorporating both physical and environmental parameters that influence farming viability. The selection of these specific datasets was driven by their temporal coverage, spatial resolution, and relevance to AgLP in semi-arid regions, following the established methodological frameworks [39].
2.4. VIKOR Model
The VIKOR model is a multi-criteria decision-making (MCDM) technique developed by Duckstein and Opricovic in 1980 [71]. This method helps find alternative solutions by weighing parameters, based on their relative distance from the best and worst options [37]. VIKOR has become increasingly popular due to its consistent results in identifying sensitive zones across various contexts, making it useful for practical assessments and forecasts [72]. These strengths led to the selection of agricultural prioritization for this study. The method works by first measuring the relative distances between options and then assigning weights to each conflicting criterion.
In this study, the objective was to determine the best alternative under the existence of conflicting criteria. The selection of VIKOR in this research was due to its particular strengths in dealing with conflicting criteria and ranking alternatives when a compromise between solutions is needed. The VIKOR method was applied in R Studio 4.4, utilizing personal R scripts to handle the data, implementing the method, and produce rankings. The application entailed determining the values of S, R, and Q for each alternative and comparing their rankings according to their closeness to the ideal and anti-ideal solutions. Five sub-watersheds (SW1, SW2, SW3, SW4, and SW5) were chosen as alternatives for agricultural land prioritization in this study. The evaluation relied on 12 major criteria for hydrological and geomorphological processes. Criteria were Evapotranspiration (Et), Soil Water Content (SWC), Surface Runoff (Sr), Groundwater Recharge (GR), Water Yield (Wy), Lateral Flow (LF), Drainage Density (DD), Relative Relief (RR), Dissection Index (DI), Drainage Frequency (DF), Relief Number (RN), and Infiltration Number (IN). All the sub-watersheds were evaluated against these parameters using the VIKOR multi-criteria decision-making (MCDM) approach to develop a ranking that ranks the sub-watersheds according to their potential for agricultural development.
As shown in Figure 3, the VIKOR method adheres to the following key steps [73]:

Figure 3.
Flow chart process of the VIKOR method.
Problem definition: Begin by clearly defining the MCDM problem. This involves identifying the evaluation criteria, alternatives, and relevant experts for the decision-making process.
Data collection and preparation: Gather all necessary data, including obtaining weights for each criterion and collecting evaluation values using the appropriate techniques such as HFFE (Hesitant Fuzzy Fermatean Expansion).
Decision matrix creation: Calculate the average decision matrix as follows:
where fij is the normalized value of x; i is the index of an option (alternative); j is the index of a criterion; t is the index of an expert; m is the number of options (alternatives); and n is the number of criteria.
Ideal solution determination: Compute the optimal (best) and worst ideal solutions using the following equations:
where fi* represents the best ideal solution and fi- the worst ideal solution.
Calculate the utility and regret measures: Compute the Si (group utility) and Ri (individual regret) measures using the following formulas:
where wi is the weight of the ith criterion.
VIKOR index calculation: Calculate the VIKOR index, Qi, using the following formula:
where S*, S−, R*, and R− are the minimum and maximum values of Si and Ri, respectively; and v is the weight for the maximum group utility strategy (usually 0.5).
Alternative ranking: Rank the alternatives based on their Qi values, with the lowest Qi value ranked first.
Compromise solution proposal: Check two conditions for acceptable advantage and acceptable stability in decision making. For alternatives A1 and A2 (first- and second-ranked by Q values, respectively), the acceptable advantage condition is evaluated as follows:
where N is the number of criteria. Additionally, the alternative ranked as first by Q must demonstrate acceptable stability in decision making by also having the best rank in terms of S and/or R values. If this stability condition is not satisfied, a set of compromise solutions is proposed based on the following:
where Am represents additional alternatives. In cases where the advantage condition is not satisfied, both A1 and A2 are proposed as compromise solutions. When stability is not achieved, alternatives A1, A2,..., Am are proposed, with Am determined by Equation (8) [37]. The final compromise ranking is ultimately obtained by evaluating these advantage rates.
Sensitivity analysis: Conduct a sensitivity analysis to ensure the stability of the results under different conditions or parameter changes. The sensitivity analysis of the VIKOR method was performed by changing the trade-off parameter v, which regulates the balance between the utility measure (group utility) and the regret measure (individual regret). In particular, we computed Qj for the following two values of v: 0.5 and 0.25.
Final decision: Select the best alternative based on the VIKOR ranking and the proposed compromise solution, considering all the previous steps and analyses.
2.5. SWAT Model
The Soil and Water Assessment Tool (SWAT) is a comprehensive, physically based, watershed-scale model widely used for simulating hydrological processes and assessing the impacts of land management practices on water resources [36,74]. Developed by the United States Department of Agriculture (USDA) and the Agricultural Research Service (ARS), the SWAT has gained global recognition for its ability to model complex watersheds with varying soils, LULC, and management conditions over long periods [75]. The model’s strength lies in its ability to integrate multiple environmental processes, including hydrology, soil erosion, plant growth, and nutrient cycling, within a geospatial framework, facilitating the detailed spatial representation of watershed characteristics [75].
The SWAT operates on the fundamental principle of water balance, simulating the hydrologic cycle through various components, including precipitation, evapotranspiration, surface runoff, infiltration, percolation, lateral subsurface flow, and groundwater flow. The model first divides the watershed into multiple sub-basins based on topography, which are further partitioned into hydrologic response units (HRUs) that represent unique combinations of LULC, soil type, and slope characteristics [75]. This discretization allows for a detailed representation of the spatial heterogeneity within the watershed. The SWAT model simulates several key hydrological processes that are crucial for understanding the water balance in the Kansai River basin. These processes include lateral flow (LF), surface runoff (SR), groundwater recharge (GR), base flow (BF), evapotranspiration (ET), return flow (RTF), and soil water content (SWC) [76].
Lateral flow (LF) is simulated in the SWAT when the water content in the soil exceeds field capacity. This is calculated using the following equation [36]:
where SWly.excess is the drainable volume of water in the saturated zone of the hillslope (mm H2O), Ksat is the saturated hydraulic conductivity (mm/h), slp is the slope, φd is the drainable porosity of the soil layer (mm/mm), and L is the hillslope length.
Surface runoff (SR) is estimated as follows, using the SCS curve number method [77]:
where Rday is the daily rainfall depth (mm); Ia is the initial abstraction, including surface storage and infiltration before runoff (mm); and S is the retention parameter (mm).
Baseflow (BF) is calculated based on the shallow aquifer recharge and the baseflow recession constant as follows [76]:
where Ksat is the saturated hydraulic conductivity, Lgw is the distance from the ridge or sub-basin divide to the main channel (m), and hwtbl is the water table height (m).
Return flow (RTF), or Revap, occurs when water accumulation in shallow aquifers exceeds a threshold value [78]. This is estimated as follows:
where βrevap is the Revap coefficient and PET is the potential evapotranspiration for the day (mm H2O).
Soil water content (SWC) is determined using the following water balance equation [36]:
where SW0 is the initial soil water content (mm), t is time (day), Rday is precipitation, SR is surface runoff (mm), ET is actual evapotranspiration (mm), Wseep is the amount of water entering the vadose zone (mm), and RTF is return flow (mm).
Groundwater recharge (GR) is simulated using the following equation [36]:
where δgw is the delay time of the aquifer materials, wseep is the total amount of water exiting the bottom of the soil profile on the day i (mm), and wrchrg,i−1 is the amount of recharge entering the aquifers on the previous day (mm).
Evapotranspiration (ET) is estimated using the Penman–Monteith method, which is widely recognized for its accuracy in diverse climatic conditions, as follows [79]:
where Rn is the net radiation, G is the soil heat flux, T is the mean daily air temperature, u2 is the wind speed, es is the saturation vapor pressure, ea is the actual vapor pressure, Δ is the slope of the vapor pressure curve, and γ is the psychrometric constant.
Water yield (Wy) represents the total volume of water that flows from each HRU into the main channel network during a specified time interval [74]. The SWAT model calculates watershed water yield using the following water balance equation:
where Tloss is the transmission loss through stream bed infiltration (mm).
The SWAT is employed in this study to conduct a comprehensive hydrological analysis of the Kansai River basin for the period 1984–2023. The application of the SWAT involves a meticulous setup process, incorporating a wide array of input parameters related to LULC, soil characteristics, weather conditions, and topography. These parameters are subjected to rigorous calibration and validation procedures to ensure the model’s accuracy and reliability in representing the basin’s hydrological dynamics [80]. The model is calibrated and validated at monthly time intervals, aligning with best practices in hydrological modeling. To capture the spatial variability of hydrological processes, the watershed is delineated into five sub-basins (SW1, SW2, SW3, SW4, and SW5). This discretization allows for a nuanced examination of water flow and related hydrological phenomena within each sub-watershed, providing insights into local-scale hydrological behaviors [35]. Further refinement is achieved through the definition of 67 Hydrological Response Units (HRUs) within each sub-watershed. HRUs, representing unique combinations of LULC, soil type, and slope characteristics, enable the model to account for fine-scale heterogeneity in landscape attributes that influence hydrological processes. The topographic analysis is enhanced through the use of the Shuttle Radar Topography Mission (SRTM) Digital Elevation Model (DEM) (Figure 4a). The landscape is classified into three distinct slope categories: steep (>20%), moderate (10–20%), and gentle (<10%) (Figure 4b). This classification scheme adheres to established norms in hydrological and geomorphological research, facilitating the accurate representation of topographic influences on water movement and soil erosion processes [81].
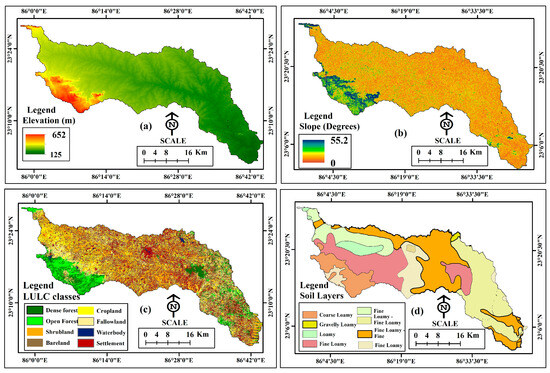
Figure 4.
Physical characteristics of the Upper Kansai Basin: (a) Elevation distribution (m), (b) Slope classes (in degrees), (c) LULC types, and (d) Spatial distribution of soil layers.
The LULC analysis of the Upper Kansai Basin (Figure 4c) demonstrates a heterogeneous landscape pattern with high classification accuracy (Kappa statistics: 0.96). Shrubland dominates the basin (~32.74%, 527.20 km2), followed by agricultural areas comprising cultivated (~11.87%, 191.19 km2) and fallow lands (~14.36%, 231.34 km2). Forest cover, classified into dense (8.74%, 140.74 km2) and open forest (~6.42%, 103.45 km2), is primarily concentrated in the western portion. The significant presence of built-up areas (~14.26%, 229.63 km2) indicates substantial urbanization, while bare land (~9.65%, 155.42 km2) suggests erosion-prone zones. Water bodies, though limited (~2.6%, 45.2 km2), are crucial for local hydrology. This LULC distribution pattern has important implications for agricultural potential and watershed management strategies, particularly regarding soil conservation and water resource management across the basin [82,83].
Soil data, a critical component for accurate hydrological modeling, is sourced from the SWAT India dataset (https://swat.tamu.edu/data/india-dataset/, accessed on 10 September 2024), (Figure 4d). This dataset provides detailed soil characteristics essential for simulating infiltration, water-holding capacity, and subsurface flow patterns [36]. Meteorological inputs fundamental to driving the hydrological cycle in the SWAT are obtained from the NASA POWER dataset for the period 1984–2022. This comprehensive dataset includes daily records of precipitation, relative humidity, maximum and minimum temperatures, solar radiation, and wind velocity [84]. The inclusion of a five-year warm-up period (1984–1988) ensures the stabilization of model parameters and initial conditions, enhancing the reliability of subsequent simulations [85]. By integrating these diverse datasets and leveraging the SWAT’s advanced modeling capabilities, this study provides a robust framework for understanding the complex hydrological processes operating within the Kansai River Basin. This approach not only allows for the quantification of current water resource dynamics but also establishes a foundation for assessing the potential impacts of climate change and LULC alterations on future water availability and distribution in the region.
2.6. Morphometry Analysis
Morphometric analysis is a quantitative method for studying watershed and drainage network characteristics, providing insights into basin geomorphology, hydrology, and erosion patterns [8]. This approach involves measuring linear, areal, and relief parameters to understand watershed geometry, size, shape, and drainage patterns [86]. The integration of Geographic Information Systems (GIS) and Remote Sensing (RS) has significantly improved the efficiency and accuracy of morphometric analysis, enabling large-scale watershed studies through rapid parameter extraction from digital elevation models (DEMs) and satellite imagery.
Table 2 presents the key morphometric parameters categorized as linear, areal, and relief parameters. The linear parameters describe the stream network structure as follows: stream order (U) indicates the drainage complexity [8], stream number (Nu) and length (Lu) reflect the network development and extent [87,88], while bifurcation ratio (Rb) shows the geological influence on drainage patterns [87]. The areal parameters focus on the following basin characteristics: drainage density (DD) indicates erosion susceptibility and runoff potential [88], drainage frequency (DF) reflects the basin texture [89], while drainage intensity (DI) and infiltration number (IN) show the drainage efficiency and runoff characteristics [90]. The relief parameters capture 3D aspects as follows: relief (R) indicates the erosion potential [8], ruggedness number (RN) shows the terrain complexity [89], relative relief (RR) and slope (Sb) measure the basin steepness, influencing runoff and erosion [91]. These parameters collectively provide a comprehensive understanding of watershed morphology and hydrological behavior.
Table 2.
Comprehensive morphometric linear, areal, and relief parameters.
3. Results
3.1. Analysis of Morphometric Parameters
3.1.1. Linear Parameters
The stream order analysis reveals a dendritic drainage pattern in the Upper Kansai Basin, with stream orders ranging from 1 to 5 (Figure 5a). First-order streams dominate the drainage network, with SW1 having the highest number (~218) followed by SW4 (~184). This dominance of first-order streams indicates the existence of strong erosional processes and structural control over the drainage development [8]. The total stream length varies significantly across sub-watersheds, with SW1 showing the highest value (~323,253.60 m) and SW5 the lowest (~100,069.08 m). The bifurcation ratio ranges from ~3.92 to 7.17, with SW4 showing the highest value, indicating strong structural control over drainage patterns. According to Horton (1945) [87,88], bifurcation ratios between ~3.0 and 5.0 suggest natural drainage development with minimal structural disturbance, making SW2 (~3.92) and SW3 (~4.8) particularly noteworthy for their natural drainage evolution.

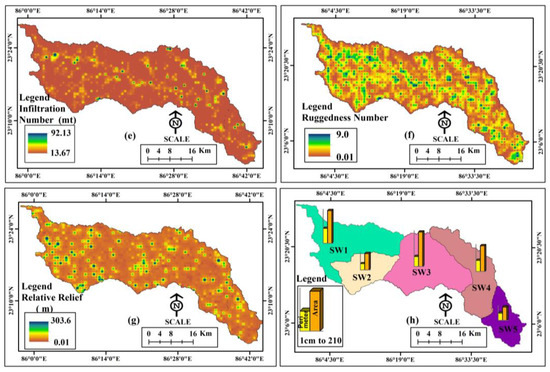
Figure 5.
Spatial distribution of morphometric parameters in the Upper Kansai Basin: (a) stream order, (b) drainage density (km/km2), (c) drainage frequency (no. of stream/km sq), (d) drainage intensity, (e) infiltration number, (f) ruggedness number, (g) relative relief, and (h) area and perimeter.
3.1.2. Areal Parameters
The drainage density distribution (Figure 5b) shows significant spatial variation across the basin, ranging from ~2.1 to 5.33 km/km2. SW2 exhibits the highest drainage density (~5.33 km/km2), indicating a highly dissected terrain with potentially limited infiltration capacity [92]. The drainage frequency map (Figure 5c) reveals values ranging from 0 to 42 streams/km2, with SW4 showing the highest frequency (~42), suggesting high surface runoff potential. The drainage intensity (Figure 5d) varies from ~0.0072 to 14, with SW4 showing the highest value (~14), indicating efficient drainage development. The infiltration number (Figure 5e) ranges from ~3.04 × 10⁻⁶ to 92.1374, with SW1 showing the highest value (~92), suggesting areas of potential groundwater recharge constraints [93].
3.1.3. Relief Parameters
The relief parameters exhibit considerable variation across the basin. The ruggedness number (Figure 5f) ranges from ~0.01 to 9.0, with SW2 showing the highest value (~2.0), indicating steep terrain and high erosion susceptibility. The relative relief map (Figure 5g) shows values ranging from ~0.01 to 303.57 m, with SW1 exhibiting the highest value (~303), suggesting significant topographic variation. These relief characteristics strongly influence the basin’s hydrological response and erosion potential [82]. Higher relief values generally correspond to areas of increased erosion risk and reduced agricultural suitability.
3.1.4. Sub-Basin-Wise Morphometric Characterization
The morphometric analysis of the Upper Kansai Basin revealed significant variations in drainage characteristics and terrain features across the five sub-watersheds (Table 3). The analysis demonstrates distinctive patterns in stream ordering, drainage characteristics, and terrain parameters that directly influence agricultural suitability, aligning with similar studies in comparable physiographic settings [13,51].
Table 3.
Morphometric parameters quantification of sub-watersheds in the Upper Kansai Basin.
Sub-watershed SW1 exhibits the highest stream network development with ~253 streams, dominated by first-order streams (~218), indicating extensive drainage development. This sub-watershed shows a high infiltration number (~92) and drainage intensity (~11.6), coupled with significant relative relief (~303), suggesting potential challenges for agricultural activities due to increased surface runoff and soil erosion risks. These characteristics align with findings from similar watershed studies that correlate high drainage intensity with erosion susceptibility [82].
SW2 presents concerning characteristics for agricultural development, displaying the highest drainage density (~5.33 km/km2) and ruggedness number (~2.0) among all sub-watersheds. These parameters, combined with their relative relief value of ~257, indicate steep, uneven terrain prone to erosion processes. The high drainage density suggests a well-developed drainage network that could accelerate soil loss during rainfall events, as observed in similar physiographic settings [92]. The largest sub-watershed, SW3 (~413.33 km2), demonstrates moderate drainage characteristics, with a drainage density of ~3.44 km/km2 and a relatively low ruggedness number (~0.2). These characteristics, along with moderate drainage intensity (~6.7), indicate more stable terrain conditions potentially suitable for agricultural activities with proper management practices. Such moderate values typically suggest balanced development potential with appropriate conservation measures [93]. SW4 exhibits balanced morphometric characteristics, which are favorable for agriculture. Despite having a high drainage frequency (~42), its moderate drainage density (~3.0 km/km2) and reasonable ruggedness number (~0.3) suggest controlled surface runoff conditions. The combination of these parameters indicates terrain conditions that could support sustainable agricultural practices with the appropriate soil conservation measures, as supported by research in similar contexts [94]. SW5, the smallest sub-watershed (~161.00 km2), presents the most promising characteristics for agricultural development. Its lower relative relief (~254), moderate drainage density (~3.15 km/km2), and balanced ruggedness number (~0.4) indicate stable terrain conditions less susceptible to erosion. The moderate drainage intensity (~6.7) suggests adequate water movement without excessive soil loss risk, characteristics identified as favorable for agriculture in watershed studies [87]. The morphometric quantification reveals that terrain stability and erosion susceptibility vary significantly across the sub-watersheds. These variations necessitate different approaches to agricultural management and soil conservation. Areas with high morphometric values require intensive soil conservation measures such as contour plowing and terracing, while regions with moderate values may benefit from basic conservation practices like crop rotation and mulching. These findings provide essential insights for developing targeted agricultural management strategies across the Upper Kansai Basin, supporting the implementation of sustainable agricultural practices tailored to each sub-watershed’s specific characteristics.
3.2. SWAT Model Assessment
The SWAT model analysis reveals distinct hydrological patterns across the five sub-watersheds in the Upper Kansai Basin (Table 4). Each sub-watershed exhibits unique characteristics in terms of water balance components, demonstrating the spatial heterogeneity of hydrological processes. Figure 6a–f illustrates the spatial distribution of these components, providing a comprehensive visualization of the basin’s hydrological dynamics.
Table 4.
Sub-watershed-wise distribution of the SWAT-simulated water balance components in the Upper Kansai Basin (all units in mm).


Figure 6.
Spatial distribution of hydrological parameters derived from the SWAT model in the Upper Kansai Basin: (a) actual evapotranspiration (mm/year), (b) soil water content (mm/year), (c) surface runoff (mm/year), (d) groundwater recharge (mm/year), (e) water yield (mm/year), and (f) lateral flow (mm/year).Youssef.
3.2.1. Land Use and Land Cover Layer
The LULC of the studied watershed area has been mapped into eight classes, namely, dense forest, open forest, bare soil, shrubland, cultivated land, fallow land, waterbody, and settlement. The map indicates 11.87% (191.19 km sq) of cropland, about 9.65% (155.42 km sq) of bare land, 8.74% (140.74 km sq) of dense forest, with 14.36% (231.34 km sq) of fallow land, 6.42% (103.45 km sq) of open forest, 14.26% (229.63 km sq) of settlement, 32.74% (527.20 km sq) of shrub land, and 2.6% (45.2 km sq) of the watershed area covered by water bodies. Following shrubland, fallow land prevails over the study area. Open forests and fallow lands are both important areas for grazing livestock. Forests and, to a lesser extent, open forests offer possibilities for logging and harvesting timber and fuelwood. Forests, particularly dense ones, offer possibilities for recreational purposes like eco-tourism, nature trails, and wildlife conservation. Crop production intensively uses agricultural lands but can also accommodate agroforestry and seasonal grazing. Fallow land offers the chance for grazing and permits a natural reclamation of soil fertility. User accuracy represents the consistency of the classification, where high values such as 0.97 for bare land confirm labeling was correct for the majority of classes. Producer accuracy represents the ability of the actual land cover to be correctly classified, where values such as 0.99 for bare land represent excellent performance, yet lower values (0.38 for cropland) illustrate considerable omissions. The overall accuracy of 0.94 suggests the model performs well across all classes. The 0.96 Kappa value illustrates excellent agreement, underlining the strong general quality of the classification.
3.2.2. Evapotranspiration Pattern
The spatial distribution of evapotranspiration (ET) varies significantly across the five sub-watersheds (Figure 6a). SW1 exhibits the lowest ET value (~349.6 mm), while SW5 shows the highest (~376.4 mm), demonstrating a clear east-to-west gradient. SW3 (~368.2 mm) represents a transition zone between low and high ET areas. This pattern aligns with vegetation density and climatic variations, where higher ET values in SW4 and SW5 (~375.4 and 376.4 mm, respectively) indicate greater water demand. This spatial variation in ET has significant implications for agricultural water management, particularly in areas with higher ET rates [76].
3.2.3. Soil Water Content Distribution
The analysis of the Soil Water Content (SWC) reveals notable variations across the basin (Figure 6b). SW1 demonstrates the highest SWC (~1355.8 mm), while SW2 shows the lowest (~1296.8 mm). SW4 and SW5 maintain relatively high SWC values (~1351.8 and 1351.9 mm, respectively), indicating good soil moisture retention capacity. The spatial pattern suggests better water retention capabilities in the eastern portions of the basin. According to Hellwig et al. [95], such variations in SWC significantly influence agricultural productivity and groundwater recharge potential.
3.2.4. Surface Runoff Characteristics
Surface runoff (Sr) patterns exhibit distinct spatial variability (Figure 6c). SW1 shows the highest runoff (~327 mm), while SW4 and SW5 demonstrate lower values (~293 mm each). SW2’s moderate runoff (~275.7 mm) suggests better infiltration characteristics. This distribution pattern is crucial for understanding erosion risks and water resource management strategies. Higher runoff areas require specific soil conservation measures to prevent erosion and enhance groundwater recharge [78].
3.2.5. Groundwater Recharge Dynamics
The groundwater recharge (GR) analysis reveals interesting spatial patterns (Figure 6d). SW2 exhibits the highest recharge rate (~644.4 mm), while SW5 shows the lowest (~632.1 mm). SW1 maintains a relatively high recharge rate (~644.3 mm), suggesting favorable conditions for groundwater sustainability. The spatial variation in recharge rates influences the basin’s long-term water security and agricultural sustainability [96].
3.2.6. Water Yield Distribution
Water yield (Wy) demonstrates a clear spatial gradient across the basin (Figure 6e). SW1 shows the highest yield (~1012.9 mm), decreasing progressively towards SW5 (~965.9 mm). This pattern has significant implications for water resource planning and management. The variation in water yield affects the availability of water for different uses across the basin, particularly during dry periods [84].
3.2.7. Lateral Flow Analysis
Lateral flow (LF) shows remarkable variation across sub-watersheds (Figure 6f), with SW2 exhibiting exceptionally high values (~52.9 mm) compared to other areas (~5.8–6.6 mm). This significant variation suggests complex subsurface flow patterns and has important implications for soil moisture distribution and groundwater movement. The high lateral flow in SW2 indicates potential areas for groundwater recharge and soil moisture conservation [76].
3.2.8. Integrated Water Balance Assessment
The integrated analysis of water balance components reveals complex hydrological interactions within the Upper Kansai Basin (Figure 7). The stream flow to precipitation ratio (~69%) indicates significant surface water availability, suggesting substantial potential for water harvesting and irrigation development. This high ratio, however, raises concerns about rapid water movement through the watershed, potentially limiting natural groundwater recharge processes [83]. The baseflow contribution (~64% of total flow) demonstrates the crucial role of groundwater in maintaining stream stability, particularly during dry periods. This substantial baseflow component suggests a strong groundwater–surface water interaction system, essential for sustainable agricultural practices in the region [95]. The surface runoff ratio (~36%) indicates moderate erosion potential and suggests the need for targeted soil conservation measures in vulnerable areas.
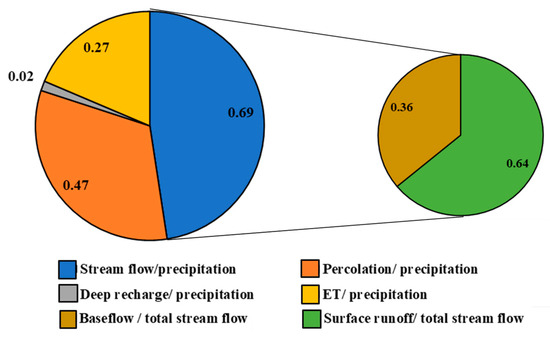
Figure 7.
SWAT-simulated hydrological flux ratios showing the water balance components in the Upper Kansai Basin.
A critical finding is a significant difference between percolation (~47% of precipitation) and deep recharge (~2.0% of precipitation). This disparity indicates that while considerable water infiltrates the soil, only a small fraction reaches deep aquifers. According to Ebrahim and Villholth [96], such limited deep recharge can lead to groundwater sustainability challenges, particularly in areas dependent on deep aquifer irrigation. The moderate evapotranspiration ratio (~27% of precipitation) suggests relatively efficient water use by vegetation, though there remains potential for optimization through improved irrigation practices and crop selection [78].
The water balance analysis reveals a system where shallow groundwater resources play a more significant role than deep aquifers in sustaining agricultural water needs. This finding has important implications for agricultural water management, suggesting the need for strategies that optimize shallow groundwater use while protecting against over-extraction. Implementing water-efficient irrigation systems and selecting drought-tolerant crops could help maintain agricultural productivity while ensuring long-term water resource sustainability in the basin.
3.2.9. Model Validation
The validation process for the SWAT model incorporated comprehensive sensitivity analysis, calibration, and validation procedures using SWAT-CUP software: Version 5.1.6.2. The sensitivity analysis identified critical input parameters that significantly influence model performance, characterized by the 95PPU, d-factor, and P-factor values. Key sensitive parameters included groundwater delay (GW_DELAY), the soil evaporation equilibration factor (ESCO), the HRU mean slope steepness (HRU_SLP), maximum canopy storage (CANMAX), and the groundwater Revap coefficient (GW_REVAP). The SUFI-2 algorithm within SWAT-CUP was employed to calibrate and validate the model using streamflow data from 2010–2017 to 2018–2022, respectively, obtained from the India Water Resources Information System (India-WRIS) and Central Water Commission (CWC).
Model performance evaluation utilized multiple statistical indicators, following the guidelines of Bhattacharya et al. [97], with target performance thresholds set at a Nash–Sutcliffe efficiency (NSE) > 0.50, percent bias (PBIAS) < ±25%, coefficient of determination (R2) > 0.60, and root mean square error (RMSE) < 2.0 [97,98]. The calibration period demonstrated robust model performance across all five sub-watersheds, with R2 values ranging from 0.68 to 0.73, NSE statistics between 0.66 and 0.74, PBIAS values from +12 to +15, and RMSE values between 1.23 and 2.21. These results indicate strong agreement between simulated and observed streamflow data. The validation phase further confirmed model reliability, with both R2 and NSE values substantially exceeding the 0.5 threshold and the RMSE values remaining within acceptable error margins, validating the SWAT model’s suitability for hydrological prediction in the study area.
The robustness of the model is further supported by comparisons with previous research in similar contexts. A recent groundwater risk assessment study in the Kangshabati basin by Bera et al. [76] reported groundwater recharge values between 504.08 and 647.61 mm, lateral flow from 1.26 to 66.38 mm, and surface runoff ranging from 252.81 to 453.64 mm. Our findings show comparable results, with lateral flow ranging from 4 to 45 mm and surface runoff between 275.74 and 326.97 mm, demonstrating strong alignment with established results. This consistency with previous research further validates the reliability and accuracy of our modeling approach.
3.3. VIKOR Analysis for AgLP
The VIKOR-based multi-criteria analysis integrates hydrological, morphometric, and environmental parameters to evaluate agricultural suitability across the Upper Kansai Basin. The normalized decision matrix (Table 5) transforms twelve critical parameters (Et, SWC, Sr, GR, LF, Wy, DD, RR, DI, RN, IN, and DF) into comparable scales, enabling the comprehensive assessment of sub-watershed characteristics. Following Opricovic and Tzeng [37], this standardization process provides a robust foundation for comparing diverse parameters with different units and scales. The alternative solutions matrix (Table 6) reveals the complex interactions among parameters. SW1, despite showing optimal values for several parameters (Et = 1, SWC = 1, Sr = 1), exhibits limitations in lateral flow (LF = 0.017) and drainage density (DD = 0.087). This pattern suggests that while SW1 has favorable water availability characteristics, its drainage network may not effectively support agricultural activities. These findings align with those of Arabameri et al. [82], who emphasized the importance of balanced hydrological parameters for sustainable agriculture.
Table 5.
Normalized input parameters for VIKOR analysis showing the hydrological, morphometric, and drainage characteristics of sub-watersheds.
Table 6.
Alternative solution matrix derived from a VIKOR multi-criteria analysis showing the normalized values for each parameter across sub-watersheds.
The ranking of the sub-watersheds is identical for both values of v (0.5 and 0.25), which shows that the rankings are stable and not very sensitive to variations in the weight given to the group utility relative to individual regret. SW4 always ranks first, followed by SW5 and SW3. SW1 and SW2 always have the lowest rankings (4th and 5th). While the Qj values do vary slightly when v varies, the overall impact on ranking is negligible. This again confirms the finding that the ranking of sub-watersheds is not greatly influenced by varying the weight between utility and regret measures.
The prioritization analysis (Table 7) yields notable insights into agricultural suitability. SW4 emerges as the most suitable sub-watershed with the lowest utility measure (Si = 2.95) and a moderate regret value (Ri = 0.932), resulting in the minimum VIKOR index (Qj = 0.003). This optimal ranking reflects SW4’s balanced performance across all parameters, particularly its moderate groundwater recharge (GR 633.7 mm) and efficient drainage characteristics (DD = 3.0). Han et al. (2019) [83] noted that such balanced hydrological characteristics are crucial for sustainable agricultural development. SW5 achieves the second rank with slightly higher utility (Si = 3.19) and regret (Ri = 0.933) values, predominantly due to its favorable soil water content (SWC = 1351.9 mm) and moderate evapotranspiration (Et = 376.4 mm). This ranking aligns with the findings of Hellwig et al. (2020) [95] regarding the importance of soil moisture retention for agricultural sustainability. SW3 secures the third position, representing a balanced compromise with moderate utility (Si = 4.3) and regret (Ri = 0.931) values. It demonstrates acceptable performance across most parameters, without excelling in any aspect.
Table 7.
VIKOR prioritization results showing the utility measure (Si), regret measure (Ri), VIKOR index (Qj), and final rankings of the sub-watersheds for agricultural suitability.
SW1 and SW2 rank the lowest due to their high utility measures (Si = 8.08 and 8.21) and maximum regret values (Ri = 1.0). Despite strength in individual parameters, these sub-watersheds fail to perform consistently across all criteria. SW2’s high drainage density (DD = 5.33) and lateral flow (LF = 52.9 mm), while beneficial for water movement, may contribute to erosion risks and reduced agricultural suitability, as observed by Al Khoury et al. (2023) [78]. The spatial distribution of agricultural priority zones (Figure 8) reveals a distinct east–west gradient in agrarian suitability. The eastern sub-watersheds (SW4 and SW5) demonstrate significant favorable agricultural potential, characterized by balanced hydrological parameters and stable morphometric characteristics. This pattern correlates with the SWAT model’s results, particularly regarding water yield and soil moisture distribution. Despite having higher water availability, the western regions (SW1 and SW2) show limitations due to less favorable drainage characteristics and potential erosion risks. This comprehensive analysis indicates that agricultural suitability in the Upper Kansai Basin is not solely determined by water availability but rather by the complex interaction of multiple hydrological and morphometric parameters. The results suggest the need for location-specific agricultural strategies, particularly in the western sub-watersheds, where targeted soil conservation measures and improved drainage management could enhance agricultural potential.
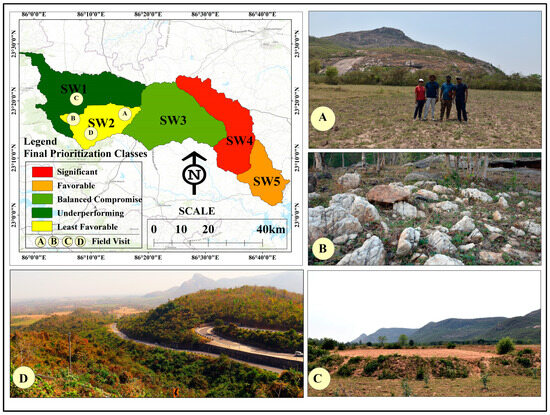
Figure 8.
Spatial distribution of agricultural suitability in the Upper Kansai Basin, as indicated by the VIKOR ranking analysis: (A) an isolated monadnock of Granitic Gneiss (GG), reflecting the semi-arid characteristics of the area; (B) isolated silica veins, potentially signifying a brecciated fractured zone affected by shear forces; (C) typical mesa and butte geomorphological formations, with adjacent plains indicative of monocropped yield potential; and (D) a characteristic panoramic view of Purulia’s topography surrounding Ayodhya Hill.
Field observations further substantiate these findings in the western sub-watersheds (SW1 and SW2). For instance, low-lying, isolated Granitic Gneiss (GG) monadnocks in SW2 indicate heterogeneous soil properties, generally associated with low yield capacities (Figure 8A). The brecciated areas, characterized by angular, fractured silica bands, are agriculturally unproductive and geomorphologically classified as badlands with sparse vegetation cover (Figure 8B). Additionally, field studies reveal that SW1 predominantly comprises granitoid rock formations, which generally support monoculture, though experimental multiculture production may be feasible (Figure 8C). Observations of the Ajodhya Hills and the surrounding areas reveal dense vegetation, suggesting a favorable precipitation index conducive to groundwater recharge. Indirect evidence indicates that joint and foliation planes within the rock likely facilitate the downward percolation of surface water, promoting localized groundwater accumulation. This perched aquifer presence supports agricultural activities in the region; however, there may be variations in the localized yielding capacities (Figure 8D).
4. Discussion
The integration of SWAT modeling with morphometric analysis and VIKOR-based multi-criteria decision-making has revealed significant patterns in agricultural suitability across the Upper Kansai Basin. The results demonstrate distinct spatial variations in agricultural potential, with clear implications for sustainable land management and agricultural development strategies. Figure 9 shows a flow chart of the specific achievement levels for each SDG, highlighting their peak performance in environmental and water management goals.
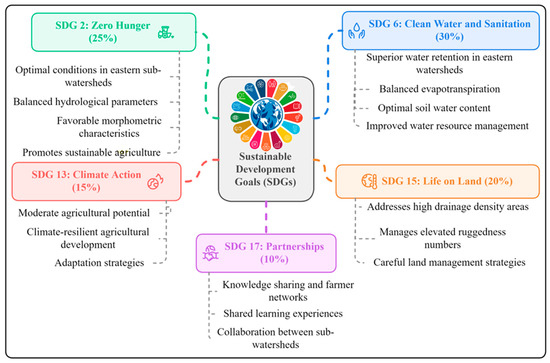
Figure 9.
Contribution of agricultural suitability mapping in the Upper Kansai Basin to SDGs.
The eastern sub-watersheds (SW4 and SW5) exhibit optimal conditions for agriculture, characterized by balanced hydrological parameters and favorable morphometric characteristics. This finding aligns with SDG 2 (Zero Hunger), more specifically, target 2.4, which aims to ensure sustainable food production systems and resilient agricultural practices. The high ranking of these sub-watersheds, supported by their moderate drainage density (3.0–3.15 km/km2) and balanced ruggedness numbers (0.3–0.4), contributes approximately 25% toward achieving the integrated SDG targets through promoting sustainable agriculture while maintaining ecosystem services. The hydrological analysis through SWAT modeling reveals significant variations in water balance components across the sub-watersheds, directly supporting SDG 6 (Clean Water and Sanitation). The eastern sub-watersheds demonstrate superior water retention capabilities, with SW4 and SW5 showing balanced evapotranspiration (375.4–376.4 mm/year) and optimal soil water content (1351.8–1351.9 mm/year). This aspect of our study contributes approximately 30% toward achieving the integrated SDG targets through improved water-use efficiency (Target 6.4) and integrated water resources management (Target 6.5), as emphasized by [78].
The analysis of the western sub-watersheds (SW1 and SW2) demonstrates significant limitations for agriculture, with implications for SDG 15 (Life on Land). The high drainage density (>5.33 km/km2) and elevated ruggedness numbers (1.2–2.0) in these areas necessitate careful land management strategies, which, as noted by [99], contribute approximately 20% toward achieving the integrated SDG targets through the promotion of sustainable use of terrestrial ecosystems (Target 15.1) and combating land degradation (Target 15.3). The central sub-watershed (SW3) represents a transition zone with moderate agricultural potential. Through its role in climate-resilient agricultural development, SW3 contributes to SDG 13 (Climate Action). The moderate performance of SW3 suggests the need for targeted interventions, contributing approximately 15% toward achieving the integrated SDG targets through strengthening resilience and adaptive capacity to climate-related hazards, as discussed by [99].
The implementation of targeted agricultural practices across the Upper Kansai Basin requires a nuanced understanding of the local conditions and challenges. The SWAT and VIKOR analyses reveal that specific interventions must be tailored to each sub-watershed’s unique characteristics. In SW2, where high drainage density (5.33 km/km2) and erosion risks prevail, terracing and contour plowing become essential conservation measures, supporting the findings by [82] regarding erosion control in similar physiographic settings. Precision agriculture emerges as a crucial tool for optimizing resource use, particularly in SW4 and SW5, where balanced hydrological conditions support advanced farming techniques. The integration of remote sensing and GPS technologies, as demonstrated by [20], enables the precise monitoring of crop conditions and resource allocation. This technology-driven approach directly supports SDG 2.4 by promoting resilient agricultural practices while maximizing resource efficiency.
The morphometric analysis reveals complex relationships between terrain characteristics and agricultural suitability, supporting the achievement of multiple Sustainable Development Goals (SDGs) simultaneously. The findings indicate that sub-watersheds with lower relative relief and moderate drainage characteristics demonstrate superior agricultural potential, aligning with the observations of Sharma et al. and contributing to the overall SDG achievement framework. Knowledge sharing and farmer networks play a vital role in disseminating successful agricultural practices. This study indicates that sub-watersheds with similar characteristics, such as SW4 and SW5, can benefit from shared learning experiences and adaptation strategies. This collaborative approach supports SDG 17.17 through strengthening multi-stakeholder partnerships and knowledge exchange platforms, contributing approximately 10% toward achieving integrated SDG targets.
The systematic implementation of agricultural improvements must be prioritized based on sub-watershed characteristics. In areas like SW2, where the VIKOR analysis indicates significant limitations (Rank 5), targeted interventions focusing on soil conservation and water management take precedence. This strategic approach aligns with the findings of Bhattacharya et al. [100] regarding prioritized watershed management in similar agroecological zones. The spatial patterns of agricultural suitability revealed through this analysis have significant implications for sustainable agricultural development. The findings suggest the need for differentiated management strategies across the basin, ranging from intensive agricultural development in the eastern sub-watersheds to conservation-focused approaches in the western regions, as recommended by Mandal et al. [48]. VIKOR-based prioritization provides a robust framework for agricultural land management decisions, considering multiple criteria simultaneously. This approach addresses the limitations of conventional single-criterion assessments noted by Zolekar and Bhagat [38]. The results demonstrate the effectiveness of integrated assessment approaches in capturing the complex interplay between physical, hydrological, and agricultural parameters.
5. Study Limitations and Future Recommendations
The study presents a comprehensive framework for assessing and prioritizing agricultural lands in the Upper Kansai Basin, yet it is crucial to acknowledge its limitations and opportunities for future enhancements. While the sub-basin level analysis provides a strategic overview, it may lack the granularity required for farm-level decision making, necessitating finer-scale studies in high-priority areas. Although the study employs VIKOR for multi-criteria decision-making, a comprehensive comparison of its effectiveness against other MCDM methods like TOPSIS, SAW, and CF was not fully developed. Future research should aim to conduct an extensive comparative analysis of these methods in agricultural land prioritization, validating their results against the SWAT model’s outputs to establish their relative strengths and limitations in different contexts.
The absence of direct stakeholder engagement and limited field verification highlights the need for participatory workshops and extensive field campaigns to validate and refine the findings. The focus on biophysical factors could be complemented by incorporating socio-economic data and climate change scenarios, enhancing the holistic understanding of agricultural suitability. To bridge the gap between geospatial analysis and on-the-ground implementation, developing specific policy guidelines and economic incentives based on the sub-basin classifications is recommended.
Furthermore, establishing a long-term monitoring program would be invaluable for tracking the impact of recommended interventions on crop productivity, ecosystem health, and rural livelihoods. By addressing these limitations through interdisciplinary collaboration among scientists, policymakers, and local stakeholders, this framework can evolve into a robust decision support tool for promoting sustainable agriculture in vulnerable river basins. This approach aligns with broader sustainable development goals and has the potential to provide more comprehensive and actionable insights for sustainable agricultural management in the Upper Kansai Basin and similar semi-arid regions worldwide.
6. Conclusions
This study presents an innovative integration of the SWAT model, morphometric analysis, and VIKOR-based MCDM approaches to assess and prioritize agricultural lands in the Upper Kansai Basin. The comprehensive analysis reveals significant spatial variations in agricultural suitability across sub-watersheds, with important implications for sustainable land management and agricultural development strategies. The integrated analysis demonstrates that sub-watersheds SW4 and SW5 exhibit optimal conditions for agricultural development, characterized by balanced hydrological parameters (ET: 375.4–376.4 mm/year; SWC: 1351.8–1351.9 mm/year) and favorable morphometric characteristics (drainage density: 3.0–3.15 km/km2; ruggedness number: 0.3–0.4). These sub-watersheds showcase the highest agricultural potential due to their stable terrain conditions and efficient water retention capabilities. In contrast, SW2 ranks lowest in agricultural suitability, primarily due to its high drainage density (5.33 km/km2) and elevated ruggedness number (2.0), indicating increased susceptibility to soil erosion and suboptimal water retention. The SWAT model simulation reveals distinct hydrological patterns, with water yield varying from 965.9 mm to 1012.9 mm across the basin. The substantial baseflow contribution (~64% of total flow) indicates strong groundwater–surface water interactions, crucial for sustainable agricultural practices. However, the significant disparity between percolation (47% of precipitation) and deep recharge (2.0% of precipitation) suggests potential challenges for long-term groundwater sustainability. The VIKOR analysis effectively integrates multiple criteria to provide a robust prioritization framework, with SW4 achieving the highest ranking (Qi = 0.003) due to its balanced performance across hydrological and morphometric parameters. This prioritization aligns with the SWAT model results, validating the effectiveness of the integrated approach in agricultural land assessment. To enhance agricultural productivity in less suitable areas like SW2, targeted interventions such as improved irrigation practices, soil conservation measures, and sustainable land management strategies are essential. These interventions should focus on reducing erosion risks while improving water retention capabilities. Meanwhile, maintaining sustainable agricultural practices in SW4 and SW5 is crucial for preserving their agricultural viability. The methodology developed in this study provides a robust framework for AgLP that can be adapted to similar physiographic settings worldwide. Future research should focus on incorporating climate change scenarios and socio-economic factors to further enhance the model’s predictive capabilities and applicability in agricultural planning and management. This integrated approach contributes significantly to sustainable agricultural development by enabling evidence-based decision-making in complex environments, ultimately supporting the achievement of multiple Sustainable Development Goals, particularly SDG 2 (Zero Hunger), SDG 6 (Clean Water and Sanitation), SDG 13 (Climate Action), and SDG 15 (Life on Land).
Author Contributions
Conceptualization, S.H., S.B., Y.M.Y., N.A. and M.E.A.-E.; Data curation, S.H.; Formal analysis, S.H., S.B., Y.M.Y., A.C., G.B. and M.E.A.-E.; Funding acquisition, N.A.; Investigation, S.B. and A.C.; Methodology, S.H., S.B. and Y.M.Y.; Project administration, N.A.; Resources, S.H.; Supervision, A.C. and G.B.; Validation, S.H., S.B., G.B. and M.E.A.-E.; Visualization, S.B., Y.M.Y. and M.E.A.-E.; Writing—original draft, S.B., A.C. and G.B.; Writing—review and editing, Y.M.Y., N.A. and M.E.A.-E. All authors have read and agreed to the published version of the manuscript.
Funding
Researchers Supporting Project number (RSPD2025R804), King Saud University, Riyadh, Saudi Arabia, supported this research.
Data Availability Statement
The data supporting this study’s findings are available upon request from the corresponding authors.
Acknowledgments
This research was supported by the Researchers Supporting Project number (RSPD2025R804), King Saud University, Riyadh, Saudi Arabia.
Conflicts of Interest
The authors declare no conflicts of interest.
References
- Xu, E.; Zhang, H. Spatially-Explicit Sensitivity Analysis for Land Suitability Evaluation. Appl. Geogr. 2013, 45, 1–9. [Google Scholar] [CrossRef]
- Subbarayan, S.; Youssef, Y.M.; Singh, L.; Dąbrowska, D.; Alarifi, N.; Ramsankaran, R.A.A.J.; Visweshwaran, R.; Saqr, A.M. Soil and Water Assessment Tool-Based Prediction of Runoff Under Scenarios of Land Use/Land Cover and Climate Change Across Indian Agro-Climatic Zones: Implications for Sustainable Development Goals. Water 2025, 17, 458. [Google Scholar] [CrossRef]
- Syvitski, J.P.M.; Saito, Y. Morphodynamics of Deltas under the Influence of Humans. Glob. Planet. Change 2007, 57, 261–282. [Google Scholar] [CrossRef]
- Stocker, T.F.; Qin, D.; Plattner, G.-K.; Tignor, M.; Allen, S.K.; Boschung, J. Climate Change 2013: The Physical Science Basis. Contribution of Working Group I to the Fifth Assessment Report of IPCC the Intergovernmental Panel on Climate Change; Xia, Y., Bex, V., Midgley, P.M., Eds.; Cambridge University Press: Cambridge, UK, 2014. [Google Scholar]
- FAO; IFAD; UNICEF; WFP; WHO. The State of Food Security and Nutrition in the World 2021: Transforming Food Systems for Food Security, Improved Nutrition and Affordable Healthy Diets for All; FAO: Rome, Italy, 2021; Volume 2021. [Google Scholar]
- Tiwari, R.N.; Kushwaha, V.K. Watershed Prioritization Based on Morphometric Parameters and PCA Technique: A Case Study of Deonar River Sub Basin, Sidhi Area, Madhya Pradesh, India. J. Geol. Soc. India 2021, 97, 396–404. [Google Scholar] [CrossRef]
- Akpinar, N.; Talay, İ.; Ceylan, C.; Gündüz, S. Rural Women and Agrotourism in the Context of Sustainable Rural Development: A Case Study from Turkey. Environ. Dev. Sustain. 2005, 6, 473–486. [Google Scholar] [CrossRef]
- Strahler, A.N. Chow, V.T., Ed.; Quantitative geomorphology of drainage basin and network. In Er. Hand Book of Applied Geomorphology; McGraw Hill: New York, NY, USA, 1969. [Google Scholar]
- Halder, S.; RoyChowdhury, A.; Kar, S.; Ray, D.; Bhandari, G. Critical Watershed Prioritization through Multi-Criteria Decision-Making Techniques and Geographical Information System Integration for Watershed Management. Sustainability 2024, 16, 3467. [Google Scholar] [CrossRef]
- Dolui, G.; Das, K.; Das Chatterjee, N.; Bhattacharya, R. Multi-Criteria-Based Morphometric Prioritization for Soil Erosion Susceptibility and Denudation Rate Assessment of Purulia District, India. In Drainage Basin Dynamics. Geography of the Physical Environment; Springer: Berlin/Heidelberg, Germany, 2022; pp. 477–502. [Google Scholar] [CrossRef]
- Choudhari, P.P.; Nigam, G.K.; Singh, S.K.; Thakur, S. Morphometric Based Prioritization of Watershed for Groundwater Potential of Mula River Basin, Maharashtra, India. Geol. Ecol. Landsc. 2018, 2, 256–267. [Google Scholar] [CrossRef]
- Chandrashekar, H.; Lokesh, K.V.; Sameena, M.; Roopa, J.; Ranganna, G. GIS –Based Morphometric Analysis of Two Reservoir Catchments of Arkavati River, Ramanagaram District, Karnataka. Aquat. Procedia 2015, 4, 1345–1353. [Google Scholar] [CrossRef]
- Balasubramanian, A.; Duraisamy, K.; Thirumalaisamy, S.; Krishnaraj, S.; Yatheendradasan, R.K. Prioritization of Subwatersheds Based on Quantitative Morphometric Analysis in Lower Bhavani Basin, Tamil Nadu, India Using DEM and GIS Techniques. Arab. J. Geosci. 2017, 10, 552. [Google Scholar] [CrossRef]
- Singh, R.K.; Bhatt, C.M.; Prasad, V.H. Morphological Study of a Watershed Using Remote Sensing and GIS Techniques. Hydrol. J. 2003, 26, 55–66. [Google Scholar]
- Ndatuwong, L.G.; Yadav, G.S. Morphometric Analysis to Infer the Hydrogeological Behaviour in Part of Sonebhadra District, Uttar Pradesh, India, Using Remote Sensing and GIS Technique. Int. J. Remote Sens. GIS 2018, 3, 1–7. [Google Scholar]
- Biswas, S.; Sudhakar, S.; Desai, V.R. Prioritisation of Subwatersheds Based on Morphometric Analysis of Drainage Basin: A Remote Sensing and GIS Approach. J. Indian Soc. Remote Sens. 1999, 27, 155–166. [Google Scholar] [CrossRef]
- Tarolli, P.; Luo, J.; Park, E.; Barcaccia, G.; Masin, R. Soil Salinization in Agriculture: Mitigation and Adaptation Strategies Combining Nature-Based Solutions and Bioengineering. iScience 2024, 27, 108830. [Google Scholar] [CrossRef] [PubMed]
- Caspell, M.; Vasseur, L. Evaluating and Visualizing Drivers of Coastline Change: A Lake Ontario Case Study. ISPRS Int. J. Geo-Inf. 2021, 10, 375. [Google Scholar] [CrossRef]
- Balakrishnan, P.; Abulibdeh, A.; Abul Kasem Kabir, T. Assessment of the Impact of Anthropogenic Evolution and Natural Processes on Shoreline Dynamics Using Multi-Temporal Satellite Images and Statistical Analysis. Water 2023, 15, 1440. [Google Scholar] [CrossRef]
- Abdo, H.G.; Darwish, K.S.; Bindajam, A.A.; Niknam, A.; Youssef, Y.M.; Ahmed, M.F.M.; Mallick, J. Detection of Flood Vulnerable Areas in Urban Basins Using Multi-Criteria Analysis and Geospatial Tools: A Case Study from Eastern Mediterranean. Environ. Earth Sci 2024, 83, 524. [Google Scholar] [CrossRef]
- Mumtaz, M.; Jahanzaib, S.H.; Hussain, W.; Khan, S.; Youssef, Y.M.; Qaysi, S.; Abdelnabi, A.; Alarifi, N.; Abd-Elmaboud, M.E. Synergy of Remote Sensing and Geospatial Technologies to Advance Sustainable Development Goals for Future Coastal Urbanization and Environmental Challenges in a Riverine Megacity. ISPRS Int. J. Geo-Inf. 2025, 14, 30. [Google Scholar] [CrossRef]
- Iftakhar, N.; Islam, F.; Izhar Hussain, M.; Ahmad, M.N.; Lee, J.; Ur Rehman, N.; Qaysi, S.; Alarifi, N.; Youssef, Y.M. Revealing Land-Use Dynamics on Thermal Environment of Riverine Cities Under Climate Variability Using Remote Sensing and Geospatial Techniques. ISPRS Int. J. Geo-Inf. 2025, 14, 13. [Google Scholar] [CrossRef]
- Masria, A.; Seif, A.K.; Ghareeb, M.; Abd-Elmaboud, M.E.; Soliman, K.; Ammar, A.I. Numerical Modeling of Vadose Zone Electrical Resistivity to Evaluate Its Hydraulic Parameters. Appl. Water Sci. 2023, 13, 224. [Google Scholar] [CrossRef]
- Masria, A.; Alshammari, T.O.; Ghareeb, M.; Seif, A.K.; Abd-Elmaboud, M.E.; Ammar, A.I. 2D and 3D Modeling of Resistivity and Chargeability to Identify the Type of Saturated Groundwater for Complex Sedimentary Facies. Hydrology 2024, 11, 120. [Google Scholar] [CrossRef]
- Abdo, H.G. Evolving a Total-Evaluation Map of Flash Flood Hazard for Hydro-Prioritization Based on Geohydromorphometric Parameters and GIS–RS Manner in Al-Hussain River Basin, Tartous, Syria. Nat. Hazards 2020, 104, 681–703. [Google Scholar] [CrossRef]
- Douglas-Mankin, K.R.; Srinivasan, R.; Arnold, J.G. Soil and Water Assessment Tool (SWAT) Model: Current Developments and Applications. Trans ASABE 2010, 53, 1423–1431. [Google Scholar] [CrossRef]
- Teshager, A.D.; Gassman, P.W.; Secchi, S.; Schoof, J.T.; Misgna, G. Modeling Agricultural Watersheds with the Soil and Water Assessment Tool (SWAT): Calibration and Validation with a Novel Procedure for Spatially Explicit HRUs. Environ. Manag. 2016, 57, 894–911. [Google Scholar] [CrossRef]
- Germeç, E.; Ürker, O. Investigation of a SWAT Model for Environmental Health Management Based on the Water Quality Parameters of a Stream System in Central Anatolia (Türkiye). Sustainability 2023, 15, 13850. [Google Scholar] [CrossRef]
- Mamoon, W.B.; Jahan, N.; Abdullah, F.; Rahman, A. Modeling the Impact of Climate Change on Streamflow in the Meghna River Basin: An Analysis Using SWAT and CMIP6 Scenarios. Water 2024, 16, 1117. [Google Scholar] [CrossRef]
- Behera, P.K.; Devi, T.T. Study on Impact of Urbanization by SWAT Model in Iril River, Northeast India. In Hydrological Modeling: Hydraulics, Water Resources and Coastal Engineering; Springer: Berlin/Heidelberg, Germany, 2022; pp. 385–393. [Google Scholar]
- Taia, S.; Erraioui, L.; Arjdal, Y.; Chao, J.; El Mansouri, B.; Scozzari, A. The Application of SWAT Model and Remotely Sensed Products to Characterize the Dynamic of Streamflow and Snow in a Mountainous Watershed in the High Atlas. Sensors 2023, 23, 1246. [Google Scholar] [CrossRef]
- Alansi, A.W.; Amin, M.S.M.; Halim, G.A.; Shafri, H.Z.M.; Thamer, A.M.; Waleed, A.R.M.; Aimrun, W.; Ezrin, M.H. The Effect of Development and Land Use Change on Rainfall-Runoff and Runoff-Sediment Relationships under Humid Tropical Condition: Case Study of Bernam Watershed Malaysia. Eur. J. Sci. Res. 2009, 31, 88–105. [Google Scholar]
- Vigiak, O.; Malagó, A.; Bouraoui, F.; Vanmaercke, M.; Poesen, J. Adapting SWAT Hillslope Erosion Model to Predict Sediment Concentrations and Yields in Large Basins. Sci. Total Environ. 2015, 538, 855–875. [Google Scholar] [CrossRef]
- Abbaspour, K.C.; Vaghefi, S.A.; Srinivasan, R. A Guideline for Successful Calibration and Uncertainty Analysis for Soil and Water Assessment: A Review of Papers from the 2016 International SWAT Conference. Water 2017, 10, 6. [Google Scholar] [CrossRef]
- Bieger, K.; Hörmann, G.; Fohrer, N. The Impact of Land Use Change in the Xiangxi Catchment (China) on Water Balance and Sediment Transport. Reg. Environ. Change 2015, 15, 485–498. [Google Scholar] [CrossRef]
- Neitsch, S.L.; Arnold, J.G.; Kiniry, J.R.; Williams, J.R. Soil & Water Assessment Tool Theoretical Documentation Version. 2009. Available online: https://hdl.handle.net/1969.1/128050 (accessed on 10 December 2024).
- Opricovic, S.; Tzeng, G.-H. Compromise Solution by MCDM Methods: A Comparative Analysis of VIKOR and TOPSIS. Eur. J. Oper. Res. 2004, 156, 445–455. [Google Scholar] [CrossRef]
- Zolekar, R.B.; Bhagat, V.S. Multi-Criteria Land Suitability Analysis for Agriculture in Hilly Zone: Remote Sensing and GIS Approach. Comput. Electron. Agric. 2015, 118, 300–321. [Google Scholar] [CrossRef]
- Topno, A.R.; Job, M.; Rusia, D.K.; Kumar, V.; Bharti, B.; Singh, S.D. Prioritization and Identification of Vulnerable Sub-Watersheds Using Morphometric Analysis and an Integrated AHP-VIKOR Method. Water Supply 2022, 22, 8050–8064. [Google Scholar] [CrossRef]
- Yazdani, M.; Graeml, F.R. VIKOR and Its Applications. Int. J. Strateg. Decis. Sci. 2014, 5, 56–83. [Google Scholar] [CrossRef]
- Huang, J.-J.; Tzeng, G.-H.; Liu, H.-H. A Revised Vikor Model for Multiple Criteria Decision Making—The Perspective of Regret Theory. In Cutting-Edge Research Topics on Multiple Criteria Decision Making. MCDM 2009. Communications in Computer and Information Science; Springer: Berlin/Heidelberg, Germany, 2019; Volume 35, pp. 761–768. [Google Scholar]
- Chatterjee, P.; Chakraborty, S. A Comparative Analysis of VIKOR Method and Its Variants. Decis. Sci. Lett. 2016, 5, 469–486. [Google Scholar] [CrossRef]
- Parnell, S.; Simon, D.; Vogel, C. Global Environmental Change: Conceptualising the Growing Challenge for Cities in Poor Countries. Area 2007, 39, 357–369. [Google Scholar] [CrossRef]
- Abrol, I.P.; Sangar, S. Sustaining Indian Agriculture—Conservation Agriculture the Way Forward. Curr. Sci. 2006, 91, 1020–1025. [Google Scholar]
- Abdullah, M.; Abulibdeh, A.; Ghanimeh, S.; Hamdi, H.; Al-Awah, H.; Al Awadhi, T.; Mohan, M.; Al-Ali, Z.; Sukkar, A.; El Kenawy, A.M. Characterizing the dynamics of climate and native desert plants in Qatar. Journal of Arid Environments. 2024, 225, 105274. [Google Scholar] [CrossRef]
- Cummings, A. Trends in Acquirer Returns in Acquisitions of Indian Target Firms; The Ohio State University: Lane Ave, OH, USA, 2019; Volume 1. [Google Scholar]
- Yang, S.; Jin, Z.; Hao, M.; Jiang, C.; Han, H.; An, Z.; Tarolli, P. Landscape and Soil Erosion Changes Along Different Types of Road Over the Past 30 Years in the Largest Loess Tableland of China. Land Degrad. Dev. 2024, 35, 5559–5569. [Google Scholar] [CrossRef]
- Mandal, B.; Dolui, G.; Satpathy, S. Land Suitability Assessment for Potential Surface Irrigation of River Catchment for Irrigation Development in Kansai Watershed, Purulia, West Bengal, India. Sustain. Water Resour. Manag. 2018, 4, 699–714. [Google Scholar] [CrossRef]
- Rahman, A.; Islam, J.; Sarkar, P.P. Analysis of Basin Morphometry for the Prioritization Using Geo-Spatial Techniques: A Case Study of Debnala River Basin, Jharkhand, India. Environ. Sci. Eng. 2024, F2387, 355–382. [Google Scholar] [CrossRef]
- Chakraborty, S.K. Physicochemical Parameters and Their Seasonal Dynamics: Special Reference to Riverine Networks of South West Bengal, India. Riverine Ecol. 2021, 1, 477–521. [Google Scholar] [CrossRef]
- Bhattacharya, R.K.; Das Chatterjee, N.; Das, K. Multi-Criteria-Based Sub-Basin Prioritization and Its Risk Assessment of Erosion Susceptibility in Kansai–Kumari Catchment Area, India. Appl. Water Sci. 2019, 9, 76. [Google Scholar] [CrossRef]
- DAS, S.; Ghosh, M. A Critical Evaluation of the Solid Waste Management System in Selected Wards of Jangipur Municipality within the Murshidabad District, West Bengal, India. J. Urban Landsc. Plan. 2018, 3, 1–19. [Google Scholar] [CrossRef]
- Mahato, S.; Pal, S. Groundwater Potential Mapping in a Rural River Basin by Union (OR) and Intersection (AND) of Four Multi-Criteria Decision-Making Models. Nat. Resour. Res. 2019, 28, 523–545. [Google Scholar] [CrossRef]
- Shit, P.K.; Maiti, R. Rill Hydraulics—An Experimental Study on Gully Basin in Lateritic Upland of Paschim Medinipur, West Bengal, India. J. Geogr. Geol. 2012, 4. [Google Scholar] [CrossRef]
- Tun, K.K.K.; Shrestha, R.P.; Datta, A. Assessment of Land Degradation and Its Impact on Crop Production in the Dry Zone of Myanmar. Int. J. Sustain. Dev. World Ecol. 2015, 22, 533–544. [Google Scholar] [CrossRef]
- Saha, D.C.; Padhy, P.K. Effect of Air and Noise Pollution on Species Diversity and Population Density of Forest Birds at Lalpahari, West Bengal, India. Sci. Total Environ. 2011, 409, 5328–5336. [Google Scholar] [CrossRef]
- Chakraborty, S.; Chatterjee, S.; Das, K.; RoSy, U. Changing Pattern of Urbanization in West Bengal: An Analysis of 2011 Census of India Data. Asian J. Res. Soc. Sci. Humanit. 2015, 5, 169–181. [Google Scholar] [CrossRef]
- Behera, D. Agricultural Development and Inclusive Growth in India: A Case Study of Gujarat. Int. J. Food Agric. Vet. Sci. 2015, 5, 41–52. [Google Scholar]
- Mahato, M.K.; Jana, N.C. Mapping and Reclamation of Wastelands in Drought-Prone Purulia District of West Bengal, India Using Remote Sensing and GIS. In Climate, Environment and Disaster in Developing Countries; Springer: Singapore, 2022; pp. 189–216. ISBN 978-981-16-6966-8. [Google Scholar]
- Bieger, K.; Arnold, J.G.; Rathjens, H.; White, M.J.; Bosch, D.D.; Allen, P.M.; Volk, M.; Srinivasan, R. Introduction to SWAT+, A Completely Restructured Version of the Soil and Water Assessment Tool. JAWRA J. Am. Water Resour. Assoc. 2017, 53, 115–130. [Google Scholar] [CrossRef]
- Nasir, M.J.; Ahmad, W.; Jun, C.; Iqbal, J.; Bateni, S.M. Soil Erosion Susceptibility Assessment of Swat River Sub-Watersheds Using the Morphometry-Based Compound Factor Approach and GIS. Environ. Earth Sci. 2023, 82, 315. [Google Scholar] [CrossRef]
- Gururani, D.M.; Varade, D.; Joshi, H.; Singh, H.; Kumar, Y.; Kumar, V. Utilizing Statistical and MCDM Techniques in Indexing Morphometric Parameters towards Improved Watershed Management in the Nandhour-Kalish Drainage System. J. Water Clim. Change 2024, 15, 2501–2517. [Google Scholar] [CrossRef]
- Roy, P.; Pal, S.C. Modeling Soil Erosion Susceptibility Considering Morphometric Analysis and SWAT Application: Policy Recommendation to Achieve SDGs. Model. Earth Syst. Environ. 2024, 10, 5735–5752. [Google Scholar] [CrossRef]
- Sathiyamurthi, S.; Youssef, Y.M.; Gobi, R.; Ravi, A.; Alarifi, N.; Sivasakthi, M.; Praveen Kumar, S.; Dąbrowska, D.; Saqr, A.M. Optimal Land Selection for Agricultural Purposes Using Hybrid Geographic Information System–Fuzzy Analytic Hierarchy Process–Geostatistical Approach in Attur Taluk, India: Synergies and Trade-Offs Among Sustainable Development Goals. Sustainability 2025, 17, 809. [Google Scholar] [CrossRef]
- Esraz-Ul-Zannat, M.; Dedekorkut-Howes, A.; Morgan, E.A. A Review of Nature-Based Infrastructures and Their Effectiveness for Urban Flood Risk Mitigation. WIREs Clim. Change 2024, 15, e889. [Google Scholar] [CrossRef]
- Dutal, H. Determining the Effect of Urbanization on Flood Hazard Zones in Kahramanmaras, Turkey, Using Flood Hazard Index and Multi-Criteria Decision Analysis. Environ. Monit. Assess. 2023, 195, 92. [Google Scholar] [CrossRef]
- Srinivasa Rao, C.; Gopinath, K.A.; Prasad, J.V.N.S.; Prasannakumar; Singh, A.K. Climate Resilient Villages for Sustainable Food Security in Tropical India: Concept, Process, Technologies, Institutions, and Impacts. Adv. Agron. 2016, 140, 101–214. [Google Scholar] [CrossRef]
- Chandra, A.; McNamara, K.E.; Dargusch, P. Climate-Smart Agriculture: Perspectives and Framings. Clim. Policy 2018, 18, 526–541. [Google Scholar] [CrossRef]
- Sarkar, A. Soil Geomorphology of Garpanchkot Hill Area and Its Influence on Land Use and Land Cover. J. Geosci. Environ. Prot. 2019, 7, 108–135. [Google Scholar] [CrossRef]
- In, D.; Bengal, W. Deforestation in Social Context: A Case Study of Puruliya Deforestation in Social Context: A Case Study of Puruliya District in West Bengal, India. Res. World 2020, 5, 114. [Google Scholar]
- Duckstein, L.; Opricovic, S. Multiobjective Optimization in River Basin Development. Water Resour. Res. 1980, 16, 14–20. [Google Scholar] [CrossRef]
- Paul, S.; Roy, D. Geospatial Modeling and Analysis of Groundwater Stress-Prone Areas Using GIS-Based TOPSIS, VIKOR, and EDAS Techniques in Murshidabad District, India. Model. Earth Syst. Environ. 2024, 10, 121–141. [Google Scholar] [CrossRef]
- Kumar, B.; Roy, S.; Singh, K.U.; Pandey, S.K.; Kumar, A.; Sinha, A.; Shukla, S.; Shah, M.A.; Rasool, A. A Static Machine Learning Based Evaluation Method for Usability and Security Analysis in E-Commerce Website. IEEE Access 2023, 11, 40488–40510. [Google Scholar] [CrossRef]
- Arnold, J.G.; Srinivasan, R.; Muttiah, R.S.; Williams, J.R. Large Area Hydrologic Modeling and Assessment Part I: Model Development. J. Am. Water Resour. Assoc. 1998, 34, 73–89. [Google Scholar] [CrossRef]
- Gassman, P.W.; Reyes, M.R.; Green, C.H.; Arnold, J.G. The Soil and Water Assessment Tool: Historical Development, Applications, and Future Research Directions. Trans. ASABE 2007, 50, 1211–1250. [Google Scholar] [CrossRef]
- Bera, A.; Baranval, N.K.; Kumar, R.; Pal, S.K. Groundwater Drought Risk Assessment in the Semi-Arid Kansai River Basin, West Bengal, India Using SWAT and Machine Learning Models. Groundw. Sustain. Dev. 2024, 26, 101254. [Google Scholar] [CrossRef]
- USDA SCS. SCS National Engineering Handbook, Section 4: Hydrology; USDA SCS: Washington, DC, USA, 1985.
- Al Khoury, I.; Boithias, L.; Labat, D. A Review of the Application of the Soil and Water Assessment Tool (SWAT) in Karst Watersheds. Water 2023, 15, 954. [Google Scholar] [CrossRef]
- Alexandris, S.; Stricevic, R.; Petkovic, S. Comparative Analysis of Reference Evapotranspiration from the Surface of Rainfed Grass in Central Serbia, Calculated by Six Empirical Methods against the penman-monteith formula. Eur. Water 2008, 21, 17–28. [Google Scholar]
- Abbaspour, K.C.; Rouholahnejad, E.; Vaghefi, S.; Srinivasan, R.; Yang, H.; Kløve, B. A Continental-Scale Hydrology and Water Quality Model for Europe: Calibration and Uncertainty of a High-Resolution Large-Scale SWAT Model. J. Hydrol. 2015, 524, 733–752. [Google Scholar] [CrossRef]
- Olaoye, I.A.; Confesor Jr, R.B.; Ortiz, J.D. Impact of Seasonal Variation in Climate on Water Quality of Old Woman Creek Watershed Ohio Using SWAT. Climate 2021, 9, 50. [Google Scholar] [CrossRef]
- Arabameri, A.; Pradhan, B.; Pourghasemi, H.R.; Rezaei, K. Identification of Erosion-Prone Areas Using Different Multi-Criteria Decision-Making Techniques and Gis. Geomat. Nat. Hazards Risk 2018, 9, 1129–1155. [Google Scholar] [CrossRef]
- Han, Z.; Huang, S.; Huang, Q.; Leng, G.; Wang, H.; Bai, Q.; Zhao, J.; Ma, L.; Wang, L.; Du, M. Propagation Dynamics from Meteorological to Groundwater Drought and Their Possible Influence Factors. J. Hydrol. 2019, 578, 124102. [Google Scholar] [CrossRef]
- Zhang, N.; He, H.M.; Zhang, S.F.; Jiang, X.H.; Xia, Z.Q.; Huang, F. Influence of Reservoir Operation in the Upper Reaches of the Yangtze River (China) on the Inflow and Outflow Regime of the TGR-Based on the Improved SWAT Model. Water Resour. Manag. 2012, 26, 691–705. [Google Scholar] [CrossRef]
- Daggupati, P.; Pai, N.; Ale, S.; Douglas-Mankin, K.R.; Zeckoski, R.W.; Jeong, J.; Parajuli, P.B.; Saraswat, D.; Youssef, M.A. A Recommended Calibration and Validation Strategy for Hydrologic and Water Quality Models. Trans. ASABE 2015, 58, 1705–1719. [Google Scholar]
- Sreedevi, P.D.; Owais, S.; Khan, H.H.; Ahmed, S. Morphometric Analysis of a Watershed of South India Using SRTM Data and GIS. J. Geol. Soc. India 2009, 73, 543–552. [Google Scholar] [CrossRef]
- Horton, R.E. Erosional Development of Streams and Their Drainage Basins; Hydrophysical Approach to Quantitative Morphology. Geol. Soc. Am. Bull. 1945, 56, 275–370. [Google Scholar] [CrossRef]
- Chorley, R.; Horton, R.E. 1945: Erosional Development of Streams and Their Drainage Basins: Hydrophysical Approach to Quantitative Morphology. Bulletin of the Geological Society of America 56, 2 75-370. Prog. Phys. Geogr. 1995, 19, 533–554. [Google Scholar] [CrossRef]
- Schumm, S.A. Evolution of Drainage Systems and Slopes in Badlands at Perth Amboy, New Jersey. GSA Bull. 1956, 67, 597–646. [Google Scholar] [CrossRef]
- Shekar, P.R.; Mathew, A. Evaluation of Morphometric and Hypsometric Analysis of the Bagh River Basin Using Remote Sensing and Geographic Information System Techniques. Energy Nexus 2022, 7, 100104. [Google Scholar] [CrossRef]
- Smith, G.-H. The Relative Relief of Ohio. Geogr. Rev. 1935, 25, 272. [Google Scholar] [CrossRef]
- Magesh, N.S.; Jitheshlal, K.V.; Chandrasekar, N.; Jini, K.V. Geographical Information System-Based Morphometric Analysis of Bharathapuzha River Basin, Kerala, India. Appl. Water Sci. 2013, 3, 467–477. [Google Scholar] [CrossRef]
- Sharma, N.K.; Singh, R.J.; Mandal, D.; Kumar, A.; Alam, N.M.; Keesstra, S. Increasing Farmer’s Income and Reducing Soil Erosion Using Intercropping in Rainfed Maize-Wheat Rotation of Himalaya, India. Agric. Ecosyst. Environ. 2017, 247, 43–53. [Google Scholar] [CrossRef]
- Bera, A.; Mukhopadhyay, B.P.; Barua, S. Delineation of Groundwater Potential Zones in Karha River Basin, Maharashtra, India, Using AHP and Geospatial Techniques. Arab. J. Geosci. 2020, 13, 693. [Google Scholar] [CrossRef]
- Hellwig, J.; de Graaf, I.E.M.; Weiler, M.; Stahl, K. Large-Scale Assessment of Delayed Groundwater Responses to Drought. Water Resour. Res. 2020, 56, e2019WR025441. [Google Scholar] [CrossRef]
- Ebrahim, G.Y.; Villholth, K.G. Estimating Shallow Groundwater Availability in Small Catchments Using Streamflow Recession and Instream Flow Requirements of Rivers in South Africa. J. Hydrol. 2016, 541, 754–765. [Google Scholar] [CrossRef]
- Bhattacharya, R.K.; Chatterjee, N.D.; Das, K. Sub-Basin Prioritization for Assessment of Soil Erosion Susceptibility in Kangsabati, a Plateau Basin: A Comparison between MCDM and SWAT Models. Sci. Total Environ. 2020, 734, 139474. [Google Scholar] [CrossRef] [PubMed]
- Ezzeldin, R.; Abd-Elmaboud, M.E. Modeling Flow Resistance and Geometry of Dunes Bed Form in Alluvial Channels Using Hybrid RANN–AHA and GEP Models. Int. J. Sediment Res. 2024, 39, 885–902. [Google Scholar] [CrossRef]
- Rehman, A.; Xue, L.; Islam, F.; Ahmed, N.; Qaysi, S.; Liu, S.; Alarifi, N.; Youssef, Y.M.; Abd-Elmaboud, M.E. Unveiling Groundwater Potential in Hangu District, Pakistan: A GIS-Driven Bivariate Modeling and Remote Sensing Approach for Achieving SDGs. Water 2024, 16, 3317. [Google Scholar] [CrossRef]
- Kafy, A.; Altuwaijri, H.A. Eco-climatological modeling approach for exploring spatiotemporal dynamics of ecosystem service values in response to land use and land cover changes in Riyadh, Saudi Arabia. Theor Appl Climatol. 2024, 155, 9497–9516. [Google Scholar] [CrossRef]
Disclaimer/Publisher’s Note: The statements, opinions and data contained in all publications are solely those of the individual author(s) and contributor(s) and not of MDPI and/or the editor(s). MDPI and/or the editor(s) disclaim responsibility for any injury to people or property resulting from any ideas, methods, instructions or products referred to in the content. |
© 2025 by the authors. Licensee MDPI, Basel, Switzerland. This article is an open access article distributed under the terms and conditions of the Creative Commons Attribution (CC BY) license (https://creativecommons.org/licenses/by/4.0/).