Article

Distribution Characteristics and Adsorption Performance of Microplastics in Domestic Sewage: A Case Study of Guilin, China

by
Meiyuan Lu
1,2,
Huimei Shan
1,2,*,
Hongbin Zhan
3,
Yuxin Shi
4,
Xujun Lan
1,2 and
Yunquan Liu
1,2
1
Guangxi Key Laboratory of Environmental Pollution Control Theory and Technology, Guilin University of Technology, Guilin 541004, China
2
Key Laboratory of Carbon Emission and Pollutant Collaborative Control, Education Department of Guangxi Zhuang Autonomous Region, Guilin 541004, China
3
Department of Geology & Geophysics, Texas A&M University, College Station, TX 77843, USA
4
College of Earth Science, Guilin University of Technology, Guilin 541004, China
*
Author to whom correspondence should be addressed.
Water 2025, 17(6), 868; https://doi.org/10.3390/w17060868
Submission received: 24 February 2025 / Revised: 11 March 2025 / Accepted: 13 March 2025 / Published: 18 March 2025

Abstract

:
Microplastics (MPs) resulting from plastic fragmentation with a size less than 5 mm have become one of the main pollutants endangering the water environment. Therefore, it is necessary to know about the abundance and size distribution of MPs in sewage waters and their relationship with water quality. In this study, water samples are collected from 20 sewage outlets in Guilin, China to analyze the abundance and morphology of the MPs and their hydrochemical characteristics. Multivariate statistical analyses are conducted to identify the major factors related to the MP distribution in sewage water samples. Results showed that MPs in sewage water samples are mainly composed of fiber and film, and about 67.8% are sized <0.3 mm. The abundance is in the range of 6 (±1)–47 (±3) items/L. The correlation analysis presents that the abundance of MPs is weakly correlated with hydrochemical parameters and metal ions due to the complexity of the abundance data. The redundancy analysis indicates that the MP morphology distribution is significantly affected by NO3–N, Zn, Ca, and Cu contents, and the MP size distribution is mainly related to Zn, Ca, and Cu contents. Adsorption kinetics are analyzed using pseudo-first-order, pseudo-second-order, and intraparticle diffusion models, revealing that the adsorption process is predominantly governed by chemisorption for smaller MPs (0.3–0.5 mm), while larger MPs (1.0–5.0 mm) are constrained by internal diffusion. Isothermal adsorption experiments are fitted using Langmuir and Freundlich models, indicating that the adsorption of nutrients (NH3–N, TN, TP) and metal ions (Ca, Mg, Cu, Pb, Zn) on MPs follows a monolayer adsorption mechanism, with smaller MPs showing higher adsorption capacities due to their larger specific surface areas. This study highlights the occurrence characteristics and environmental influencing factors of MPs in sewage water, which may be significant for future studies on the pollution control of MPs.

1. Introduction

Microplastics (MPs) refer to plastic particles, fibers, or fragments with a particle size (or one-dimensional length) less than 5 mm [1]. MPs can exist in the environment for decades to centuries because of the characteristics of refractory degradation, small size, large specific surface area, strong hydrophobicity, etc. Moreover, it is easy to adsorb organic pollutants and heavy metals, which will migrate and spread over long distances and cause great harm to the ecosystem [2]. Therefore, it is important to identify the source, transport, and fate of MPs for environmental protection and public health. MPs can easily enter the natural water environment through stormwater runoff, atmospheric sedimentation, sewage pipes, sewage treatment plant effluent, etc. MPs have been detected in various environmental media, including the atmosphere [3], domestic wastewater [4,5,6], rivers [7,8], lakes [9], oceans [10,11], sediment [12], and soil [13,14]. Among them, domestic wastewater is assumed to contain high amounts of MPs and is recognized as the major source of MPs in aquatic environments. After MPs are released from sewage pipes into rivers, rivers become the main route for MP transportation and further carry MPs to enter the ocean from inland areas. This will greatly threaten water species and even harm local communities that rely on these bodies of water for drinking water [15,16].
Due to the complexity and ever-changing characteristics of the natural environment, the occurrence and distribution of MPs are related to a variety of environmental factors [17]. Generally, water quality conditions or solution environments are significantly influenced by the presence and levels of MPs, ions, pH, and salinity in water. For example, Liu et al. have reported that the removal of MPs in wastewater was accompanied by the reduction of pollutants such as TN, TP, and COD in wastewater [18]. Aryani et al. linked high concentrations of MPs to decreased ammonia [19]. Liu et al. found higher temperatures and lower salinity enhanced heavy metal adsorption by MPs [20]. Li et al. noted that calcium ions (Ca2+) and NH4+ can promote the adsorption of MPs on aquifer media, though SO42⁻ inhibited it [21].
Previous studies have discussed the interaction between MPs and hydrochemical parameters such as temperature, salinity, pH, main ions (Ca2+, NH4+, SO42⁻), and nutrients (TN, TP), mainly focusing on the correlation and adsorption trend between MPs and pollutants, but less on the adsorption kinetics and isothermal adsorption characteristics of MPs. There is a lack of systematic analysis of the combined effects of various parameters in complex hydrochemical environments. For example, while Li et al. [21] studied the adsorption behavior of MPs on Ca2⁺ and NH4+, they did not deeply discuss the adsorption mechanism when nutrients coexist with metal ions. Therefore, a comprehensive study on the adsorption kinetics and isothermal adsorption characteristics of MPs can not only fill the knowledge gaps in previous studies, but can also provide a new perspective for understanding the behavior of MPs in complex water environments.
The study of adsorption kinetics can reveal the adsorption rate, equilibrium time, and main control mechanism of MPs for pollutants. For example, the pseudo-first-order and pseudo-second-order kinetic models can distinguish whether the adsorption process of pollutants by MPs is dominated by physical adsorption or chemical adsorption, while the intra-particle diffusion model can further analyze whether the adsorption process is affected by liquid film diffusion, pore diffusion, or surface chemical reaction [22]. In addition, isothermal adsorption models (such as the Langmuir and Freundlich models) can be used to quantify the maximum adsorption capacity, adsorption strength, and adsorption behavior of MPs under different pollutant concentrations [23]. These studies are very important for understanding the environmental behavior of MPs as a pollutant carrier. As a pollutant carrier, the adsorption capacity of MPs is the key to determining its environmental behavior and ecological risk. Especially in the Guilin karst area, the self-purification capacity of water is weak, and the adsorption of MPs may aggravate the pollution diffusion.
Guilin City in China, as a typical karst landform area, has a complex groundwater system and weak self-purification ability. The characteristics of a karst landform make it easier for pollutants to spread rapidly through underground rivers, and the close relationship between surface water and groundwater intensifies this phenomenon [24]. Once the MPs enter the aquatic environment, they may quickly penetrate the groundwater system and spread in a wide area, making the pollution diffusion difficult to control [25,26]. Guilin is not only famous for its unique natural landscape, but also, with the acceleration of urbanization in recent years, the rapid growth of population has caused great pressure on the domestic sewage discharge system of the city. The pollution of MPs in domestic sewage is becoming more serious in the process of urban expansion. The existing sewage treatment facilities may not be able to effectively filter and remove these tiny particles, resulting in their direct discharge into natural water bodies. Due to the direct discharge of sewage outlets, the long-term accumulation of MPs in the water body may have an irreversible negative impact on the aquatic ecosystem, which not only threatens the ecological balance but also may endanger public health. Although the research on MP pollution in water has increased rapidly in recent years, the research on Guilin, a unique karst geological environment, is still relatively scarce. At present, most researches focus on the size, morphology, and distribution characteristics of MPs [27,28]. However, investigations into the relationship between MPs in domestic wastewater and environmental factors (such as hydrochemical parameters, metal ions, etc.) are still limited. Considering the unique geological conditions and important position as a tourist city of Guilin, it is particularly urgent to investigate the environmental risk associated with MP pollution.
In this study, to better understand the existence of MPs in domestic sewage waters and the impact of hydrochemical parameters on MPs, Guilin City was selected as the study area to sample sewage water and analyze the relationship between the abundance of MPs and hydrochemical parameters. It lays an environmental background for the follow-up study on adsorption capacity. The redundancy analysis (RDA) method was used to identify the influence of key hydrochemical parameters (such as TN, TP, and NH3–N) and metal ions (such as Na, Ca, and Mg) on MP distribution. Based on this, the adsorption capacity of MPs in different particle sizes (0.3–0.5 mm, 0.5–1.0 mm, 1.0–5.0 mm) was quantified through the kinetic experiments of pseudo-first-order, pseudo-second-order, and intra-particle diffusion models and the isothermal adsorption experiments of the Langmuir and Freundlich models, and the mechanism of MPs as a pollution carrier was revealed. The integration of pollution assessment and adsorption research aims to provide a theoretical basis for water resource management in karst areas, improve water quality, and reduce MP pollution.

2. Materials and Methods

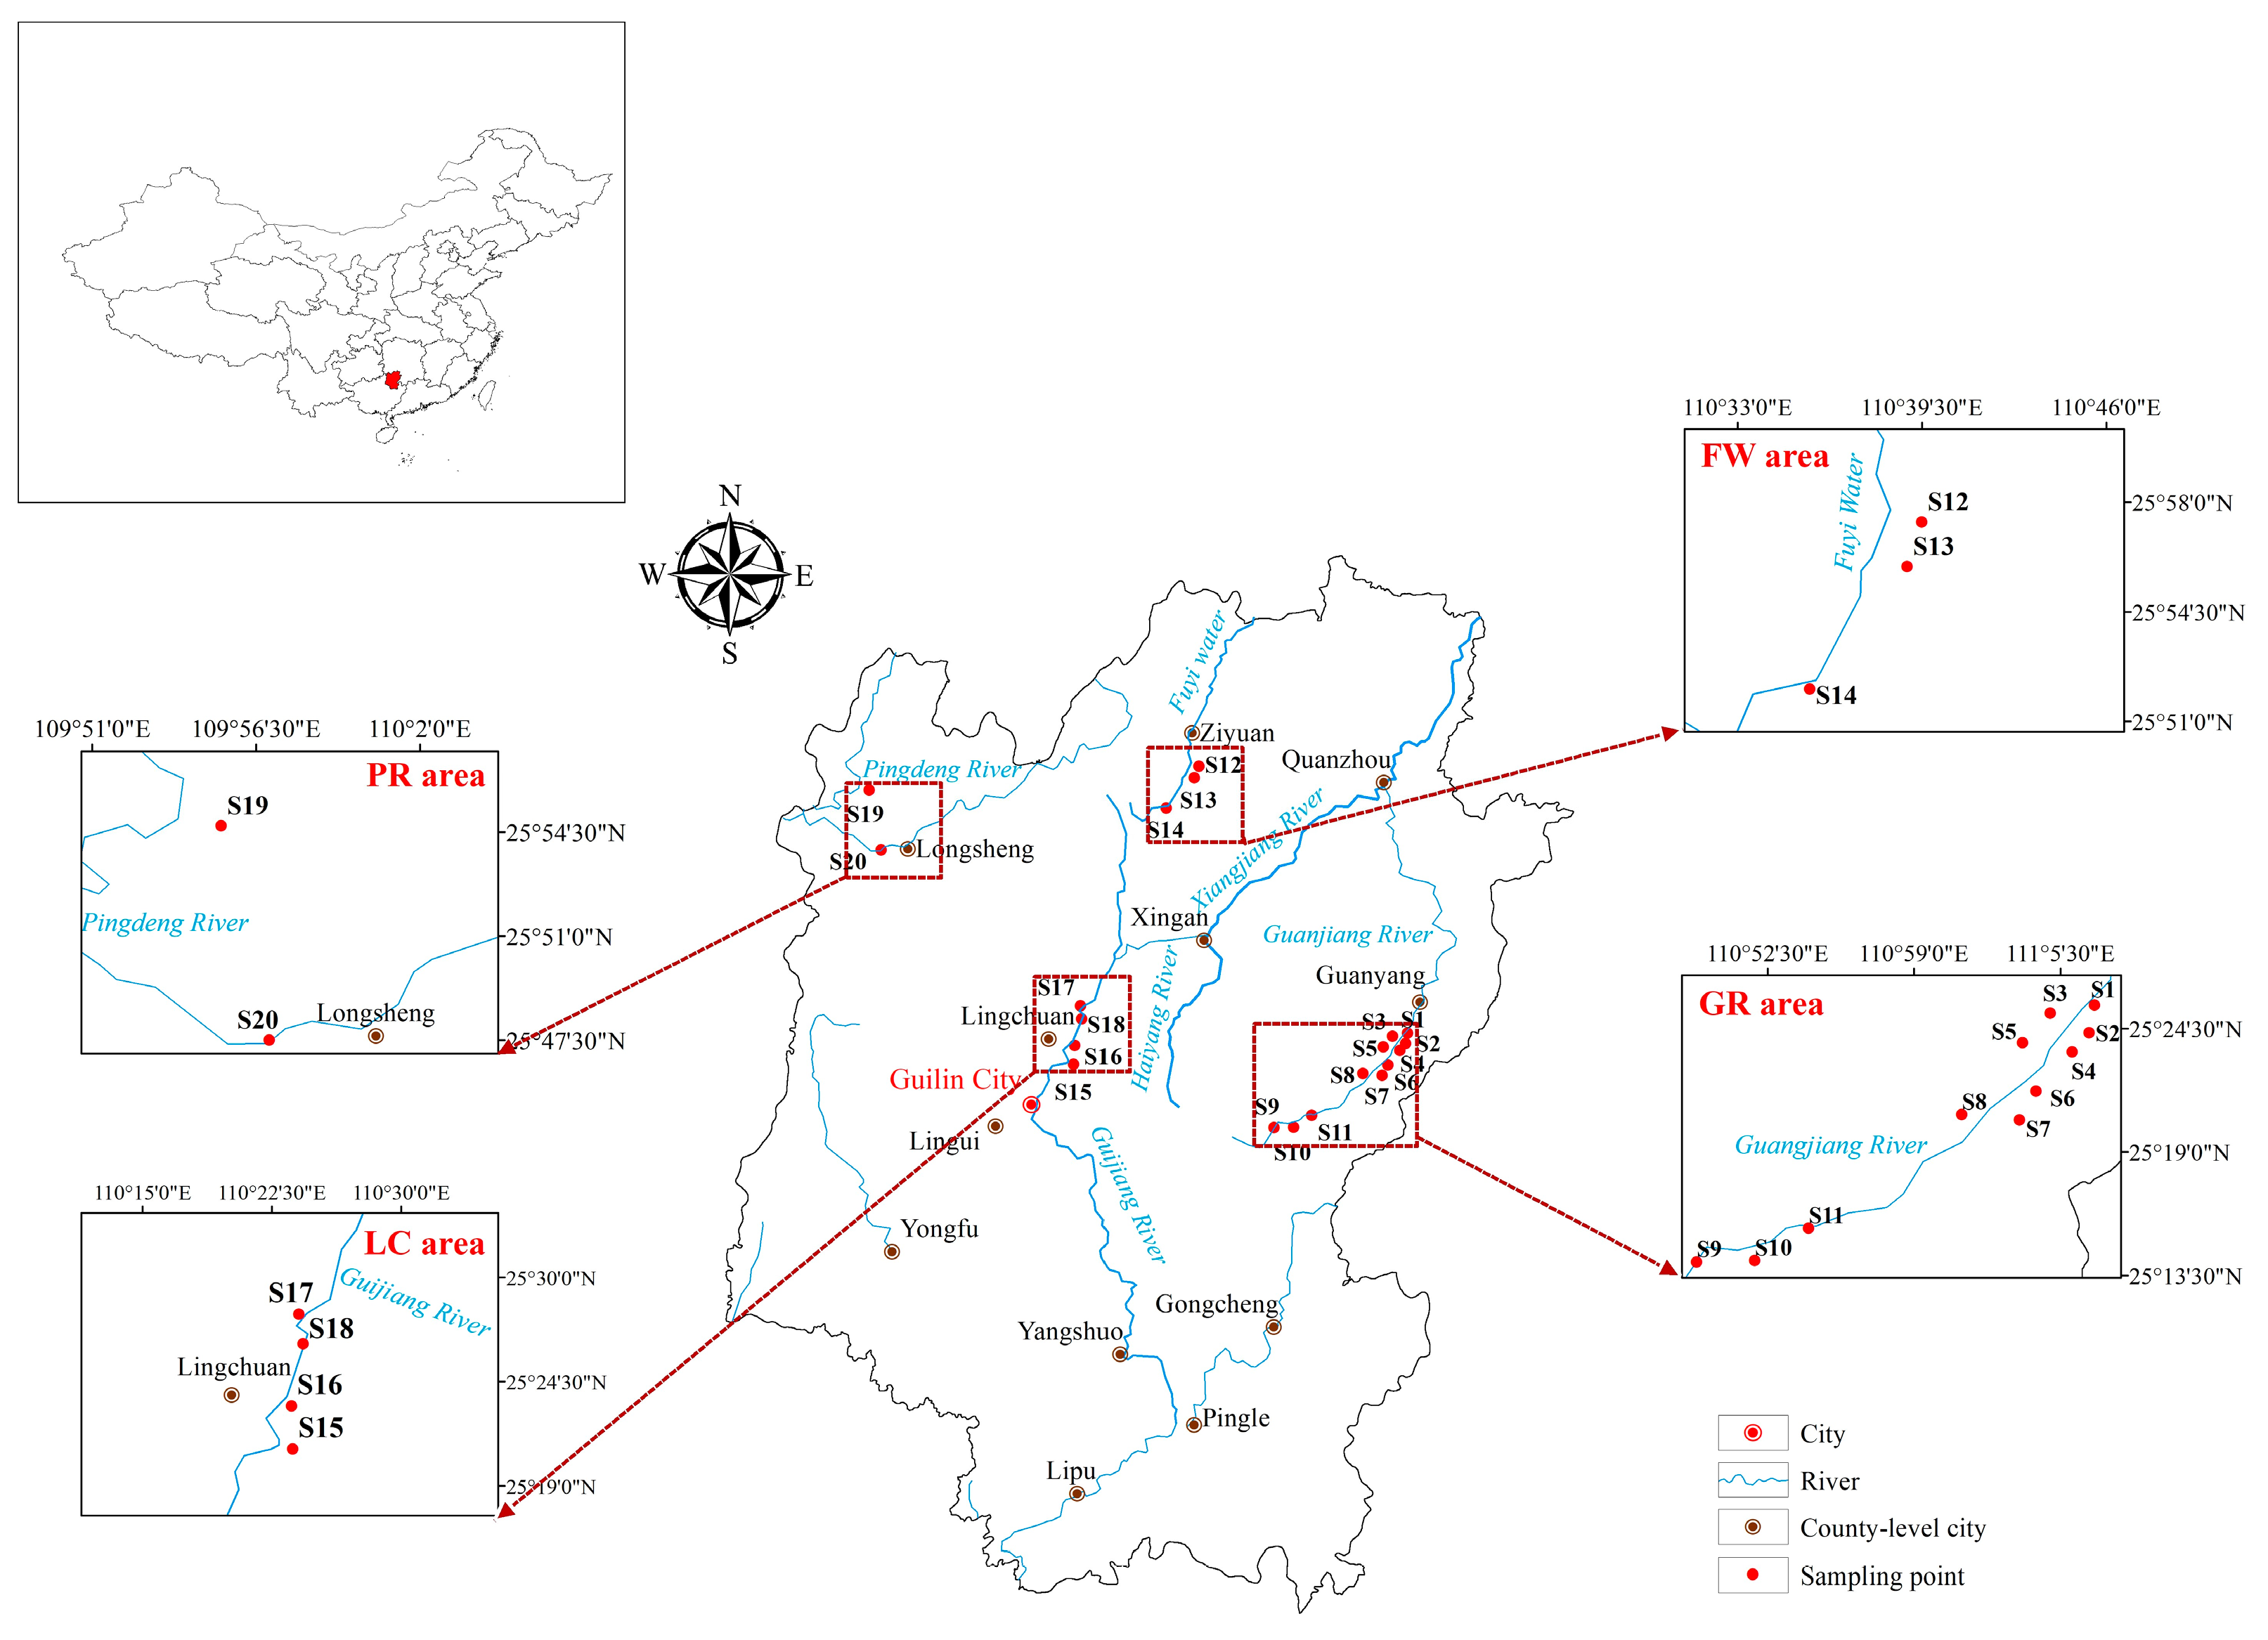
2.1. Sampling and Experiments

From July to August 2023, a series of sewage water samples were collected from the sewage water outlets of Guilin City, and their locations are shown in Figure 1. Samples S1–S11 were collected near Guangjiang River (GR area), S12–S14 were collected near Fuyi Water (FW area), S15–S18 were collected near Guijiang River (LC area), and S19–S20 were collected near Pingdeng River (PR area), respectively. Detailed information on water samplings is listed in Table S1 (Supplementary Materials). Sewage water samples were collected at a water depth of about 20 cm and were placed in 2 L plastic buckets that had been rinsed with sample water. The samples were kept in a box filled with ice until they were transported to the laboratory for analysis. At each sampling point, three parallel water samples were collected to ensure the representativeness of the water samples.

2.2. Hydrochemical Analysis

Hydrochemical parameters of sewage water samples, including pH, Ec (μS/cm), total phosphorus (TP, mg/L), ammonia nitrogen (NH3–N, mg/L), nitrate (NO3–N, mg/L), total nitrogen (TN, mg/L), chloride (Cl, mg/L), sulfate (SO42−, mg/L), and metal ions (K, Na, Ca, Mg, Fe, Al, Mn, Pb, Zn, Cd, Cu, and As, mg/L) were evaluated. Specifically, pH and Ec were measured by portable multi-parameter digital analysis (Hach-HQ30d, Hach Company, Loveland, CO, USA), the concentrations of TN, TP, NH3–N, and NO3–N were measured using a UV spectrophotometer (UV-2355, UNICO Instruments Co., Ltd., Shanghai, China), the concentrations of anions (Cl and SO42−) were measured using ion chromatography (Dionex ICS-10000IC, Thermo Fisher Scientific, Sunnyvale, CA, USA). The concentration of metal ions in aqueous solutions was determined by an inductively coupled plasma optical emission spectrometer (Optima 7000DV, Platinum Elmer Instruments, Inc. Waltham, MA, USA), and the relative standard deviation was less than 5%.

2.3. MP Identification

Before analyzing MPs in water samples, the following pretreatment was required:
(1) Sewage samples were filtered by stainless steel screens with particle sizes of 0.3 mm, 1 mm, and 5 mm, respectively [29].
(2) The filtrates were treated with 30% H2O2 solutions at 65 °C and 80 rpm for 72 h to digest biological materials [30,31].
(3) The digested solutions were filtered through a vacuum pump (glass fiber filter membranes, 47 mm Ø, 0.45 μm apertures), and the filter membranes were placed in clean Petri dishes. The dishes with samples were placed under a stereomicroscope (Phenix, SMZ-180, Phenix Optical Technology Co., Ltd., Shangrao, China) to observe and record the size and morphology of MPs at a magnification of 40 times.
To avoid selection bias, the National Oceanic and Atmospheric Administration (NOAA) guidelines were utilized to classify and quantify the abundance of MPs in water samples. The methods of observing MPs have been standardized as shown below: (1) there was no apparent cellular or biological structure; (2) the fibers had the same thickness down and did not taper at the ends; (3) the ribbons’ fibers were not segmented and appeared bent; (4) the particles were not glossy [32]. The types of MPs included plastic fragments (compact color), pellets (compact color), filaments/fibers (compact color), plastic films (transparent color), foamed plastics, granules, and Styrofoam [30].

2.4. Adsorption Experiments and Models

To explore the intrinsic relationship between MPs, hydrochemical parameters, and metal ions, the isothermal and kinetic adsorption of different particle sizes (0.3–0.5 mm, 0.5–1.0 mm, and 1.0–5.0 mm) of polystyrene (PS) MPs with TN, TP, NH3–N, Na, Ca, Mg, Pb, Zn, and Cu were carried out, respectively. A simulated solution was prepared to contain TN, TP, NH3–N, Na, Ca, Mg, Pb, Zn, and Cu at a concentration of 5 mg/L. Then, diluted HNO3 was added to the stock solution, and the pH value was adjusted to 6 (±0.1).
In the kinetics experiments, 0.05 g varying particle sizes of PS MPs were weighed and placed in 50 mL plastic centrifuge tubes. Then, 30 mL of the simulated solution was added. The tubes were shaken at 150 rpm on a mechanical shaker at room temperature (25 ± 1 °C). Samples were taken at 0.2, 0.5, 1, 2, 4, 7, 12, and 24 h. The samples were filtered through a 0.45 μm membrane. For the adsorption isotherm experiments, 0.05 g varying particle sizes of PS MPs were combined with 30 mL of solution at different concentrations (e.g., 0.2, 0.5, 1, 2, and 5 mg/L). After reaching adsorption equilibrium, samples were collected and filtered through a 0.45 μm membrane.
In this study, three control groups without MPs were established for each group, and each experiment was repeated in triplicate to ensure accuracy and reproducibility.
The adsorption amount on the MPs was calculated by the following Formula (1):
Q t = V C 0 C i m
where Qt (mg/g) is the capacity of adsorbed at time t (min); C0 (mg/L) is the initial concentration before adsorption, and Ci (mg/L) is the concentration in solution after adsorption; V (mL) and m (g) are the volume of adsorption solution and the mass of MPs, respectively.
Three adsorption kinetics experimental models including the pseudo-first-order kinetics model, pseudo-second-order kinetics model, and intraparticle diffusion model were used to fit the adsorption process on MPs. The model expressions were as follows:
Pseudo-first order model [33]:
Q t = Q e 1 e k 1 t
Pseudo-second order model [34]:
Q t = Q e 2 k 2 t 1 + k 2 Q e t
Intraparticle diffusion model [35]:
Q t = k 3 t 0.5 + C
where Qt (mg/g) is the several parameters adsorbed at time t, Qe (mg/g) is the equilibrium adsorption, k1 (min−1) is the pseudo-first-order rate constant, and k2 [g/(mg·min)] is the pseudo-second-order rate constant. k3 ((mg/(g−1·h−0.5)) is the constant of the intraparticle diffusion model, and C (mg/g) is the constant of the intraparticle diffusion model.
Langmuir and Freundlich’s models were applied to fit the adsorption isotherm experimental data as follows:
Langmuir model [36]:
Q e = Q m K L C e 1 + K L C e
Freundlich model [37]:
Q e = K F C e 1 n
where Qm (mg/g) is the maximum adsorption capacity; Ce (mg/L) is the equilibrium concentration; KL (L/mg) is the Langmuir adsorption affinity parameter; KF (mg/g (mg/L) −1/n) and 1/n are the adsorption equilibrium constant and adsorption strength constant of the Freundlich equation, respectively.

2.5. Quality Control and Data Analysis

Samples were collected based on the latest quality assurance and quality control standards, and strict control measures were implemented [38,39]. To minimize experimental errors, glass containers and stainless-steel vessels used in the water sampling, treatment, and filtration phases were rinsed with deionized water before and after experiments. In all the experiments, each medium was used with three blank controls. Filtered distilled water was used as a blank in the laboratory and treated according to the same procedure used for the samples [40].
The sampling sites were mapped using ArcGIS 10.8.1 (ESRI, Redlands, CA, USA). To quantify the variability of MPs as they were affected by hydrochemical parameters and metal ions, Pearson correlation analysis was used to compare multiple groups. A significant level of 5% (p < 0.05) was set for all analyses. Canoco 5.02 software (Biometrics, PRI, NL) was used to perform redundancy analysis (RDA) to examine the associations among MPs, hydrochemical parameters, and metal ions.

3. Results and Discussion

3.1. Hydrochemical Characteristics

The hydrochemical results are shown in Table 1. Comparing the water quality indexes of four areas (GR area, FW area, PR area, and LC area) in Guilin City, the pH of the study area was neutral and weakly alkaline; this indicated that domestic sewage did not cause acid-based pollution in the water body. This result was consistent with the study of rural domestic sewage in southwest China by Xie et al. [41]. Specifically, the pH values of the GR area ranged from 6.59 to 7.84 with a mean value of 7.31; the pH values of the LC area ranged from 7.45 to 7.79, with a mean value of 7.63; the pH values of the FW area ranged from 7.21 to 7.92, with a mean value of 7.48; and the pH values of the PR area ranged from 7.29 to 7.79, with a mean value of 7.54, respectively.
The coefficient of variation (CV) was often used to reflect the variation degree of each observed value and to analyze the dispersion degree and stability of variables. When the CV value was less than 0.1, it was a weak variation; between 0.1 and 1.0, it was a medium variation; and greater than 1.0, it was a strong variation [42]. The CV values of NH3–N and TP in the GR area were 1.04 and 1.06, respectively, indicating their strong variations, and the sources of nitrogen and phosphorus in the water bodies of this region were unevenly distributed and may be affected by human activities. Specifically, S3 showed the maximum values of NH3–N and TP (0.495 and 0.380 mg/L, respectively), and S7 showed the maximum values of TN and NO3-N (1.357 and 4.239 mg/L, respectively). The possible reason was that these two sampling points were located next to residential areas, where a small amount of laundry detergent was used by people containing elements such as N and P. Especially, daily sewage was directly discharged without treatment, further aggravating nitrogen and phosphorus released into the water. Another possible pollution source may be the flushing water produced by raising poultry and livestock, and the livestock and poultry feces and urine containing high concentrations of N and P [43]. In addition to nutrient pollution, the GR area also exhibited variations in heavy metal concentrations. The concentrations of Pb ranged from 0.06 mg/L to 0.13 mg/L, with a mean value of 0.095 mg/L, indicating potential contamination from road runoff or industrial emissions. Similarly, the concentrations of Zn varied significantly (0.1–1.07 mg/L), with a mean value of 0.536 mg/L. This wide range of Zn levels points to potential anthropogenic inputs, likely originating from household activities, agricultural practices, or the use of Zn-containing products. In contrast, the concentrations of Cu were relatively low (0.001–0.01 mg/L), while the concentrations of Fe (0–0.07 mg/L) exhibited strong variation (CV = 110.53%), indicating possible influences from sediment input or natural geological sources.
In the FW area, the CV value of Ec was 1.06, indicating a strong variation. The concentration of Ec at point S13 in the FW area was very high, reaching 355 μS/cm, which may be related to the fact that this point was located in a region close to the township. The discharge of domestic sewage in urban areas was large, and the agricultural and traffic runoff around the town also carried pollutants (such as chloride and nitrate) into the nearby water bodies [44]. In addition, water in urban water bodies tended to flow very slowly and was poor at self-purifying compared with suburban water bodies. Because there were many pollution sources, the water body could not effectively dilute or degrade the incoming pollutants, resulting in a high content of dissolved solids. The FW area also showed significant variations in heavy metal concentrations. The concentrations of Pb ranged from 0.02 mg/L to 0.09 mg/L, the concentrations of Zn ranged from 0.12 mg/L to 0.32 mg/L, and the concentrations of Cu varied between 0.004 mg/L and 0.015 mg/L. The high CV values for Fe (120.00%) and Al (70.41%) suggested possible anthropogenic sources such as wastewater discharge or vehicular emissions. The presence of heavy metals in this region may be linked to urbanization-related pollution, including traffic and construction activities.
In the PR area, the CV values of NO3-N, Cl, and Ec were 1.04, 1.38, and 1.18, respectively. This meant that the sources of nitrogen, salts, and Ec in the water bodies of this region were unevenly distributed. In particular, the concentrations of NO3-N, Cl, and Ec at S20 were very high, reaching 2.735 mg/L, 408.369 mg/L, and 1873 μS/cm, respectively, which may be related to the proximity of this point to the expressway. Some studies had shown that the application of salt on expressways and roads reduced the freezing point of water, thus melting ice and snow, but it also produced saline water that ran off the road into the surrounding environment [45]. In terms of heavy metal concentrations, the PR area exhibited relatively stable levels of Pb, Zn, and Cu. The concentrations of Pb ranged from 0.08 mg/L to 0.09 mg/L, the concentrations of Zn ranged from 0.22 mg/L to 0.28 mg/L, and the concentrations of Cu varied slightly from 0.009 mg/L to 0.011 mg/L. The relatively low variation in Cu (CV = 10.00%) suggested a more uniform distribution, possibly due to stable sources such as industrial discharge. The elevated Cl⁻ and Ec values in the PR area may have facilitated the mobility and bioavailability of these heavy metals, influencing their interactions with MPs.
Heavy metal concentrations in the LC area varied significantly, with the concentrations of Pb ranging from 0.09 mg/L to 0.10 mg/L, the concentrations of Zn spanning 0.01 mg/L to 0.87 mg/L, and the concentrations of Cu ranging from 0.003 mg/L to 0.011 mg/L. The high variability in Zn (CV = 145.11%) suggested localized contamination, potentially from industrial or urban runoff sources. The concentrations of Fe were below detection limits in all samples, while Mn and Cd exhibited relatively stable distributions, suggesting their sources were less influenced by anthropogenic activities.

3.2. MP Distribution Characteristics

3.2.1. Abundance of MPs

MPs were detected in all the sewage waters, and their abundance was presented in Figure 2. The range of MP abundance was 6 (±1)–47 (±3) items/L. Significant differences in abundance were observed between different regions. The abundance of MPs ranged from 8 (±1)–47 (±3) items/L in the GR area, 6 (±1)–27 (±2) items/L in the FW area, 2 (±1)–40 (±3) items/L in the PR area, and 14 (±2)–35 (±3) items/L in the LC area.
The abundance of MPs in the GR area increased at first and then decreased from upstream to downstream. In this area, the upstream water flow was fast, the water retention time was short, and MPs were easily flushed downstream, so the abundance of MPs upstream was low. The decrease in downstream abundance may be related to the sedimentation of MPs because, as the current velocity decreased, the larger particles of MPs were more likely to settle in the water, leading to a decrease in downstream abundance [46]. The highest abundance of MPs in this area was located in S7 (47 ± 3 items/L), which was collected at the sewage outlet of a sewage treatment plant. It was reported that, although sewage treatment plants can usually achieve a removal rate of up to 90% for MPs, the number of MPs in the influent was still large, and the number of MPs in the discharged wastewater was considerable [47,48]. According to previous studies, MPs were more abundant in densely populated areas with more frequent human activities [49]. Notably, the concentration of NO3-N at this point was the highest (4.239 mg/L), and the concentration of TN was also high (1.357 mg/L), indicating that sewage discharge may be the primary source of MPs and associated pollutants.
The highest abundance of MPs in the FW area was located at S13 (27 ± 2 items/L), concurrently achieving the highest Ec value (355 μS/cm). This suggested that elevated Ec levels may be associated with the abundance of MPs, particularly in water bodies proximate to human settlements, where sewage discharge and agricultural runoff may result in the concurrent increase in Ec levels and MP abundance [50,51]. In the LC area, although the concentration of TP at S15 was relatively low (0.008 mg/L), the MPs abundance at this point was relatively high (40 ± 3 items/L). This indicated that the distribution of MPs may be not only affected by the nutrient concentration but also closely related to human activities (such as plastic waste discharge).

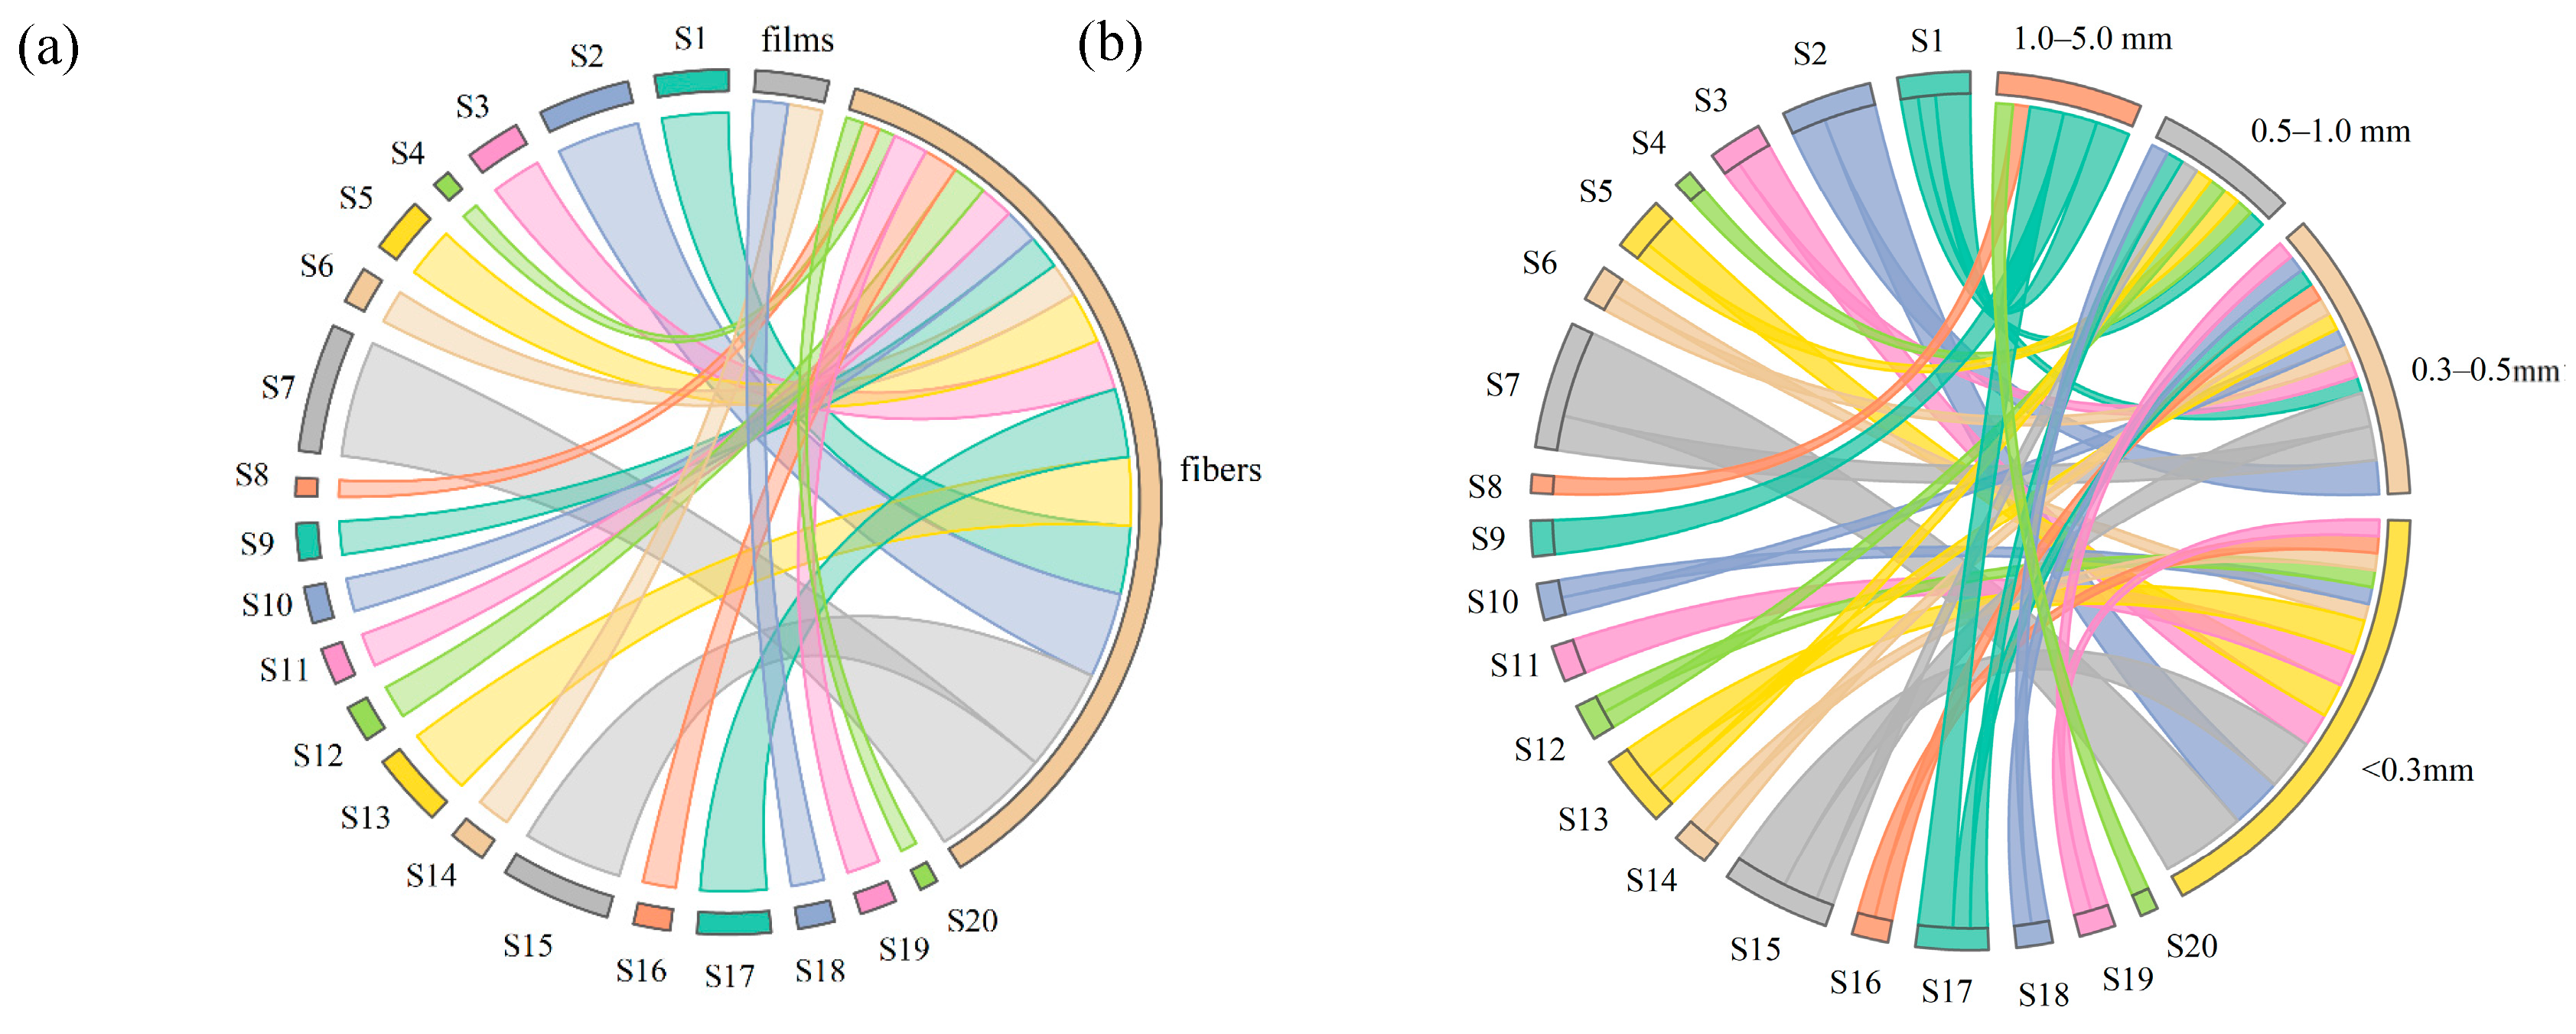
3.2.2. Morphology of MPs

Figure 3 shows the two-shape characteristics of MPs in sewage samples obtained by visualized analysis. It can be seen that fibers and films were widely observed in sewage water samples. Specifically, fiber was the most universal shape type of MPs in this sewage water, and its appearance was slender and long. Many debris residues were attached to the fiber surface, and a few filaments were observed on the plastic surface, meaning that the pollutants were adsorbed on the rough surface of the fiber, which may be attributed to the long-term oxidation of plastic particles in the aqueous solutions [52,53]. There were no foam and particle-shaped MPs in sewage, mainly because those particles were mainly present in beach sediments instead of surface water or near-shore sediments. Similar results were also reported by Faure et al. [54].
Furthermore, fibers were the primary shape species in the sewage water samples, ranging to 95% of all the MPs. This result was similar to the morphology distribution of MPs in most domestic sewage treatment plants in China [55,56]. This may be largely ascribed to laundry wastewater containing fibers [57]. Meanwhile, atmospheric sedimentation, overland runoff, and fishing tools were also potential sources of fiber plastics [58,59]. Many studies had reported that fiber was the predominant shape of MPs in river ecosystems since some fiber can enter the water body via various sources. For example, the clothes washing process in daily life can produce a large number of MPs, leading to the content ranging from 124 mg/kg to 308 mg/kg discharged into the river through the municipal sewage systems [5]. Notably, since the outbreak of COVID-19 in 2019, the production and use of personal protective equipment, mainly including disposable masks, have increased dramatically, and these disposable masks were inevitably being exposed to the environment [60]. It was estimated that around 129 billion pieces of used masks worldwide each month in 2020 were discharged into the ocean, and mask waste could contribute 76–276 items/L MPs after exposure to the aquatic environment, leading to the emergence of an increasing number of fiber MPs [61]. Films of MPs accounted for 5%, and their potential sources were sanitary sewage containing plastic membranous and agricultural mulching membranous in the study area. Furthermore, the development of industrialization also increased the use of industrial film, which may be another potential source [62,63].

3.2.3. Sizes of MPs

To further evaluate the size distribution of MPs in the surface water, the MPs of 20 sewage water samples in the study area were classified into four size classes, including class I (<0.3mm), class II (0.3–0.5 mm), class III (0.5–1.0 mm), and class IV (1.0–5.0 mm), and the results are shown in Figure 4. It shows that the MPs accounted for the largest proportion in class I (<0.3 mm), ranging from 65.8% to 67.8%, and class II (0.3–0.5 mm) accounted for 18.9% to 20.9%. This was similar to the size distribution of MPs reported in the South Sea and the Pearl River in China [64,65]. For the other classes, the size proportion of MPs decreased as the plastic particle size increased. The overall plastic size proportion was consistent with that reported in the Dongting and Hong Lakes in China [66]. A great number of MPs with smaller dimensions may be due to the larger plastic waste being decomposed into small particles. When plastic wastes enter the aquatic system, they could interact with biotic and abiotic (ultraviolet irradiation and weathering) factors, and the molecular structure of MPs could be destroyed, thus degrading large plastics into small-sized ones [67]. Considering that fiber was the major shape of MPs in the sewage water samples, meaning that plastic wastes may undergo weathering intensification, and then be transported into rivers with surface runoff and further experience strong sand erosion in the river.
Overall, MPs in Guilin’s sewage water ranged from 6 (±1) to 47 (±3) items/L, with 67.8% <0.3 mm being predominantly fibers (95%) and films (5%). This abundance variability aligns with water chemical gradients (e.g., high NO3-N and TN at S7: 4.239 mg/L; high Cl at S20: 408.369 mg/L), suggesting potential interactions between MP distribution and hydrochemical conditions, further explored in adsorption studies.
A study revealed an average MP abundance of 0.5–2 items/L in the wastewater of Finnish sewage treatment plants, which was lower than the results obtained in this study. The size distribution of MPs in the wastewater was predominantly composed of particles smaller than 0.1 mm, which was consistent with the findings of this study, where MPs measuring less than 0.3 mm accounted for 67.8% of the total microplastic load [68]. It was reported that the MP abundance in domestic wastewater in the Wuhan Sewage Treatment Plant was 7.9–23.3 items/L, and the fiber morphology was dominant (about 70–90%), which was similar to the result that fiber accounted for 95% in this study [69]. We will supplement this comparative data to further explore the universality of fiber MPs in domestic wastewater and its possible sources (such as laundry wastewater).

3.3. Relationship Analysis

3.3.1. Relationship of MP Abundance with Hydrochemical Parameters

Correlation analysis (CA) is a multivariate statistical method that measures the close correlation between different variable factors by analyzing two or more related variable elements [70]. It can initially estimate the degree of correlation between multiple indicators [71]. In this study, a correlation matrix was computed to evaluate the degree of a linear association between any two of the parameters, and the degree of correlation was presented as coefficient (R) as follows [72]:
R = i = 1 n x i x ¯ y i y ¯ i = 1 n x i x ¯ 2 i = 1 n y i y ¯ 2
where x and y represent variables, x ¯ represents the arithmetic mean of the variable x, y ¯ represents the arithmetic mean of the variable, and n represents the number of observations. The value of R commonly ranges from +1 to −1. If the R-value is +1, there is the strongest positive linear correlation between the two parameters compared. The closer the R value is to +1, the more positive the relationship is. If the value of R is −1, it reveals the strongest negative linear correlation. Furthermore, the larger absolute R-value usually means a stronger correlation between different elements and a higher possibility of homology [73].
In this study, we selected hydrochemical parameters (e.g., TN, TP, NH3–N) and metal ions (e.g., K⁺, Na⁺, Ca2⁺, Mg2⁺, Cu2⁺, Zn2⁺, Pb2⁺) to assess their associations with MP abundance. These parameters were chosen due to their prevalence in aquatic environments and their potential interactions with MPs. Among the selected hydrochemical parameters (like pH), Na⁺, Ca2⁺, and Mg2⁺ were particularly significant as they were common cations in both domestic sewage and natural water systems. This approach was supported by previous research, such as Kim et al., who analyzed the correlation between MP abundance and water quality parameters, including pH, K, Ca, and Mg, in Jeju Island, South Korea [74]. Their findings provide a valuable foundation for understanding how these ions interact with MPs in aquatic environments. In addition to common cations, heavy metals such as Cu2⁺, Zn2⁺, and Pb2⁺ were also of interest due to their prevalence as pollutants in industrial and domestic wastewater. MPs have been shown to adsorb heavy metals, which can enhance their mobility and bioavailability in aquatic ecosystems [75]. This interaction is particularly concerning because it may exacerbate the ecological risks associated with heavy metal pollution, potentially leading to more severe environmental impacts. Furthermore, nutrients like TN, NH3–N, and TP play a pivotal role in aquatic ecosystems as indicators of eutrophication. These nutrients are typically found at elevated concentrations in domestic sewage. MPs have the capacity to adsorb nitrogen and phosphorus, which can influence their distribution and bioavailability in water bodies [76]. This adsorption process may contribute to the exacerbation of eutrophication, further underscoring the ecological significance of MPs in aquatic environments.
As shown in Figure 5, the abundance of MPs showed a moderately positive correlation with NO3-N, with an R-value of 0.404, showed a weakly positive correlation with TN, TP, SO42−, and Na, with R values of 0.220, 0.245, 0.287, and 0.202, respectively, and were weakly correlated with NH3–N, pH, As, and Mn, with R values of 0.177, 0.071, 0.133, and 0.010, respectively. Several studies have shown that the correlation between MP abundance and certain water chemical parameters may be weak. This is because MP abundance is affected by multiple factors, including chemical parameters. In domestic sewage, due to the complex pollution sources, the abundance of MPs may be more affected by the source (such as sewage treatment system, precipitation, runoff) [77] and environmental conditions (such as hydrodynamics and sedimentation) [78], so the correlation with a single hydrochemical parameter is often not significant.
Compared with other parameters, there was a strong correlation between the abundance of MPs and NO3-N in this study, indicating that MPs may participate in nitrification or denitrification in some form [79,80]. Different from these hydrochemical parameters, metal ions showed a weak correlation with the abundance of MPs, which was consistent with the finding of Nguyen et al. [81]. One possible explanation for the weak correlation was that the MPs in the study area were relatively pristine, meaning that they had undergone little weathering or degradation that could enhance their ability to absorb metals [82,83]. Similar to the study reported by Somasundaram et al. [84], no parameter was found to be significantly correlated with MP abundance through the Pearson correlation test. Furthermore, the distribution of MPs varied upstream and downstream of rivers and in urban areas due to multiple sources and the influence of the surrounding environment [85,86,87]. The diversity of urban ecosystems posed unique challenges to understanding MP migration [88]. Identifying the key factors affecting the abundance of MPs was complex because they were diverse and interrelated.

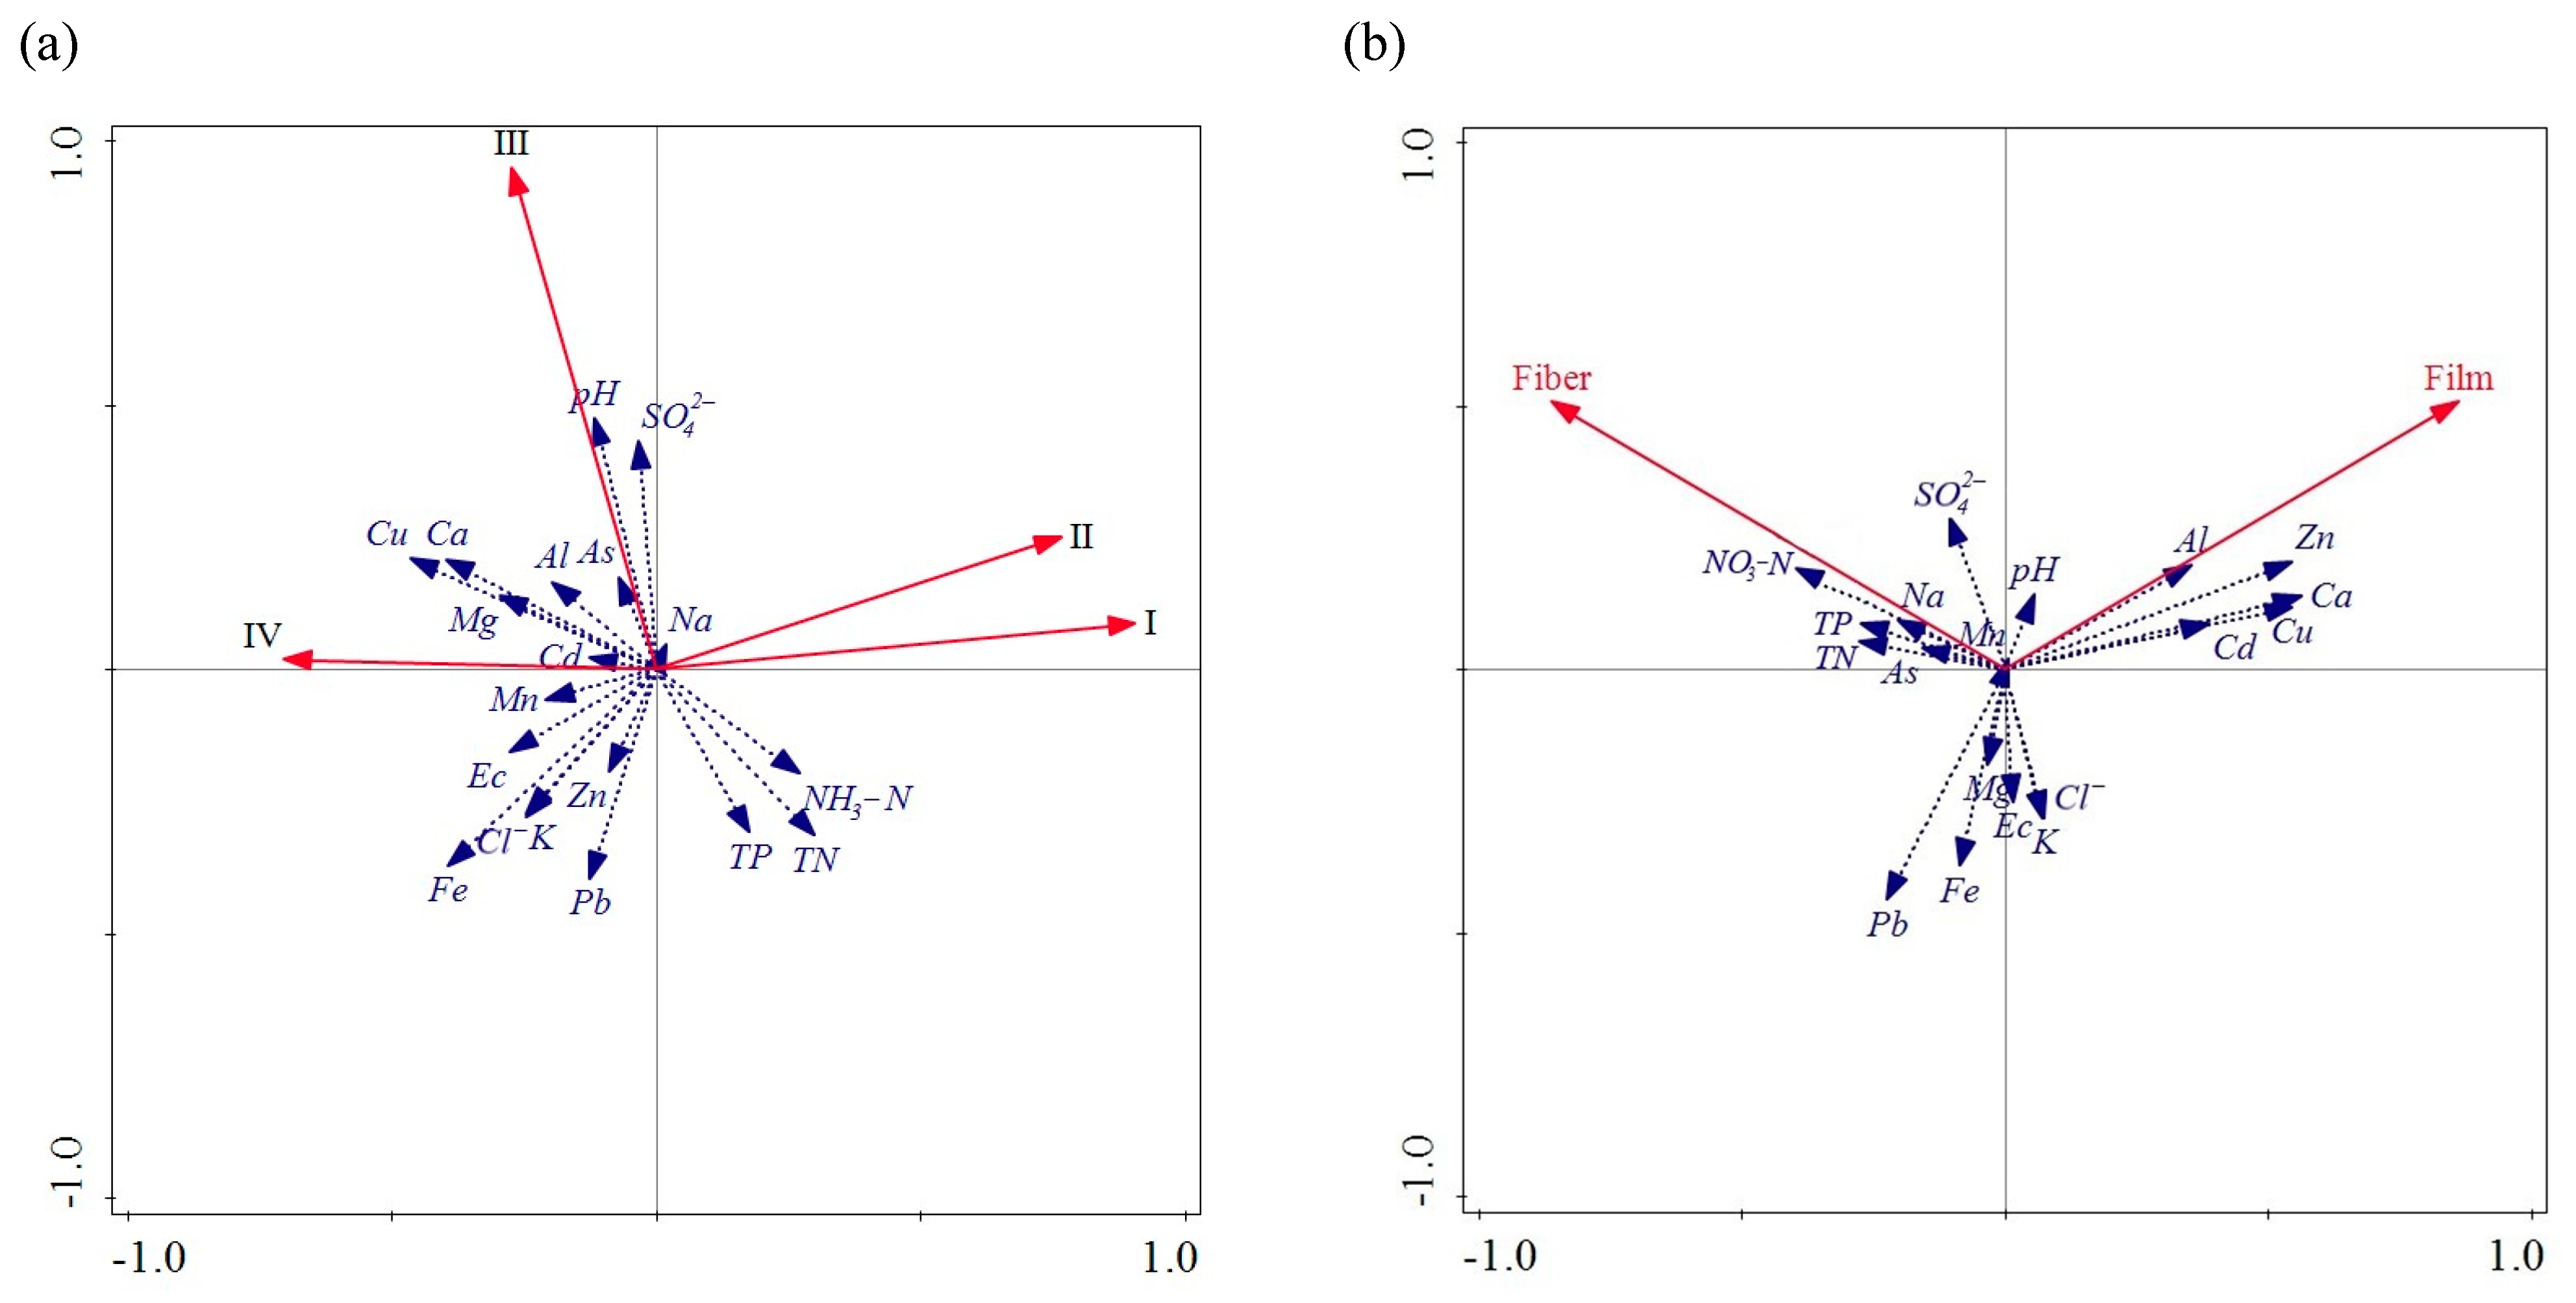
3.3.2. Relationship of MP Size and Morphology with Hydrochemical Parameters

Although some evidence has suggested a link between MPs and water quality data, Kataoka et al. [89] indicated that, given the temporal and spatial variability of the river, the linear associations between water quality parameters and MP abundance may be problematic. Therefore, redundancy analysis (RDA) was used to further demonstrate the percentage contribution of the associations between water quality parameters and MP abundance. RDA is another tool for assessing correlations across multiple variable sets, allowing an in-depth understanding of multi-variable correlations by leveraging redundant information [90]. RDA is a direct extension of multiple regression and can model the effect of an explanatory matrix M (n × p) on a response matrix N (n × m) [91]. It can be conducted by the following two steps: Firstly, multiple regression is conducted through the linear Equation (2):
M f i t = N N N 1 N M
where each object in N is regressed on the explanatory variables in M, resulting in a matrix of fitted values Nfit.
Secondly, principal components analysis (PCA) is applied to the fitted matrix Nfit to reduce dimensionality. Obtaining a matrix Z containing the canonical axes corresponding to the linear combinations of the explanatory variables in the space of M, the linearity of the combinations of the M variables is a fundamental property of RDA. Once RDA has been calculated, additional statistics can be calculated to interpret the explanatory power of the included variables and to assess the significance of the observed relationships. These statistics include the P-statistic, contribution (%), pseudo-F, etc. Among them, the P-statistic corresponds to an overall test of the significance of an RDA by comparing the computed model with a null model. It can also be used to sequentially test the significance of each canonical axis. Contribution (%) indicates the contribution value of the parameter. Pseudo-F is used to ensure that the test has good horizontal accuracy.
In this study, RDA was used to determine the relationship between the hydrochemical parameters, metal ions, and the size, along with the morphology, of MPs. The contribution rate of each variable to the environment can be maintained independently through RDA, and the statistical characteristics of a single variable can still be described in the case of different combinations of variables. The environmental explanatory variables were hydrochemical indicators (Ec, pH, TN, TP, NO3-N, NH3–N, Cl, and SO42–) and metal ions (K, Na, and Ca, etc.), which were represented by blue arrows. The response variable was the size (class I, class II, class III, and class IV) and morphology of MPs in the sewage water, indicated by the red arrow. The length of the arrow in the figure represents the proportion of the explanatory variable.
Figure 6a shows that the first two RDA axes of the hydrochemical indicators, metal ions, and the size of MPs explain 49.52% and 73.82% of the total variance, respectively. It shows that, for MPs with sizes of <0.3 mm and 0.3–0.5 mm, only NH3–N, TN, TP, and Na were positively correlated; this correlation may be due to the similar sources of MPs and nutrients (e.g., wastewater and non-point source pollution) [92]. For MPs with a size of 0.5–1.0 mm, there were positive correlations with pH, SO42–, Al, Ca, Mg, and Cu. MPs of this size may be more stable in an alkaline and mineral-rich environment. This indicates that they may be more likely to accumulate in water with high ion content and more easily combined or attached to positively charged minerals (such as Ca, Mg, and Al) [93]. MPs with a size of 0.5–1.0 mm had negative correlations with NH3–N, TP, and TN. This may mean that these smaller MPs were less distributed in eutrophic water bodies and may be more easily decomposed in such environments.
For MPs with a size of 1.0–5.0 mm, there was a positive correlation with metal ions and anions, which indicates that these larger MPs tend to exist in an environment with higher salt content and heavy pollution. This may be because the larger MPs usually make it easier to adsorb these ions because of their larger surface area and mass. They are more difficult to transport by the current, so they are more likely to be deposited at the bottom of the water, especially in areas with a high content of heavy metal ions [94]. A negative correlation with TP, TN, NH3–N, and NO3-N may indicate that they exist in a small proportion of domestic wastewater. This phenomenon may be related to the fact that larger MP particles are easier to settle in these environments and more difficult to suspend in eutrophic water.
Figure 6b shows that the first two RDA axes of the hydrochemical indicators, metal ions, and the morphology of MPs explained 74.21% and 100% of the total variance, respectively. It can be seen that the fibers were positively correlated with NO3-N, TP, TN, Na, Mn, As, and SO42−. The positive correlation between fiber and nutrients such as NO3-N, TP, and TN indicates that MPs are more likely to accumulate in eutrophic water bodies. This may harm eutrophic water bodies, exacerbating algae growth and water ecological imbalance. The longer arrow line of NO3-N indicated that this parameter had a greater influence on fiber distribution, while the slightly shorter arrow line of TP and TN had a slightly lesser influence. The strong correlations observed between various forms of nitrogen and MPs indicates a potential disturbance process associated with nitrogen recurrence. The positive correlation between fiber and metal ions such as As and Mn indicates that these MPs may be more easily captured or deposited in heavily metal-polluted areas. This also suggests that fiber may act as a carrier for heavy metals, increasing the migration capacity and bioavailability of these harmful metals in water bodies, thereby posing a threat to aquatic ecosystems. The positive correlation between fiber and pollutants such as nitrogen, phosphorus, and metal ions suggest that they may act as carriers of other pollutants in the environment, facilitating their wider distribution in water bodies. MPs can adsorb these pollutants, allowing them to enter organisms through the food chain, thereby posing potential hazards to the ecosystem.
The negative correlation between fiber, K, Cl, and Ec indicates that the fiber concentration in high-salinity sewage water was low. It meant that fibers were more susceptible to degradation, sedimentation, or reactions with other substances in environments with high salinity where fibrous MPs may decompose faster and were less likely to be retained and diffused. Furthermore, the films were positively correlated with Al, Zn, Ca, Cu, and Cd. This shows that the sources of these elements were related to the production and use of plastics, and these metals were used as additives or catalysts in some plastic production processes [95,96]. The existence of these metal elements within the ecosystem may influence the sedimentation, distribution, and biodegradability of MPs and potentially result in the enrichment of these metals by some organisms. The films were negatively correlated with Pb, Fe, and Mg, indicating that the deposition and sources of these metals were significantly different from those of MPs. This may also reflect the physiochemical characteristics of thin film MPs under specific environmental conditions. Almeida et al. [97] had shown that under various pH values and ionic strengths, MPs may have different binding abilities with some metal ions, resulting in different correlations.
The positive and negative correlation between MPs, hydrochemical parameters, and metal ions not only elucidated MP behavior and characteristics in the environment but also offered insights into the intricate dynamics of environmental contamination. This analysis facilitated the identification of MPs and their pollutants’ impact on the ecosystem, thereby providing a reference point for further research and environmental protection.
The correlation analysis and redundancy analysis showed that the abundance of MPs was weakly correlated with hydrochemical parameters (such as NO3−N), while its morphology (such as fiber) and size distribution were significantly correlated with specific parameters (such as NO3-N, Zn, Ca, Cu) (see Section 3.3.1 and Section 3.3.2). These results suggest that MPs may interact with nutrients and metal ions in water through adsorption, thus affecting their distribution and migration in the environment. However, statistical analysis can only reveal the correlation, and cannot clarify the specific interaction mechanism between MPs and pollutants. As a potential pollutant carrier, MP adsorption capacity may be the key driving force of MP environmental behavior and ecological risk. Therefore, in order to deeply understand the role of MPs in sewage and its potential impact, we further carried out adsorption kinetics and isothermal adsorption experiments to verify the adsorption characteristics of MPs with different particle sizes for nutrients (such as TN, TP, NH3–N) and metal ions (such as Ca, Cu, Zn), and to explore its adsorption mechanism. This is not only a supplement to the previous statistical results, but also provides theoretical support for formulating pollution control strategies in MPs.

3.4. Adsorption Characteristics and Models

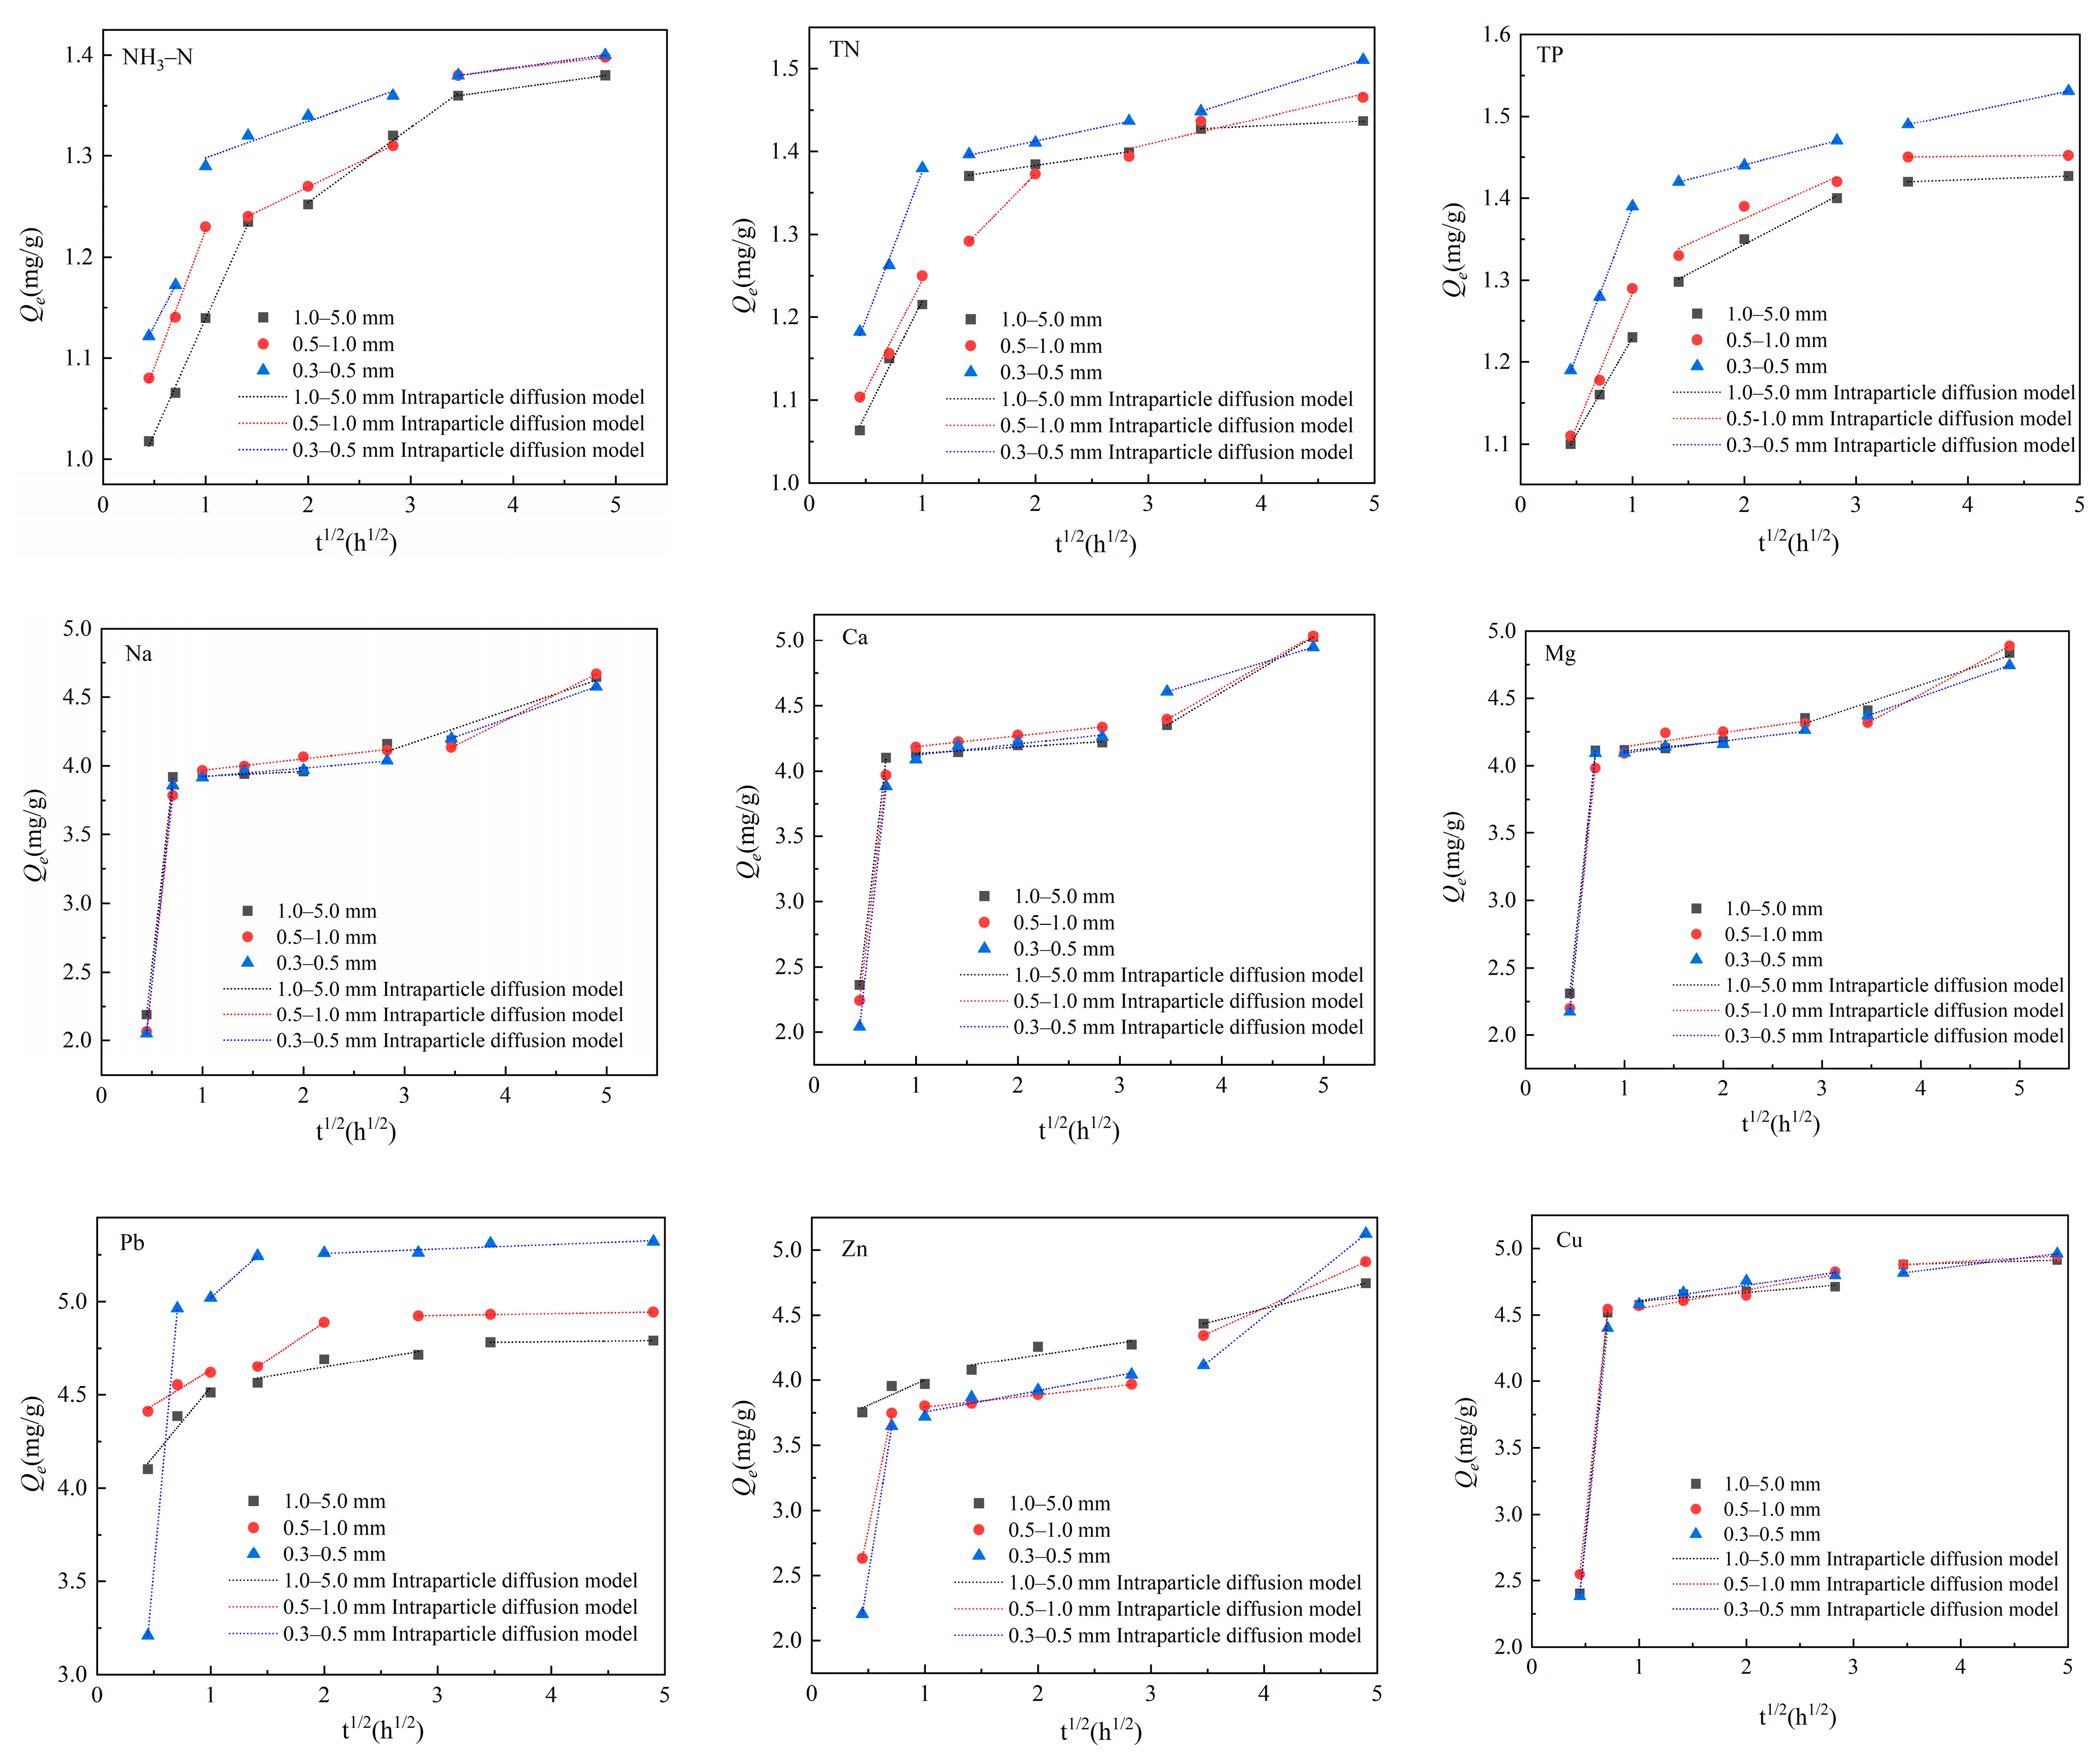
3.4.1. Adsorption Kinetics

Figure 7 and Table S4 show the fitting analysis results of the experimental data by the pseudo-first-order kinetic model and the pseudo-second-order kinetic model, respectively.
For MPs with a particle size of 0.3–0.5 mm, the adsorption behavior of NH3–N, TN, TP, and Na was better described by the pseudo-second-order kinetic model (R2 = 0.88–0.90) compared with the pseudo-first-order model (R2 = 0.567–0.835). As demonstrated in Table S4, the equilibrium adsorption capacities (Qe) ranged from 1.37 to 4.34 mg/g, and the adsorption rate constants (k2) ranged from 1.49 to 14.02 g/(mg·min). These results indicate that the adsorption process is predominantly governed by chemisorption, involving abundant active surface sites [98]. This finding further validated the positive correlation between 0.3–0.5 mm MPs and nutrients (NH₃-N, TN, TP, and Na), indicating a high affinity of these MPs for nutrients. The demonstration by Zhao et al. [99] showed that small-sized MPs significantly enhanced nutrient adsorption due to their high surface reactivity. The Qe values (e.g., 1.37 mg/g for NH₃-N and 4.34 mg/g for Na) further support this conclusion, indicating that MPs with a particle size of 0.3–0.5 mm exhibited strong adsorption capacities. However, although metal ions (Ca, Mg, Cu, Pb, Zn) showed higher Qe values (4.42–5.44 mg/g), their adsorption rates (k2 = 1.15–1.73 g/(mg·min)) were lower. This may suggest that nutrients competitively occupy some of the active sites during the adsorption process, thereby inhibiting the adsorption of metals.
For MPs with a particle size of 0.5–1.0 mm, the adsorption of Ca, Mg, and Cu was better described by the pseudo-second-order kinetic model (R2 = 0.87–0.90) compared with the pseudo-first-order model (R2 = 0.83–0.86). This indicates that the adsorption process was primarily controlled by chemisorption, potentially involving electrostatic interactions or surface complexation reactions. In contrast, the adsorption of TN, TP, NH₃-N, Na, Pb, and Zn was better described by the pseudo-first-order model (R2 = 0.47–0.91) compared with the pseudo-second-order model (R2 = 0.43–0.88). This suggests that the adsorption of these parameters was mainly governed by physical diffusion processes rather than strong chemical interactions. This trend was consistent with the observations of Shen et al. [100] on the adsorption behavior of MPs in eutrophic environments, where the adsorption capacity of MPs for heavy metals and nutrients may decrease due to reduced active sites or surface degradation of MPs under high-nutrient conditions. This phenomenon may reflect the higher selectivity of MPs with a particle size of 0.5–1.0 mm for metal ions, while their adsorption capacity for nutrients is relatively weaker.
For MPs with a particle size of 1.0–5.0 mm, the adsorption of metal ions was better described by the pseudo-second-order kinetic model (R2 = 0.60–0.93) compared with the pseudo-first-order model (R2 = 0.32–0.84). This indicates that the adsorption of metal ions was still predominantly controlled by chemisorption mechanisms. However, the adsorption of TN, TP, and NH₃-N was better described by the pseudo-first-order model (R2 = 0.79–0.0.88) compared with the pseudo-second-order model (R2 = 0.44–0.56), suggesting that the adsorption process was more influenced by physical diffusion. This phenomenon was consistent with the findings of Wang et al. [101], who reported that larger sized MPs exhibited lower adsorption capacities in polluted water bodies due to diffusion limitations. This may be attributed to the smaller specific surface area of larger MPs, which limits the number of available active sites, thereby reducing the adsorption rate.
In addition, the intraparticle diffusion model was used to fit the experimental data to further determine the mechanism controlling the adsorption process and reveal the rate-limiting step of adsorption. In general, the process of uptake and entry of contaminants into polymers was complex, involving three distinct stages. Firstly, there was external diffusion. Secondly, internal diffusion, otherwise known as pore diffusion, took place. Thirdly, contaminants were adsorbed to active sites [102]. As shown in Figure 8, the fitting curve had a positive intercept (C ≠ 0) and did not cross the origin point, confirming that external mass transferred and internal diffusion existed in the entire actual adsorption process. At the same time, the fitting results were multilinear in the whole adsorption time, further indicating that adsorption may be affected by two or more key steps [103]. It can be inferred that the adsorption of hydrochemical parameters and metal ions on porous homogeneous MPs in this study may include three stages. Firstly, adsorption was rapid due to the abundance of active sites on the MP surfaces, driven primarily by liquid membrane diffusion. In the second stage, the diffusion rate (k3) decreased significantly as parameters moved from the liquid phase into the internal pores of the MPs. At this stage, intraparticle diffusion became the main mechanism. Finally, diffusion through smaller pores led to a dynamic equilibrium between adsorption and desorption [104,105]. A similar phenomenon has been observed in previous studies [23]. Compared with the rate constant of k3 in each stage, the first stage showed the highest k3 value of 0.025–1.050, and it was significantly reduced in the second stage (0.003–0.015), and the third stage showed the k3 value of 0–0.015, meaning that the intraparticle diffusion and the final equilibrium process were the rate-limiting steps for the adsorption of TN, TP, NH3–N, and metal ions onto MPs.
The adsorption performance of MPs varied significantly with particle size. For MPs with a particle size of 0.3–0.5 mm, higher Qe (e.g., 5.443 mg/g for Pb) and k2 values (e.g., 14.015 g/(mg·min) for NH3–N) with strong R2 (0.88–0.90) in the pseudo-second-order model indicated chemisorption dominance, driven by abundant surface sites. In contrast, MPs with a particle size of 0.5–1.0 mm showed comparable Qe (e.g., 5.104 mg/g for Cu) but lower k2 (e.g., 1.334 g/(mg·min) for Cu), suggesting slower kinetics despite chemisorption. MPs with a particle size of 1.0-5.0 mm exhibited reduced Qe (e.g., 4.357 mg/g for Zn) and higher intraparticle diffusion influence (k3: 0.039–1.050 mg/(g·h0.5)), reflecting diffusion limitations due to lower surface area. This size-dependent performance highlighted smaller MPs’ superior adsorption capacity, potentially increasing pollutant retention in sewage water, while larger MPs may limit bioavailability due to slower uptake.

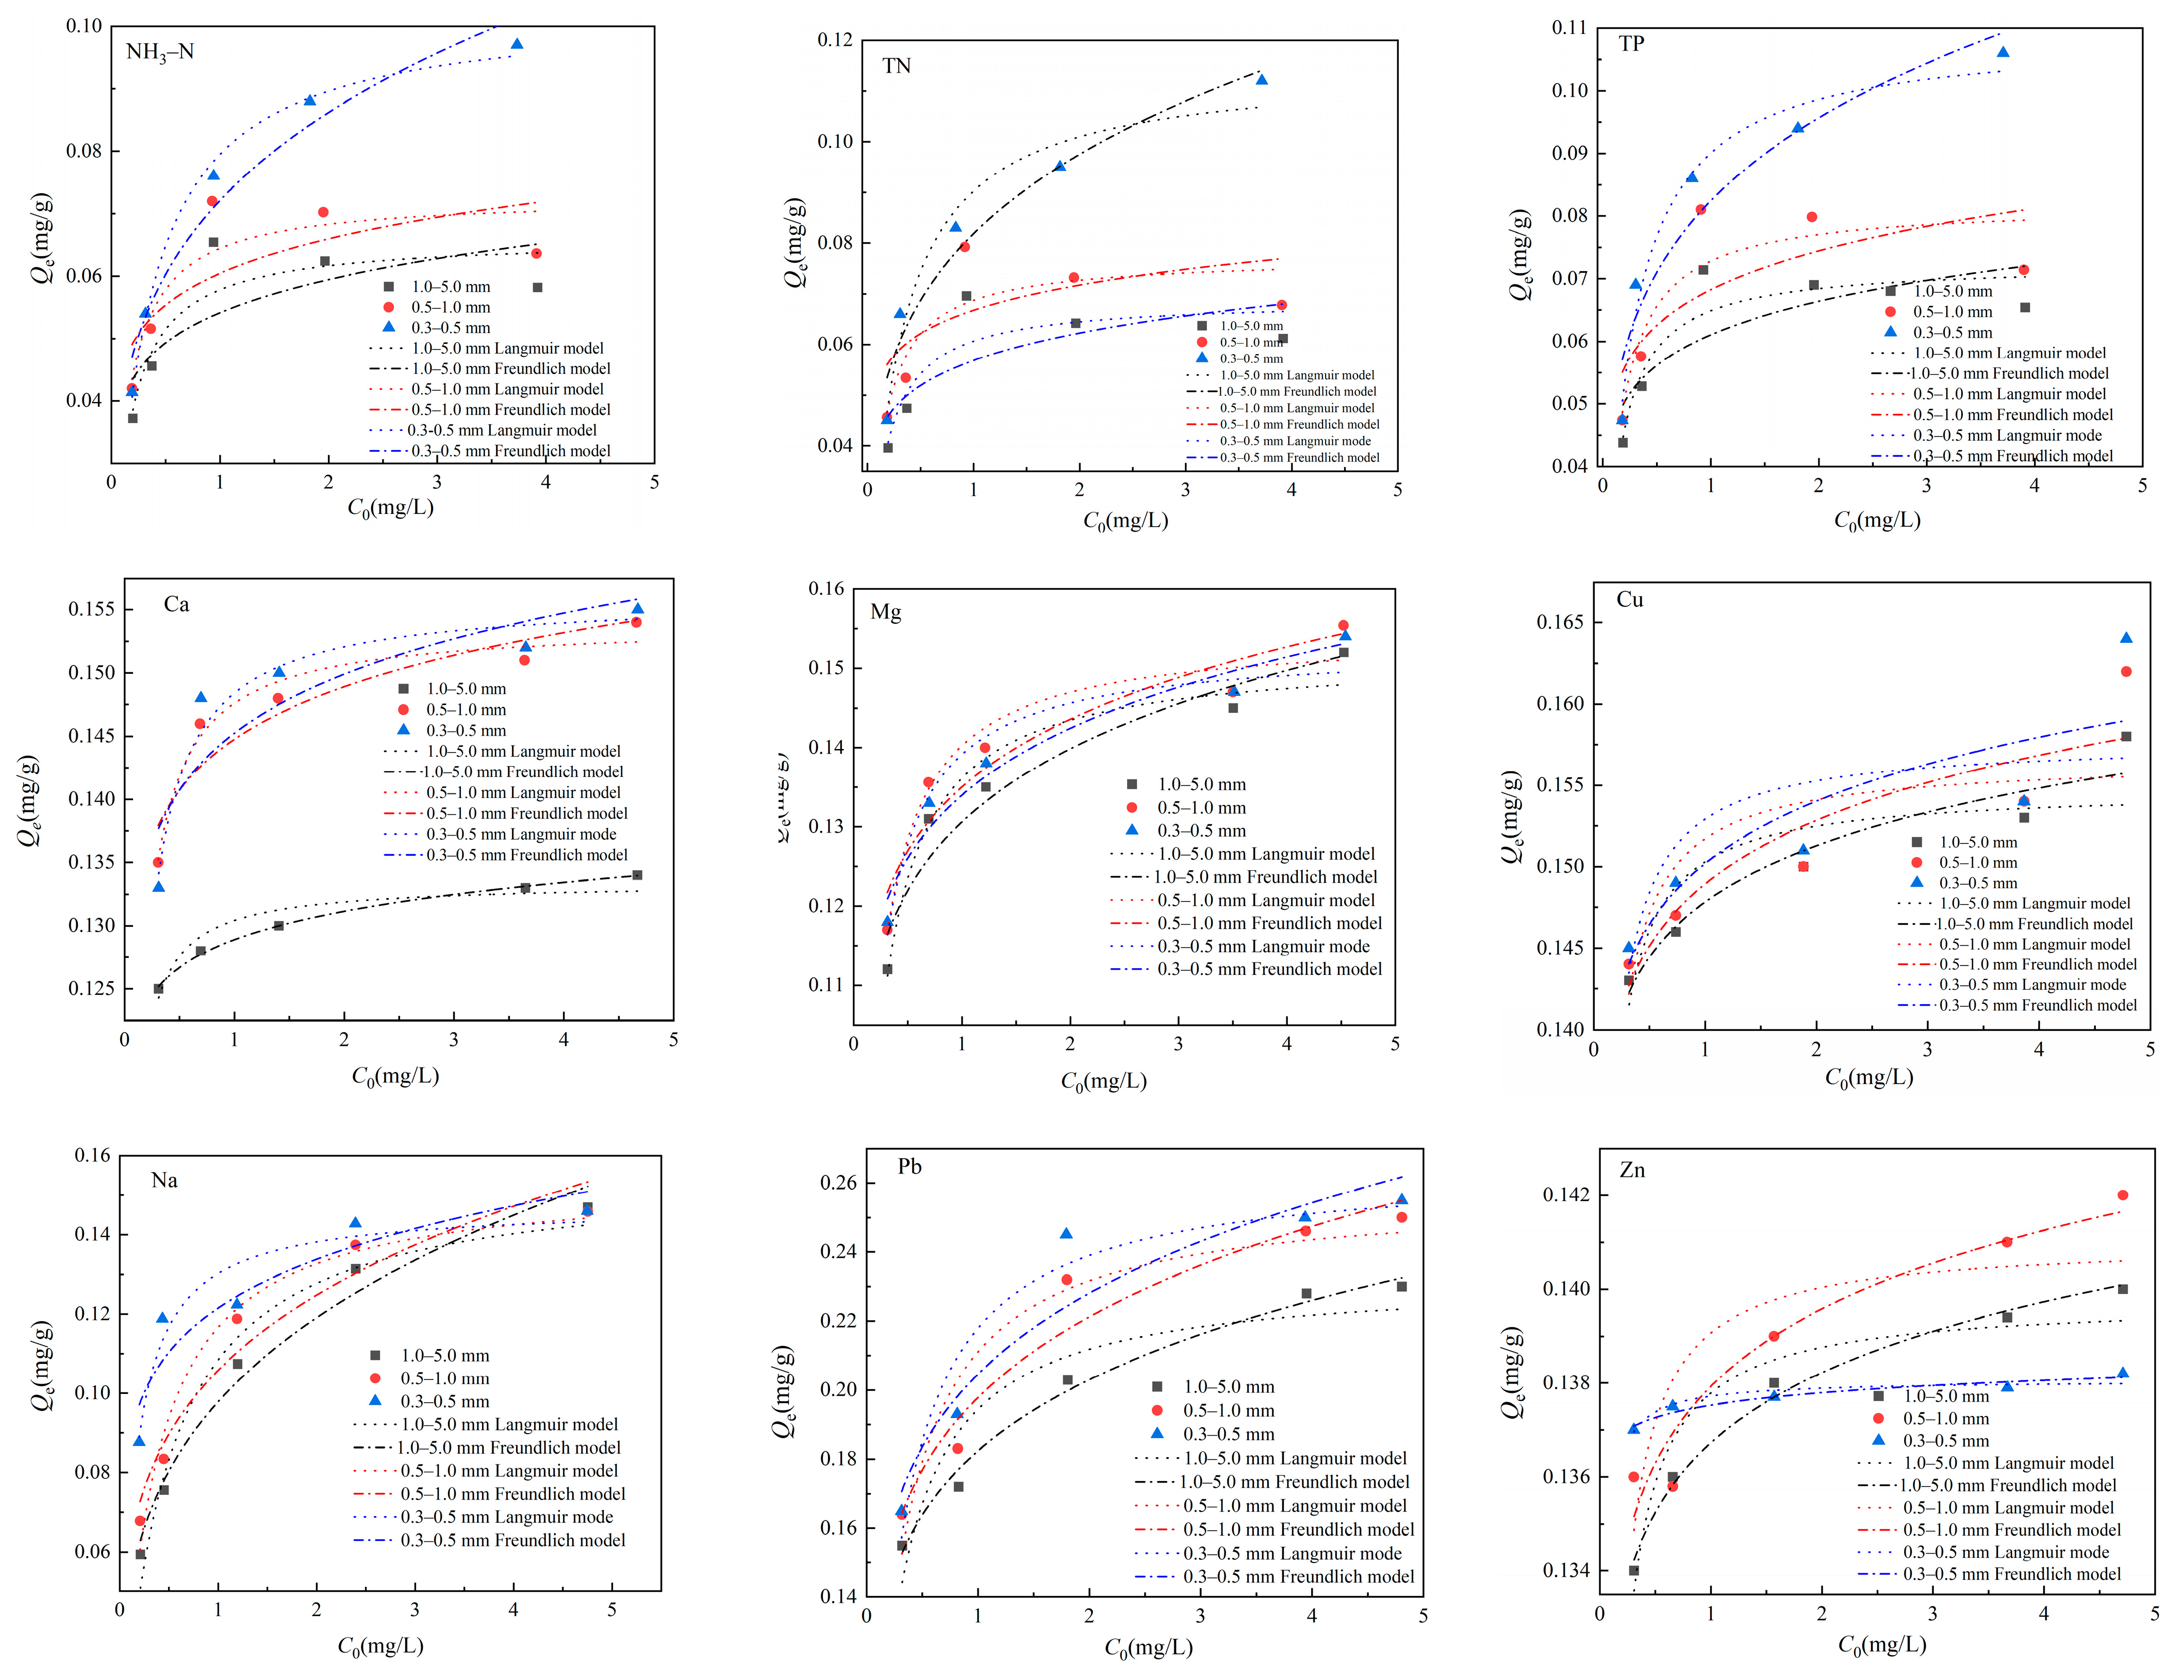
3.4.2. Adsorption Isotherms

Figure 9 and Table S5 show the adsorption isotherm results of major ions on MPs with different sizes, and the fitting parameters by the Langmuir and Freundlich models, respectively.
For MPs with a particle size of 0.3–0.5 mm, the adsorption of NH₃–N, TN, TP, and Na was better described by the Langmuir model (R2 = 0.97–0.99) compared with the Freundlich model (R2 = 0.89–0.96). The high correlation coefficient of the Langmuir model showed that the adsorption sites on the MPs were homogeneous and limited in number, and the adsorption process was primarily driven by chemical interactions, not multilayer physical adsorption. The high Langmuir constant (KL value, e.g., 4.761 L/mg for TP) further confirmed the strong adsorption affinity of MPs for phosphate. In addition, since NH3–N, TN, and Na primarily exist in ionic forms, they may interact electrostatically with negatively charged functional groups (e.g., carboxyl or hydroxyl groups) on the MP surfaces, thereby further improving adsorption.
For MPs with a particle size of 0.5–1.0 mm, the adsorption of Ca, Mg, and Cu exhibited a higher degree of consistency with the Langmuir model (R2 = 0.93–0.97) compared with the Freundlich model (R2 = 0.83–0.92). This finding indicates that MPs of this size adsorb metal ions predominantly via a monolayer adsorption mechanism, with the adsorption process potentially involving ion exchange and complexation [106]. Furthermore, the weak adsorption capacity of MPs for NH3–N, TN, and TP (Qm = 0.07–0.13 mg/g) supported the stability of these MPs in metal-rich environments, consistent with their positive correlation for metals and negative correlation for nutrients.
For MPs with a particle size of 1.0–5.0 mm, the adsorption of heavy metals exhibited a stronger correlation with the Langmuir model (R2 = 0.97–0.98) compared with the Freundlich model (R2 = 0.92–0.94). This observation shows that the adsorption process is limited by the availability of binding sites, and may involve metal complexation [107]. Compared with smaller particle-sized MPs, the MPs in this particle size range had lower specific surface areas and fewer available adsorption sites, resulting in relatively lower adsorption capacity, resulting in a comparatively lower adsorption capacity. The critical role of surface functional groups (e.g., carboxyl groups) in metal adsorption has been emphasized by Khalid et al. [93] and Tang et al. [108]. The lower Qm values (e.g., 0.140 mg/g for Zn) further reflect the restricted nature of larger MPs in the adsorption of metals.
Isotherm parameters further elucidated MP adsorption capacities. For MPs with a particle size of 0.3–0.5 mm, the high Qm values (e.g., 0.262 mg/g for Pb) and Langmuir constants (KL, e.g., 135.96 L/mg for Zn), coupled with strong correlation coefficients (R2 > 0.9), indicated a robust monolayer adsorption mechanism, particularly for metal ions. In contrast, MPs with a particle size of 0.5–1.0 mm showed comparable Qm values (e.g., 0.255 mg/g for Pb) but significantly lower KL values (e.g., 1.902 L/mg for Pb), indicating a reduced adsorption affinity despite similar adsorption capacities. For MPs with a particle size of 1.0–5.0 mm, the Qm values were the lowest (e.g., 0.231 mg/g for Pb), suggesting a reduced adsorption capacity due to the limited number of available active sites. However, the relatively high KL values (e.g., 23.501 L/mg for Zn) implied that these larger MPs still retained some affinity for pollutants, albeit at a slower rate. This indicates that, while larger MPs may have fewer active sites, they can still effectively adsorb pollutants over longer exposure periods.
The Freundlich model further supported these findings, with 1/n values consistently less than 1 across all particle sizes, confirming favorable adsorption conditions. Smaller MPs (0.3–0.5 mm) exhibited higher Freundlich constants (KF, e.g., 0.182 for Pb), reflecting their greater adsorption capacity compared with larger MPs. These trends suggest that smaller MPs are more effective in sequestering pollutants due to their enhanced surface reactivity and higher availability of active sites, while larger MPs may require extended exposure times to achieve comparable adsorption efficiency.

4. Conclusions

The findings of this research show that microplastic pollution was found at domestic sewage outlets in Guilin, China. The range of microplastic abundance was 6 (±1)–47 (±3) items/L. The class of <0.3 mm dominated the size of the MPs. The results of correlation analysis revealed that the abundance of MPs was weakly correlated with hydrochemical parameters and metal ions. The possible reason was that the MPs were relatively pristine in the study area, meaning that they had undergone little weathering or degradation that enhanced their ability to absorb metals.
Redundancy analysis results reveal correlations between MPs’ morphology, size, hydrochemical parameters, and metal ions. Specifically, NO3-N had a greater influence on the distribution of microplastic fiber; Zn, Ca, and Cu had a greater influence on the distribution of microplastic film. For MPs with sizes of <0.3 mm and 0.3–0.5 mm, NH3–N, TN, TP, and Na were positively correlated; there were positive correlations with pH, SO42−, Al, Ca, Mg, and Cu. MPs of this size may be more stable in an alkaline and mineral-rich environment. For MPs with a size of 1.0–5.0 mm, there was a positive correlation with metal ions and anions, which indicates that these larger MPs particles tend to exist in an environment with a higher salt content and heavy pollution.
The interaction mechanisms between MPs, hydrochemical parameters, and metal ions were the focus of further exploration through isothermal and kinetic adsorption experiments. The experimental findings demonstrate that there were substantial variations in the adsorption capacity of MPs with different particle sizes for nutrients such as TN, TP, and NH3–N. MPs with a size of 0.3–0.5 mm exhibited superior adsorption capacity, a phenomenon attributed to their larger specific surface area and increased number of active sites, which facilitated chemisorption. In contrast, MPs with a size of 0.5–1.0 mm exhibited a higher selectivity for metal ions, with adsorption primarily governed by chemisorption mechanisms. Meanwhile, MPs with a size of 1.0–5.0 mm showed lower adsorption capacities due to their reduced specific surface area and limited active sites, with adsorption processes more influenced by physical diffusion and internal particle diffusion. These findings highlight the critical role of particle size in determining the adsorption behavior of MPs in aquatic environments.
In conclusion, hydrochemical parameters and metal ions have been demonstrated to exert a significant influence on the properties of MPs. Although the overall correlation is weak, it has been shown to increase under specific conditions, especially when considering the morphology and particle size of MPs. These findings underscore the necessity for a comprehensive analysis of water quality parameters to enhance our understanding of the behavior of MPs in the aquatic environment and their potential impact on the ecosystem. It is recommended that future studies extend the experimental scope to encompass the effects of microplastic color, shape, and varying particle sizes on the water environment, in addition to a more comprehensive array of water quality indicators, including seasonal variations and turbidity.
Nevertheless, this study has certain limitations. First, the sampling was conducted during a specific period, which may not have fully captured the seasonal variations in MP distribution and adsorption behavior. Future research should incorporate long-term monitoring to better understand the temporal dynamics of MPs in different environmental conditions. Second, this study identified potential sources of MPs based on sampling locations (e.g., wastewater treatment plant effluents and urban areas), but it did not quantitatively determine the contribution of different sources. The importance of source apportionment for a comprehensive understanding of MP pollution is acknowledged. It is recommended that future research incorporate advanced tracking techniques, such as employing tracking techniques such as stable isotope analysis or Fourier transform infrared spectroscopy (FTIR) to accurately quantify the contributions of various sources. Thirdly, although this study examined the adsorption of nutrients and metal ions, other influencing factors such as organic pollutants, microbial biofilms, and water flow dynamics were not considered, which may also affect MP adsorption behavior. Additionally, this study was conducted in a karst region, where hydrochemical conditions may differ from other geographical settings. To further explore the potential risks of hydrochemical parameters and metal ions on the distribution of MPs, future studies should broaden the experimental scope to investigate the effects of additional factors, such as MP color, shape, and seasonal variations (e.g., rainy and dry seasons), along with other water indicators like turbidity.

Supplementary Materials

The following supporting information can be downloaded at: https://www.mdpi.com/article/10.3390/w17060868/s1, Table S1: Information of water sampling, Table S2: Abundance distribution of MPs at each sampling site, Table S3: Forward selection analysis results of MPs’ size and morphology hydrochemical parameters, Table S4: Adsorption kinetic parameters, Table S5: Adsorption isotherm parameters.

Author Contributions

Methodology, H.Z.; Validation, Y.L.; Investigation, X.L.; Writing—original draft, M.L.; Writing—review & editing, H.S.; Visualization, Y.S. All authors have read and agreed to the published version of the manuscript.

Funding

This research was funded by the National Natural Science Foundation of China (42167026), the Natural Science Foundation of Guangxi (2022GXNSFBA035600), and the Guilin University of Technology Program (GLUTQD 2016047).

Data Availability Statement

All data used during the study appear in the submitted article.

Acknowledgments

The authors thank the three anonymous reviewers for their constructive comments, which helped improve the quality of the manuscript.

Conflicts of Interest

The authors declare no conflict of interest.

References

  1. Thompson, R.C.; Olsen, Y.; Mitchell, R.P.; Davis, A.; Rowland, S.J.; John, A.W.G.; McGonigle, D.; Russell, A.E. Lost at Sea: Where Is All the Plastic? Science 2004, 304, 838. [Google Scholar] [CrossRef]
  2. Zhang, L.; Xie, Y.; Zhong, S.; Liu, J.; Qin, Y.; Gao, P. Microplastics in freshwater and wild fishes from Lijiang River in Guangxi, Southwest China. Sci. Total Environ. 2021, 755, 142428. [Google Scholar] [CrossRef]
  3. Sun, J.; Peng, Z.; Zhu, Z.-R.; Fu, W.; Dai, X.; Ni, B.-J. The atmospheric microplastics deposition contributes to microplastic pollution in urban waters. Water Res. 2022, 225, 119116. [Google Scholar] [CrossRef] [PubMed]
  4. Atugoda, T.; Vithanage, M.; Wijesekara, H.; Bolan, N.; Sarmah, A.K.; Bank, M.S.; You, S.; Ok, Y.S. Interactions between microplastics, pharmaceuticals and personal care products: Implications for vector transport. Environ. Int. 2021, 149, 106367. [Google Scholar] [CrossRef]
  5. De Falco, F.; Di Pace, E.; Cocca, M.; Avella, M. The contribution of washing processes of synthetic clothes to microplastic pollution. Sci. Rep. 2019, 9, 6633. [Google Scholar] [CrossRef] [PubMed]
  6. Galvão, A.; Aleixo, M.; De Pablo, H.; Lopes, C.; Raimundo, J. Microplastics in wastewater: Microfiber emissions from common household laundry. Environ. Sci. Pollut. Res. 2020, 27, 26643–26649. [Google Scholar] [CrossRef] [PubMed]
  7. Buwono, N.R.; Risjani, Y.; Soegianto, A. Distribution of microplastic in relation to water quality parameters in the Brantas River, East Java, Indonesia. Environ. Technol. Innov. 2021, 24, 101915. [Google Scholar] [CrossRef]
  8. Liu, K.; Wang, X.; Fang, T.; Xu, P.; Zhu, L.; Li, D. Source and potential risk assessment of suspended atmospheric microplastics in Shanghai. Sci. Total Environ. 2019, 675, 462–471. [Google Scholar] [CrossRef]
  9. Feng, S.; Lu, H.; Yao, T.; Liu, Y.; Tian, P.; Lu, J. Microplastic footprints in the Qinghai-Tibet Plateau and their implications to the Yangtze River Basin. J. Hazard. Mater. 2021, 407, 124776. [Google Scholar] [CrossRef]
  10. Xu, H.; Nakano, H.; Tokai, T.; Miyazaki, T.; Hamada, H.; Arakawa, H. Contamination of sea surface water offshore the Tokai region and Tokyo Bay in Japan by small microplastics. Mar. Pollut. Bull. 2022, 185, 114245. [Google Scholar] [CrossRef]
  11. Aransiola, S.A.; Victor-Ekwebelem, M.O.; Daza, B.X.; Oladoye, P.O.; Alli, Y.A.; Bamisaye, A.; Aransiola, A.B.; Oni, A.O.; Maddela, N.R. Micro- and nano-plastics pollution in the marine environment: Progresses, drawbacks and future guidelines. Chemosphere 2025, 374, 144211. [Google Scholar] [CrossRef]
  12. Sun, X.; Wang, T.; Chen, B.; Booth, A.M.; Liu, S.; Wang, R.; Zhu, L.; Zhao, X.; Qu, K.; Xia, B. Factors influencing the occurrence and distribution of microplastics in coastal sediments: From source to sink. J. Hazard. Mater. 2021, 410, 124982. [Google Scholar] [CrossRef] [PubMed]
  13. Scheurer, M.; Bigalke, M. Microplastics in Swiss Floodplain Soils. Environ. Sci. Technol. 2018, 52, 3591–3598. [Google Scholar] [CrossRef] [PubMed]
  14. Zhou, B.; Wang, J.; Zhang, H.; Shi, H.; Fei, Y.; Huang, S.; Tong, Y.; Wen, D.; Luo, Y.; Barceló, D. Microplastics in agricultural soils on the coastal plain of Hangzhou Bay, east China: Multiple sources other than plastic mulching film. J. Hazard. Mater. 2020, 388, 121814. [Google Scholar] [CrossRef]
  15. Wang, W.; Ndungu, A.W.; Li, Z.; Wang, J. Microplastics pollution in inland freshwaters of China: A case study in urban surface waters of Wuhan, China. Sci. Total Environ. 2017, 575, 1369–1374. [Google Scholar] [CrossRef]
  16. Van Emmerik, T.; Schwarz, A. Plastic debris in rivers. WIREs Water 2020, 7, e1398. [Google Scholar] [CrossRef]
  17. Wen, X.; Du, C.; Xu, P.; Zeng, G.; Huang, D.; Yin, L.; Yin, Q.; Hu, L.; Wan, J.; Zhang, J.; et al. Microplastic pollution in surface sediments of urban water areas in Changsha, China: Abundance, composition, surface textures. Mar. Pollut. Bull. 2018, 136, 414–423. [Google Scholar] [CrossRef]
  18. Liu, X.; Yuan, W.; Di, M.; Li, Z.; Wang, J. Transfer and fate of microplastics during the conventional activated sludge process in one wastewater treatment plant of China. Chem. Eng. J. 2019, 362, 176–182. [Google Scholar] [CrossRef]
  19. Aryani, D.; Khalifa, M.A.; Herjayanto, M.; Pratama, G.; Rahmawati, A.; Putra, R.D.; Munandar, E. Correlation of Water Quality with Microplastic Exposure Prevalence in Tilapia (Oreochromis niloticus). In Proceedings of the E3S Web of Conferences Maritime Continent Fulcrum International Conference (MaCiFIC 2021); EDP Sciences: Les Ulis, France, 2021. [Google Scholar]
  20. Liu, Q.; Wu, H.; Chen, J.; Guo, B.; Zhao, X.; Lin, H.; Li, H.; Li, W.; Zhao, X.; Lv, S.; et al. Adsorption mechanism of trace heavy metals on microplastics and simulating their effect on microalgae in river. Environ. Res. 2022, 214, 113777. [Google Scholar] [CrossRef]
  21. Li, S.; Yang, M.; Wang, H.; Jiang, Y. Adsorption of microplastics on aquifer media: Effects of the action time, initial concentration, ionic strength, ionic types and dissolved organic matter. Environ. Pollut. 2022, 308, 119482. [Google Scholar] [CrossRef]
  22. Ma, J.; Zhao, J.; Zhu, Z.; Li, L.; Yu, F. Effect of microplastic size on the adsorption behavior and mechanism of triclosan on polyvinyl chloride. Environ. Pollut. 2019, 254, 113104. [Google Scholar] [CrossRef]
  23. Xue, X.-D.; Fang, C.-R.; Zhuang, H.-F. Adsorption behaviors of the pristine and aged thermoplastic polyurethane microplastics in Cu(II)-OTC coexisting system. J. Hazard. Mater. 2021, 407, 124835. [Google Scholar] [CrossRef] [PubMed]
  24. Hasenmueller, E.A.; Baraza, T.; Hernandez, N.F.; Finegan, C.R. Cave sediment sequesters anthropogenic microparticles (including microplastics and modified cellulose) in subsurface environments. Sci. Total Environ. 2023, 893, 164690. [Google Scholar] [CrossRef]
  25. Kumar, V.; Singh, E.; Singh, S.; Pandey, A.; Bhargava, P.C. Micro- and nano-plastics (MNPs) as emerging pollutant in ground water: Environmental impact, potential risks, limitations and way forward towards sustainable management. Chem. Eng. J. 2023, 459, 141568. [Google Scholar] [CrossRef]
  26. Gong, X.; Tian, L.; Wang, P.; Wang, Z.; Zeng, L.; Hu, J. Microplastic pollution in the groundwater under a bedrock island in the South China sea. Environ. Res. 2023, 239, 117277. [Google Scholar] [CrossRef]
  27. Zhang, L.; Liu, J.; Xie, Y.; Zhong, S.; Gao, P. Occurrence and removal of microplastics from wastewater treatment plants in a typical tourist city in China. J. Clean. Prod. 2021, 291, 125968. [Google Scholar] [CrossRef]
  28. Shu, X.; Xu, L.; Yang, M.; Qin, Z.; Zhang, Q.; Zhang, L. Spatial distribution characteristics and migration of microplastics in surface water, groundwater and sediment in karst areas: The case of Yulong River in Guilin, Southwest China. Sci. Total Environ. 2023, 868, 161578. [Google Scholar] [CrossRef]
  29. Masura, J.; Baker, J.; Foster, G.; Arthur, C. Laboratory Methods for the Analysis of Microplastics in the Marine Environment; NOAA Technical Memorandum NOS-OR&R-48; NOAA Marine Debris Division: Silver Spring, MD, USA, 2015. [Google Scholar]
  30. Hidalgo-Ruz, V.; Gutow, L.; Thompson, R.C.; Thiel, M. Microplastics in the Marine Environment: A Review of the Methods Used for Identification and Quantification. Environ. Sci. Technol. 2012, 46, 3060–3075. [Google Scholar] [CrossRef]
  31. Zhao, K.; Zhou, S.; Wang, K.; Li, D.; Liu, H.; Li, F. Distribution characteristics and pollution risk assessment of microplastics in urban rivers: A case study in Yitong River, China. J. Water Process Eng. 2024, 61, 105277. [Google Scholar] [CrossRef]
  32. Mohamed Nor, N.H.; Obbard, J.P. Microplastics in Singapore’s coastal mangrove ecosystems. Mar. Pollut. Bull. 2014, 79, 278–283. [Google Scholar] [CrossRef]
  33. Lagergreen, S. Zur Theorie der sogenannten Adsorption gelöster Stoffe. Z. Chem. Ind. Kolloide 1907, 2, 15. [Google Scholar]
  34. Ho, Y.S.; McKay, G. Pseudo-second order model for sorption processes. Process Biochem. 1999, 34, 451–465. [Google Scholar] [CrossRef]
  35. Weber, T.W.; Chakravorti, R.K. Pore and solid diffusion models for fixed-bed adsorbers. AIChE J. 1974, 20, 228–238. [Google Scholar] [CrossRef]
  36. Langmuir, I. The adsorption of gases on plane surfaces of glass, mica and platinum. J. Am. Chem. Soc. 1918, 40, 1361–1403. [Google Scholar] [CrossRef]
  37. Namasivayam, C.; Senthilkumar, S. Removal of Arsenic(V) from Aqueous Solution Using Industrial Solid Waste: Adsorption Rates and Equilibrium Studies. Ind. Eng. Chem. Res. 1998, 37, 4816–4822. [Google Scholar] [CrossRef]
  38. Adomat, Y.; Grischek, T. Sampling and processing methods of microplastics in river sediments—A review. Sci. Total Environ. 2021, 758, 143691. [Google Scholar] [CrossRef]
  39. Koelmans, A.A.; Nor, N.H.M.; Hermsen, E.; Kooi, M.; Mintenig, S.M.; De France, J. Microplastics in freshwaters and drinking water: Critical review and assessment of data quality. Water Res. 2019, 155, 410–422. [Google Scholar] [CrossRef]
  40. Zhu, J.; Zhang, Q.; Huang, Y.; Jiang, Y.; Li, J.; Michal, J.J.; Jiang, Z.; Xu, Y.; Lan, W. Long-term trends of microplastics in seawater and farmed oysters in the Maowei Sea, China. Environ. Pollut. 2021, 273, 116450. [Google Scholar] [CrossRef]
  41. Xie, Y.H.; Liu, Z.; Gou, X.; Qin, Y.H.; Li, X.Y.; Chen, S.Y.; Shi, G.Z. Analysis on quality of domestic sewage and investigation of villages ’willingness from the rural areas of southwest China. Environ. Eng. 2018, 36, 165–169+188. [Google Scholar]
  42. Sefie, A.; Aris, A.Z.; Ramli, M.F.; Narany, T.S.; Shamsuddin, M.K.N.; Saadudin, S.B.; Zali, M.A. Hydrogeochemistry and groundwater quality assessment of the multilayered aquifer in Lower Kelantan Basin, Kelantan, Malaysia. Environ. Earth Sci. 2018, 77, 397. [Google Scholar] [CrossRef]
  43. Hu, Y.; Cheng, H.; Tao, S. Environmental and human health challenges of industrial livestock and poultry farming in China and their mitigation. Environ. Int. 2017, 107, 111–130. [Google Scholar] [CrossRef]
  44. Peterse, I.F.; Hendriks, L.; Weideveld, S.T.; Smolders, A.J.; Lamers, L.P.; Lücker, S.; Veraart, A.J. Wastewater-effluent discharge and incomplete denitrification drive riverine CO2, CH4 and N2O emissions. Sci. Total Environ. 2024, 951, 175797. [Google Scholar] [CrossRef] [PubMed]
  45. Dailey, K.R.; Welch, K.A.; Lyons, W.B. Evaluating the influence of road salt on water quality of Ohio rivers over time. Appl. Geochem. 2014, 47, 25–35. [Google Scholar] [CrossRef]
  46. Kukkola, A.; Runkel, R.L.; Schneidewind, U.; Murphy, S.F.; Kelleher, L.; Smith, G.H.S.; Nel, H.A.; Lynch, I.; Krause, S. Prevailing impacts of river management on microplastic transport in contrasting US streams: Rethinking global microplastic flux estimations. Water Res. 2023, 240, 120112. [Google Scholar] [CrossRef]
  47. Sun, J.; Dai, X.; Wang, Q.; van Loosdrecht, M.C.; Ni, B.-J. Microplastics in wastewater treatment plants: Detection, occurrence and removal. Water Res. 2019, 152, 21–37. [Google Scholar] [CrossRef] [PubMed]
  48. Liu, W.; Zhang, J.; Liu, H.; Guo, X.; Zhang, X.; Yao, X.; Cao, Z.; Zhang, T. A review of the removal of microplastics in global wastewater treatment plants: Characteristics and mechanisms. Environ. Int. 2021, 146, 106277. [Google Scholar] [CrossRef]
  49. Shi, H.; Yu, D.; Yin, L.; Sui, Y.; Liu, Y.; Qiao, S.; Wang, W.; Zheng, W.; Ding, D. Source-sink process of microplastics in watershed-estuary-offshore system. J. Clean. Prod. 2022, 338, 130612. [Google Scholar] [CrossRef]
  50. Abbasi, S.; Keshavarzi, B.; Moore, F.; Turner, A.; Kelly, F.J.; Dominguez, A.O.; Jaafarzadeh, N. Distribution and potential health impacts of microplastics and microrubbers in air and street dusts from Asaluyeh County, Iran. Environ. Pollut. 2019, 244, 153–164. [Google Scholar] [CrossRef]
  51. Li, Q.; Yuan, M.; Chen, Y.; Jin, X.; Shangguan, J.; Cui, J.; Chang, S.; Guo, M.; Wang, Y. The neglected potential source of microplastics from daily necessities: A study on protective mobile phone cases. J. Hazard. Mater. 2023, 441, 129911. [Google Scholar] [CrossRef]
  52. Guo, X.; Yin, Y.; Yang, C.; Dang, Z. Maize straw decorated with sulfide for tylosin removal from the water. Ecotoxicol. Environ. Saf. 2018, 152, 16–23. [Google Scholar] [CrossRef]
  53. Ding, R.; Ouyang, F.; Peng, D.; You, J.; Ding, L.; Ouyang, Z.; Liu, P.; Guo, X. A case study of distribution and characteristics of microplastics in surface water and sediments of the seas around Shenzhen, southern coastal area of China. Sci. Total Environ. 2022, 838, 156063. [Google Scholar] [CrossRef] [PubMed]
  54. Faure, F.; Corbaz, M.; Baecher, H. Pollution due to plastics and microplastics in Lake Geneva and in the Mediterranean Sea. Arch. Sci. 2012, 65, 157–164. [Google Scholar]
  55. Mintenig, S.; Int-Veen, I.; Löder, M.; Primpke, S.; Gerdts, G. Identification of microplastic in effluents of waste water treatment plants using focal plane array-based micro-Fourier-transform infrared imaging. Water Res. 2017, 108, 365–372. [Google Scholar] [CrossRef]
  56. Li, X.; Chen, L.; Mei, Q.; Dong, B.; Dai, X.; Ding, G.; Zeng, E.Y. Microplastics in sewage sludge from the wastewater treatment plants in China. Water Res. 2018, 142, 75–85. [Google Scholar] [CrossRef]
  57. Napper, I.E.; Thompson, R.C. Release of synthetic microplastic plastic fibres from domestic washing machines: Effects of fabric type and washing conditions. Mar. Pollut. Bull. 2016, 112, 39–45. [Google Scholar] [CrossRef]
  58. Imbulana, S.; Tanaka, S.; Oluwoye, I. Quantifying annual microplastic emissions of an urban catchment: Surface runoff vs wastewater sources. J. Environ. Manag. 2024, 360, 121123. [Google Scholar] [CrossRef] [PubMed]
  59. Wright, L.S.; Napper, I.E.; Thompson, R.C. Potential microplastic release from beached fishing gear in Great Britain’s region of highest fishing litter density. Mar. Pollut. Bull. 2021, 173, 113115. [Google Scholar] [CrossRef] [PubMed]
  60. Fadare, O.O.; Okoffo, E.D. COVID-19 face masks: A potential source of microplastic fibers in the environment. Sci. Total Environ. 2020, 737, 140279. [Google Scholar] [CrossRef]
  61. Liu, Z.; Wang, J.; Yang, X.; Huang, Q.; Zhu, K.; Sun, Y.; Van Hulle, S.; Jia, H. Generation of environmental persistent free radicals (EPFRs) enhances ecotoxicological effects of the disposable face mask waste with the COVID-19 pandemic. Environ. Pollut. 2022, 301, 119019. [Google Scholar] [CrossRef]
  62. Chen, H.; Chen, Y.; Xu, Y.; Xiao, C.; Liu, J.; Wu, R.; Guo, X. Different functional areas and human activities significantly affect the occurrence and characteristics of microplastics in soils of the Xi’an metropolitan area. Sci. Total Environ. 2022, 852, 158581. [Google Scholar] [CrossRef]
  63. Xiong, X.; Zhang, K.; Chen, X.; Shi, H.; Luo, Z.; Wu, C. Sources and distribution of microplastics in China’s largest inland lake—Qinghai Lake. Environ. Pollut. 2018, 235, 899–906. [Google Scholar] [CrossRef]
  64. Cai, M.; Liu, M.; Qi, H.; Cui, Y.; Zhang, M.; Huang, P.; Wang, L.; Xie, M.; Li, Y.; Wang, W.; et al. Transport of microplastics in the South China Sea: A review. Gondwana Res. 2022, 108, 49–59. [Google Scholar] [CrossRef]
  65. Yan, M.; Nie, H.; Xu, K.; He, Y.; Hu, Y.; Huang, Y.; Wang, J. Microplastic abundance, distribution and composition in the Pearl River along Guangzhou city and Pearl River estuary, China. Chemosphere 2019, 217, 879–886. [Google Scholar] [CrossRef] [PubMed]
  66. Wang, W.; Yuan, W.; Chen, Y.; Wang, J. Microplastics in surface waters of Dongting Lake and Hong Lake, China. Sci. Total Environ. 2018, 633, 539–545. [Google Scholar] [CrossRef] [PubMed]
  67. Chubarenko, I.; Efimova, I.; Bagaeva, M.; Bagaev, A.; Isachenko, I. On mechanical fragmentation of single-use plastics in the sea swash zone with different types of bottom sediments: Insights from laboratory experiments. Mar. Pollut. Bull. 2020, 150, 110726. [Google Scholar] [CrossRef]
  68. Talvitie, J.; Mikola, A.; Koistinen, A.; Setälä, O. Solutions to microplastic pollution—Removal of microplastics from wastewater effluent with advanced wastewater treatment technologies. Water Res. 2017, 123, 401–407. [Google Scholar] [CrossRef]
  69. Tang, N.; Liu, X.; Xing, W. Microplastics in wastewater treatment plants of Wuhan, Central China: Abundance, removal, and potential source in household wastewater. Sci. Total Environ. 2020, 745, 141026. [Google Scholar] [CrossRef]
  70. Sedgwick, P. Pearson’s correlation coefficient. BMJ 2012, 345, e4483. [Google Scholar] [CrossRef]
  71. Kothari, V.; Vij, S.; Sharma, S.; Gupta, N. Correlation of various water quality parameters and water quality index of districts of Uttarakhand. Environ. Sustain. Indic. 2021, 9, 100093. [Google Scholar] [CrossRef]
  72. Asuero, A.G.; Sayago, A.; González, A.G. The Correlation Coefficient: An Overview. Crit. Rev. Anal. Chem. 2006, 36, 41–59. [Google Scholar] [CrossRef]
  73. Li, Y.; Chen, H.; Teng, Y. Source apportionment and source-oriented risk assessment of heavy metals in the sediments of an urban river-lake system. Sci. Total Environ. 2020, 737, 140310. [Google Scholar] [CrossRef] [PubMed]
  74. Kim, Y.-I.; Jeong, E.; Lee, J.-Y.; Chia, R.W.; Raza, M. Microplastic contamination in groundwater on a volcanic Jeju Island of Korea. Environ. Res. 2023, 226, 115682. [Google Scholar] [CrossRef]
  75. Sarkar, D.J.; Das Sarkar, S.; Das, B.K.; Sahoo, B.K.; Das, A.; Nag, S.K.; Manna, R.K.; Behera, B.K.; Samanta, S. Occurrence, fate and removal of microplastics as heavy metal vector in natural wastewater treatment wetland system. Water Res. 2021, 192, 116853. [Google Scholar] [CrossRef] [PubMed]
  76. Li, X.; Jiang, X.; Song, Y.; Chang, S.X. Coexistence of polyethylene microplastics and biochar increases ammonium sorption in an aqueous solution. J. Hazard. Mater. 2021, 405, 124260. [Google Scholar] [CrossRef]
  77. Mahon, A.M.; O’connell, B.; Healy, M.G.; O’connor, I.; Officer, R.; Nash, R.; Morrison, L. Microplastics in Sewage Sludge: Effects of Treatment. Environ. Sci. Technol. 2017, 51, 810–818. [Google Scholar] [CrossRef]
  78. Radford, F.; Horton, A.A.; Felgate, S.; Lichtschlag, A.; Hunt, J.; Andrade, V.; Sanders, R.; Evans, C. Factors influencing microplastic abundances in the sediments of a seagrass-dominated tropical atoll. Environ. Pollut. 2024, 357, 124483. [Google Scholar] [CrossRef] [PubMed]
  79. Su, X.; Chen, C.; Li, J.; Lu, S.; Xu, G. Effect of Polypropylene Microplastics Concentration on Wastewater Denitrification. Sci. J. Chem. 2022, 10, 53. [Google Scholar] [CrossRef]
  80. Parrish, K.L.; Fahrenfeld, N. Microplastic biofilm in fresh- and wastewater as a function of microparticle type and size class. Environ. Sci. Water Res. Technol. 2019, 5, 495–505. [Google Scholar] [CrossRef]
  81. Nguyen, T.L.H.; Duong, T.L.; Nguyen, T.L.H.; Dang, T.Q.; Nguyen, T.H.; Dao, N.N.; Nguyen, K.T.; Duong, C.D.; Pham, N.N.; Nguyen, B.Q. Microplastics and trace metals in river sediment: Prevalence and correlation with multiple factors. Sci. Total Environ. 2023, 895, 165145. [Google Scholar] [CrossRef]
  82. Holmes, L.A.; Turner, A.; Thompson, R.C. Interactions between trace metals and plastic production pellets under estuarine conditions. Mar. Chem. 2014, 167, 25–32. [Google Scholar] [CrossRef]
  83. Wang, Q.; Zhang, Y.; Wangjin, X.; Wang, Y.; Meng, G.; Chen, Y. The adsorption behavior of metals in aqueous solution by microplastics effected by UV radiation. J. Environ. Sci. 2020, 87, 272–280. [Google Scholar] [CrossRef] [PubMed]
  84. Somasundaram, R.; Radhakrishnan, N. Establishment the relationship between water quality parameter and micro plastic concentration for Adyar and Cooum estuary. Environ. Qual. Manag. 2023, 33, 121–133. [Google Scholar] [CrossRef]
  85. Conowall, P.; Schreiner, K.M.; Minor, E.C.; Hrabik, T.; Schoenebeck, C.W. Variability of microplastic loading and retention in four inland lakes in Minnesota, USA. Environ. Pollut. 2023, 328, 121573. [Google Scholar] [CrossRef] [PubMed]
  86. Janakiram, R.; Keerthivasan, R.; Janani, R.; Ramasundaram, S.; Venkatesan, R.; Murthy, M.R.; Sudhakar, T. Seasonal distribution of microplastics in surface waters of the Northern Indian Ocean. Mar. Pollut. Bull. 2023, 190, 114838. [Google Scholar] [CrossRef]
  87. Jin, X.; Fu, X.; Lu, W.; Wang, H. The effects of riverside cities on microplastics in river water: A case study on the Southern Jiangsu Canal, China. Sci. Total Environ. 2023, 858, 159783. [Google Scholar] [CrossRef]
  88. Yan, Z.; Chen, Y.; Bao, X.; Zhang, X.; Ling, X.; Lu, G.; Liu, J.; Nie, Y. Microplastic pollution in an urbanized river affected by water diversion: Combining with active biomonitoring. J. Hazard. Mater. 2021, 417, 126058. [Google Scholar] [CrossRef]
  89. Kataoka, T.; Nihei, Y.; Kudou, K.; Hinata, H. Assessment of the sources and inflow processes of microplastics in the river environments of Japan. Environ. Pollut. 2019, 244, 958–965. [Google Scholar] [CrossRef]
  90. Wang, L.; Liu, M.; Tao, W.; Zhang, W.; Wang, L.; Shi, X.; Lu, X.; Li, X. Pollution characteristics and health risk assessment of phthalate esters in urban soil in the typical semi-arid city of Xi’an, Northwest China. Chemosphere 2018, 191, 467–476. [Google Scholar] [CrossRef] [PubMed]
  91. Legendre, P.; Oksanen, J.; ter Braak, C.J.F. Testing the significance of canonical axes in redundancy analysis. Methods Ecol. Evol. 2011, 2, 269–277. [Google Scholar] [CrossRef]
  92. Xu, N.; Jiang, L.; Zhang, Y.; Shen, Y.; Wang, Y.; Wang, S.; Yuan, Q. Microplastic pollution in the offshore sea, rivers and wastewater treatment plants in Jiangsu coastal area in China. Mar. Environ. Res. 2023, 188, 105992. [Google Scholar] [CrossRef]
  93. Khalid, N.; Aqeel, M.; Noman, A.; Khan, S.M.; Akhter, N. Interactions and effects of microplastics with heavy metals in aquatic and terrestrial environments. Environ. Pollut. 2021, 290, 118104. [Google Scholar] [CrossRef] [PubMed]
  94. Gao, F.; Li, J.; Sun, C.; Zhang, L.; Jiang, F.; Cao, W.; Zheng, L. Study on the capability and characteristics of heavy metals enriched on microplastics in marine environment. Mar. Pollut. Bull. 2019, 144, 61–67. [Google Scholar] [CrossRef]
  95. Turner, A.; Filella, M. Hazardous metal additives in plastics and their environmental impacts. Environ. Int. 2021, 156, 106622. [Google Scholar] [CrossRef]
  96. Godoy, V.; Blázquez, G.; Calero, M.; Quesada, L.; Martín-Lara, M. The potential of microplastics as carriers of metals. Environ. Pollut. 2019, 255, 113363. [Google Scholar] [CrossRef]
  97. Almeida CM, R.; Manjate, E.; Ramos, S. Adsorption of Cd and Cu to different types of microplastics in estuarine salt marsh medium. Mar. Pollut. Bull. 2020, 151, 110797. [Google Scholar] [CrossRef] [PubMed]
  98. Liu, S.; Huang, J.; Shi, L.; He, W.; Zhang, W.; Li, E.; Zhang, C.; Pang, H.; Tan, X. Interaction of Pb(II) with microplastic-sediment complexes: Critical effect of surfactant. Environ. Pollut. 2024, 361, 124815. [Google Scholar] [CrossRef] [PubMed]
  99. Zhao, M.; Huang, L.; Arulmani, S.R.B.; Yan, J.; Wu, L.; Wu, T.; Zhang, H.; Xiao, T. Adsorption of Different Pollutants by Using Microplastic with Different Influencing Factors and Mechanisms in Wastewater: A Review. Nanomaterials 2022, 12, 2256. [Google Scholar] [CrossRef]
  100. Shen, M.; Song, B.; Zeng, G.; Zhang, Y.; Teng, F.; Zhou, C. Surfactant changes lead adsorption behaviors and mechanisms on microplastics. Chem. Eng. J. 2021, 405, 126989. [Google Scholar] [CrossRef]
  101. Wang, F.; Zhang, M.; Sha, W.; Wang, Y.; Hao, H.; Dou, Y.; Li, Y. Sorption Behavior and Mechanisms of Organic Contaminants to Nano and Microplastics. Molecules 2020, 25, 1827. [Google Scholar] [CrossRef]
  102. Li, Z.; Tang, X.; Chen, Y.; Wei, L.; Wang, Y. Activation of Firmiana Simplex leaf and the enhanced Pb(II) adsorption performance: Equilibrium and kinetic studies. J. Hazard. Mater. 2009, 169, 386–394. [Google Scholar] [CrossRef]
  103. Qi, K.; Lu, N.; Zhang, S.; Wang, W.; Wang, Z.; Guan, J. Uptake of Pb(II) onto microplastic-associated biofilms in freshwater: Adsorption and combined toxicity in comparison to natural solid substrates. J. Hazard. Mater. 2021, 411, 125115. [Google Scholar] [CrossRef] [PubMed]
  104. Chen, Q.; Zheng, J.; Yang, Q.; Dang, Z.; Zhang, L. Effect of carbon chain structure on the phthalic acid esters (PAEs) adsorption mechanism by mesoporous cellulose biochar. Chem. Eng. J. 2019, 362, 383–391. [Google Scholar] [CrossRef]
  105. Lin, Z.; Hu, Y.; Yuan, Y.; Hu, B.; Wang, B. Comparative analysis of kinetics and mechanisms for Pb(II) sorption onto three kinds of microplastics. Ecotoxicol. Environ. Saf. 2021, 208, 111451. [Google Scholar] [CrossRef] [PubMed]
  106. Sahoo, T.R.; Prelot, B. Chapter 7—Adsorption Processes for the Removal of Contaminants from Wastewater: The Perspective Role of Nanomaterials and Nanotechnology; Bonelli, B., Freyria, F.S., Rossetti, I., Sethi, R., Eds.; Nanomaterials for the Detection and Removal of Wastewater Pollutants; Elsevier: Amsterdam, The Netherlands, 2020; pp. 161–222. [Google Scholar]
  107. Li, Y.; Li, M.; Li, Z.; Yang, L.; Liu, X. Effects of particle size and solution chemistry on Triclosan sorption on polystyrene microplastic. Chemosphere 2019, 231, 308–314. [Google Scholar] [CrossRef]
  108. Tang, S.; Lin, L.; Wang, X.; Yu, A.; Sun, X. Interfacial interactions between collected nylon microplastics and three divalent metal ions (Cu(II), Ni(II), Zn(II)) in aqueous solutions. J. Hazard. Mater. 2021, 403, 123548. [Google Scholar] [CrossRef]
Figure 1. Study area and sampling locations.
Water 17 00868 g001
Figure 2. Abundance distribution of MPs in the domestic sewage water samples.
Water 17 00868 g002
Figure 3. Photographs of MP items, where (ac) are identified as fiber, and (d,e) are identified as film.
Water 17 00868 g003
Figure 4. Classification of MP morphology (a) and size (b).
Water 17 00868 g004
Figure 5. Pearson correlation matrix between MP abundance and hydrochemical parameters.
Water 17 00868 g005
Figure 6. Redundancy analysis results of (a) the sizes of MPs and (b) the shapes of MPs with hydrochemical parameters in the domestic sewage water. Note: The length of the arrow in the figure represents the proportion of the explanatory variable. The angle between the arrows representing the variables indicates the correlation between the variables. When the angle is acute, it indicates a positive correlation between the variables, and when the angle is obtuse, it indicates a negative correlation between the variables. The farther the variables are, the weaker the correlation between their variables.
Water 17 00868 g006
Figure 7. Adsorption kinetics of major ions with MPs of different sizes.
Water 17 00868 g007
Figure 8. The intraparticle diffusion model fitting curve of the adsorption process.
Water 17 00868 g008
Figure 9. Adsorption isotherm model of major ions on MPs with different sizes.
Water 17 00868 g009
Table 1. Hydrochemical analysis results.
RegionsParametersMaxMinMeanMean ± SECV
GR areaNH3–N (mg/L)0.4950.0260.1280.128 ± 0.040104.347
TN (mg/L)1.3570.7390.9860.986 ± 0.05217.501
TP (mg/L)0.3800.0100.1350.135 ± 0.041106.832
NO3-N (mg/L)4.2390.8162.1832.183 ± 0.34552.434
Cl (mg/L)8.9941.7153.8673.867 ± 0.69759.774
SO42− (mg/L)9.3321.4663.9773.977 ± 0.67656.438
pH7.846.597.3147.314 ± 0.1195.401
Ec (μS/cm)219.666.8136.991136.991 ± 15.30837.077
Ca (mg/L)57.9602.98032.68132.681 ± 6.05061.401
K (mg/L)6.6601.7503.3273.327 ± 0.53953.711
Na (mg/L)16.5804.6409.0279.027 ± 0.98236.088
Mg (mg/L)6.6701.4203.9343.934 ± 0.56647.760
As (μg/L)8.2164.5205.8915.891 ± 0.35720.134
Cu (mg/L)0.0100.0010.0060.006 ± 0.00150.000
Fe (mg/L)0.0700.0000.0190.019 ± 0.006110.526
Al (mg/L)0.1500.0300.0930.093 ± 0.01244.086
Mn (mg/L)0.1100.0300.0710.071 ± 0.01045.070
Pb (mg/L)0.1300.0600.0950.095 ± 0.00622.105
Zn (mg/L)1.0700.1000.5360.536 ± 0.11772.574
Cd (mg/L)0.0200.0000.0090.009 ± 0.00266.667
LC areaNH3–N (mg/L)0.0570.0250.0380.038 ± 0.00735.771
TN (mg/L)0.5960.490.5430.543 ± 0.0279.672
TP (mg/L)0.0270.0080.0170.017 ± 0.00447.303
NO3-N (mg/L)2.460.8681.2941.294 ± 0.38960.126
Cl (mg/L)2.0010.8851.4771.477 ± 0.27336.965
SO42− (mg/L)6.5942.4654.0344.034 ± 0.98748.922
pH7.7907.4507.6307.630 ± 0.0872.295
Ec (μS/cm)34964158.500158.50 ± 66.71384.180
Ca (mg/L)66.85011.46048.25348.253 ± 17.86864.136
K (mg/L)3.7801.6202.5802.580 ± 0.65844.147
Na (mg/L)12.4808.73010.03310.033 ± 1.16320.085
Mg (mg/L)3.6001.1002.2572.257 ± 0.76959.017
As (μg/L)8.0966.2726.8816.881 ± 0.58614.752
Cu (mg/L)0.0110.0030.0080.008 ± 0.00250.000
Fe (mg/L)0.0000.00000.000 ± 0.0000.000
Al (mg/L)0.1500.0300.1030.103 ± 0.03762.136
Mn (mg/L)0.0600.0200.0370.037 ± 0.01256.757
Pb (mg/L)0.1000.0900.0930.093 ± 0.0036.452
Zn (mg/L)0.8700.0100.3170.317 ± 0.266145.110
Cd (mg/L)0.0200.0000.0100.010 ± 0.006100.000
FW areaNH3–N (mg/L)0.0230.0130.0170.017 ± 0.00329.605
TN (mg/L)0.8500.3940.6480.648 ± 0.13435.864
TP (mg/L)0.0230.0060.0140.014 ± 0.00563.085
NO3-N (mg/L)2.0280.8161.3331.333 ± 0.36146.887
Cl (mg/L)3.8031.4812.5432.543 ± 0.67846.141
SO42− (mg/L)7.0262.2663.8793.879 ± 1.57470.267
pH7.9207.2107.4807.480 ± 0.2225.138
Ec (μS/cm)35548.40159.20159.20 ± 98.244106.820
Ca (mg/L)50.32015.69025.04025.040 ± 8.05664.351
K (mg/L)1.6100.8101.1521.152 ± 0.16829.167
Na (mg/L)8.1707.1407.6577.657 ± 0.1985.161
Mg (mg/L)3.1201.2902.0772.077 ± 0.41139.576
As (μg/L)5.3964.6284.9604.960 ± 0.1626.532
Cu (mg/L)0.0150.0040.0090.009 ± 0.00255.556
Fe (mg/L)0.0100.0000.0050.005 ± 0.003120.000
Al (mg/L)0.1900.0400.0980.098 ± 0.03570.408
Mn (mg/L)0.0500.0200.0300.030 ± 0.00746.667
Pb (mg/L)0.0900.0200.0670.067 ± 0.01750.746
Zn (mg/L)0.3200.1200.1920.192 ± 0.04546.354
Cd (mg/L)0.0100.0100.0100.010 ± 0.0000.000
PR areaNH3–N (mg/L)0.0390.0280.0330.033 ± 0.00623.218
TN (mg/L)0.7750.6720.7240.724 ± 0.05210.067
TP (mg/L)0.0330.0230.0280.028 ± 0.00525.254
NO3-N (mg/L)2.7350.4051.5701.570 ± 1.165104.940
Cl (mg/L)408.3694.378206.374206.374 ± 202.025138.421
SO42− (mg/L)8.2332.1355.1845.184 ± 1.02583.178
pH7.7907.2907.5407.540 ± 0.2504.6989
Ec (μS/cm)1873166.81019.91019.9 ± 853.179118.293
Ca (mg/L)70.78041.99056.38556.385 ± 14.39536.167
K (mg/L)719.9003.180361.540361.540 ± 358.3691.590
Na (mg/L)11.1706.9709.0709.070 ± 2.10032.745
Mg (mg/L)3.4502.1202.7852.785 ± 0.66533.752
As (μg/L)6.2924.8205.5565.556 ± 0.73618.755
Cu (mg/L)0.0110.0090.0100.010 ± 0.00110.000
Fe (mg/L)0.0300.0000.0150.015 ± 0.01594.000
Al (mg/L)0.1900.1000.1450.145 ± 0.04544.138
Mn (mg/L)0.0400.0200.0300.030 ± 0.01046.667
Pb (mg/L)0.0900.0800.0850.085 ± 0.0058.235
Zn (mg/L)0.2800.2200.2500.250 ± 0.03016.800
Cd (mg/L)0.0100.0000.0050.005 ± 0.00591.200
Disclaimer/Publisher’s Note: The statements, opinions and data contained in all publications are solely those of the individual author(s) and contributor(s) and not of MDPI and/or the editor(s). MDPI and/or the editor(s) disclaim responsibility for any injury to people or property resulting from any ideas, methods, instructions or products referred to in the content.

