Article

Multi-Objective Simulation-Optimization Coupling Model of the Water Transfer Level in the East Route of the South-to-North Water Diversion Project

1
National Key Laboratory of Water Disaster Prevention, Hohai University, Nanjing 210098, China
2
College of Hydrology and Water Resources, Hohai University, Nanjing 210098, China
3
MWR General Institute of Water Conservancy Resources and Hydropower Planning and Design, Beijing 100120, China
4
Hydrochina Huadong Engineering Corporation, Hangzhou 311122, China
5
China South-to-North Water Diversion Eastern Route Corporation Limited, Beijing 100036, China
6
Heilongjiang Provincial Water Conservancy and Hydroelectric Power Investigation, Design and Research Institute, Harbin 150080, China
*
Author to whom correspondence should be addressed.
Water 2025, 17(6), 839; https://doi.org/10.3390/w17060839
Submission received: 27 January 2025 / Revised: 7 March 2025 / Accepted: 12 March 2025 / Published: 14 March 2025

Abstract

:
To address the water-use conflicts between the original water-receiving areas of the lower Hongze, Luoma, and Nansihu lakes and the receiving areas of the East Route of the South-to-North Water Diversion (ESNWD) project, a multi-objective simulation-optimization coupling model was developed. To ensure that the operating costs of the system are reduced while safeguarding water in the original receiving area of the lakes, the model had two objectives: minimizing the water shortage in the original receiving areas of the lakes and minimizing the total system cost of the ESNWD project. The water allocation scheme was optimized by adjusting the northward water transfer levels of the lakes. The Nondominated Sorting Genetic Algorithm II was used to solve the model and generate a set of non-inferior solutions for the northward water transfer levels of the lakes. The optimal solution for the northward water transfer level in the ESNWD project was obtained using the entropy weight technique for order preference by similarity to an ideal solution method. The results showed that, compared with the current northward water transfer levels, the optimally obtained northward water transfer level solution could reduce the water shortage in the original receiving area by 7.86% at a cost increase of 0.45%, which balanced the water demand of the original lake receiving area with the economic requirements of the water-receiving area of the ESNWD system, respectively. Thus, the proposed solution effectively improves the system benefits.

1. Introduction

Due to the significant difference in precipitation, there is a problem of “more water in the south and less water in the north” in China [1,2]. With the continuous population increase and rapid development of the social economy, the contradiction between the supply and demand of water resources in northern China has become extremely prominent, restricting socioeconomic development and ecological environmental protection [3,4,5]. To address water scarcity in the north, China built the South-to-North Water Diversion (SNWD) Project with eastern, middle, and western routes [6]. The eastern route project diverts water from the lower reaches of the Yangtze River to the north through several lakes and delivers water step-by-step to provinces and cities along the route, effectively easing water resource tension in the Huang-Huai-Hai region of northern China [7]. However, such ultra-long-distance water transfer involves multiple regions, sources, projects, users, and functions, creating significant challenges for the project operation. Therefore, the development of a cross-regional unified water resource scheduling model to provide the necessary decision support for project operation decision-making is urgently required.
A significant amount of research has been conducted on water resource system scheduling models, which can be divided into simulation, optimization, and simulation-optimization coupling models [8]. The simulation method adopts a preset project-scheduling mode using the operating rules of the system. It sets reasonable engineering parameters to adjust and calculate complex problems such as hydrological compensation, project compensation, and water allocation. Its advantages include transparency, controllability, simplicity, fast calculation, ease of understanding and adjustment, and ease of performing manual intervention. Examples include the Aquator [9,10], WRAP [11], the Soil and Water Assessment Tool (SWAT) [12,13], WaterWare [14], and ModelSim (MODSIM) [15,16]. The optimization method typically considers basic water demand as a constraint with objective functions, such as minimizing water shortages or maximizing economic benefits. It selects an appropriate optimization method to optimize the objective function, such as linear programming, nonlinear programming, dynamic programming, genetic algorithms, and particle swarm optimization [17,18,19,20]. Traditional single simulation or optimization methods make it difficult to balance the requirements of solution efficiency and optimization performance. The coupled simulation-optimization model combines the simulated hydrological process with the optimization algorithm to ensure reasonable and accurate calculation results while improving calculation efficiency.
Inter-basin water transfer has been widely studied by scholars worldwide as an essential means of optimizing water resource allocation. The simulation-optimization coupling model systematically transforms the water resource scheduling problem into a mathematical optimization problem to obtain the optimal water resource scheduling scheme and has been gradually developed from single- to multi-objective. More optimization methods have also been applied to the solutions. Mirfenderesgi and Mousavi [21] used artificial neural networks to learn the MODSIM simulation results and combined them with a heuristic optimization algorithm to optimize water allocation at the basin scale. Borgomeo and Mortazavi-Naeini [22] transformed the water resource planning problem into a multi-objective optimization problem by integrating climate model projections, water resource system models, and a multi-objective optimization algorithm to develop a set of Pareto-optimal water management schemes for the London water supply system. Fereidoon and Koch [23] developed a complex simulation-optimization coupling model, SWAT-LINGO-MODSIM-PSO, to determine the optimal growing areas for future crops and maximize the economic benefits of five irrigated agricultural plains in southwestern Iran. Dogan et al. [24] released an open-source integrated CALVIN model for water allocation optimization based on Python 2.7, 3.4, which could be connected to multiple optimizers to achieve single- and multi-objective optimization studies for the California water supply system. The resulting mathematical optimization model is more flexible than rule-driven models but is difficult to apply in complex water systems. Ouyang et al. [25] considered the Hanjiang River section in the middle route of the SNWD project, adopted an integrated scheduling model of inter-basin water transfer, established a water supply scheduling model of the Danjiangkou Reservoir, and explored the optimal scheme for inter-basin water resource allocation. Yang et al. [26] established a water transfer optimization model for lake clusters to maximize the amount of water transferred and minimize the risk rate of water control. They also obtained an optimal water distribution scheme using an optimization algorithm. The Nondominated Sorting Genetic Algorithm II (NSGA-II) optimization algorithm, as a more mature optimization algorithm, has been widely used in solving water resources optimization allocation problems. To address the problem of combined surface and groundwater dispatching in the Piranshahr region of Iran in conjunction with inter-basin water transfers, Tabari and Yazdi [27] used a multi-objective optimization model combining a genetic algorithm (GA) and NSGA-II to solve the model. It effectively mitigates the water scarcity problem while optimizing the economic and environmental benefits of the water resources system. Using the Bandargaz-Nokandeh coastal aquifer in northern Iran as a case study, Tabari and Abyar [28] combined the Groundwater Modeling System (GMS) and NSGA-II to optimize water resource extraction and management. The optimization resulted in a 48.45% reduction in groundwater extraction and a significant reduction in the size of the area where the groundwater level declined. Tabari et al. [29] used the Karaj/Amir Kabir Reservoir in Iran as a case study and combined NSGA-II and Dynamic Artificial Neural Network (DANN) models to optimize the reservoir operation rules while considering multiple objectives, including power generation benefits, water allocation efficiency, and dam stability. It provides scientific decision support for reservoir management and improves the stability and efficiency of the system. Using the Karaj Amir Kabir Multi-Purpose Reservoir in Iran as a case study, Tabari and Safari [30] developed a strategy to optimize the reallocation of water resources from the reservoir under uncertain conditions. The optimal operating policies (OOPs) are developed through a multi-objective optimization model (based on NSGA-II) while considering the uncertainty of water inflow to the reservoir and downstream water demand. By applying the multi-criteria decision-making method (MCDM), the optimal operation scheme was selected from the optimization results, which significantly improved the fuzzy reliability, resilience, and stability of the system.
In recent years, the optimal scheduling of water resources for the eastern route of the South-to-North Water Diversion (ESNWD) project has become a key research topic. Shi et al. [31] proposed a water resource optimization model for the river-lake-pumping station system by combining conventional water resource allocation with simulation techniques and discrete difference dynamic programming (DDDP). By optimizing the operation, it reduced the cost of the water supply system through optimal operation and ultimately achieved optimal joint allocation of local and regulated water resources. Xi et al. [32] developed a generalized (conventional) water resource optimization allocation model for the SNWD Project in Jiangsu Province, using an improved cuckoo optimization algorithm for water resource optimization allocation. However, previous studies have primarily focused on the operation of a certain section along the ESNWD Project, such as the Jiangsu and Shandong sections, rather than on the entire water diversion project [33]. The studies focused solely on Hongze Lake and Luoma Lake for optimization, despite the presence of multiple lakes along the system. This approach did not fully leverage the storage capacity of all available lakes, thereby potentially compromising the optimality of the results. Moreover, given that the SNWD Project is designed to address water shortages in northern China, confining the study area to Jiangsu Province in southern China limited the ability to comprehensively assess the project’s overall water allocation effectiveness. Consequently, their conclusions are subject to significant limitations. Second, most studies have focused on the economic benefits of the system of the east route of the ESNWD project, often taking the minimum overall water shortage of the system and the minimum amount of river drainage as goals for optimization [34,35] or pursuing the minimum amount of system water abandonment and energy consumption [36,37]. As with other inter-basin water transfer systems, existing studies of the ESNWD Project have similarly ignored the water conflicts between the transfer system and the original water-demanding areas along the route. When users of the water transfer line use water, available water from the original users is invoked, resulting in the increase of the water shortage risk of the original users. Neglecting the water rights of the original users not only undermines the rational use of water resources but also leads to studies detached from reality. Under the current operating rules, the ESNWD project not only diverts water from the Yangtze River to the north but also from Hongze and Luoma lakes. Because the distance of the lake water to the north is shorter than that of the river water, the cost of water extraction along the entire line is reduced. However, this move reduces the amount of water available to users who initially used the lake water, increasing the risk of water shortages in the original receiving areas of the lakes. Therefore, the northward water transfer level for the ESNWD project is set as the control water level that restricts lake water diversion to the north during the dispatching period. When the water level of the lakes exceeds the northward water transfer level, the lake water can be diverted northward. Otherwise, diverting lake water to the north is prohibited. By adjusting the northward water transfer level, the water shortage risk in the original receiving area of the lake and that along the project can be balanced. The current northward water transfer level is a fixed and defined level that cannot adjust the proportion of water supply for different water inflows in the current year, nor can it coordinate the risk of water shortages based on the water demand situation. If the set northward water transfer level is too high, it leads to an increase in the amount of water pumped from the river, resulting in high costs and higher water prices. If the set northward water transfer level is too low, it leads to the risk of water shortages in the original receiving areas of the lakes. The fixed control water level of the north transfer cannot balance the contradiction between the users of the water line and the original users of the water-receiving areas of lakes; therefore, it is essential to study the optimal scheduling of the northward water transfer level.
A multi-objective simulation-optimization coupling model was constructed to reconcile the risk of water shortage in the original water-receiving areas of lakes and the cost of water supply for the ESNWD project in response to water-use conflicts between the original water-receiving areas of the lakes in the lower levels of Hongze, Luoma, and Nansihu Lower lakes and the receiving areas of the ESNWD project. The ESNWD project water resource system was generalized based on the hydraulic linkages of the project. Based on the process of water inflow and water demand in the receiving area, the model uses the NSGA-II optimization algorithm to optimize the solution set for the northward water transfer level and adopts the entropy weight Technique for Order Preference by Similarity to an Ideal Solution (TOPSIS) method to select the optimal northward water transfer level, aiming to optimize its scheduling rules by flexibly formulating the north transfer water level for different water inflow conditions and balancing the conflicting interests along the route with the original receiving area to maximize the overall benefits.

2. Research Area and Data

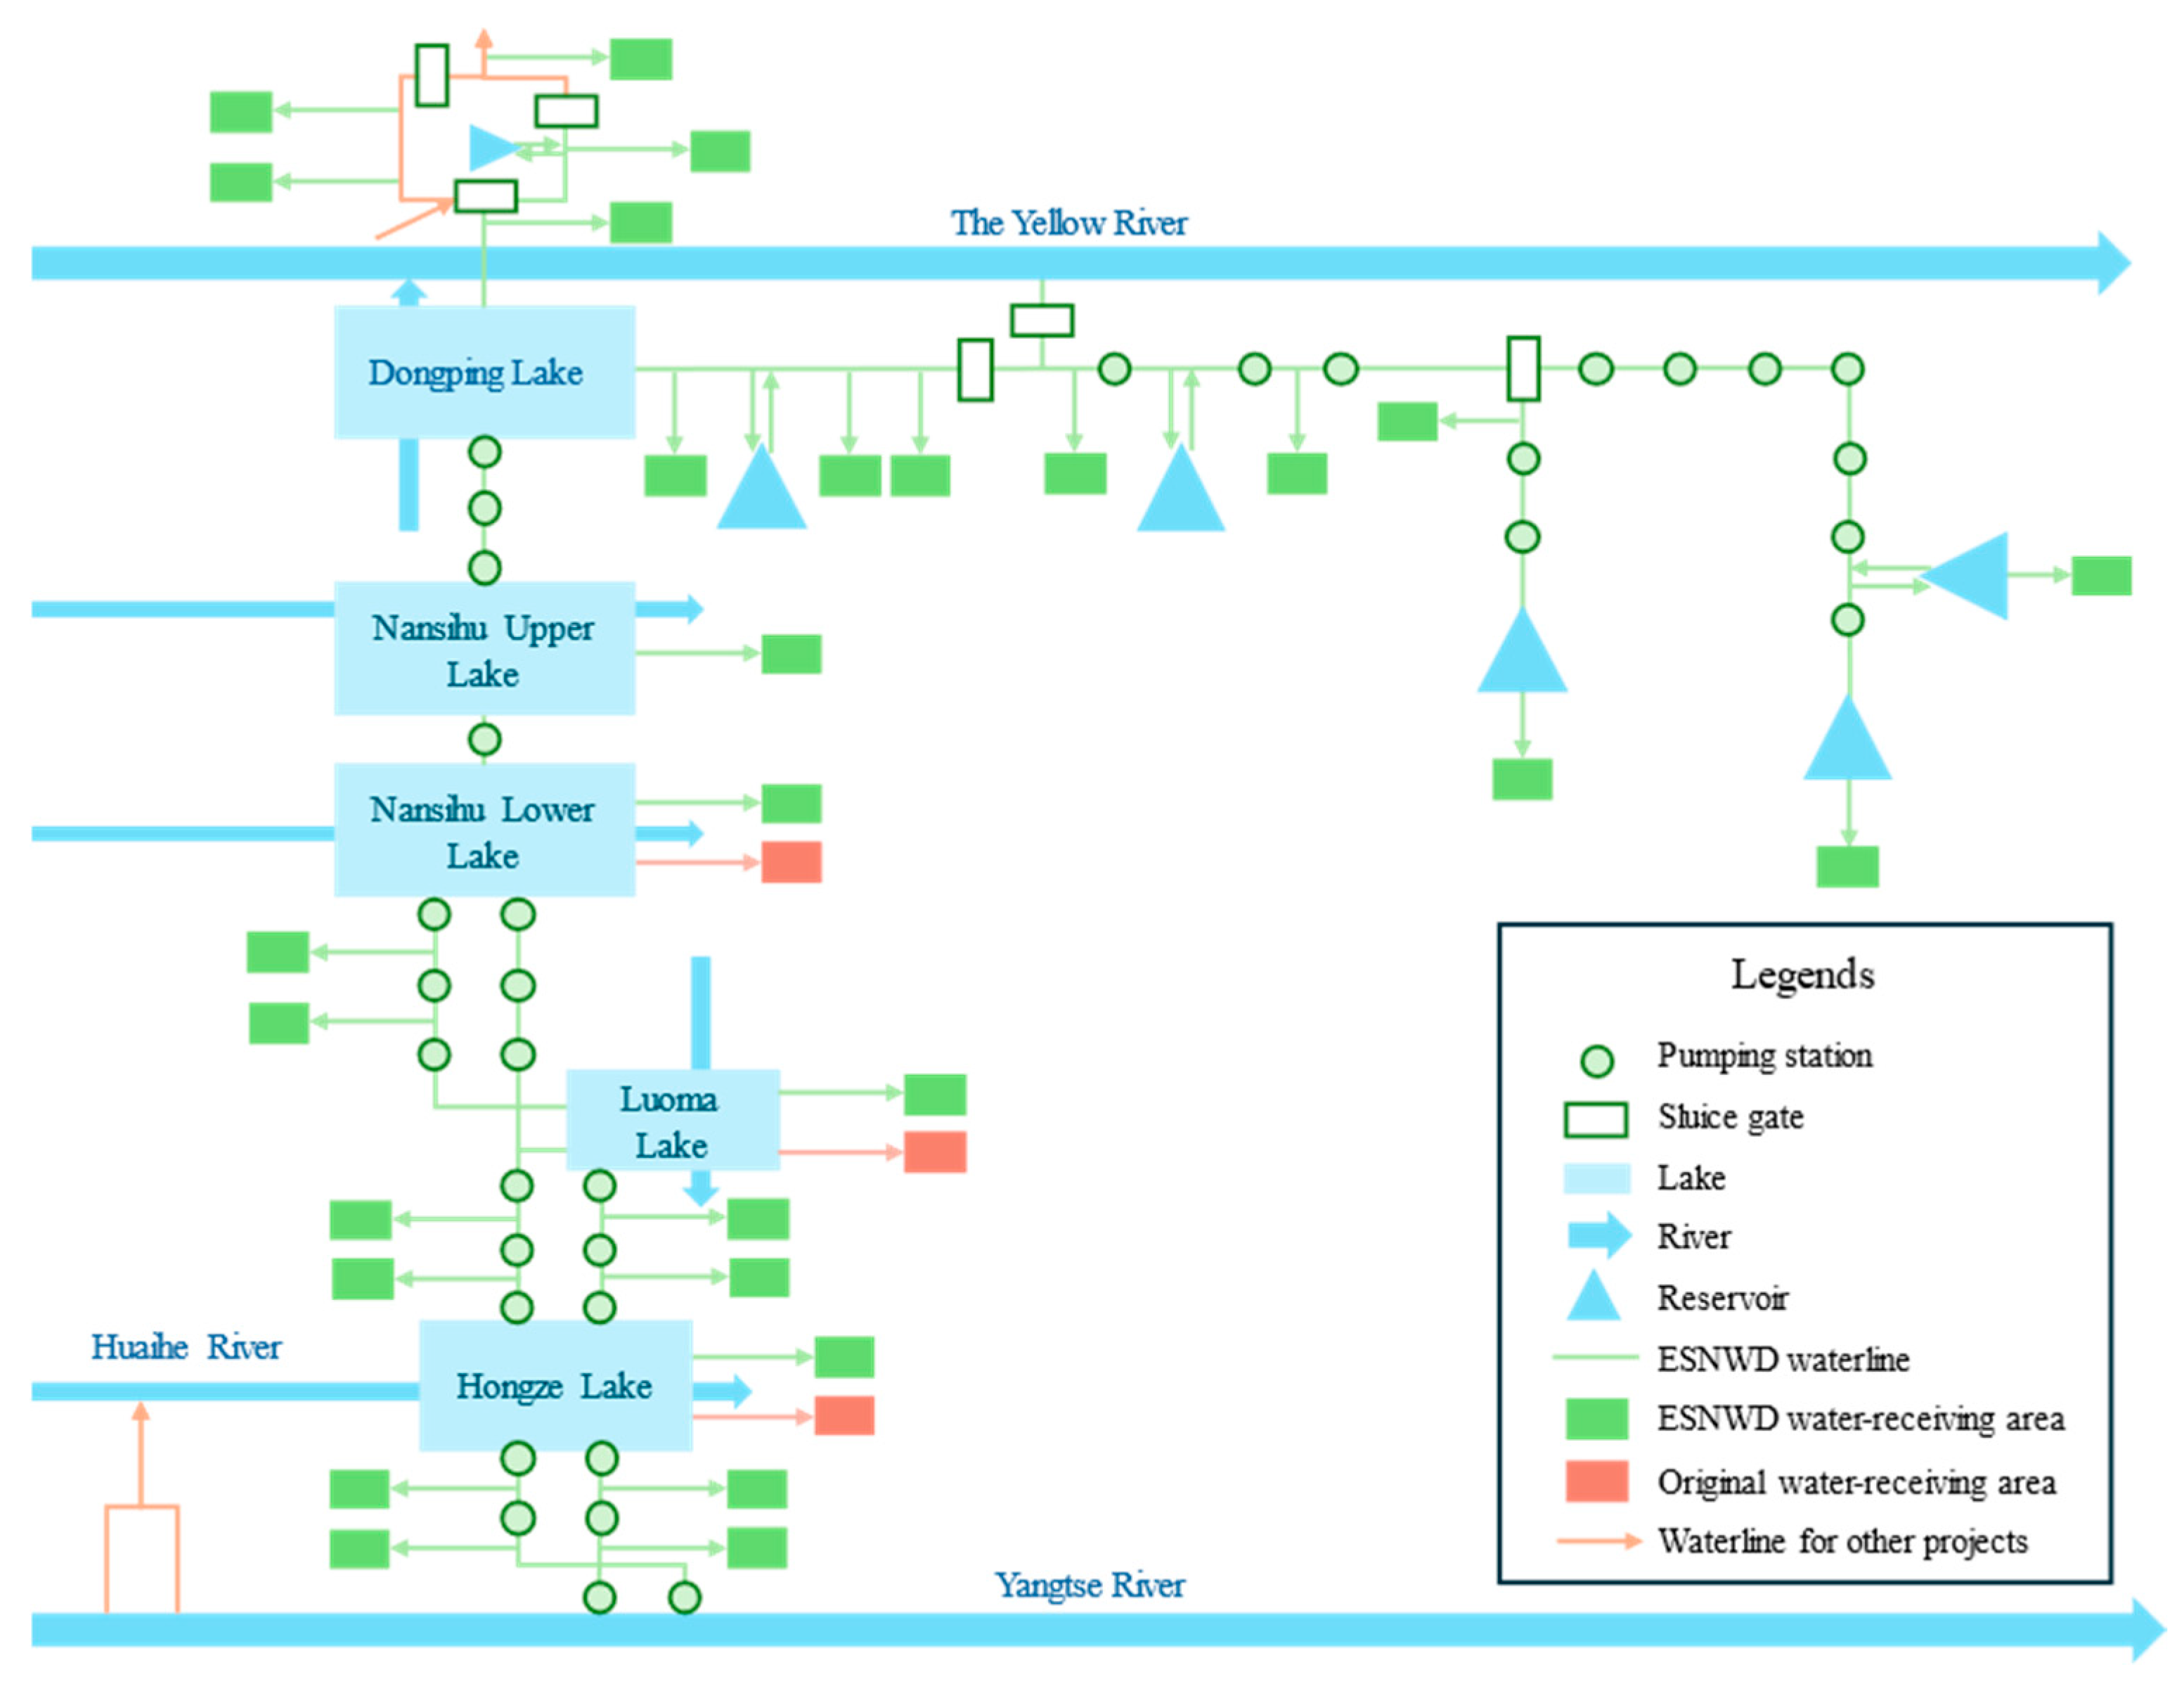
2.1. Overview of the Study Area

The first phase in the ESNWD project and the North Extension emergency project spans the four basins of the Yangtze, Huai, Yellow, and Haihe rivers in China, meeting the needs of urban life, industry, and the environment in the region, considering agricultural, shipping, and other water supplies, and including Jiangsu, Anhui, Shandong, Hebei, and Tianjin provinces (municipalities).
The first phase of the ESNWD project draws water from the lower reaches of the Yangtze River and carries it northward step-by-step through a 13-level pumping station along the Beijing-Hangzhou Canal. After being stored in Hongze, Luoma, Nansihu (upper and lower), and Dongping lakes, the project is divided into two routes: one northward through the Yellow River to the northern part of Shandong Province and the other eastward to the Jiaodong Peninsula. The total length of the water transfer line is 1467 km.
The North Extension Emergency Project continues to transfer excess water from the first phase of the east route project to Hebei and Tianjin through the left and right lines. The left line is 441.6 km long, while the right line is 450.6 km.
The supply areas of the first phase of the ESNWD and the North Extension Emergency projects are shown in Figure 1.

2.2. System Generalization

The lakes, water-receiving areas, and river courses in the ESNWD project were generalized into water sources, users, and transmission lines. Based on the topological relationships and hydraulic connections among them, a network diagram of the water resource system for this route was established, as shown in Figure 2, which includes 89 sources and 47 users.

2.3. Scheduling Rule

In the non-flood season, when the lake water levels are higher than the northward water transfer levels and lower than the pumping and storage control water levels, the water should be pumped northward following the requirements of water transfer, local water use, and lake filling and storage in the northern part of the lake. During the flood season, when lake water levels are higher than the northward water transfer levels and lower than the flood limit, water should be pumped northward using the same requirements. When lake water levels exceed the flood limit, flood control and drought relief requirements should be satisfied. When the water levels of the lakes are lower than the northward water transfer levels, the Yangtze River should be fully used to pump water to the north, prioritizing the water consumption of the northern cities. The current northward water transfer levels are listed in Table 1. In the first phase of the project, Nansihu Upper Lake and Dongping Lake were used only as water transmission channels and did not supply water temporarily.

3. Methods

In this study, a simulation-optimization coupling model was constructed based on the data of the research area and the purpose of the study. The optimal solution set is obtained by an optimization algorithm, and the required optimal solution is obtained through decision-making. Figure 3 shows the technology roadmap used in this study.

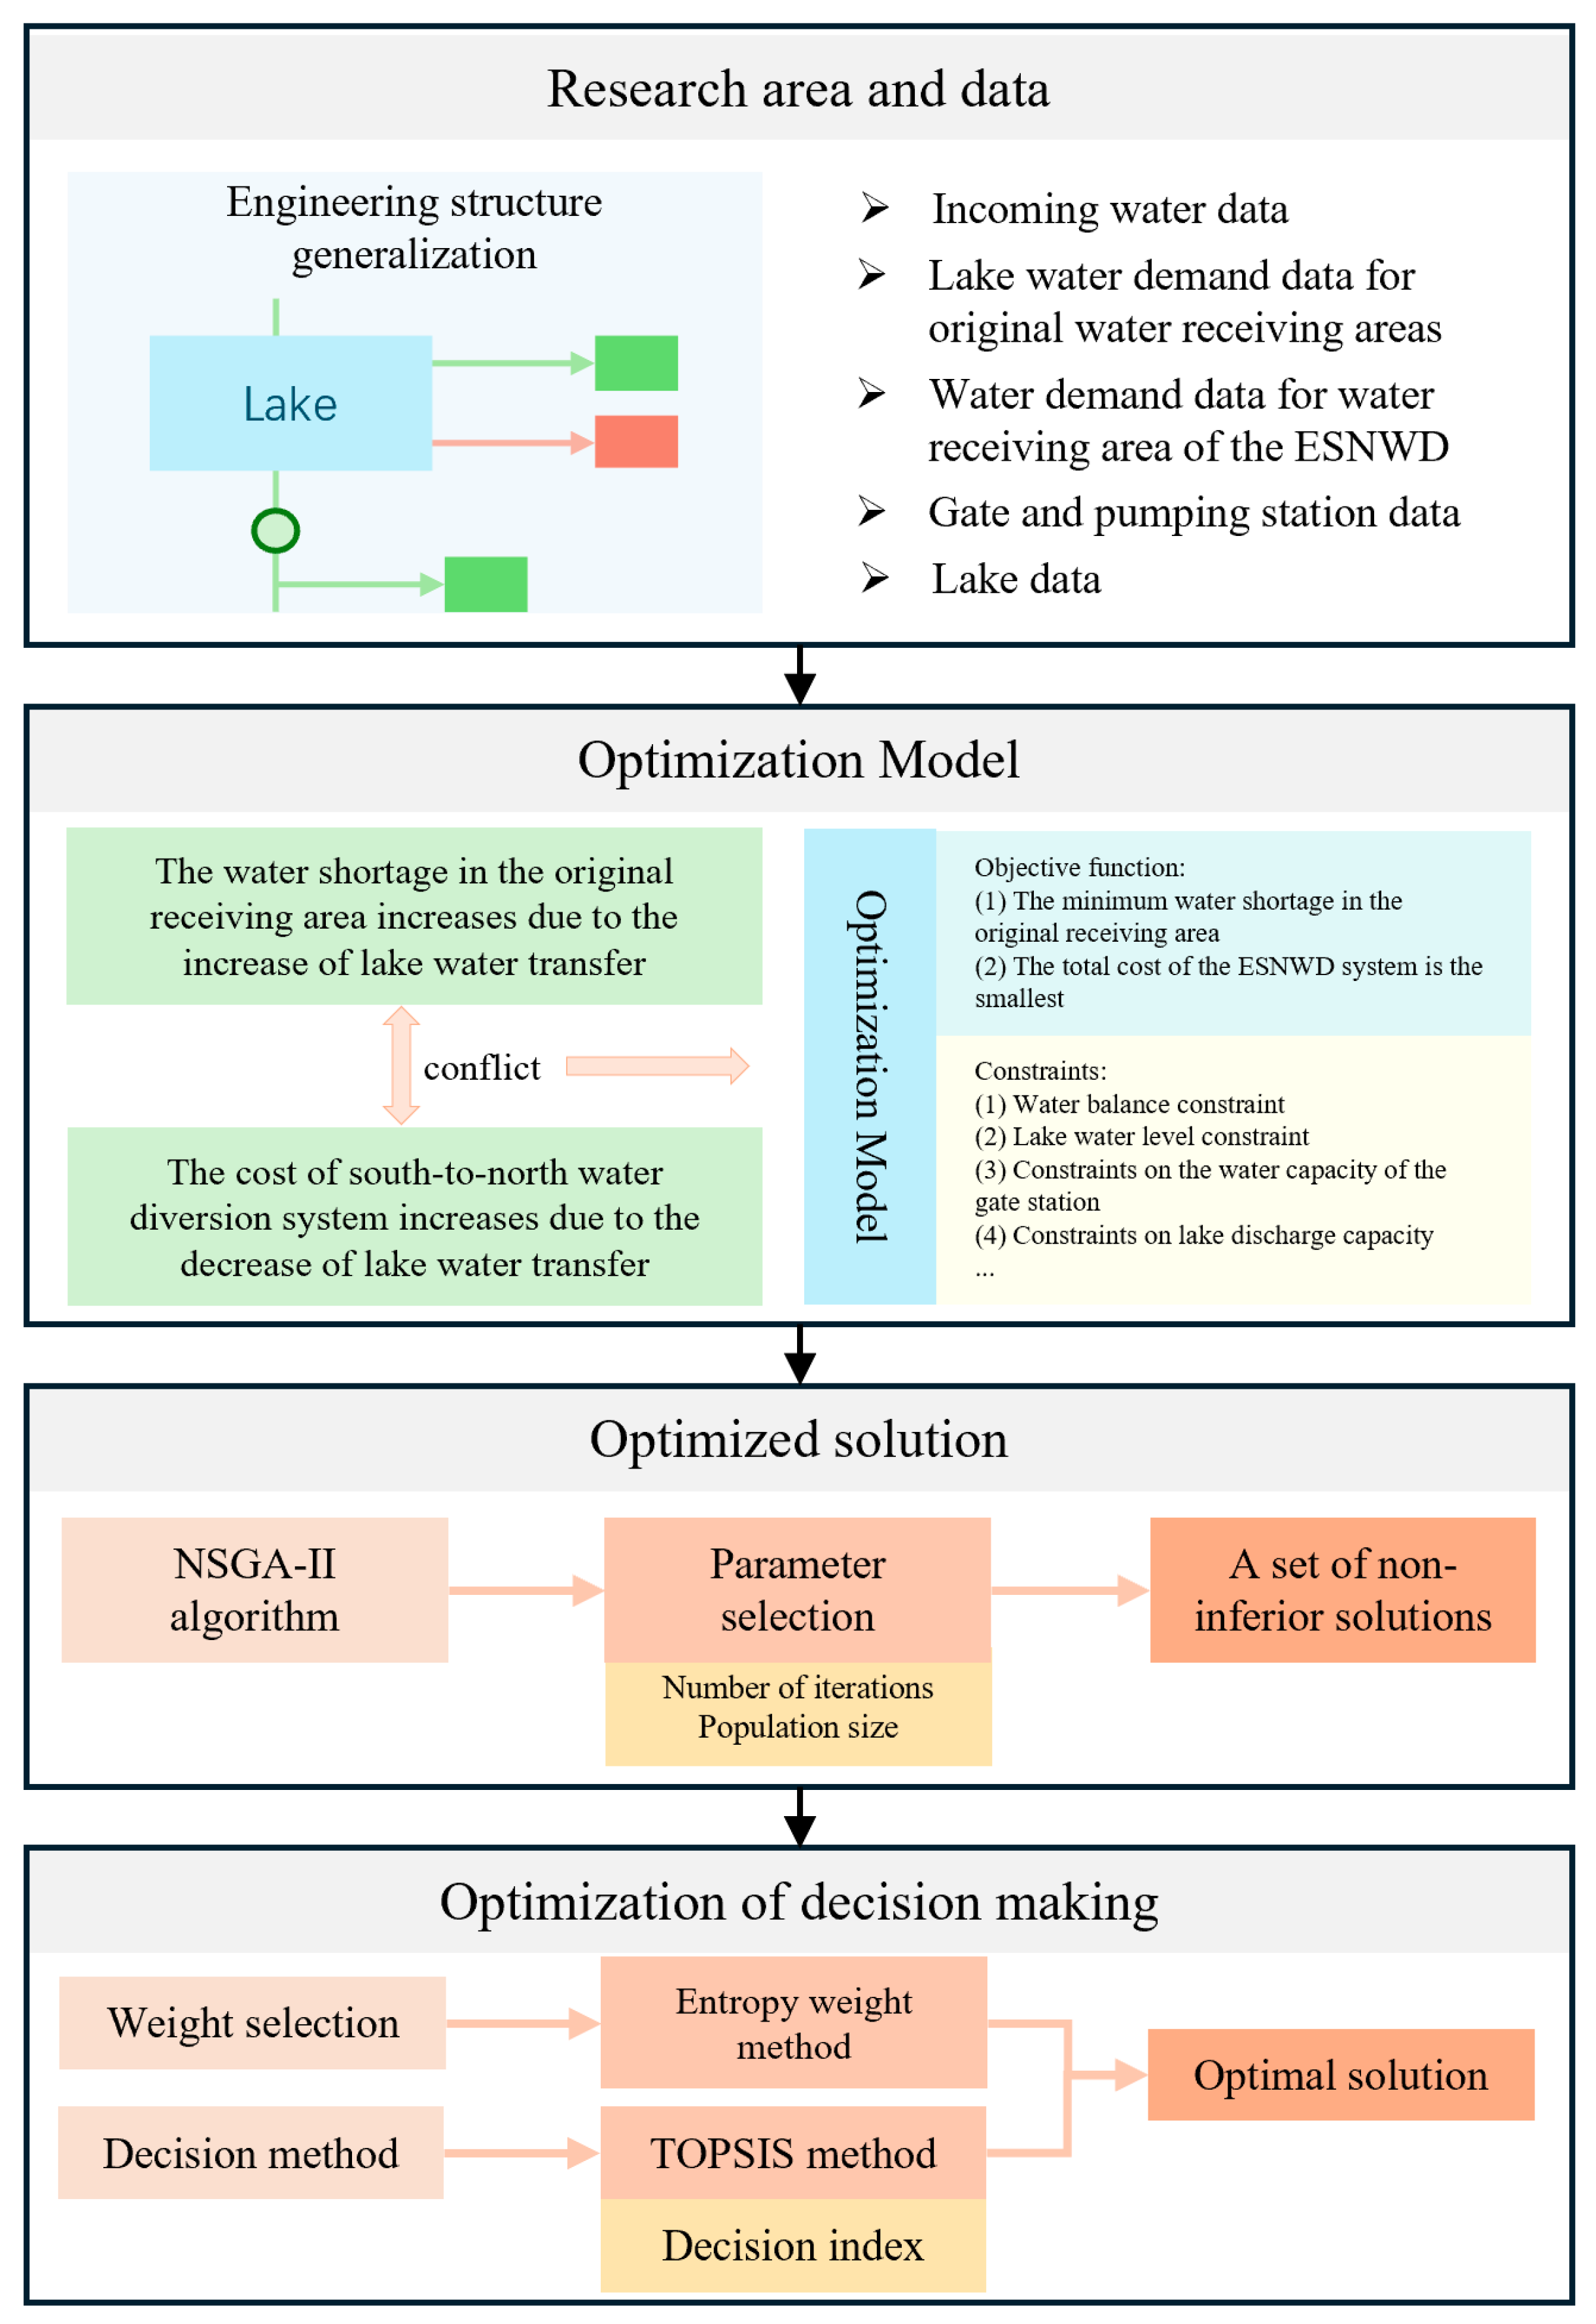
3.1. Simulation-Optimization Coupling Model

3.1.1. Model Construction

To ensure the simulation effect of the model, it was first decomposed into multiple types of objects based on the water transfer roadmap of the ESNWD project. Their topological relationships were established so that the water resource allocation results could be simulated based on the water balance relationship after the input of each source water and the water demand of each user.
The basic components of the water resource system of the ESNWD project are summarized as follows:
(1)
Water source projects: There are 89 water source projects, including generalized water storage projects, generalized water lifting projects, and water diversion projects.
(2)
Users: This refers to the receiving areas of water, including 40 along the line and seven original receiving areas of the lakes.
(3)
Rivers: They are important water transmission channels with the water conservation facilities contained within them.
These objects can be interconnected and combined to form a systemic network, based on various topological relationships. The topological relationships between objects can be divided into the source-sink relationship between different water sources and the supply-demand relationship between water sources and users. These relationships are described in detail in the subsequent layouts of computing nodes.
Computing nodes are important objects in simulations. The system can determine the status of the objects around a node using node information. The nodes should be deployed based on the following principles: deploy the corresponding water source node on the water source project, establish nodes both upstream and downstream of the water storage project, establish nodes upstream and downstream of the diversion and withdrawal routes of the water conveyance channel, and establish nodes at other locations where the water volume needs to be counted. In this study, 102 computing nodes were deployed within the system network following the deployment principles above.
After system generalization and node layout, the system includes a water source project, users, nodes, and other key components. The objects are connected by different topological relations, which form a generalized network diagram for the system. Object topological relationships are divided into the source-sink relationships between nodes and the supply-demand relationships between water sources and users. The topological relations are determined by the hydraulic connections between nodes. If water from node a flows to nodes b and d, the topology diagram points from a to b and d. If node b supplies water to node g, the topology diagram points from b to g. The following shows a relationship between objects based on the system network diagram and is expressed as an adjacency list: If a topological relationship exists, as shown in Figure 4a, the corresponding adjacency list is as shown in Figure 4b. This adjacency list indicates that water from a flows to b and d, water from b flows to c and g, and so on.
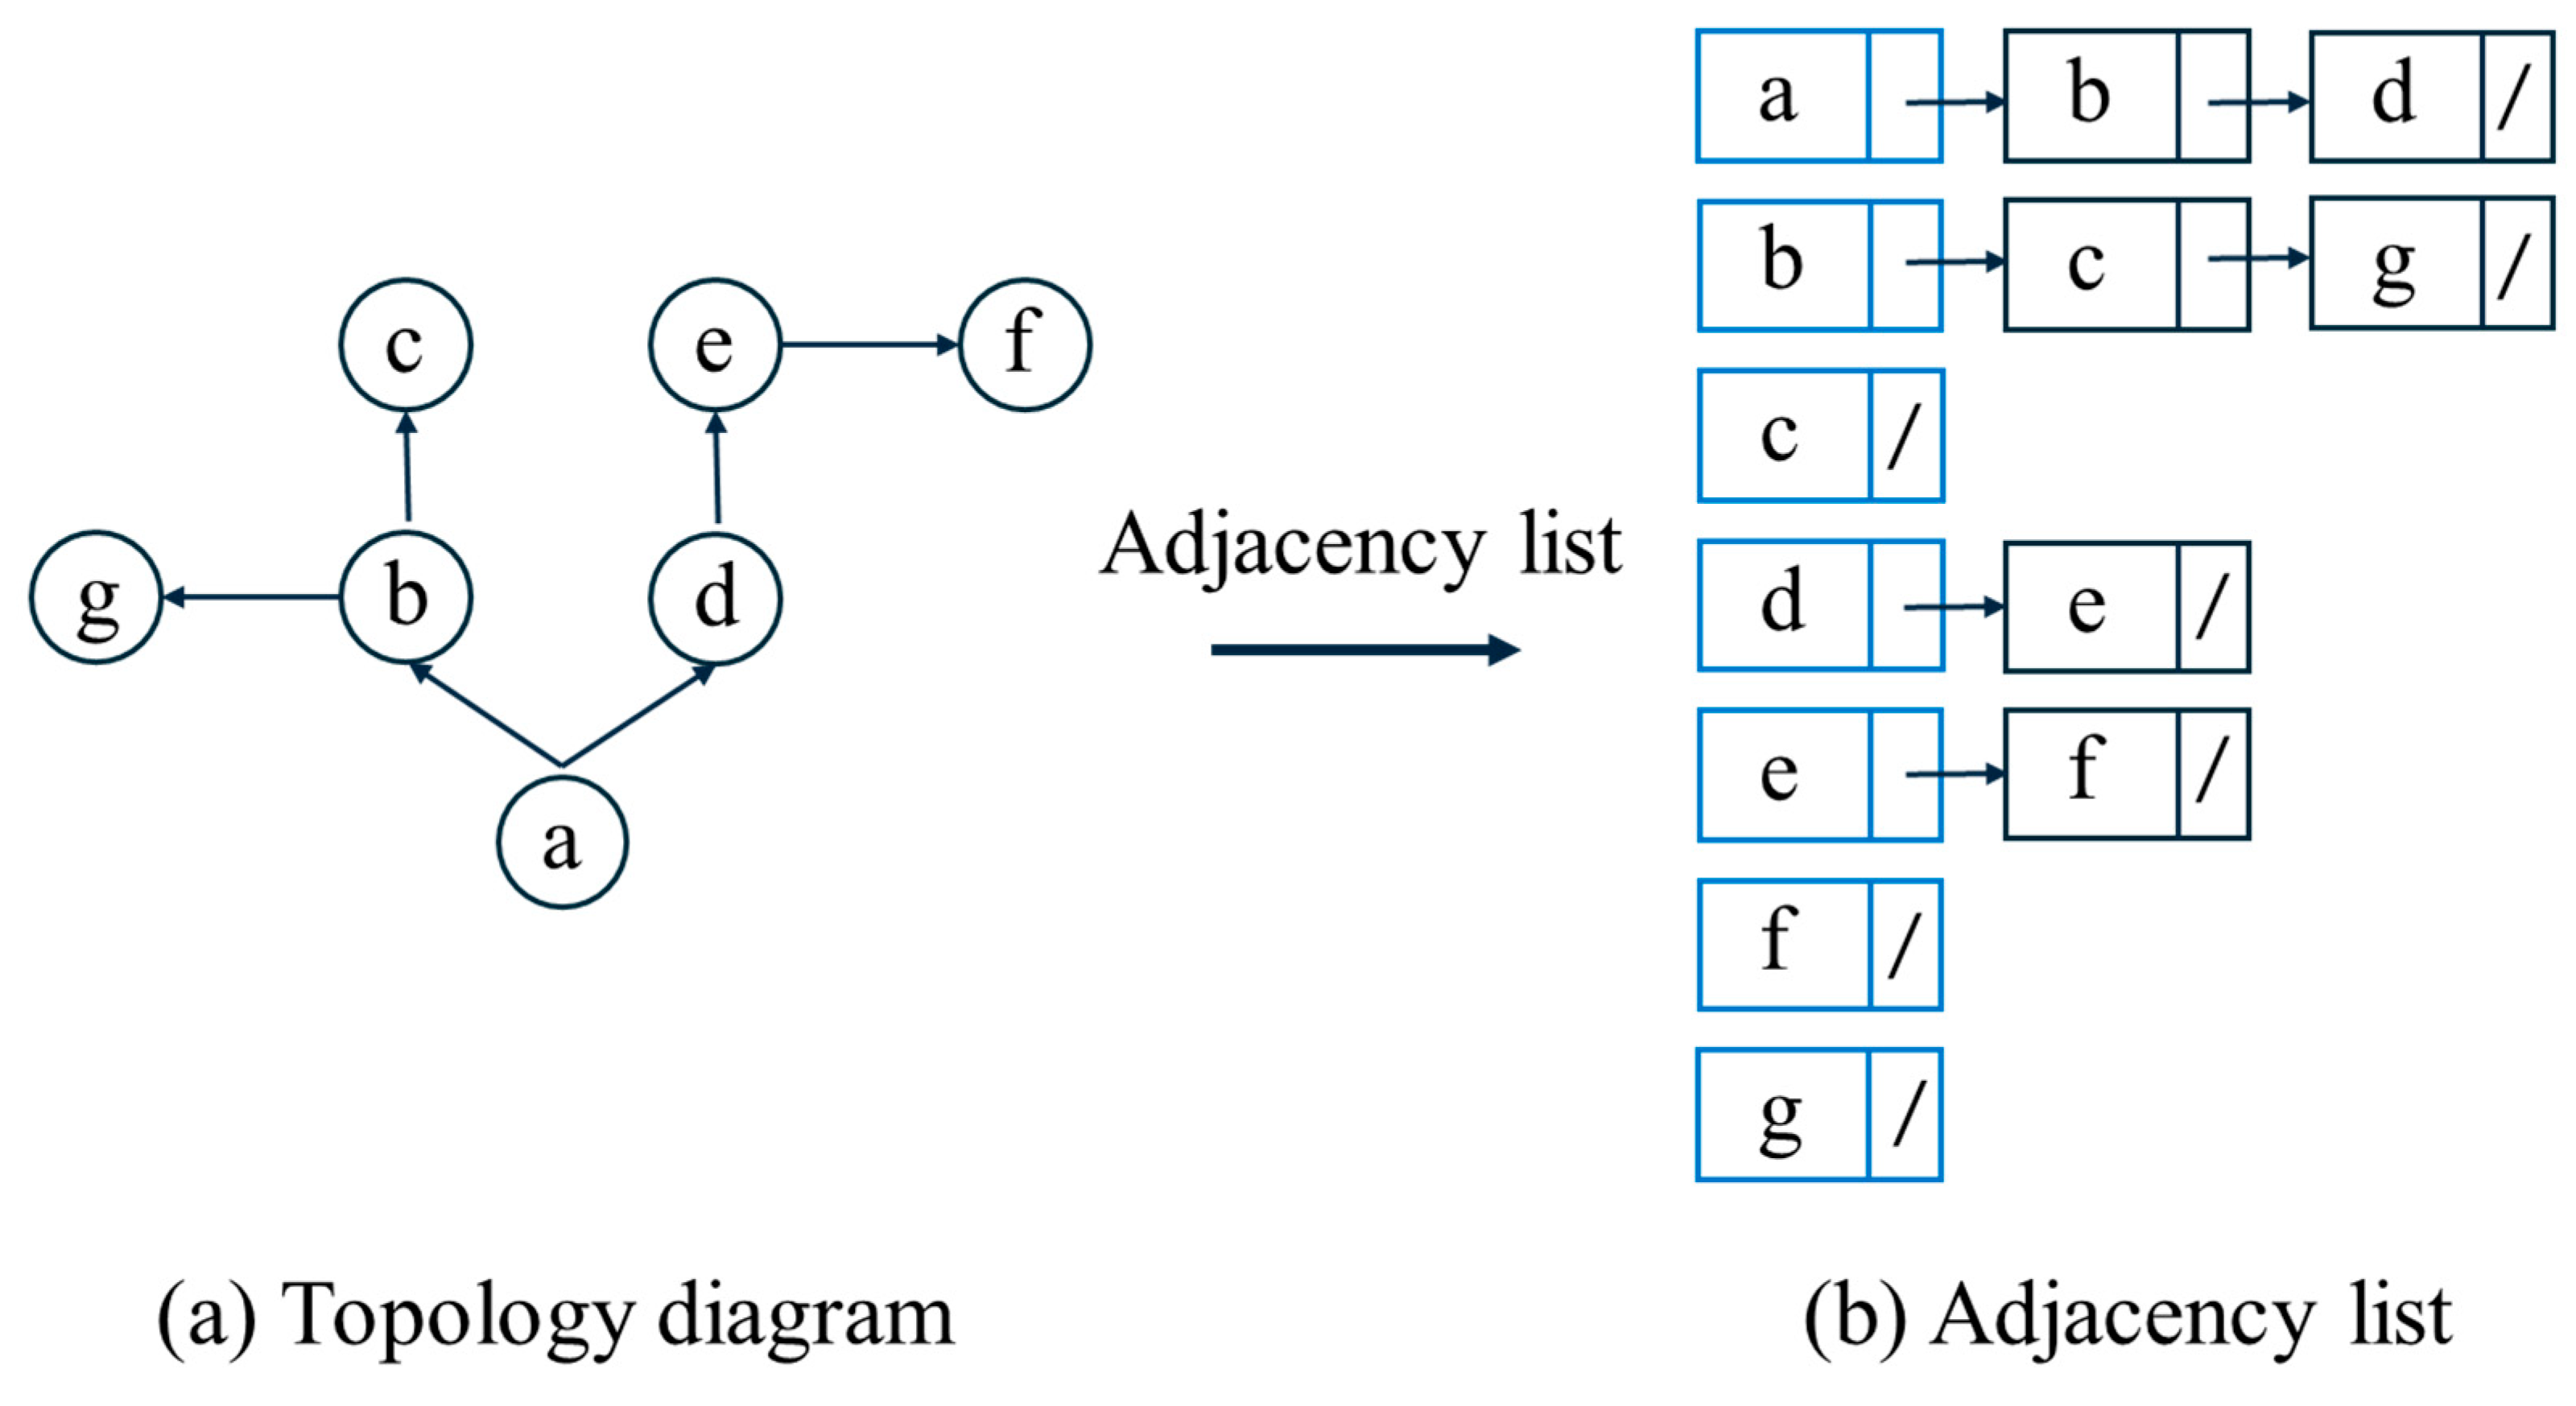
  • Source-sink relationship between nodes
This relationship reflects the hydraulic connections between nodes. The source-sink relationship between nodes i and j is defined as follows:
j Ω A i   R e c e d i n g   w a t e r   f r o m   n o d e   j   i n t o   n o d e   i
Assuming m nodes exist in the system, the source-sink relationship between nodes forms m sets of adjacency relations:
A = Ω A 1 Ω A 2 Ω A m .
The adjacency list of the source-sink relationship can be used to calculate the incoming water from the previous node.
2.
Supply-demand relationship between water sources and users
This relationship reflects the hydraulic relationship between water sources and users, which is a fundamental aspect of water resource allocations. The supply-demand relationship between water source j and user i is defined as follows:
j Ω E i   S o u r c e   j   s u p p l i e s   w a t e r   t o   u s e r   i
Assuming there are m users in the system, the supply-demand relationship forms m adjacent relationship sets:
B = Ω B 1 Ω B 2 Ω B m .
With the above supply-demand adjacency table, it is easy to calculate the corresponding direct user water demand of the water source, which also serves as the basis for the allocation of the available water supply. This study interrelates water sources, users, and nodes based on the aforementioned topological relationships. It connects different objects in series to form a generalized network, which serves as the basis for establishing subsequent models.

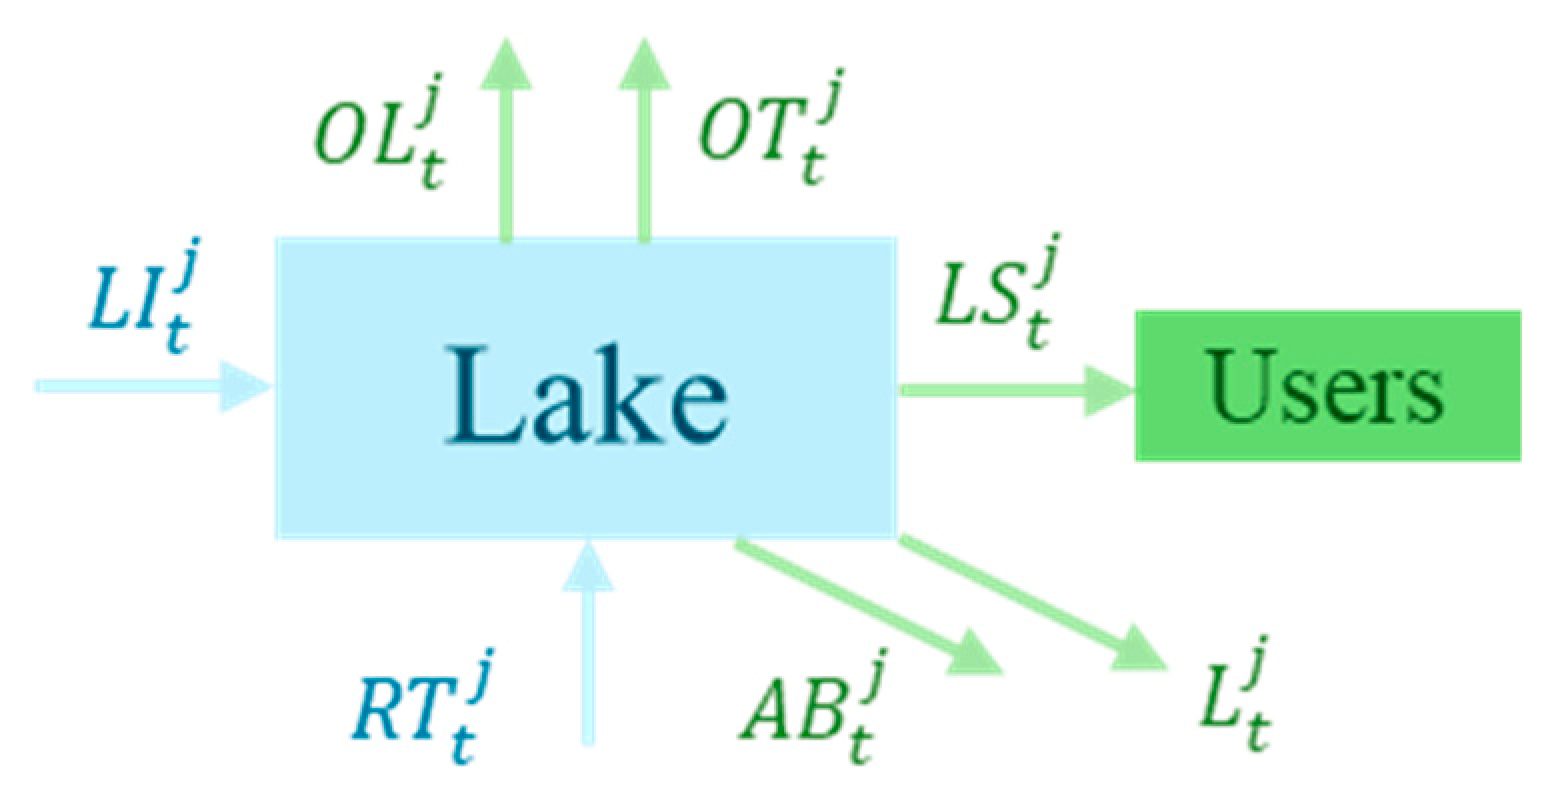
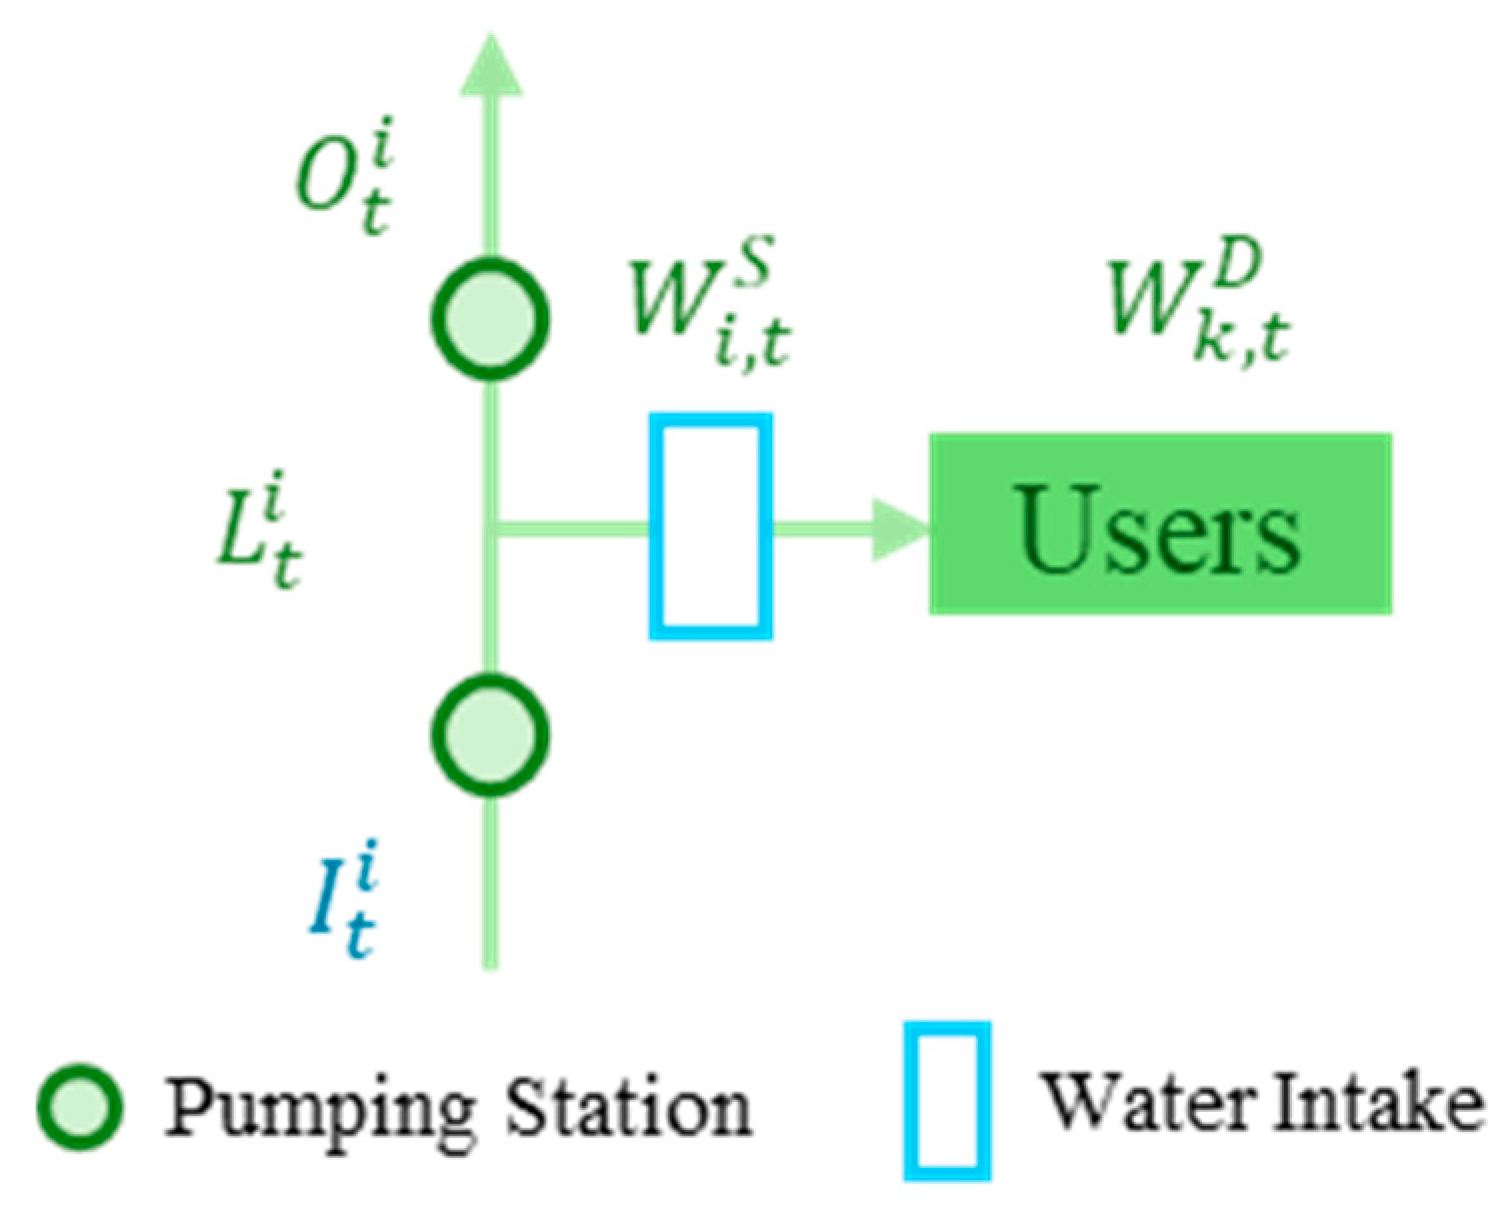
3.1.2. Critical Node Processing

In the ESNWD project, the operational form of the water source project is different from that of conventional water sources. Based on the actual situation, the specific operational mode of the water source project in the ESNWD project can be defined, the flow of each object in the system network simulated, realizing the operating state of the system scheduling.
  • Water storage project
Lakes are important water sources for the project. Due to their special scheduling rules, the calculation method for lake nodes differs from that for conventional lakes. To simulate the actual situation, the lake adopts a narrow-deep scheduling method of supplying water when available and storing surplus water. The basic water balance equation can be expressed as follows:
V t + 1 j = V t j + I t j O t j ,
where V t + 1 j and V t j denote the storage volume of lake j before and after time period t, respectively, and I t j and O t j denote the inflow and outflow of lake j in period t.
As shown in Figure 5, the inflow to lake j in period t consists of two parts: the local inflow to lake L I t j and the amount of water entering the lake from conveyance channel R T t j . The outflow consists of five components: local water supply L S t j , northward transfer water from lake O L t j , other northward transfer water through lake O T t j , lake losses L t j , and abandonment A B t j .
R T t j = O T t j .
Considering the cost of lifting water from the pumping station, the diversion of river water should be minimal. Therefore, the northward-transferred water is not retained in the lake, meaning that the amount of water entering the lake from the transfer line is equal to the amount of northward-transferred water flowing out of the lake.
V t + 1 j = V t j + L I t j + R T t j L S t j + O L t j + O T t j + L t j + A B t j .
The five lakes are not only the storage water source of the entire system, indirectly supplying all water-receiving areas along the route after the lakes but are also the direct water supply source for their own original receiving areas. To guarantee water supply to the original receiving areas of the lakes, the water stored in the lakes and the inflow from local lakes are preferentially supplied to the original receiving areas. Therefore, for the original receiving area of the lake, the available water supply is:
W j , t S = min W k , t D , V t j V t m i n + L I t j L t j ,
where W j , t S denotes the available water supply from the lake to its original receiving area, W k , t D denotes the water demand of the lake’s original receiving area k (k = 1, 2, …, K), and V t m i n denotes the minimum storage capacity of the lake in period t.
To ensure that local water interests are not damaged by the northward transfer of lake water and that the original water interests of the districts are maintained and to improve the whole water supply guarantee rate, the model specifies the lake at different times of the northward transfer water level. Water from the lake above the water level can be supplied to users on the water transfer line. When the lake level falls below this point, water pumping from the lake to the north ceases.
2.
Water diversion project
The users of the ESNWD project are the receiving areas divided based on the intake gates. The river intake node was established during the deployment of the node to facilitate the supply to the receiving zone, which is located in the river structure, as shown in Figure 6.
Owing to the large number and long distances of rivers along the water transmission route in the first phase of the project, it is necessary to consider the water loss from the water transmission channel. In the system, the river between the pumping stations is a basic unit, and its storage capacity is not currently considered at the medium- and long-term scales. Water balance is the basic principle of river-flow simulation.
O t i = I t i L t i W i , t S ,
where I t i is the amount of water transferred into section i, O t i is the amount of water transferred from section i, L t i is the evaporation loss from river seepage between pumping stations, and W i , t S is the amount of water supplied to users in period t.
The receiving area receives its water supply directly from the intake, and the available water supply is as follows:
W i , t D = min W k , t S , I t i .
3.
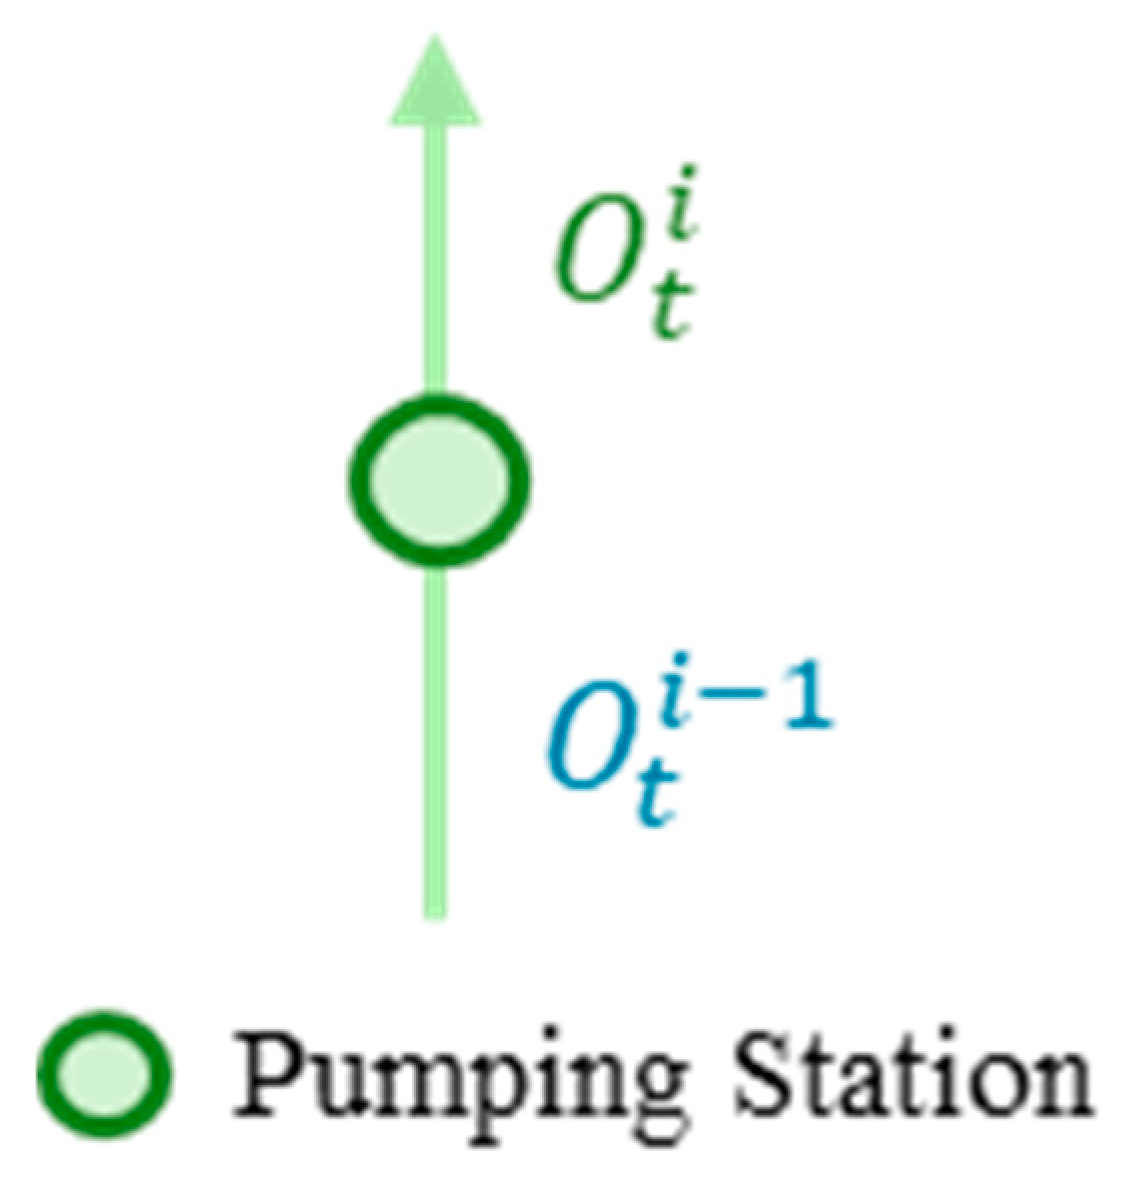
Water lifting project
The ESNWD project involves 13 pumping station stages for the northward pumping of water. Pumping stations are integrated gates and pumping hubs that lift water to the north during the dry period and open gates to release water during the flood season. In this study, it is generalized as a water-lifting project node. Unlike traditional pumping stations and gates, none of the pumping station gates in the east route project are involved in supplying water to users. The nodes of the pumping station gates are shown in Figure 7.
Based on the water balance principle, the flow process of a single pumping station is modeled as follows:
O t i = min O t i 1 , C t i ,
where O t i is the amount of water lifted by the pumping station in period t, O t i 1 is the outflow from the former transfer line, and C t i is the pumping capacity in period t.

3.1.3. Model Input and Output

The ESNWD project passes through five major lakes and is close to the Yellow River near the Jiaodong Peninsula. As channels of water transfer, the five Great Lakes regulate and store the water transferred to the north. It is necessary to analyze changes in lake storage; thus, the inflow process of lakes should be included in the model input. In addition, the east route project has access to the Yellow River diversion project in the Jiaodong Peninsula, and the two jointly supply water to the middle and eastern sections of the Jiaodong water transmission main line. In summary, the inputs to the model are as follows:
(1)
Monthly water intake of Hongze Lake, Luoma Lake, Nansihu Lower Lake, Nansihu Upper Lake, and Dongping Lake.
(2)
Monthly water transfer process of each receiving unit along the line (including the original receiving area).
Outputs to the model include:
(1)
Monthly water supply processes, water storage change processes, water level change processes, and monthly and annual water supply statistical values for the lakes along the line.
(2)
Monthly water consumption processes of each water-receiving unit along the line (including the original water-receiving area) and monthly and annual water consumption statistics.
(3)
Monthly water withdrawal processes of each pumping station along the line, monthly water flow processes of each control node, and statistical values of the monthly and annual water volumes.
(4)
Monthly water withdrawal processes at the water intake gate of each section along the line and the monthly and annual water withdrawal statistical values.

3.1.4. Objective Functions

When scheduling water within the system, it is necessary to meet the water requirements of each water-receiving area of the ESNWD System while reducing the operating costs of the ladder pumping stations to minimize the total water transfer cost of the system. The risk of water shortages in the original water-receiving area of the lake should also be considered, such that the lake water dispatch does not cause as significant a water shortage in the original water-receiving area when meeting the demand for cost reduction of the ESNWD System. Therefore, this model selected water shortage in the original water-receiving area of the lake and the total cost of water transfer as the two optimization objectives.
Minimal water deficit in the original water-receiving areas of the lakes.
In this study, the sum of the water deficits in the original water-receiving areas of each lake was used to characterize the risk of water deficit in those areas.
f 1 = m i n t = 1 T k = 1 K W k , t D W k , t S ,
where t (t = 1, 2, …, T) is the time period serial number; k (k = 1, 2, …, K) is the partition number; W k , t D is the water demand of partition k during period t, 10,000 m3; W k , t S is the actual water supply of partition k during period t, 10,000 m3; and q d e m , t i is the water supply of water supply node i during period t.
Minimize the total cost of water transfer.
The ESNWD project implements a paid water supply, and the water fee is the main source for ensuring the normal operation of the project. In this study, the total cost of the water transfer was calculated using the cost of pumping electricity at each pumping station along the transfer line.
f 2 = m i n t = 1 T i = 1 n Q t i · H i · E P i ω i ,
where Q t i is the amount of water pumped (diverted) from the pumping stations (gates) of water supply node i during period t; H i is the head of pumping station of water supply node i, m; E P i is the electricity price of pumping station of water supply node i; and ω i is the comprehensive utilization efficiency of pumping station of water supply node i.

3.1.5. Restrictive Conditions

In this study, the northward water transfer levels of Hongze, Luoma, and Nansihu lakes were selected as the decision variables. The water balance, lake storage capacity, pumping station pumping capacity, gate and dam overflow capacity, and water transfer control level were the constraints.
Water balance constraints.
The ESNWD system can be generalized into two types of water exchange systems: lakes and water supply nodes. For lakes along the northward transfer route, the water balance constraints are as follows:
S i + 1 j = S t j + I t j O t j Q t i E t j ,
where S i j , S i + 1 j is the volume of water stored at the beginning and end of period t in lake j, I t j is the amount of water coming from upstream of lake j during period t, O t j is the amount of water discharged from lake j during period t, and E t j is the evaporation and seepage loss of lake j during period t.
Upper and lower lake level constraints.
Z m i n , t j Z t j Z m a x , t j , Z t j = f S t j ,
where Z m i n , t j and Z m a x , t j are the minimum and maximum water levels allowed during period t for lake j, respectively; Z t j is the water level of lake j during period t; and f · is the water level-capacity relationship curve for lake j.
Lake-level constraints at the beginning and end of the period.
Subject to scheduling rules, the beginning and ending water levels for the South Water Lake Dispatch are determined by the beginning and ending water levels for the scheduling period.
Z 0 j = Z s t a r t j , Z T j = Z e n d j ,
where Z s t a r t j and Z e n d j are the initial and final water levels of lake j for the scheduling period, respectively.
Pumping capacity constraints.
Q t i P M t i ,
where P M t i is the pumping capacity of the upstream and downstream pumping stations (gates) in water-supply node i at period t.
Lake discharge capacity constraints.
0 O t j T Q t j ,
where T Q t j is the amount of permitted artesian discharge from lake j during period t.
Water supply constraints in water-receiving areas.
0 W k , t S W k , t D .
Water transfer constraints.
0 W R t W k , t D ,
where W R t is the amount of permitted artesian discharge from lake j during period t.
Non-negative constraints.
The values of the above physical parameters must be no less than zero.

3.2. NSGA-II Algorithm

NSGA-II is a fast elite, non-dominated ordering genetic algorithm for multi-objective optimization based on the ordering and computation of dominance relationships between individuals and is an improvement on NSGA by Deb et al. [38]. The advantage of this algorithm over NSGA is that fast non-dominated ordering can reduce the time and space complexities of the algorithm. It provides two attribute values, an individual-non-dominated order and crowding distance, which characterize individual fitness and perform genetic selection. When individuals belong to different non-dominated orders, the one with the higher non-dominated order is preferred; when individuals belong to the same non-dominated order, the one with the largest crowding distance is selected.

3.3. Entropy Weight TOPSIS Method

For a series of non-inferior solutions obtained through the optimization of the NSGA-II algorithm, it is necessary to select the required optimal solution using specific evaluation methods. The weight coefficients were determined using the entropy weight TOPSIS method. This determines the optimum value for the obtained solution set. It avoids the influence of subjective factors on the decision-making results associated the subjective assignment method, thereby selecting the optimal northward water transfer level more objectively.

3.3.1. Homogenization of Indicator Attributes

To facilitate subsequent data processing and presentation of the results, this study converted all cost-based indicators into benefit-based indicators for the total system costs and water shortages in the original water-receiving areas.
x = M x ,
where M is the maximum possible value of indicator x. The costs and water deficit obtained from the treatment were changed to benefit-based indicators.

3.3.2. Construction of Normalized Initial Matrix

The data matrix of the northward water transfer level optimization problem can be constructed as follows:
X = x 11 x 12 x 21 x 22 x 1 m x 2 m x n 1 x n 2 x n m ,
where x i j ( i = 1 , 2 , , n ; j = 1 , 2 , , m ) is the value of evaluation indicator j of evaluation object i; m is the total number of evaluation indicators; and n is the total number of evaluation objects. In this study, x i 1 is the cost of solution i of the solution set, and x i 2 is the water deficit of solution i of the solution set. The cost and water deficit metrics for all solutions together form this data matrix.
Constructing the weighted norm matrix, the metrics are vector normalized, and the cosine distance of the metric is used to divide each column element by the norm of the current column vector, which is handled as follows:
z i j = x i j i = 1 n x i j 2 ,
where z i j is the normalized value of evaluation indicator j for evaluation objective i. The normalized values of cost and water deficit were calculated as z i 1 , z i 2 . This results in the normalized matrix Z after the normalization process.
Z = z 11 z 12 z 21 z 22 z 1 m z 2 m z n 1 z n 2 z n m .

3.3.3. Determination of Positive and Negative Ideal Solutions

Z + is a positive ideal solution, consisting of the maximum value of evaluation indicator j among all evaluation objects; Z is a negative ideal solution, consisting of the minimum value of evaluation index j among all evaluation objects, and the formula is:
Z + = m a x z 11 , z 21 , , z n 1 , m a x z 12 , z 22 , , z n 2 , , m a x z 1 m , z 2 m , , z n m = Z 1 + , Z 2 + , , Z m + ,
Z = m i n z 11 , z 21 , , z n 1 , m i n z 12 , z 22 , , z n 2 , , m i n z 1 m , z 2 m , , z n m = Z 1 , Z 2 , , Z m .
where Z+ consists of the largest cost indicator and water deficit indicator in the solution set, and Z consists of the smallest cost indicator and water shortage indicator.

3.3.4. Determination of Indicator Weights

The entropy weight method based on information theory was used to calculate the weights of the evaluation indicators. It is an objective weighting method that determines the weights of indicators based on differences in the degree of orderliness of the information contained in the indicators, relying only on the degree of discretization of the data itself, and is calculated as follows:
p i j = x i j i = 1 n x i j ,
e j = i = 1 n p i j ln p i j ln x , j = 1,2 , , m ,
ω j = 1 e j k = 1 m 1 e k , j = 1,2 , , m ,
where e j is the entropy value of each indicator; ω j is the entropy weight coefficient of each indicator. The entropy value e 1 , entropy weight coefficient ω 1 of the cost indicator, and the entropy value e 2 , entropy weight coefficient ω 2 of the water deficit indicator were calculated.

3.3.5. Proximity Calculation of Each Evaluation Object to the Optimal and Worst Options

The Euclidean distance is used to calculate the distance between each evaluation object and the optimal and worst options, where D i + is the distance between the evaluation object i and Z i + , and D i is the distance between the evaluation object i and Z i . The formula is as follows:
D i + = j = 1 m ω j Z j + z i j 2 ,
D i = j = 1 m ω j Z j z i j 2 .
The distance of the solution i from the optimal solution is calculated as D i + and from the worst solution as D i .

3.3.6. Closeness Calculation of Each Evaluation Object to the Optimal Option

C i is the composite score index, indicating the degree of proximity between the evaluation object and optimal scheme. The value range is [0, 1]. The closer C i approaches to one, the closer the evaluated scheme is to the optimal scheme, indicating that it is more optimal with lower costs and higher benefits. The closer C i approaches to zero, the closer the evaluated scheme is to the worst scheme, indicating that the evaluated object is costlier and less effective. The formula for C i is as follows:
C i = D i D i + + D i .
The composite score index for the solution i is calculated as C i . The evaluation results are given in rank order according to the size of C i .

4. Results and Discussion

The drier year of 2017, which had a greater water shortage, was selected as the typical year. Using the water transfer levels of Hongze, Luoma, and Nansihu Lower lakes as the decision variables, and minimizing the total system cost and water shortage in the original receiving area of the lakes as the objective functions, the NSGA-II algorithm was used for the optimization of the scheme. The optimized northward water transfer level scheduling results were analyzed and compared with the current scheduling results. The initial population size was set to 100 (100p), the number of subgenerations was 50, the crossover probability is 0.9, the variance probability is dynamically adjusted according to the problem dimensions, and the maximum number of iterations was 100, 200, and 300 generations (100g, 200g, and 300g), respectively. The set of Pareto solutions obtained after the optimization is shown in Figure 8. This shows that the Pareto solution set of the optimized scheme is better than that of the original northward water transfer level scheme for the exact incoming and outgoing water demands but does not produce better results as the number of iterations increases. Consequently, when the number of iterations reaches 100g, the obtained Pareto solution set meets the optimization requirements. Increasing the number of iterations increased the optimization time. However, it did not yield better optimization results; therefore, the subsequent optimization calculations were fixed to use 100g as the number of iterations.
The number of iterations was set to 100, number of children to 50, and initial population sizes to 100, 200, and 300 (100p, 200p, and 300p). The Pareto solution set obtained after the optimization is shown in Figure 9. The difference between the sets of Pareto solutions obtained from different population sizes in the direction of smaller total costs and larger water shortages is not significant. However, compared with 200p and 300p, the 100p solution set discards the optimization results in the direction of larger total costs and smaller water shortages to a certain extent and cannot contain the feasible options more completely or perfectly. In contrast, the 200p and 300p solution sets can be considered to better cover the available options. To analyze the advantages and disadvantages of the Pareto solution sets obtained with different population sizes and select the appropriate optimal population sizes, solution sets with all three initial population sizes were used for decision optimization.
The optimal solutions for different population sizes were obtained using the entropy weight TOPSIS method for decision-making on solution sets with population sizes of 100, 200, and 300. The decision is made to obtain an optimal solution based on the overall population. The top ten results in the decision-making results are shown in Table 2 for presentation. The weights obtained using the entropy weighting method are listed in Table 3.
The results of the optimized scheduling of the northward water transfer level for the three different population sizes compared with the original scheduling results are shown in Table 4. The northward water transfer level lines of Hongze, Luoma, and Nansihu Lower lakes before and after optimization are shown in Figure 10.
The results of the 100p optimized northward water transfer level compared with the results of the current northward water transfer level, and the total cost is slightly reduced from 490 million to 483 million, a decrease of approximately 1.45%. The original water receiving area water shortage is from 524 million to 546 million m3, an increase of approximately 4.19%. Compared with the 200p optimized northward water transfer level scheme results, the total cost remained almost the same, rising from 490 million to 492 million, an increase of approximately 0.45%. However, the original water receiving area water shortage dropped significantly, from 524 million to 483 million m3, a decrease of more than 7.86%. The result of the 300p optimization scheme of the northward water transfer level, compared with the current northward water transfer level scheme, is that the total cost increases by 1.00%, while the water shortage in the original water-receiving area decreases by approximately 10.9%. In contrast to the study of Yang et al. [26], this study further includes the Nansi Lower Lake in addition to Hongze Lake and Luoma Lake in the optimization, which achieves the optimal allocation of water resources. Compared to the study of Xi et al. [32], this study not only realizes the same reduction of water deficit in Jiangsu Province but also realizes the reduction of water deficit in the whole ESNWD project system.
As the population size increased, the weights obtained by the entropy weighting method gradually shifted from focusing on the total cost to focusing on the water shortage in the original water-receiving area. The optimization results obtained from the decision also showed an increasing total cost and decreasing water shortage.
A comparison of the optimized northward water transfer level with the original northward water transfer level showed that the overall optimized northward water transfer level showed an increasing trend, except for Luoma Lake. The optimized northward water transfer level for 100p fluctuated above and below the original northward water transfer level, with no significant advantage over it. The optimized northward water transfer levels of 200p and 300p showed a more obvious increase in the overall water level. As the initial northward water transfer level of Luoma Lake was set on the high side, the optimized northward water transfer level, compared to the original northward water transfer level, resulted in a relatively higher water level during the non-flood season and a relatively lower water level during the flood season. This shows that the optimized northward water transfer level helps the lake store water during the non-flood season, meets the water demands of the original water receiving area, and reduces the risk of water shortages in the original water receiving area. The reserved storage capacity during the flood season owing to the lower northward water transfer level further satisfies the flood control requirements and reduces the flood risk. Due to the randomness of the individual generations of the genetic algorithm, the obtained optimized water level has a large volatility defect. However, this still shows that there is an optimization space for the existing northward water transfer level setting.
Although the current optimization strategy of the northward water transfer level has achieved obvious results, further improvements can still be considered to obtain lower costs and less risk of water shortages. To improve the accuracy of the optimal water level scheme, a series of optimization calculations of the northward water level on a decadal scale, or on a monthly scale during the non-flood season and on a decadal scale during the flood season, can be considered to accurately regulate the water levels of the lakes. In addition, a comparison of different genetic algorithms can be considered to select the algorithm with better performance to improve the speed and efficiency of optimization calculations. In addition, with the continuous advancement and development of the ESNWD project, the water levels of the Nansihu Upper and Dongping lakes can be included in the scope of optimization. This issue should be addressed in future research projects.

5. Conclusions

Inter-basin water transfer effectively resolves the uneven spatial distribution of water resources. For the cross-basin water transfer system of the ESNWD, the optimal scheduling model of water resources was constructed with the optimization objectives of the lowest total cost and lowest water shortages in the original water receiving area of the lakes on the east route and with the northward water transfer level of the lakes as the optimization variable. The optimized northward water transfer level was obtained through the second-generation genetic algorithm optimization solution and decision-making using the entropy weight TOPSIS method. By setting different optimization parameters and comparing the optimization results, we drew the following conclusions:
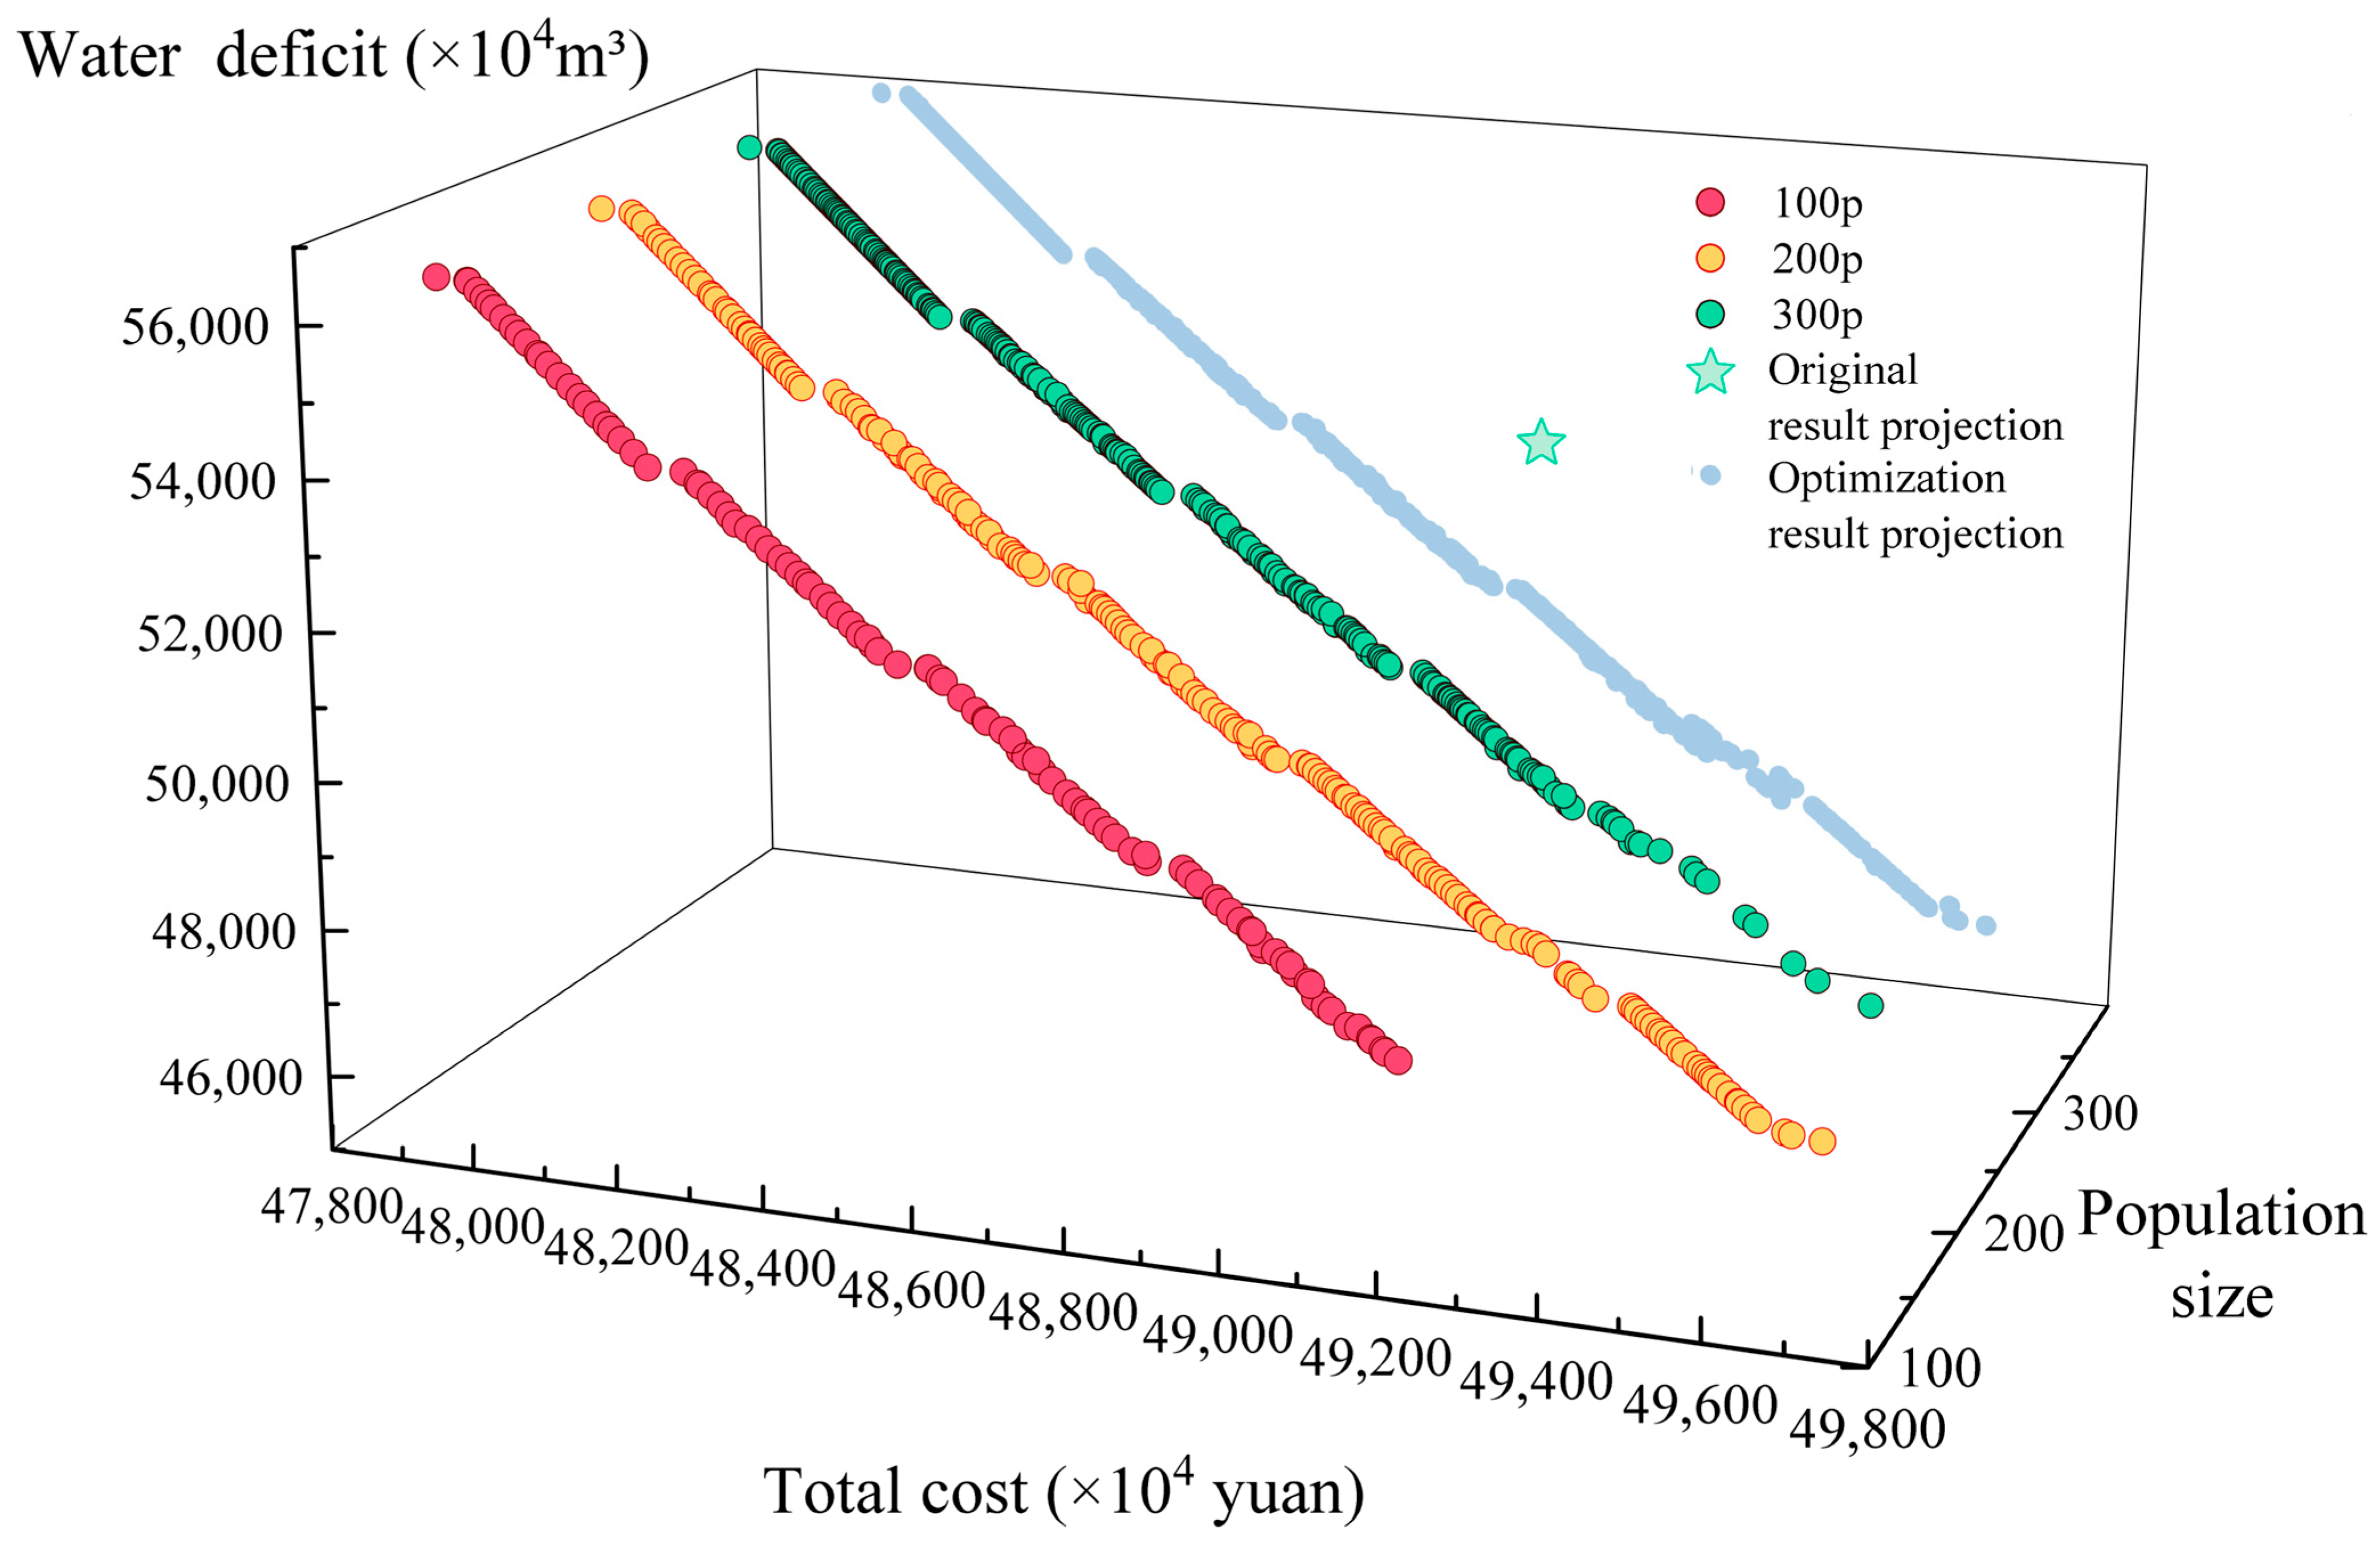
  • Different numbers of iterations have less impact on the optimization results, and different population sizes affect the Pareto solution set of the optimization, and ultimately, the decision results. The larger the population size is, the more costs tend to increase, while water shortages in the original water-receiving area are reduced.
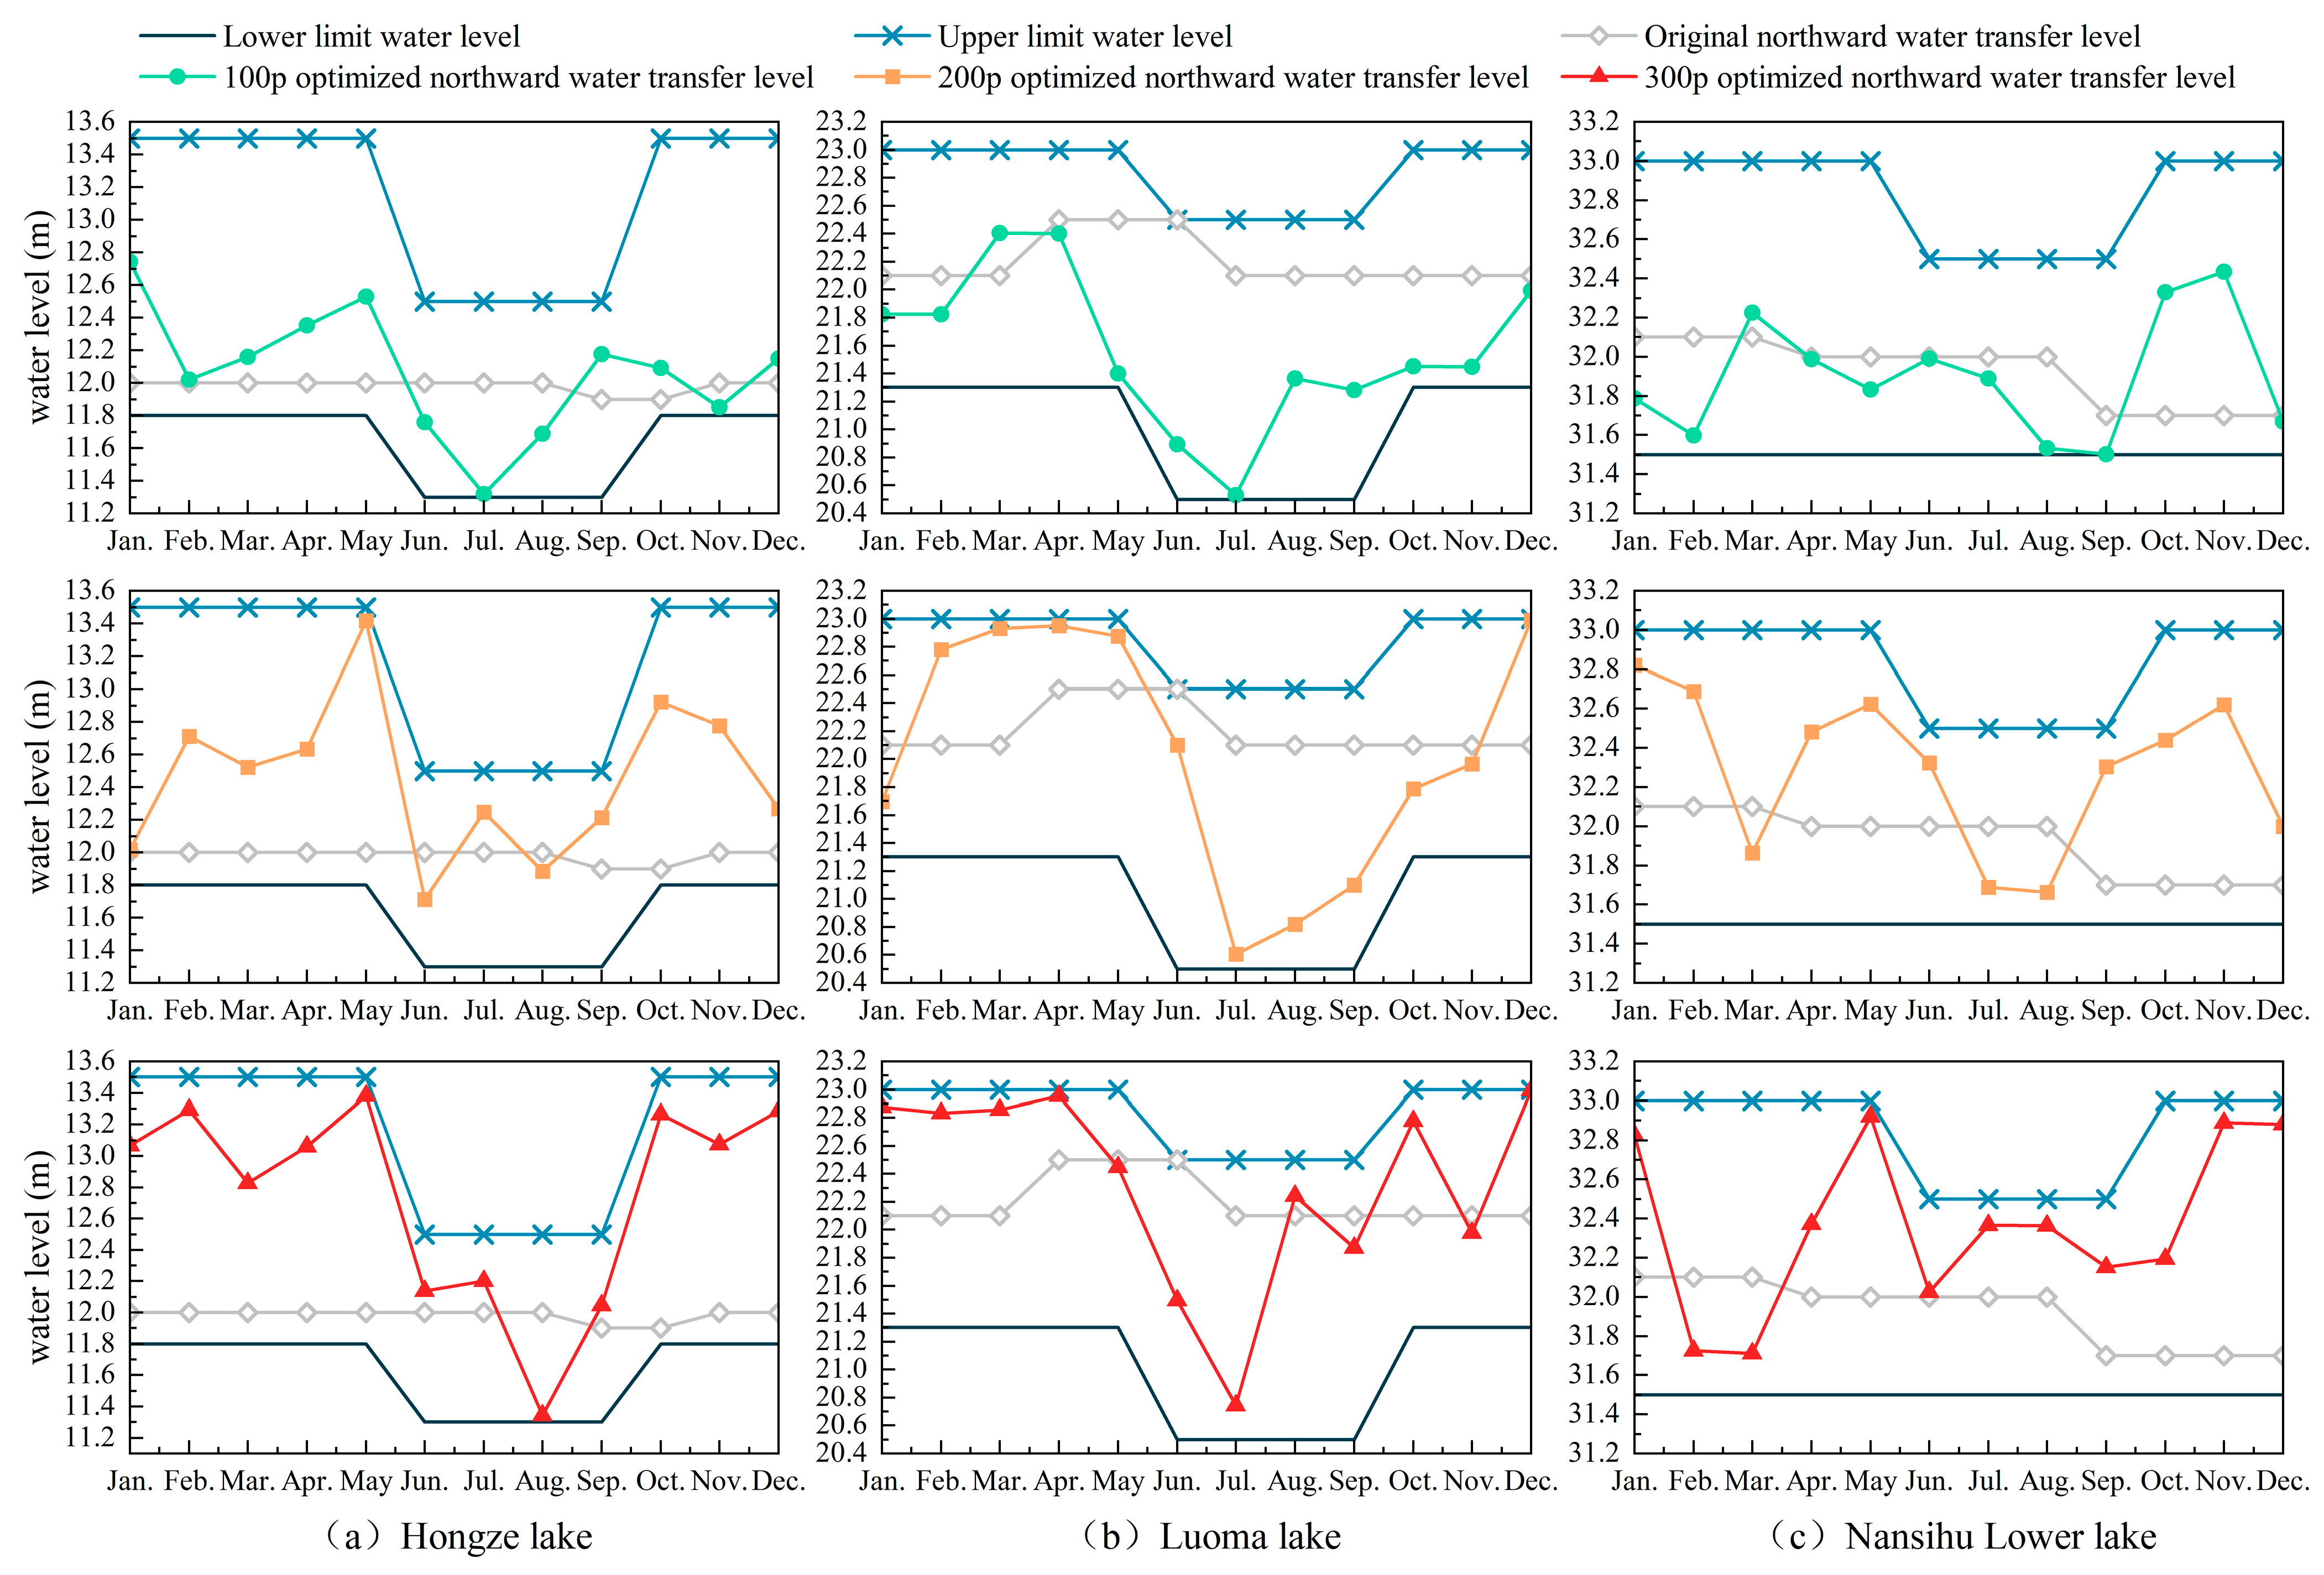
  • The optimized non-inferior solution set is better than the current northward water transfer level, reduces the cost of the water transfer system, and minimizes the risk of water shortages in the receiving areas. It can also more effectively coordinate the conflicts between water supply and demand, as well as between the original receiving area and the water transfer area.
  • The optimized northward water transfer level can raise the water level during the non-flood season, reduce the risk of water shortages in the original water-receiving areas, and lower the water level during the flood season to meet flood control needs. However, due to the influence of the algorithm, the optimization results still exhibit the defect of high water-level fluctuation, which should be optimized further.
Overall, the proposed model greatly improves existing methods and effectively increases system benefits. The water allocation scheme is adjusted based on the northward water transfer level of the lakes to obtain the optimal solution in the ESNWD project, which balances the risk of water shortages in the original receiving areas of the lakes and water demand requirements in the transfer line.

Author Contributions

Conceptualization, X.W.; methodology, X.P. and X.G.; software, Q.W. and Y.X.; validation, C.S., X.P. and Y.X.; formal analysis, H.W.; investigation, Y.X.; resources, Y.H.; data curation, X.P.; writing—original draft preparation, X.P.; writing—review and editing, X.W.; visualization, X.P.; supervision, X.W.; project administration, X.W.; funding acquisition, X.W. All authors have read and agreed to the published version of the manuscript.

Funding

This research was funded by the Project of China South-to-North Water Diversion Co., Ltd. (DXZ-2023-081-ZD-ZX), the Water Resources Science and Technology Program of Hunan Province, P.R.C. (Grant No. XSKJ2024064-3), and the Open Research Fund Program of National Key Laboratory of Water Disaster Prevention (Grant No. 2024490511).

Data Availability Statement

The original contributions presented in this study are included in the article. Further inquiries can be directed to the corresponding author.

Conflicts of Interest

Qingyang Wu was employed by Hydrochina Huadong Engineering Corporation. Yu Hou was employed by China South-to-North Water Diversion Eastern Route Corporation Limited. The remaining authors declare that the research was conducted in the absence of any commercial or financial relationships that could be construed as a potential conflict of interest.

References

  1. China’s 2022 Water Resources Bulletin. Water Resour. Dev. Manag. 2023, 9, 2.
  2. Zhong, H.; Liao, T.; Fang, G.; Ren, K.; Zhang, S. Exploring optimal joint operating rules for large-scale inter-basin water transfer projects with multiple water sources, diversion routes, and water demand areas. J. Hydrol. Reg. Stud. 2023, 49, 101504. [Google Scholar] [CrossRef]
  3. Li, M.; Yang, X.; Wang, K.; Di, C.; Xiang, W.; Zhang, J. Exploring China’s water scarcity incorporating surface water quality and multiple existing solutions. Environ. Res. 2024, 246, 118191. [Google Scholar] [CrossRef] [PubMed]
  4. Chai, Q.; Han, W.; Wan, F.; Ding, Z.; Wu, F. Study on coordinated allocation of conventional and unconventional water resources in typical regions of North China. Front. Earth Sci. 2023, 11, 1–10. [Google Scholar] [CrossRef]
  5. Huang, Z.; Yuan, X.; Liu, X.; Tang, Q. Growing control of climate change on water scarcity alleviation over northern part of China. J. Hydrol. Reg. Stud. 2023, 46, 101332. [Google Scholar] [CrossRef]
  6. Liu, C.; Zheng, H. South-to-north Water Transfer Schemes for China. Int. J. Water Resour. Dev. 2002, 18, 453–471. [Google Scholar] [CrossRef]
  7. Sheng, J.; Zhang, R.; Yang, H. Inter-basin water transfers and water rebound effects: The South-North water transfer Project in China. J. Hydrol. 2024, 638, 131516. [Google Scholar] [CrossRef]
  8. Matrosov, E.S.; Harou, J.J.; Loucks, D.P. A computationally efficient open-source water resource system simulator—Application to London and the Thames Basin. Environ. Modell. Softw. 2011, 26, 1599–1610. [Google Scholar] [CrossRef]
  9. Felisa, G.; Panini, G.; Pedrazzoli, P.; Di Federico, V. Combined management of groundwater resources and water supply systems at basin scale under climate change. Water Resour. Manag. 2022, 36, 915–930. [Google Scholar] [CrossRef]
  10. Lennard, A.T.; Macdonald, N.; Clark, S.; Hooke, J.M. The application of a drought reconstruction in water resource management. Hydrol. Res. 2016, 47, 646–659. [Google Scholar] [CrossRef]
  11. Wurbs, R.A. Modeling river/reservoir system management, water allocation, and supply reliability. J. Hydrol. 2004, 300, 100–113. [Google Scholar] [CrossRef]
  12. An, S.; Wu, Y.; Liang, W.; Zhang, G.; Chen, J.; Liu, S.; Zhao, F.; Qiu, L.; Yin, X. Enhancing ecohydrological simulation with improved dynamic vegetation growth module in SWAT. J. Hydrol. 2024, 644, 132042. [Google Scholar] [CrossRef]
  13. Sun, J.; Xiao, J.; Li, Z.; Lai, G.; Du, J.; Xie, S.; Xu, X.; Meng, L.; Li, X.; Zhong, K. Effect of calculation unit division in distributed hydrological models on the analysis of hydrological effects of land use change. Catena 2024, 246, 108445. [Google Scholar] [CrossRef]
  14. Cetinkaya, C.P.; Fistikoglu, O.; Harmancioglu, N.B.; Fedra, K. Optimization methods applied for sustainable management of water-scarce basins. J. Hydroinf. 2008, 10, 69–95. [Google Scholar] [CrossRef]
  15. Berhe, F.T.; Melesse, A.M.; Hailu, D.; Sileshi, Y. MODSIM-based water allocation modeling of Awash River Basin, Ethiopia. Catena 2013, 109, 118–128. [Google Scholar] [CrossRef]
  16. Chhuon, K.; Herrera, E.; Nadaoka, K. Application of integrated hydrologic and river basin management modeling for the optimal development of a multi-purpose reservoir project. Water Resour. Manag. 2016, 30, 3143–3157. [Google Scholar] [CrossRef]
  17. Suo, M.; Xia, F.; Fan, Y. A fuzzy-interval dynamic optimization model for regional water resources allocation under uncertainty. Sustainability 2022, 14, 1096. [Google Scholar] [CrossRef]
  18. Ngamsert, R.; Techarungruengsakul, R.; Kaewplang, S.; Hormwichian, R.; Prasanchum, H.; Sivanpheng, O.; Kangrang, A. Optimizing solution in decision supporting system for river basin management consisting of a reservoir system. Water 2023, 15, 2510. [Google Scholar] [CrossRef]
  19. Rong, Q.; Zhu, S.; Yue, W.; Su, M.; Cai, Y. Predictive simulation and optimal allocation of surface water resources in reservoir basins under climate change. Int. Soil. Water Conserv. Res. 2024, 12, 467–480. [Google Scholar] [CrossRef]
  20. Spiliotis, M.; Mediero, L.; Garrote, L. Optimization of hedging rules for reservoir operation during droughts based on particle swarm optimization. Water Resour. Manag. 2016, 30, 5759–5778. [Google Scholar] [CrossRef]
  21. Mirfenderesgi, G.; Mousavi, S.J. Adaptive meta-modeling-based simulation optimization in basin-scale optimum water allocation: A comparative analysis of meta-models. J. Hydroinf. 2016, 18, 446–465. [Google Scholar] [CrossRef]
  22. Borgomeo, E.; Mortazavi-Naeini, M.; Hall, J.W.; O’Sullivan, M.J.; Watson, T. Trading-off tolerable risk with climate change adaptation costs in water supply systems. Water Resour. Res. 2016, 52, 622–643. [Google Scholar] [CrossRef]
  23. Fereidoon, M.; Koch, M. SWAT-MODSIM-PSO optimization of multi-crop planning in the Karkheh River Basin, Iran, under the impacts of climate change. Sci. Total Environ. 2018, 630, 502–516. [Google Scholar] [CrossRef] [PubMed]
  24. Dogan, M.S.; Fefer, M.A.; Herman, J.D.; Hart, Q.J.; Merz, J.R.; Medellín-Azuara, J.; Lund, J.R. An open-source Python implementation of California’s hydroeconomic optimization model. Environ. Modell. Softw. 2018, 108, 8–13. [Google Scholar] [CrossRef]
  25. Ouyang, S.; Qin, H.; Shao, J.; Lu, J.; Bing, J.; Wang, X.; Zhang, R. Multi-objective optimal water supply scheduling model for an inter-basin water transfer system: The South-to-North Water Diversion Middle Route Project, China. Water Supply 2020, 20, 550–564. [Google Scholar] [CrossRef]
  26. Yang, Z.; Huang, X.; Liu, J.; Fang, G. Optimal operation of floodwater resources utilization of lakes in South-to-North Water Transfer Eastern Route Project. Sustainability 2021, 13, 4857. [Google Scholar] [CrossRef]
  27. Tabari, M.M.R.; Yazdi, A. Conjunctive Use of Surface and Groundwater with Inter-Basin Transfer Approach: Case Study Piranshahr. Water Resour. Manag. 2014, 28, 1887–1906. [Google Scholar] [CrossRef]
  28. Tabari, M.M.R.; Abyar, M. Development a Novel Integrated Distributed Multi-objective Simulation-optimization Model for Coastal Aquifers Management Using NSGA-II and GMS Models. Water Resour. Manag. 2022, 36, 75–102. [Google Scholar] [CrossRef]
  29. Tabari, M.M.R.; Azadani, M.N.; Kamgar, R. Development of operation multi-objective model of dam reservoir under conditions of temperature variation and loading using NSGA-II and DANN models: A case study of Karaj/Amir Kabir dam. Soft Comput. 2020, 46, 12469–12499. [Google Scholar] [CrossRef]
  30. Tabari, M.M.R.; Safari, R. Development of water re-allocation policy under uncertainty conditions in the inflow to reservoir and demands parameters: A case study of Karaj AmirKabir dam. Soft Comput. 2023, 27, 6521–6547. [Google Scholar] [CrossRef]
  31. Shi, H.; Cheng, J.; Fang, H.; Lu, X. Optimal allocation of water resources for Jiangsu section of South-to-North Water Transfer East Line Project. Edit. Off. Trans. Chin. Soc. Agric. Eng. 2012, 28, 76–81. [Google Scholar]
  32. Xi, H.; Xie, Y.; Liu, S.; Mao, Q.; Shen, T.; Zhang, Q. Multi-objective optimal scheduling of generalized water resources based on an inter-basin water transfer project. Water 2023, 15, 3195. [Google Scholar] [CrossRef]
  33. Huayu, Z.; Tao, L.; Guohua, F.; Shiwei, Z.; Bingyi, Z. Deriving water allocation schemes for interbasin water transfer projects using a novel multiobjective cuckoo search algorithm. J. Water Resour. Plann. Manag. 2024, 150, 6. [Google Scholar]
  34. Fang, G.; Guo, Y.; Wen, X.; Fu, X.; Lei, X.; Tian, Y.; Wang, T. Multi-objective differential evolution-chaos shuffled frog leaping algorithm for water resources system optimization. Water Resour. Manag. 2018, 32, 3835–3852. [Google Scholar] [CrossRef]
  35. Liu, Y.; Zheng, H.; Wan, W.; Zhao, J. Optimal operation toward energy efficiency of the long-distance water transfer project. J. Hydrol. 2023, 618, 129152. [Google Scholar] [CrossRef]
  36. Guo, Y.; Tian, X.; Fang, G.; Xu, Y.-P. Many-objective optimization with improved shuffled frog leaping algorithm for inter-basin water transfers. Adv. Water Resour. 2020, 138, 103531. [Google Scholar] [CrossRef]
  37. Zhuan, X.; Li, W.; Yang, F. Optimal operation scheduling of a pumping station in east route of South-to-north Water Diversion Project. Energy Procedia 2017, 105, 3031–3037. [Google Scholar] [CrossRef]
  38. Deb, K.; Agrawal, S.; Pratap, A.; Meyarivan, T. A fast and elitist multiobjective genetic algorithm: NSGA-II. IEEE Trans. Evolut. Comput. 2002, 6, 182–197. [Google Scholar] [CrossRef]
Figure 1. Road map of the East route of the South-to-North Water Diversion (ESNWD) project.
Water 17 00839 g001
Figure 2. Schematic diagram of the engineering system of the ESNWD project.
Water 17 00839 g002
Figure 3. Technology roadmap.
Water 17 00839 g003
Figure 4. Adjacency list structure diagram.
Water 17 00839 g004
Figure 5. Lake water balance diagram.
Water 17 00839 g005
Figure 6. Schematic diagram of the intake section.
Water 17 00839 g006
Figure 7. Schematic diagram of the pumping station.
Water 17 00839 g007
Figure 8. Pareto solution set for NSGA-II with different numbers of iterations.
Water 17 00839 g008
Figure 9. Pareto solution set for NSGA-II with different numbers of population sizes.
Water 17 00839 g009
Figure 10. Diagram of the original northward water transfer level and the optimized northward water transfer level lines.
Water 17 00839 g010
Table 1. Current northward water transfer levels in the lakes of the ESNWD Project (Unit: m).
Jan.Feb.Mar.Apr.MayJun.Jul.Aug.Sep.Oct.Nov.Dec.
Hongze Lake12.012.012.012.012.012.012.012.011.911.912.012.0
Luoma Lake22.122.122.122.522.522.522.122.122.122.122.122.1
Nansihu Lower Lake32.132.132.132.032.032.032.032.031.731.731.731.7
Table 2. Decision-making process and results of the entropy weight TOPSIS method.
Population
Size
Total Cost Index
( z i 1 )
Water Deficit Index
( z i 2 )
Optimal
Distance ( D i + )
Worst
Distance
( D i )
Composite Score Index ( C i ) Rank
1000.1362 0.0423 0.0926 0.1018 0.5237 1
0.1388 0.0390 0.0942 0.1029 0.5221 2
0.1411 0.0361 0.0957 0.1040 0.5207 3
0.1429 0.0338 0.0970 0.1049 0.5196 4
0.1438 0.0327 0.0975 0.1053 0.5192 5
0.1456 0.0305 0.0988 0.1062 0.5181 6
0.1474 0.0281 0.1001 0.1072 0.5171 7
0.1487 0.0265 0.1011 0.1079 0.5165 8
0.1755 00.1178 0.1254 0.5158 9
0.1505 0.0242 0.1024 0.1090 0.5155 10
2000.0314 0.0966 0.0644 0.0728 0.5307 1
0.0314 0.0966 0.0643 0.0728 0.5307 2
0.0321 0.0958 0.0641 0.0723 0.5304 3
0.0328 0.0949 0.0638 0.0719 0.5299 4
0.0329 0.0947 0.0637 0.0718 0.5298 5
0.0336 0.0939 0.0635 0.0714 0.5293 6
0.0299 0.0976 0.0651 0.0732 0.5291 7
0.0340 0.0934 0.0634 0.0712 0.5291 8
0.0549 0.0728 0.0577 0.0648 0.5287 9
0.0348 0.0924 0.0631 0.0707 0.5285 10
3000.0058 0.1174 0.0534 0.0890 0.6247 1
0.0040 0.1198 0.0545 0.0907 0.6245 2
0.0087 0.1118 0.0521 0.0848 0.6196 3
00.1228 0.0571 0.0930 0.6196 4
0.0095 0.1107 0.0517 0.0840 0.6191 5
0.0182 0.1005 0.0483 0.0770 0.6148 6
0.0182 0.1004 0.0482 0.0770 0.6147 7
0.0177 0.1005 0.0485 0.0770 0.6132 8
0.0124 0.1056 0.0507 0.0803 0.6131 9
0.0174 0.1007 0.0487 0.0771 0.6130 10
Table 3. Weights of the entropy weighting method for different population sizes.
Population SizeTotal CostWater Deficit
1000.51120.4888
2000.48360.5164
3000.42700.5730
Table 4. Comparison of original northward water transfer level and optimized northward water transfer level scheduling results.
Northward Water Transfer Level Scheduling ProgramTotal Cost
(×104 yuan)
Rate of Change in Total CostsWater Deficit
(×104 m3)
Rate of Change in Water Deficit
Original 48,978.16 52,404.11
100p48,268.81−1.45%54,597.73+4.19%
200p49,199.21+0.45%48,286.84−7.86%
300p49,469.71+1.00%46,681.14−10.9%
Disclaimer/Publisher’s Note: The statements, opinions and data contained in all publications are solely those of the individual author(s) and contributor(s) and not of MDPI and/or the editor(s). MDPI and/or the editor(s) disclaim responsibility for any injury to people or property resulting from any ideas, methods, instructions or products referred to in the content.

