
Hydrochemical Characteristics and Indicative Significance of Terminal Tributaries in Karst Water Systems: A Case Study of the Zhongdu River Basin in Southwest China

 ,
,  ,
,
Abstract
1. Introduction
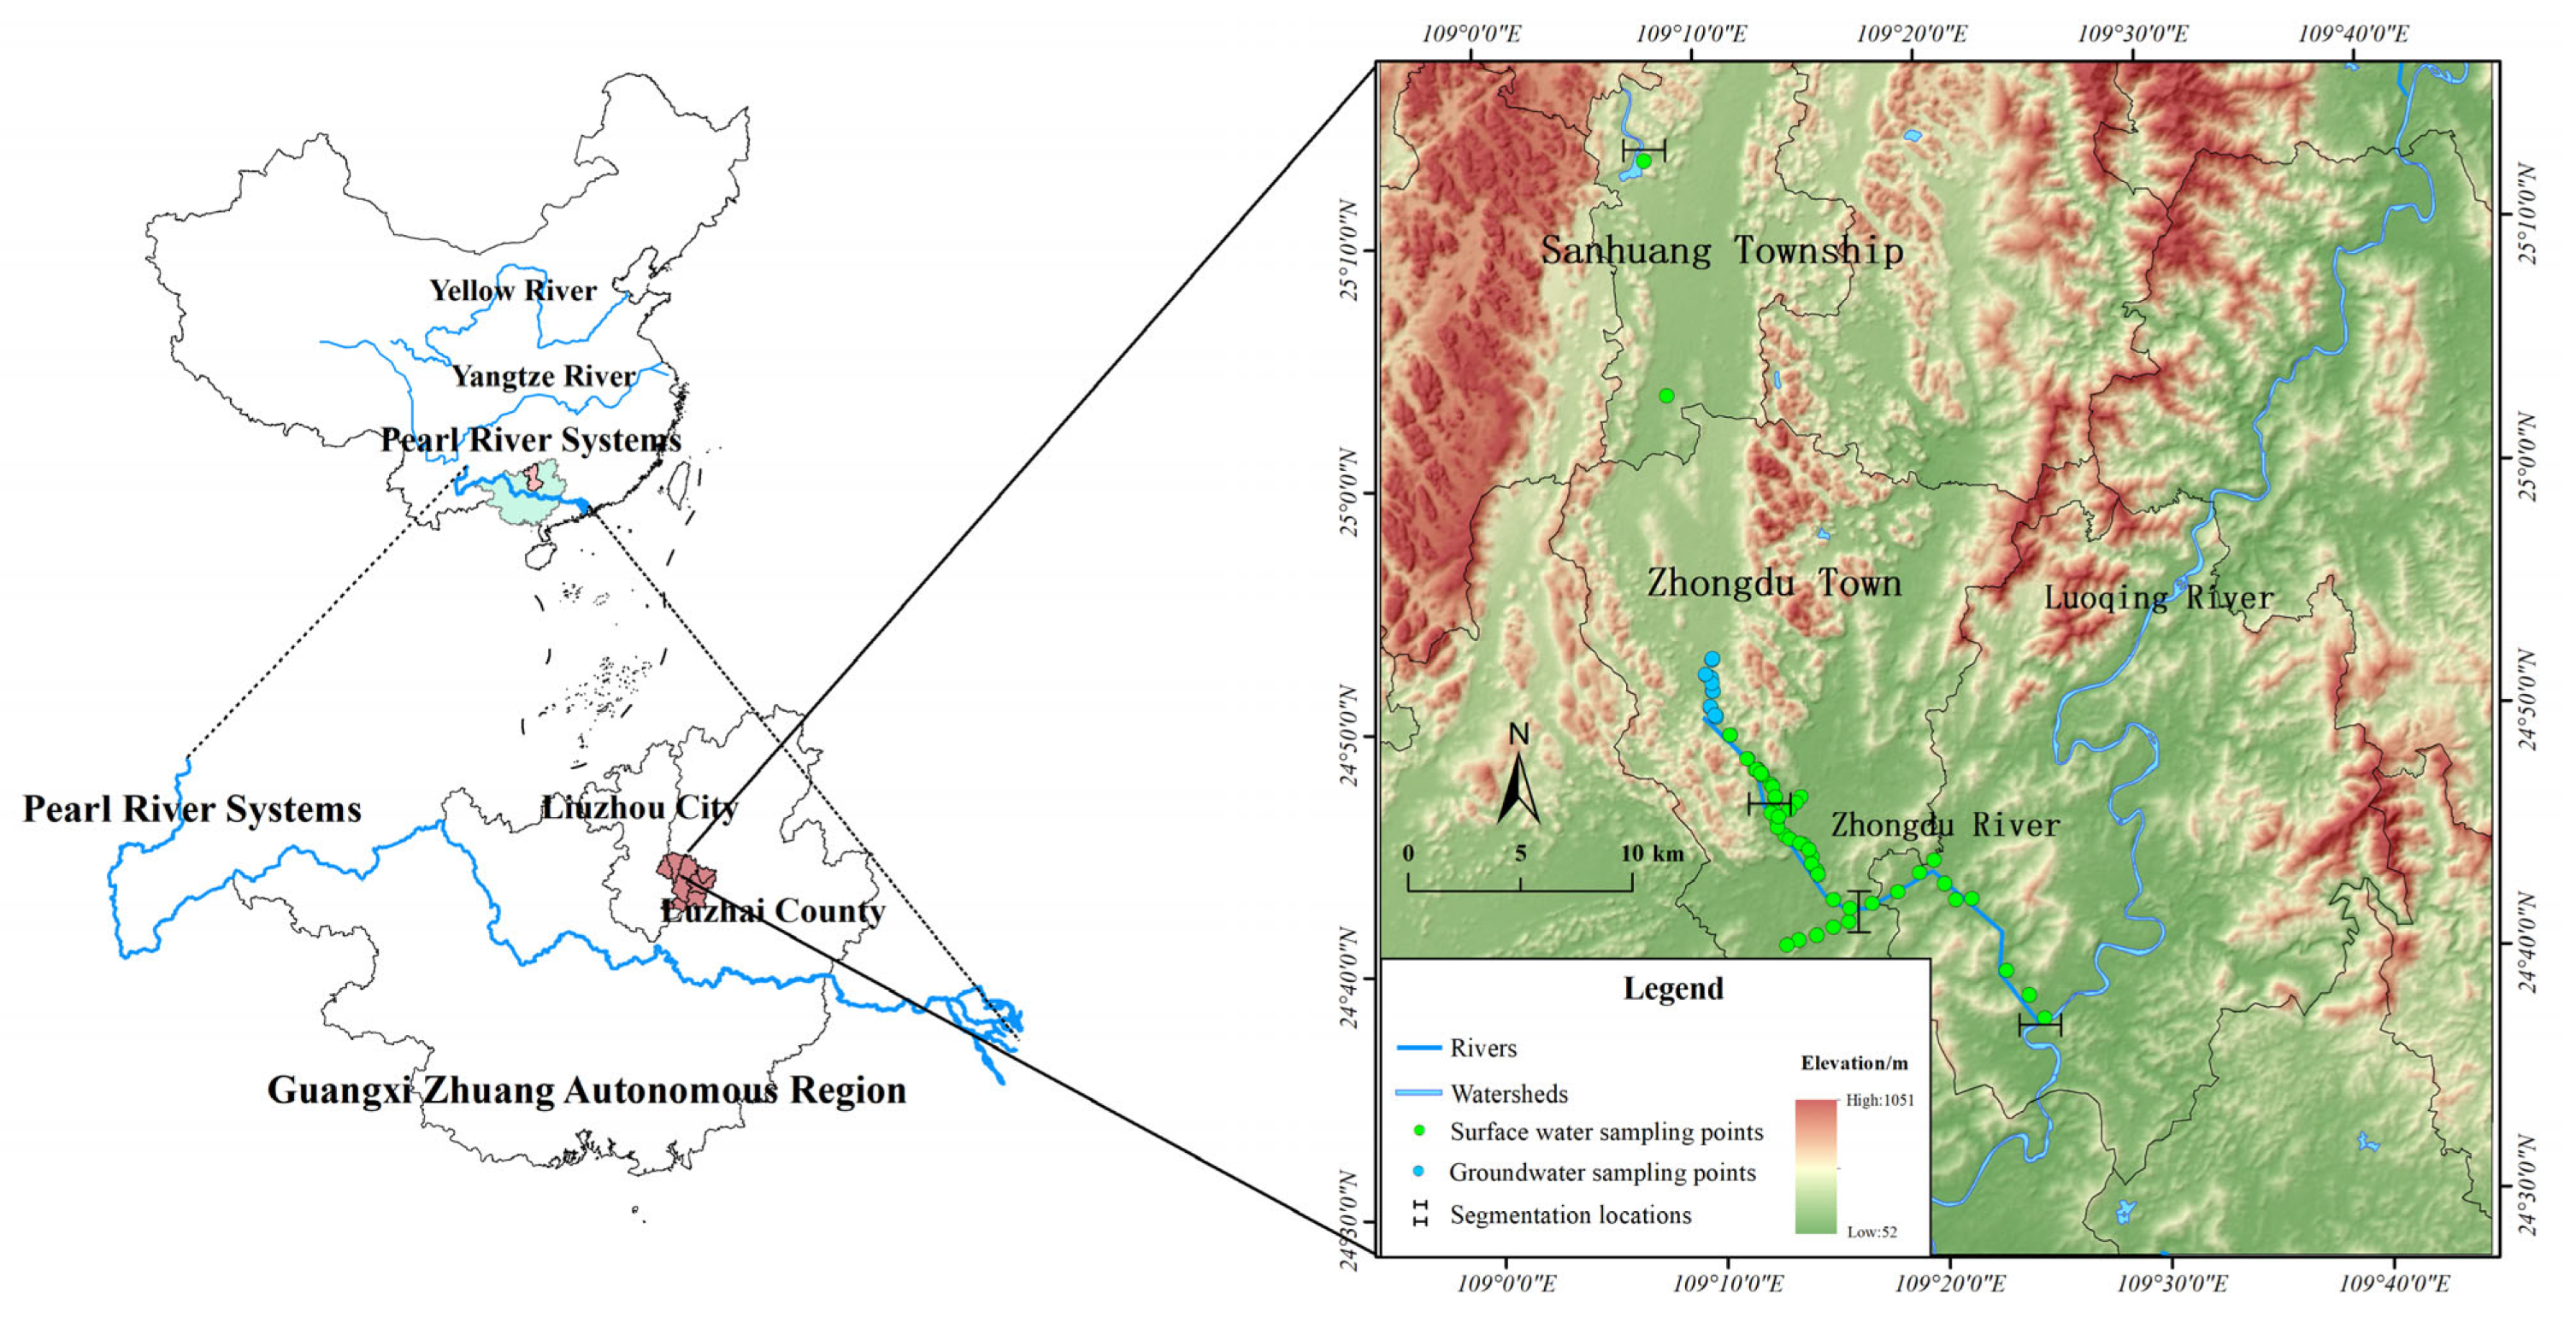
2. Study Area
3. Materials and Methods
3.1. Sampling
3.2. Testing
3.3. Analysis Methods
3.3.1. Saturation Index
3.3.2. Chloro-Alkaline Index
3.3.3. Entropy-Weighted Water Quality Index
| EWQI | Rating Level | Water Quality Status |
| <28 | I | Excellent |
| 28–57 | II | Good |
| 57–100 | III | Moderate |
| 100–163 | IV | Poor |
| >163 | V | Very Poor |
4. Results and Discussion
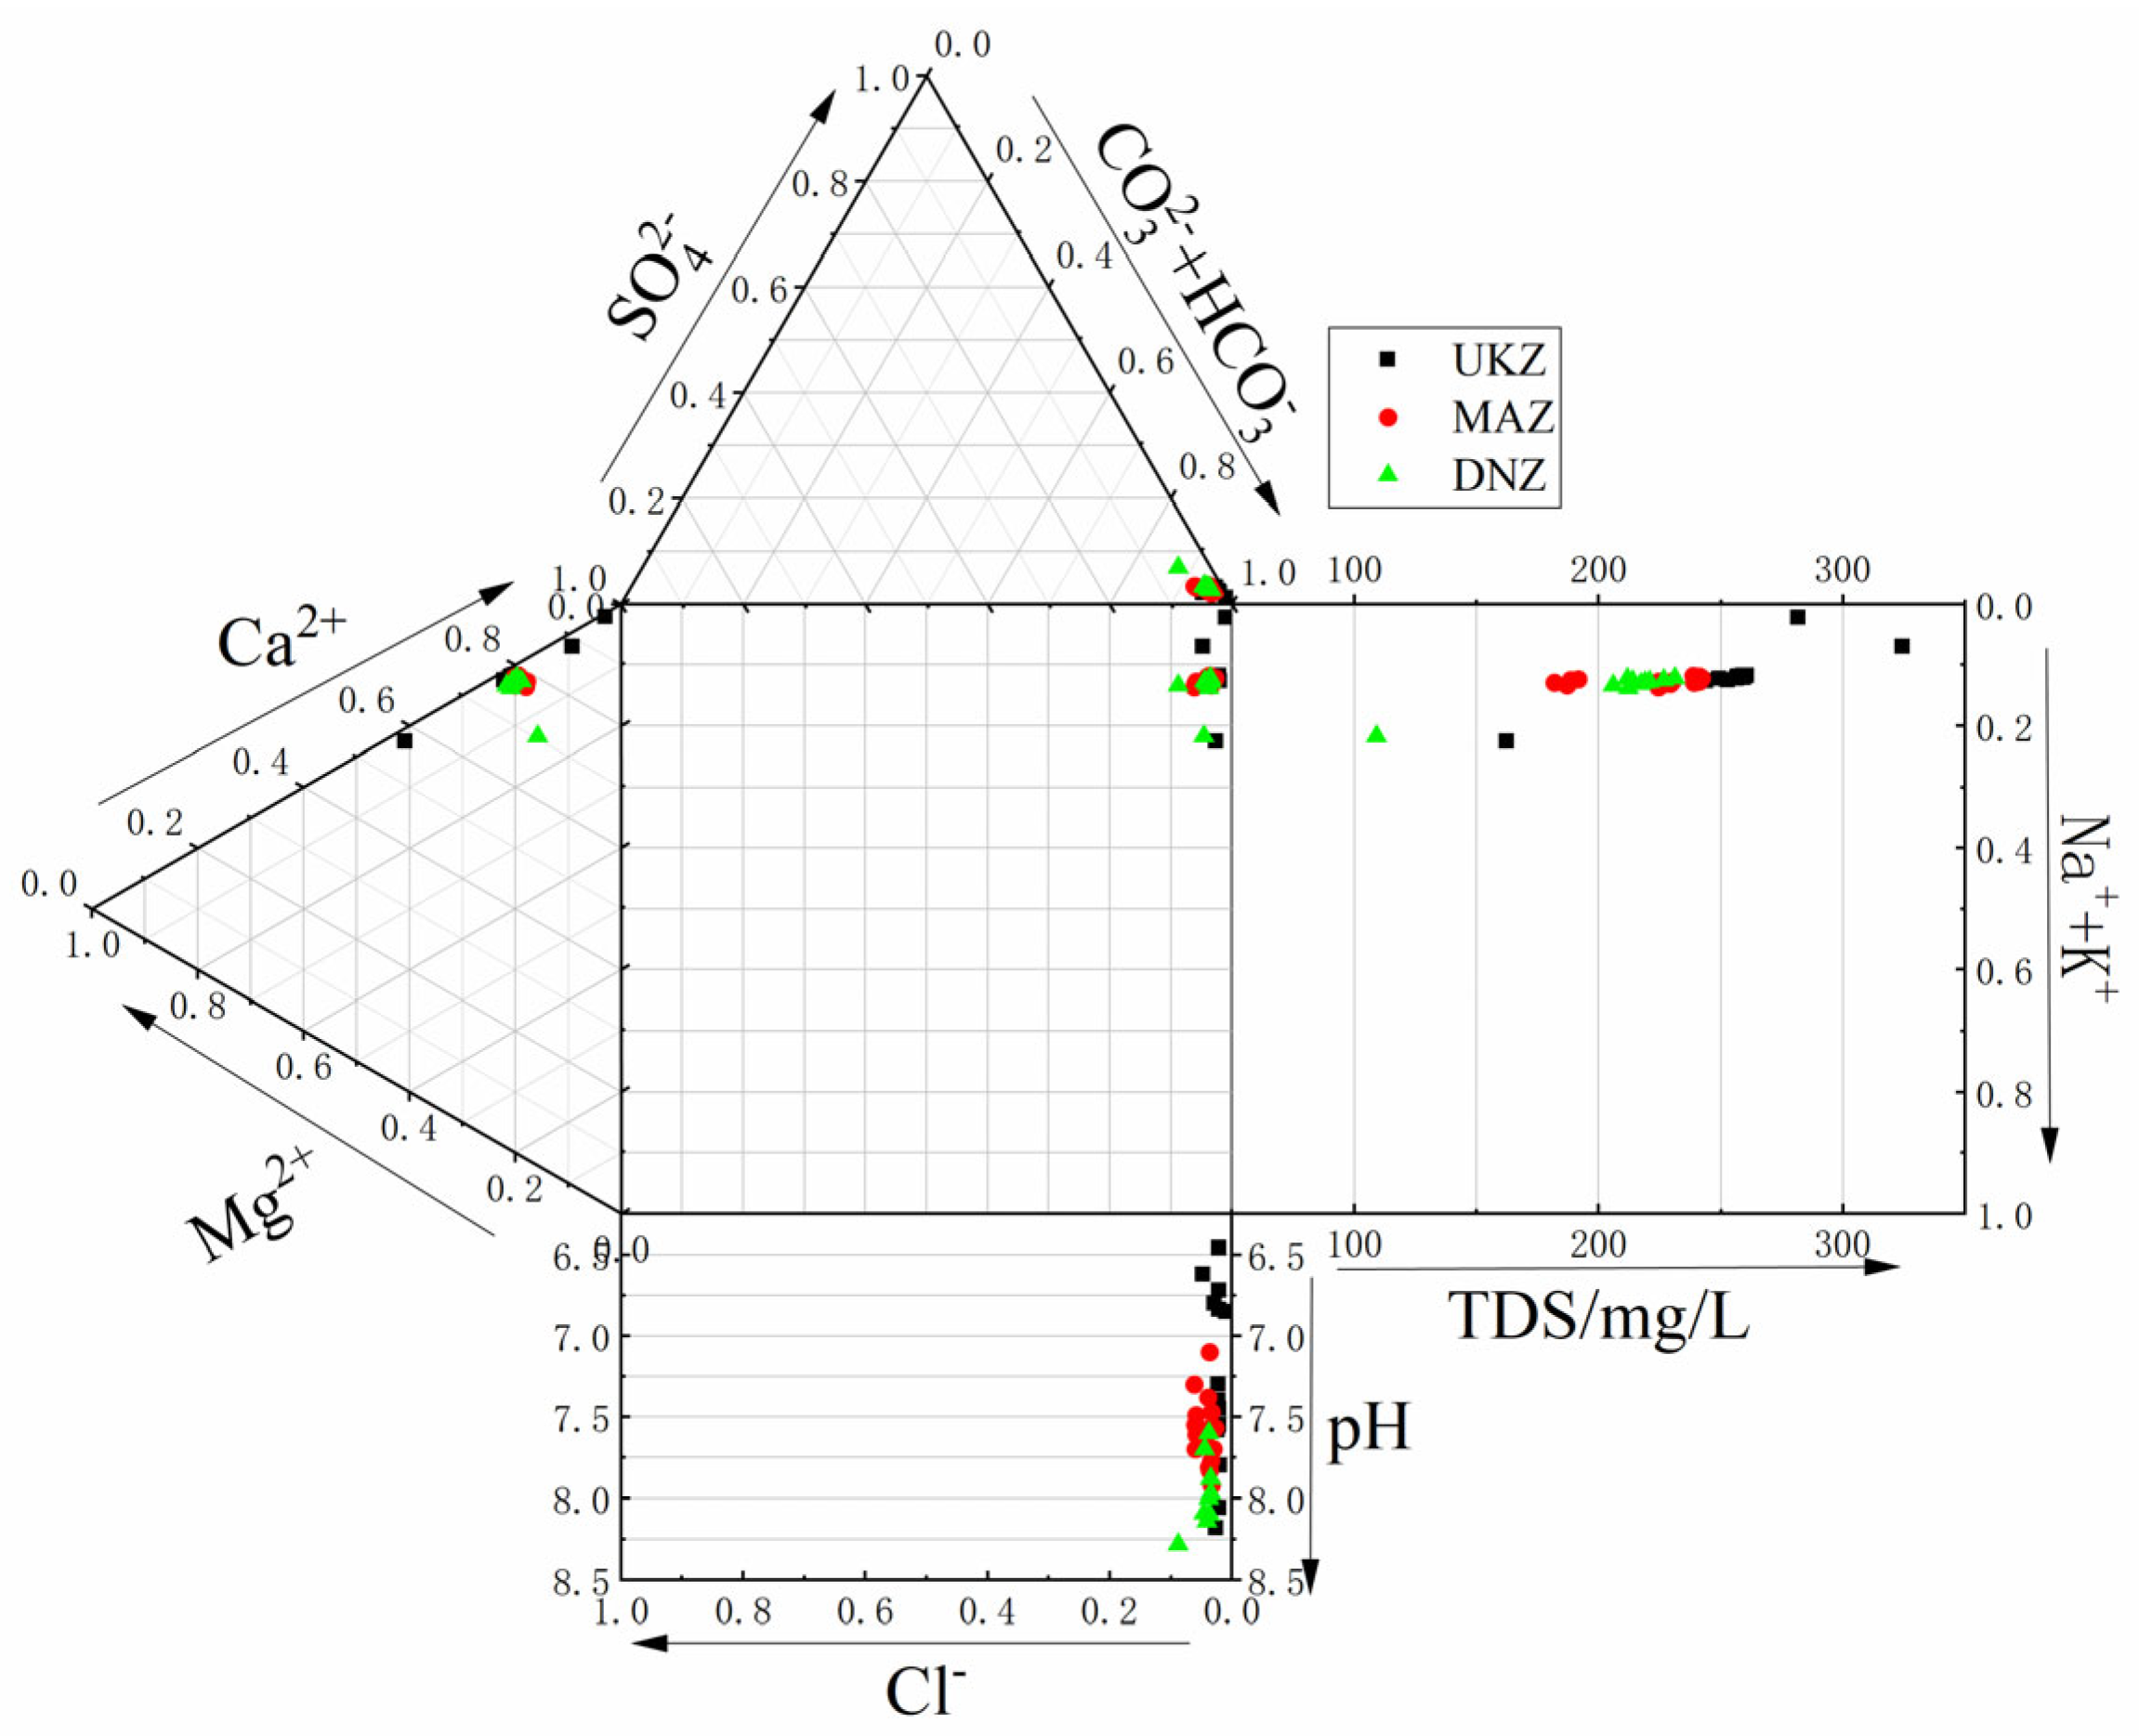
4.1. Hydrochemical Characteristics
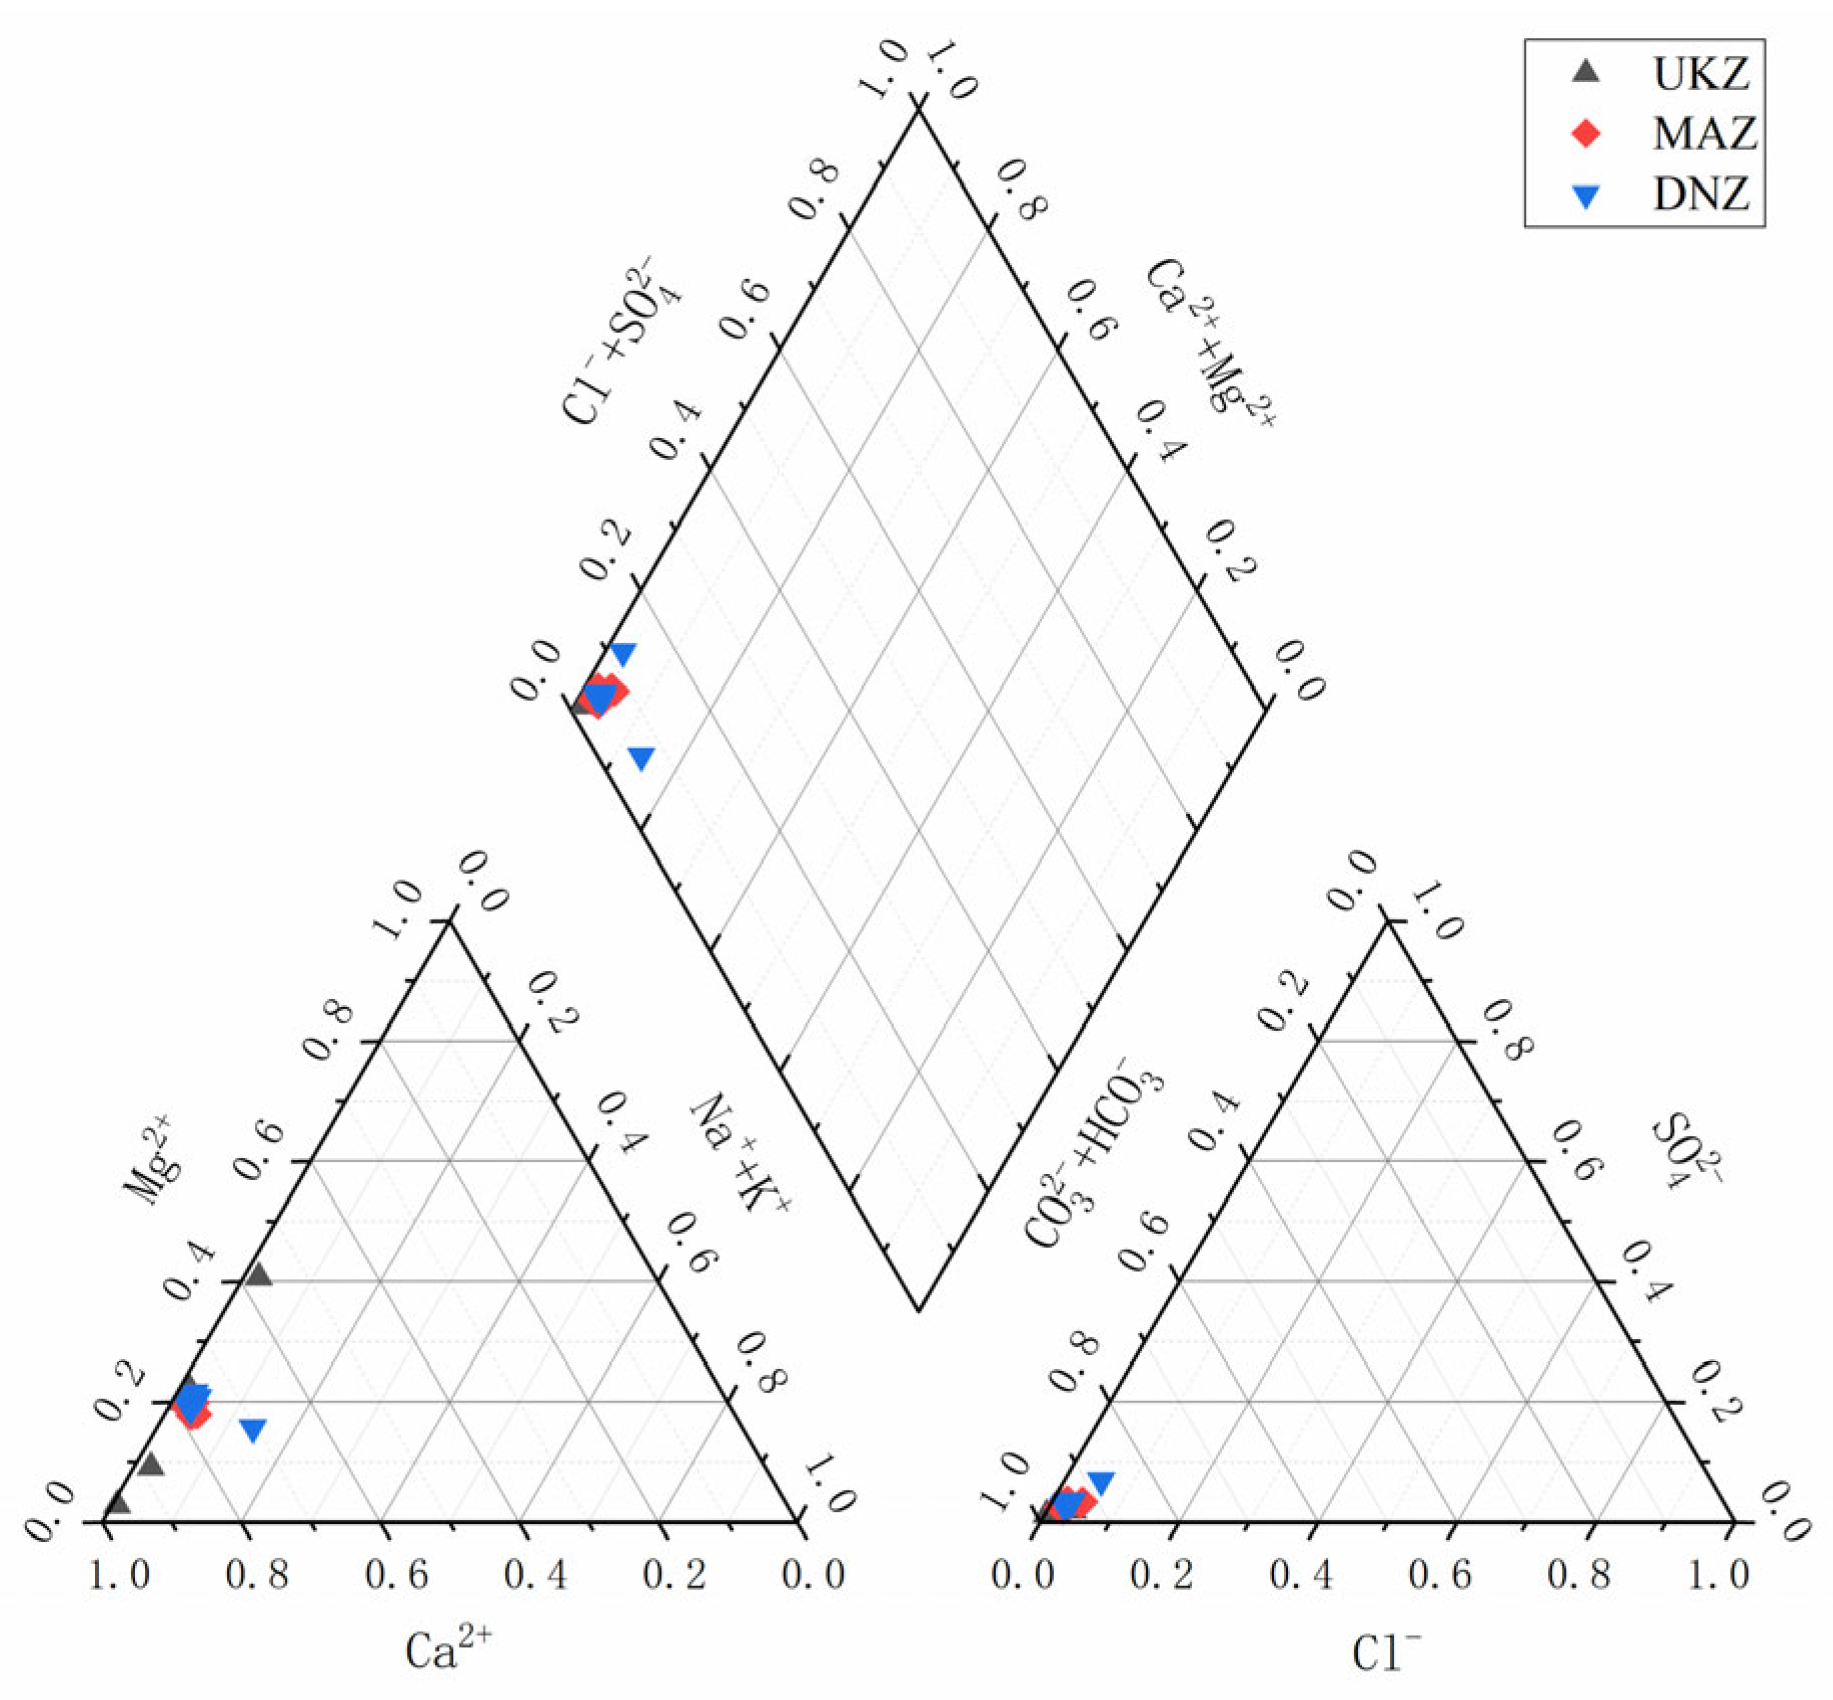
4.2. Hydrochemical Type
4.3. Regulatory Role of Hydrochemistry
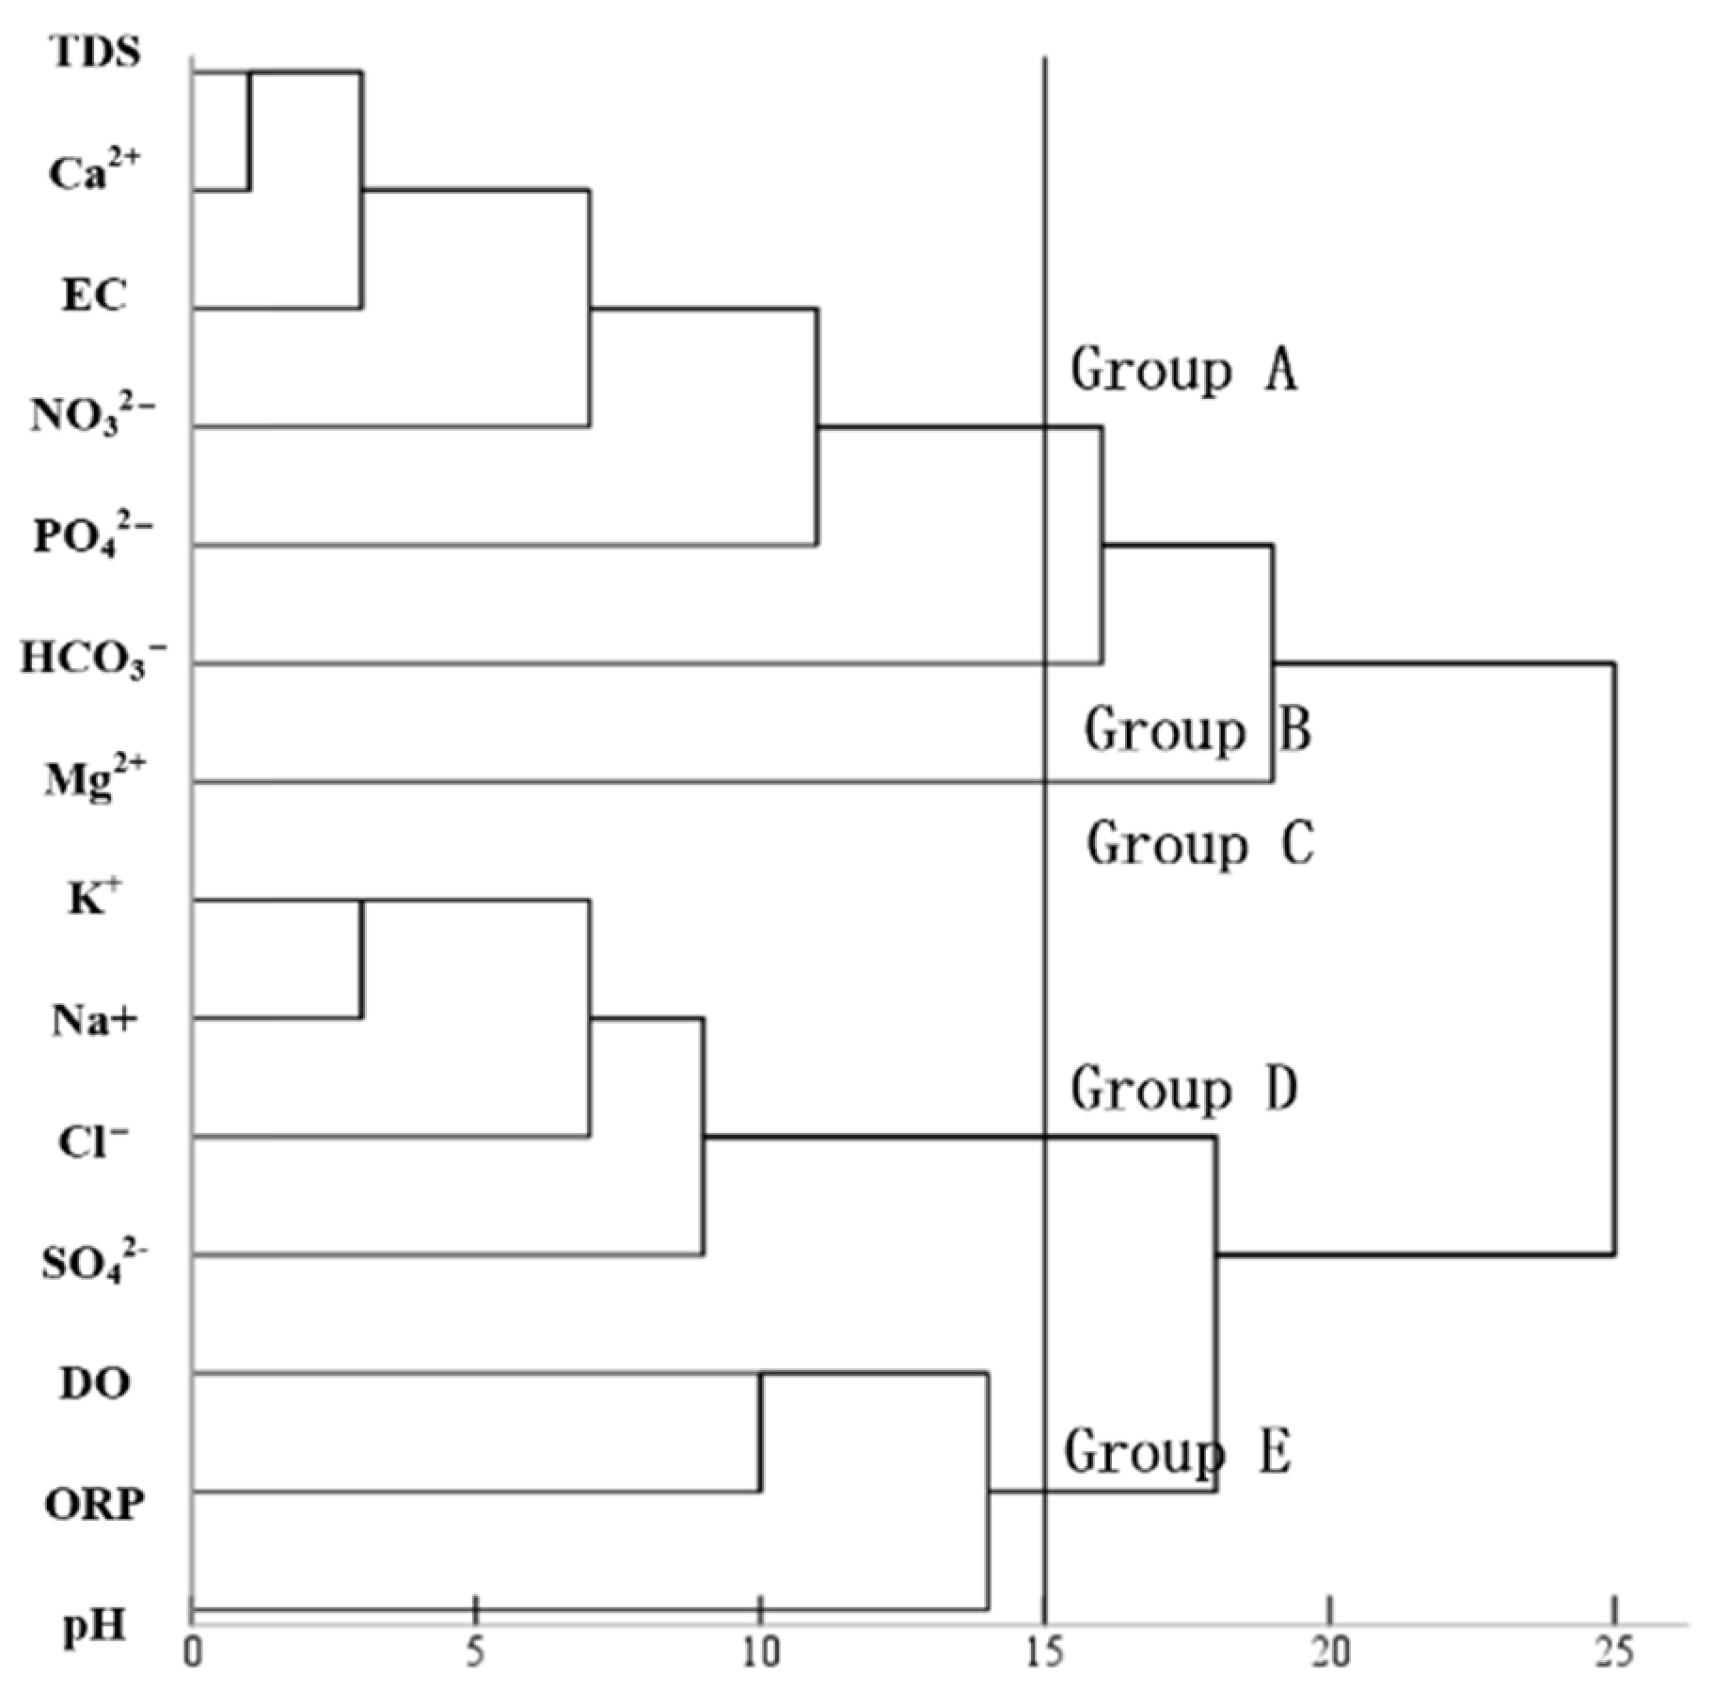
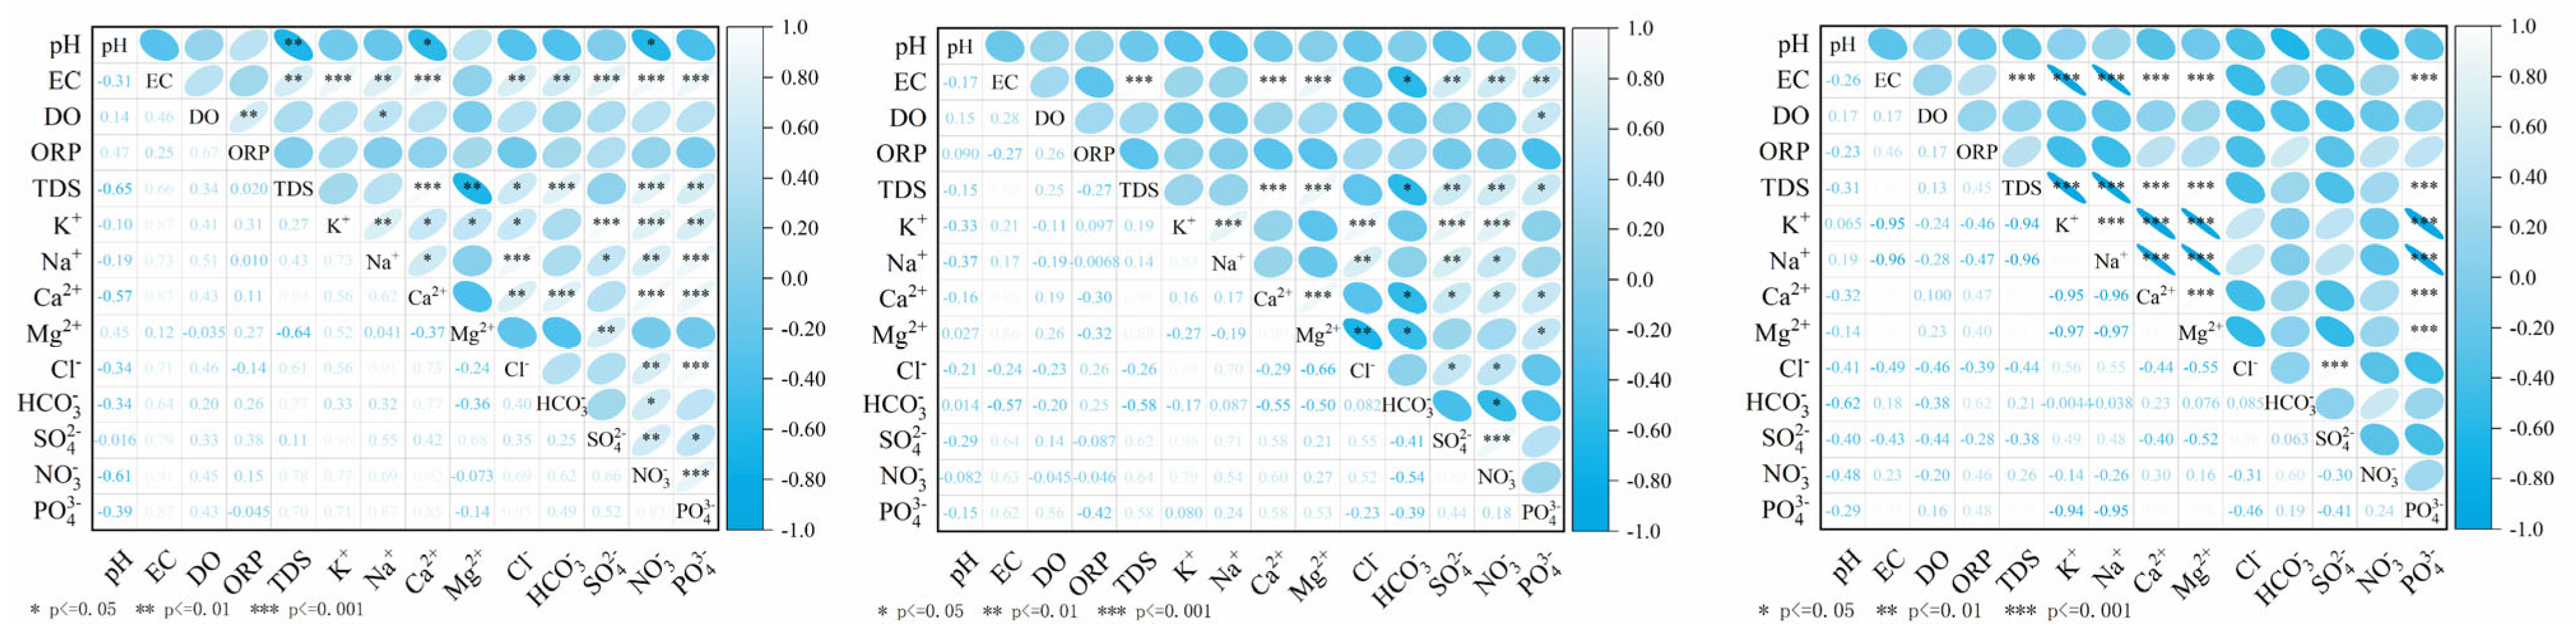
4.3.1. Hierarchical Clustering and Correlation Analysis
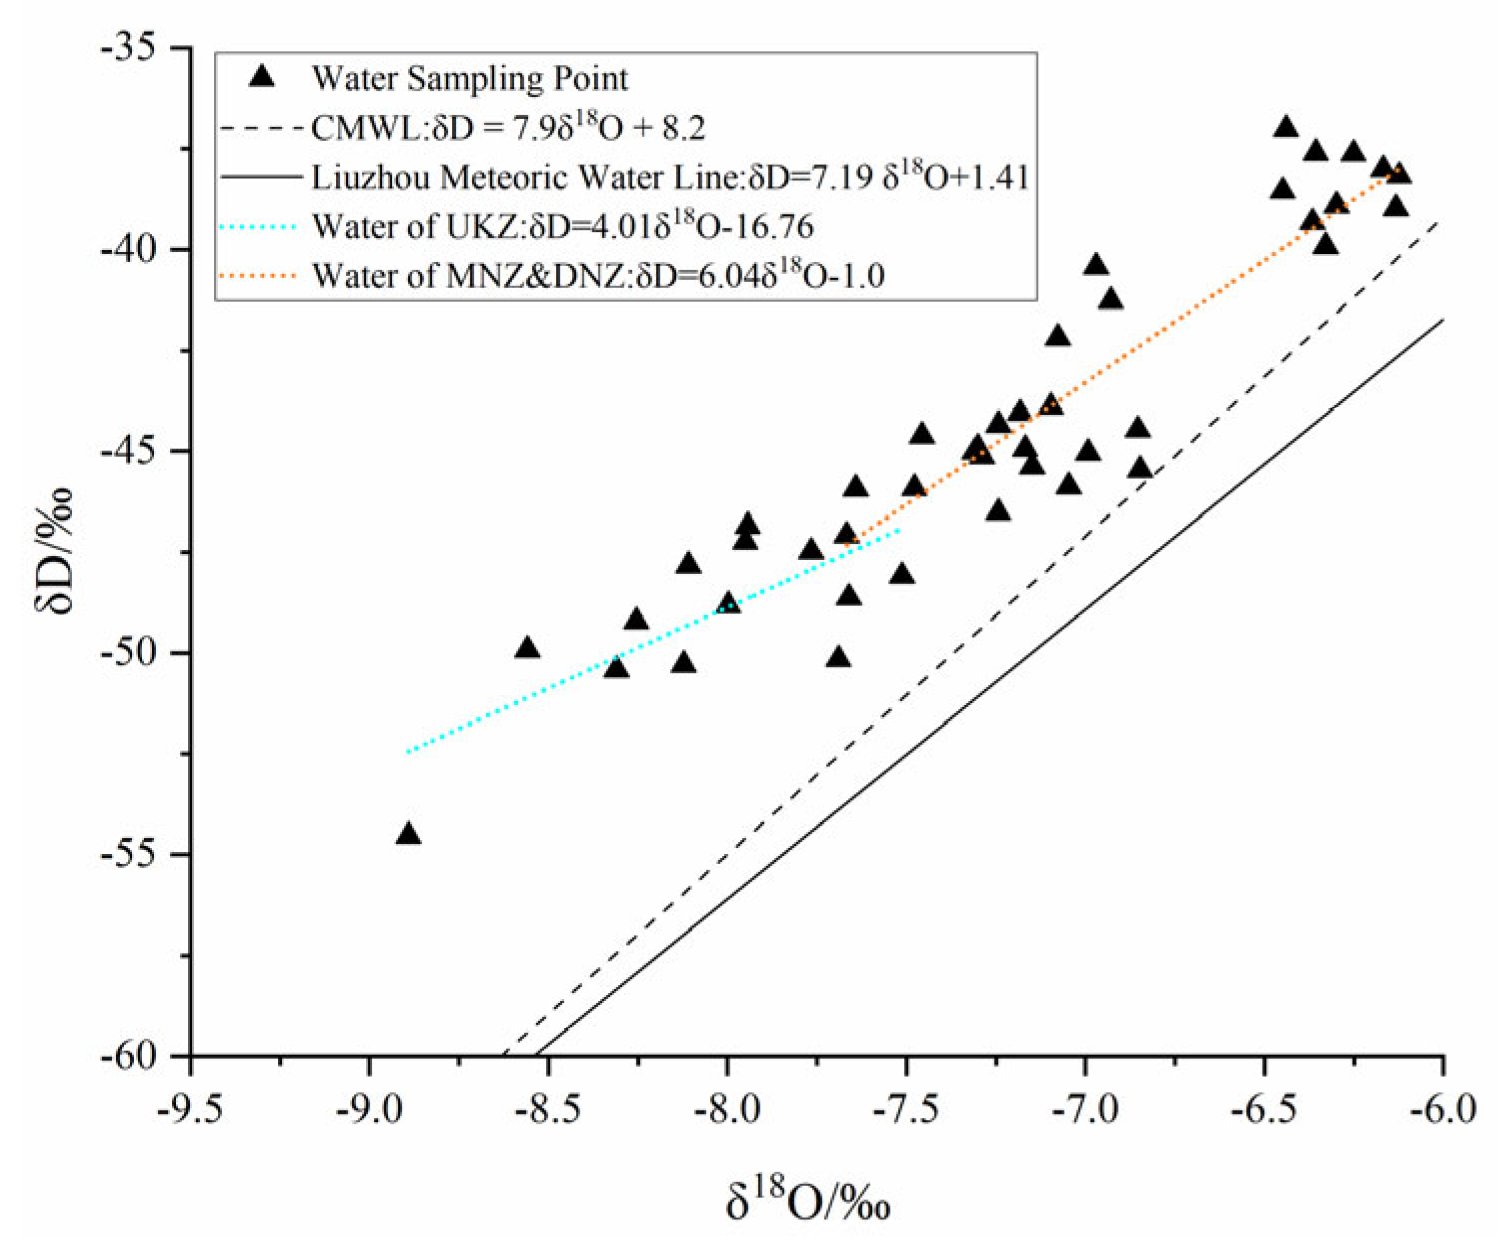
4.3.2. Isotopic Characteristics
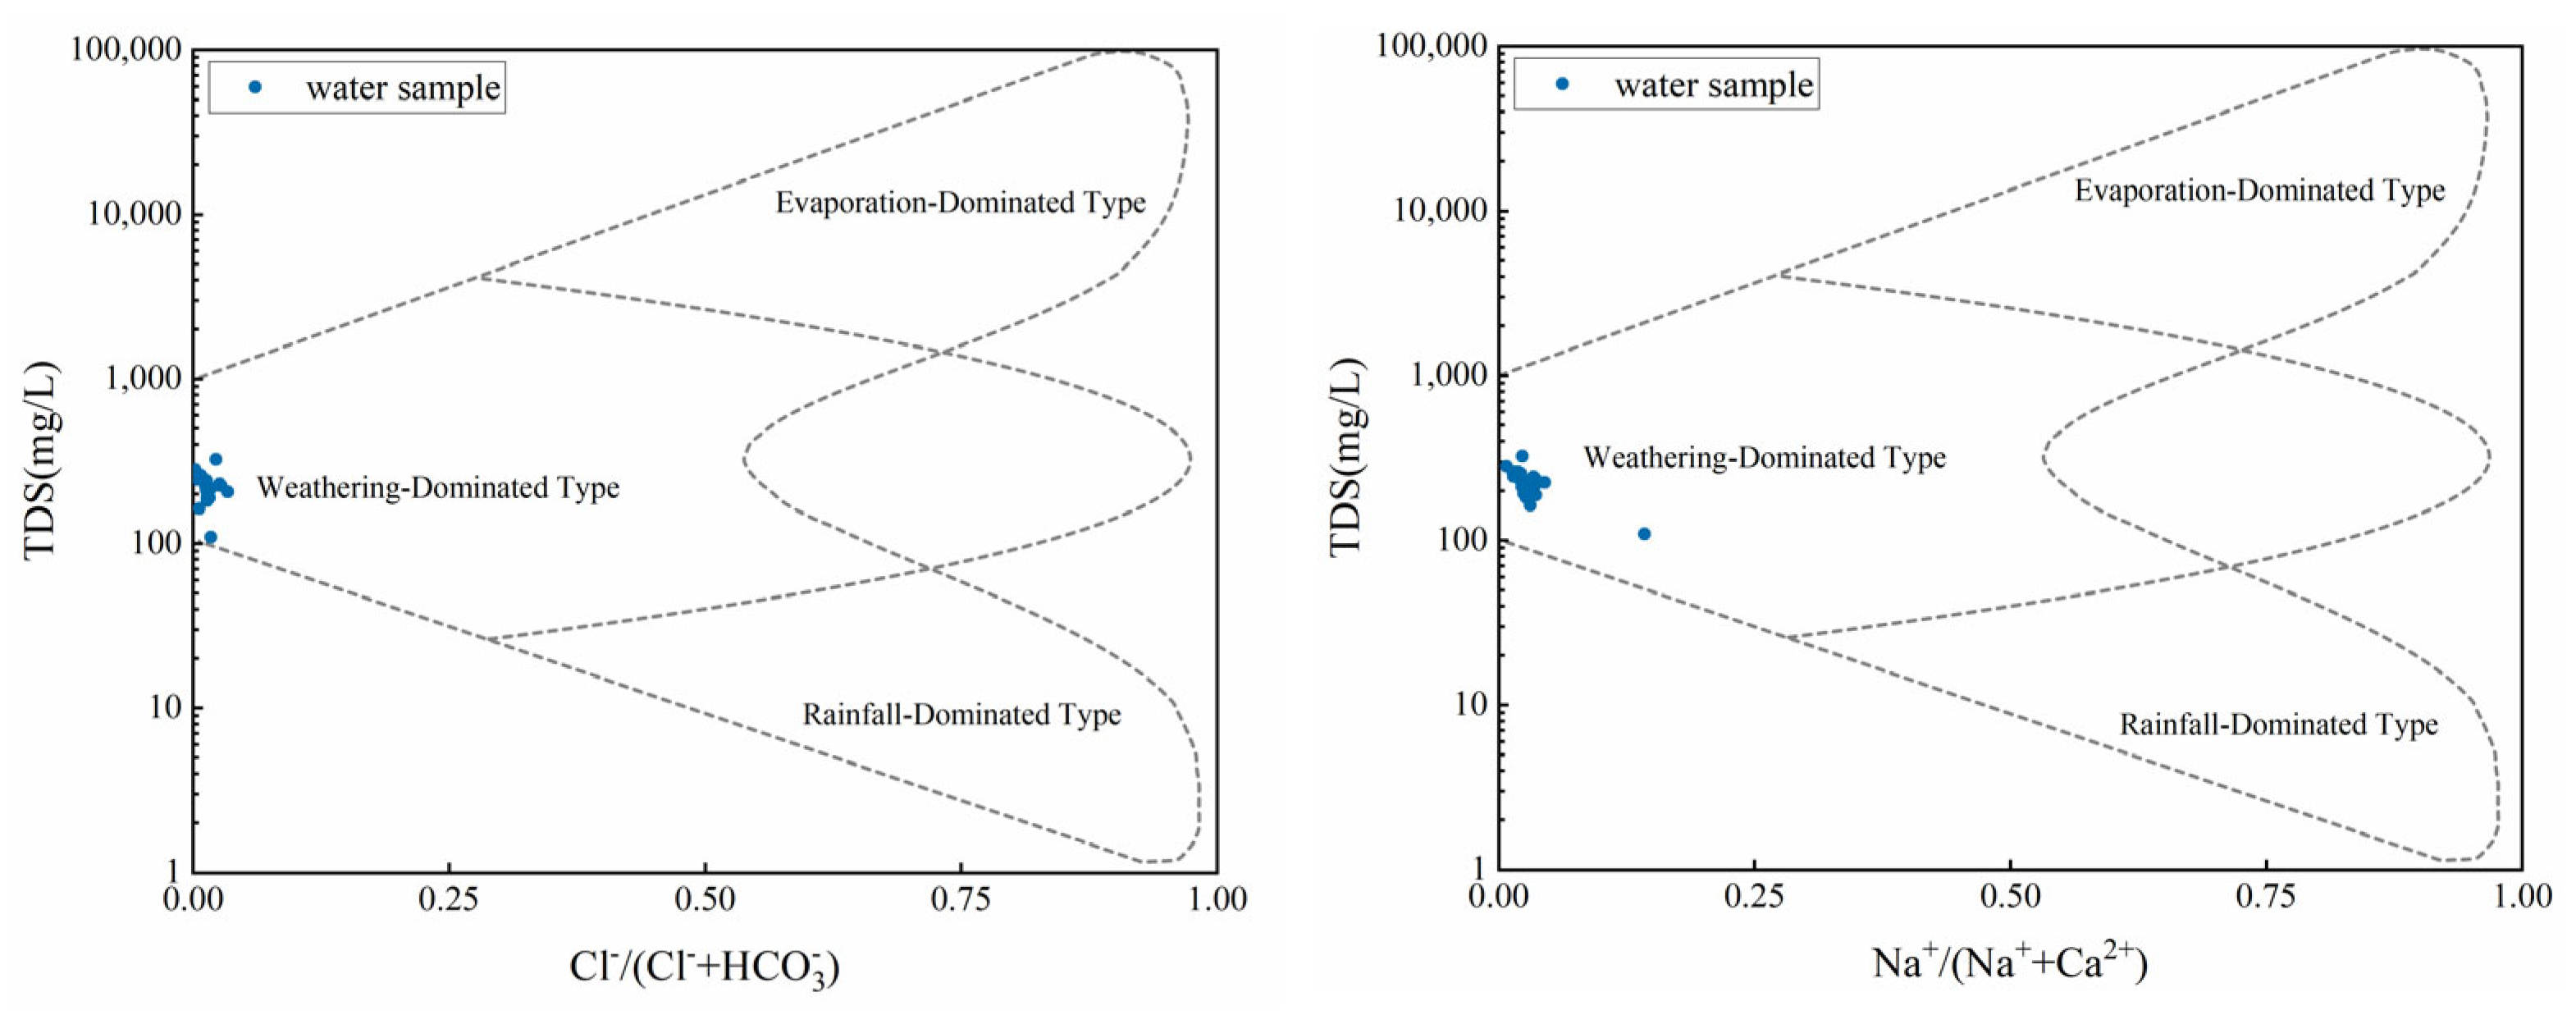
4.4. Hydrochemical Control Mechanism
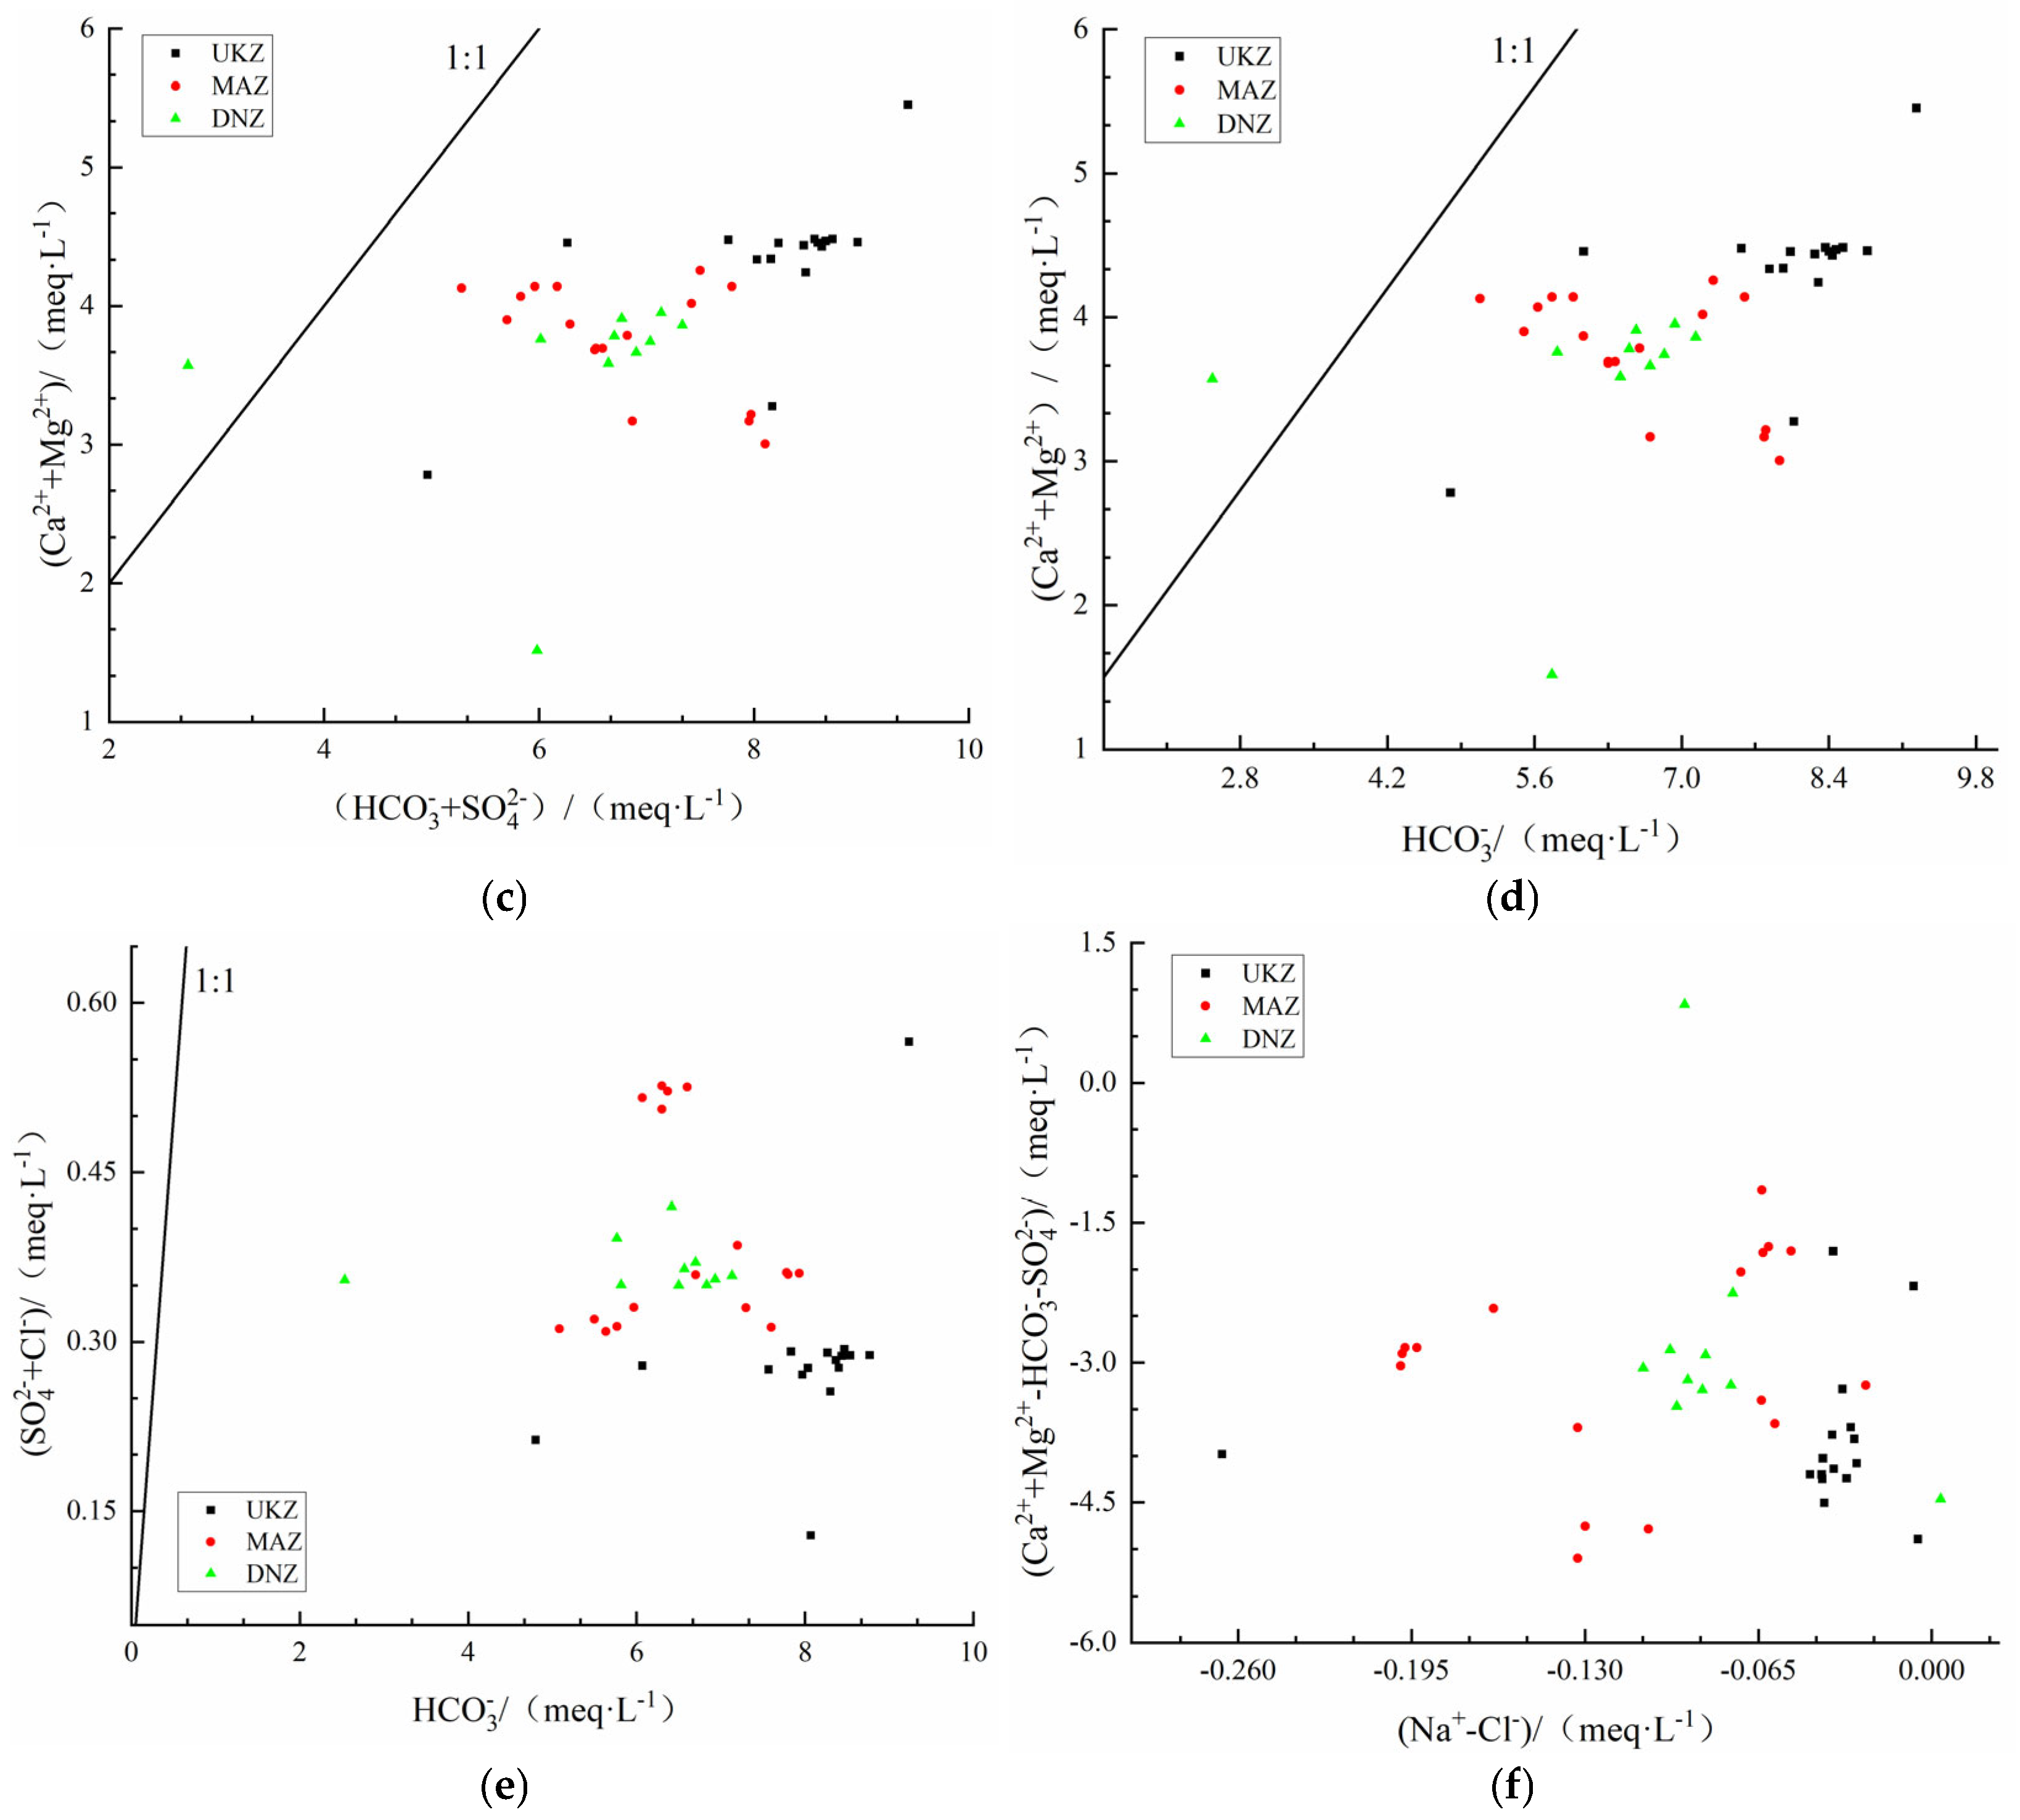
4.4.1. Hydrochemical Genesis
4.4.2. Ion Exchange Mechanism
4.4.3. Interaction Between Surface Water and Groundwater
4.5. Human Inputs
4.6. Water Quality Assessment
5. Conclusions
- Hydrochemical Characteristics: Predominantly, the water found in the Zhongdu River basin displays a weakly alkaline nature, with the pH scale varying between 6.46 and 8.28. The highest values of EC and TDS were observed in the upper reaches, followed by the lower ones, while the lowest values were found in the middle reaches. Despite these variations, all regions fell under the category of freshwater. High DO levels were present, which promoted active biological processes, while the ORP indicated a potential reducing capability in the upstream groundwater and an oxidation capability in the downstream surface water. The TDS-TH diagrams validated the soft, fresh nature of the water, showing no signs of salinity or hardness, thus suggesting a minimal level of pollution.
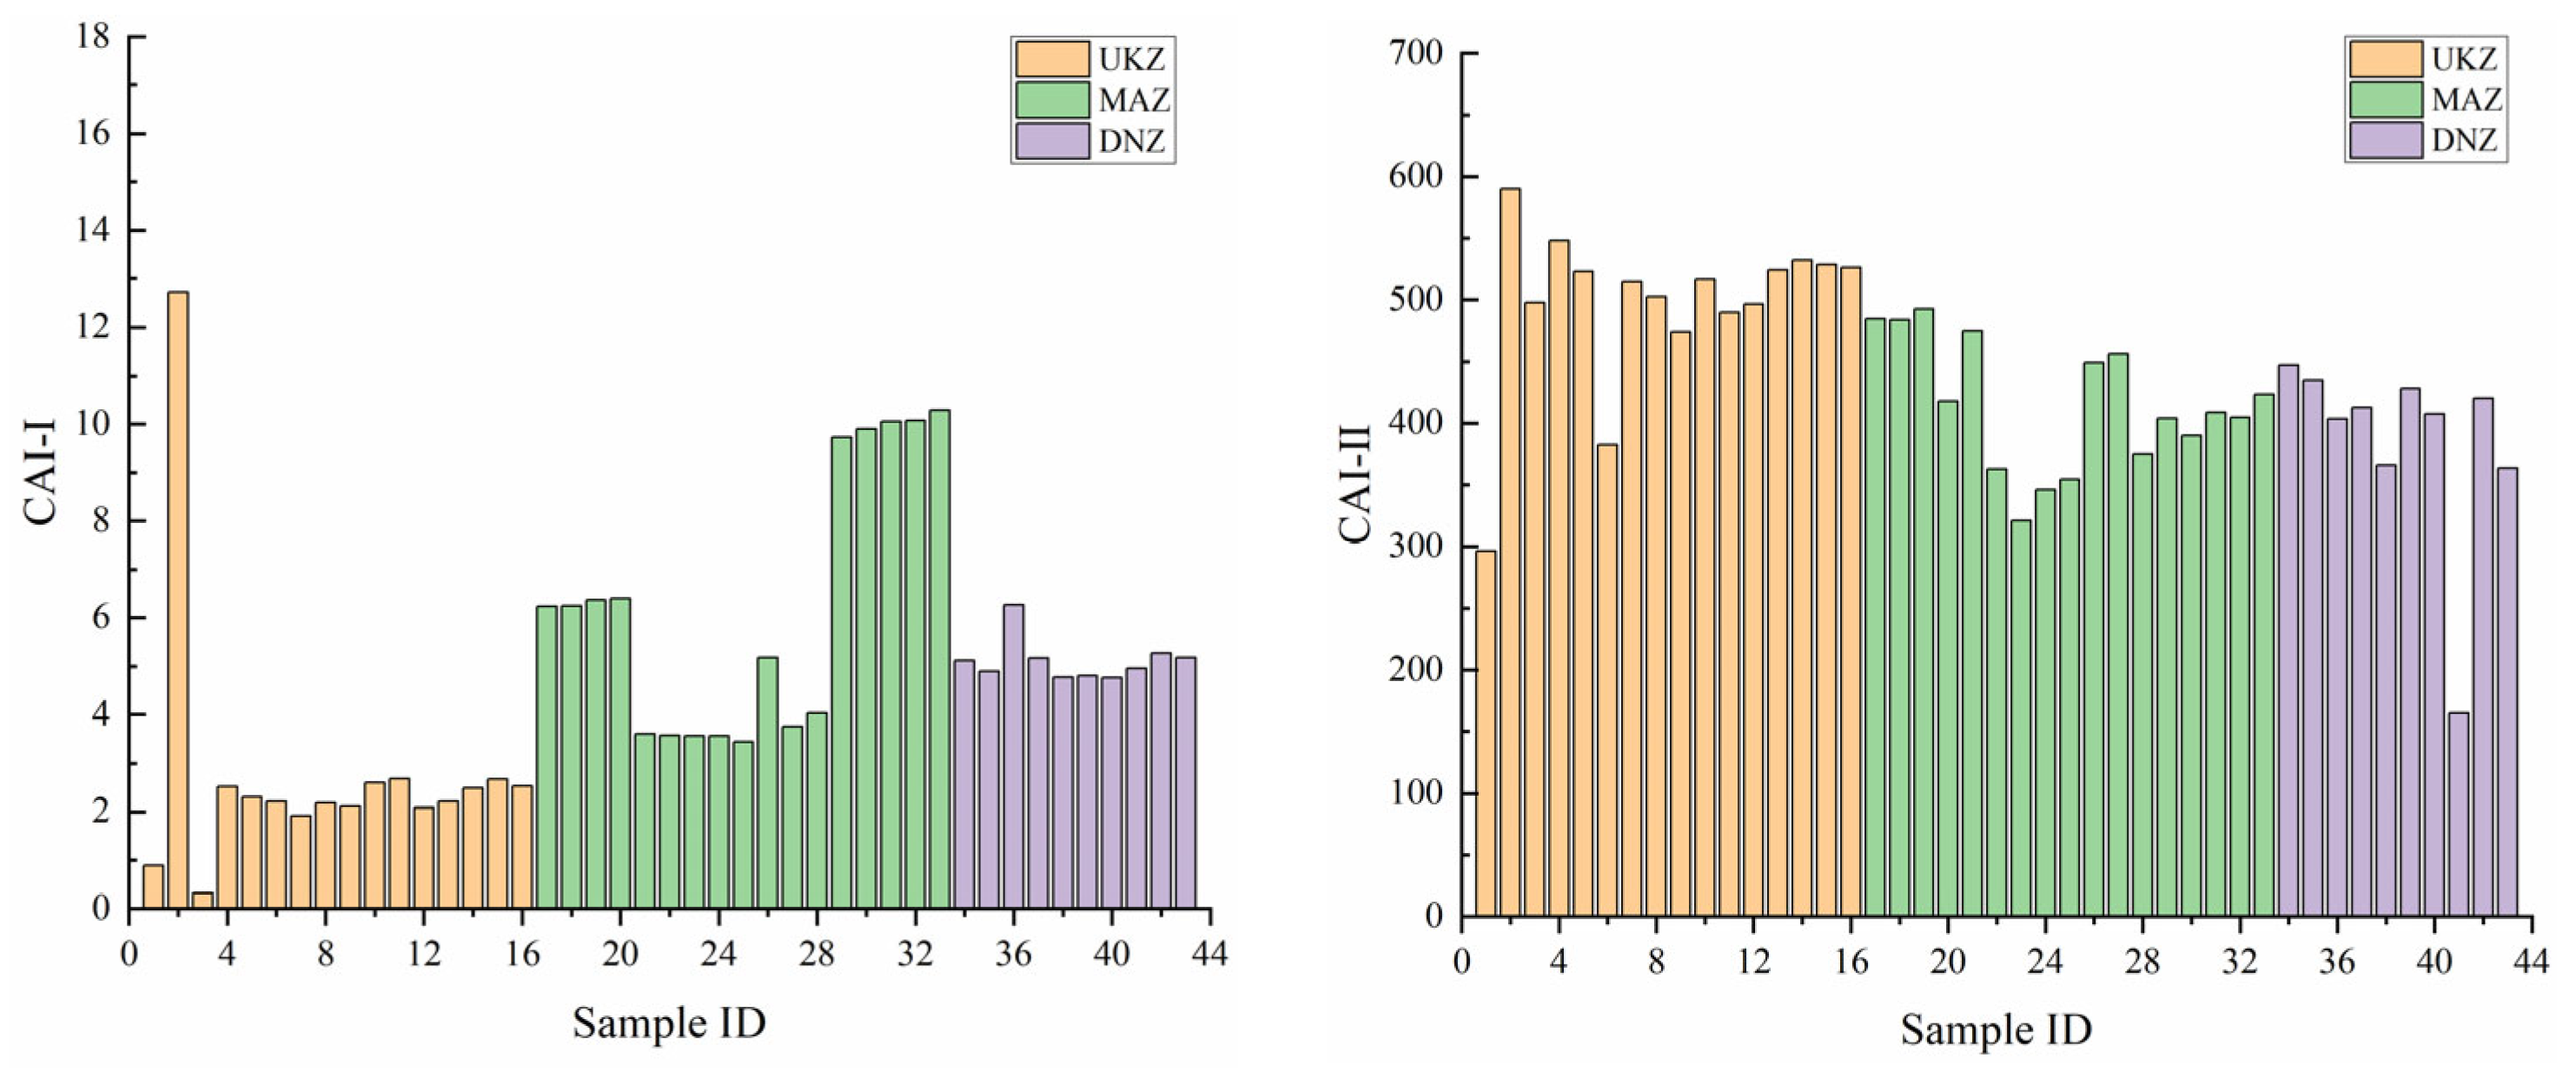
- Hydrochemical Types and Controlling Factors: The hydrochemical type that prevailed was HCO3⁻–Ca2⁺, consisting mainly of ions Ca2⁺ and HCO3⁻. The principal component analysis highlighted the significant part played by HCO3⁻ in defining hydrochemical characteristics of the basin. The primary water source was atmospheric precipitation, while surface water in the middle and lower reaches was considerably influenced by evaporation and stronger rock–water interactions relative to deep groundwater. The primary factor influencing hydrochemistry was rock weathering, as opposed to atmospheric precipitation or evaporative crystallization. The SI analysis indicated that the majority of minerals, particularly carbonates and sulfates, were in a dissolved state. Ion ratio analysis and the CAI reveal varying degrees of cation exchange, influenced by both geological conditions and human activities.
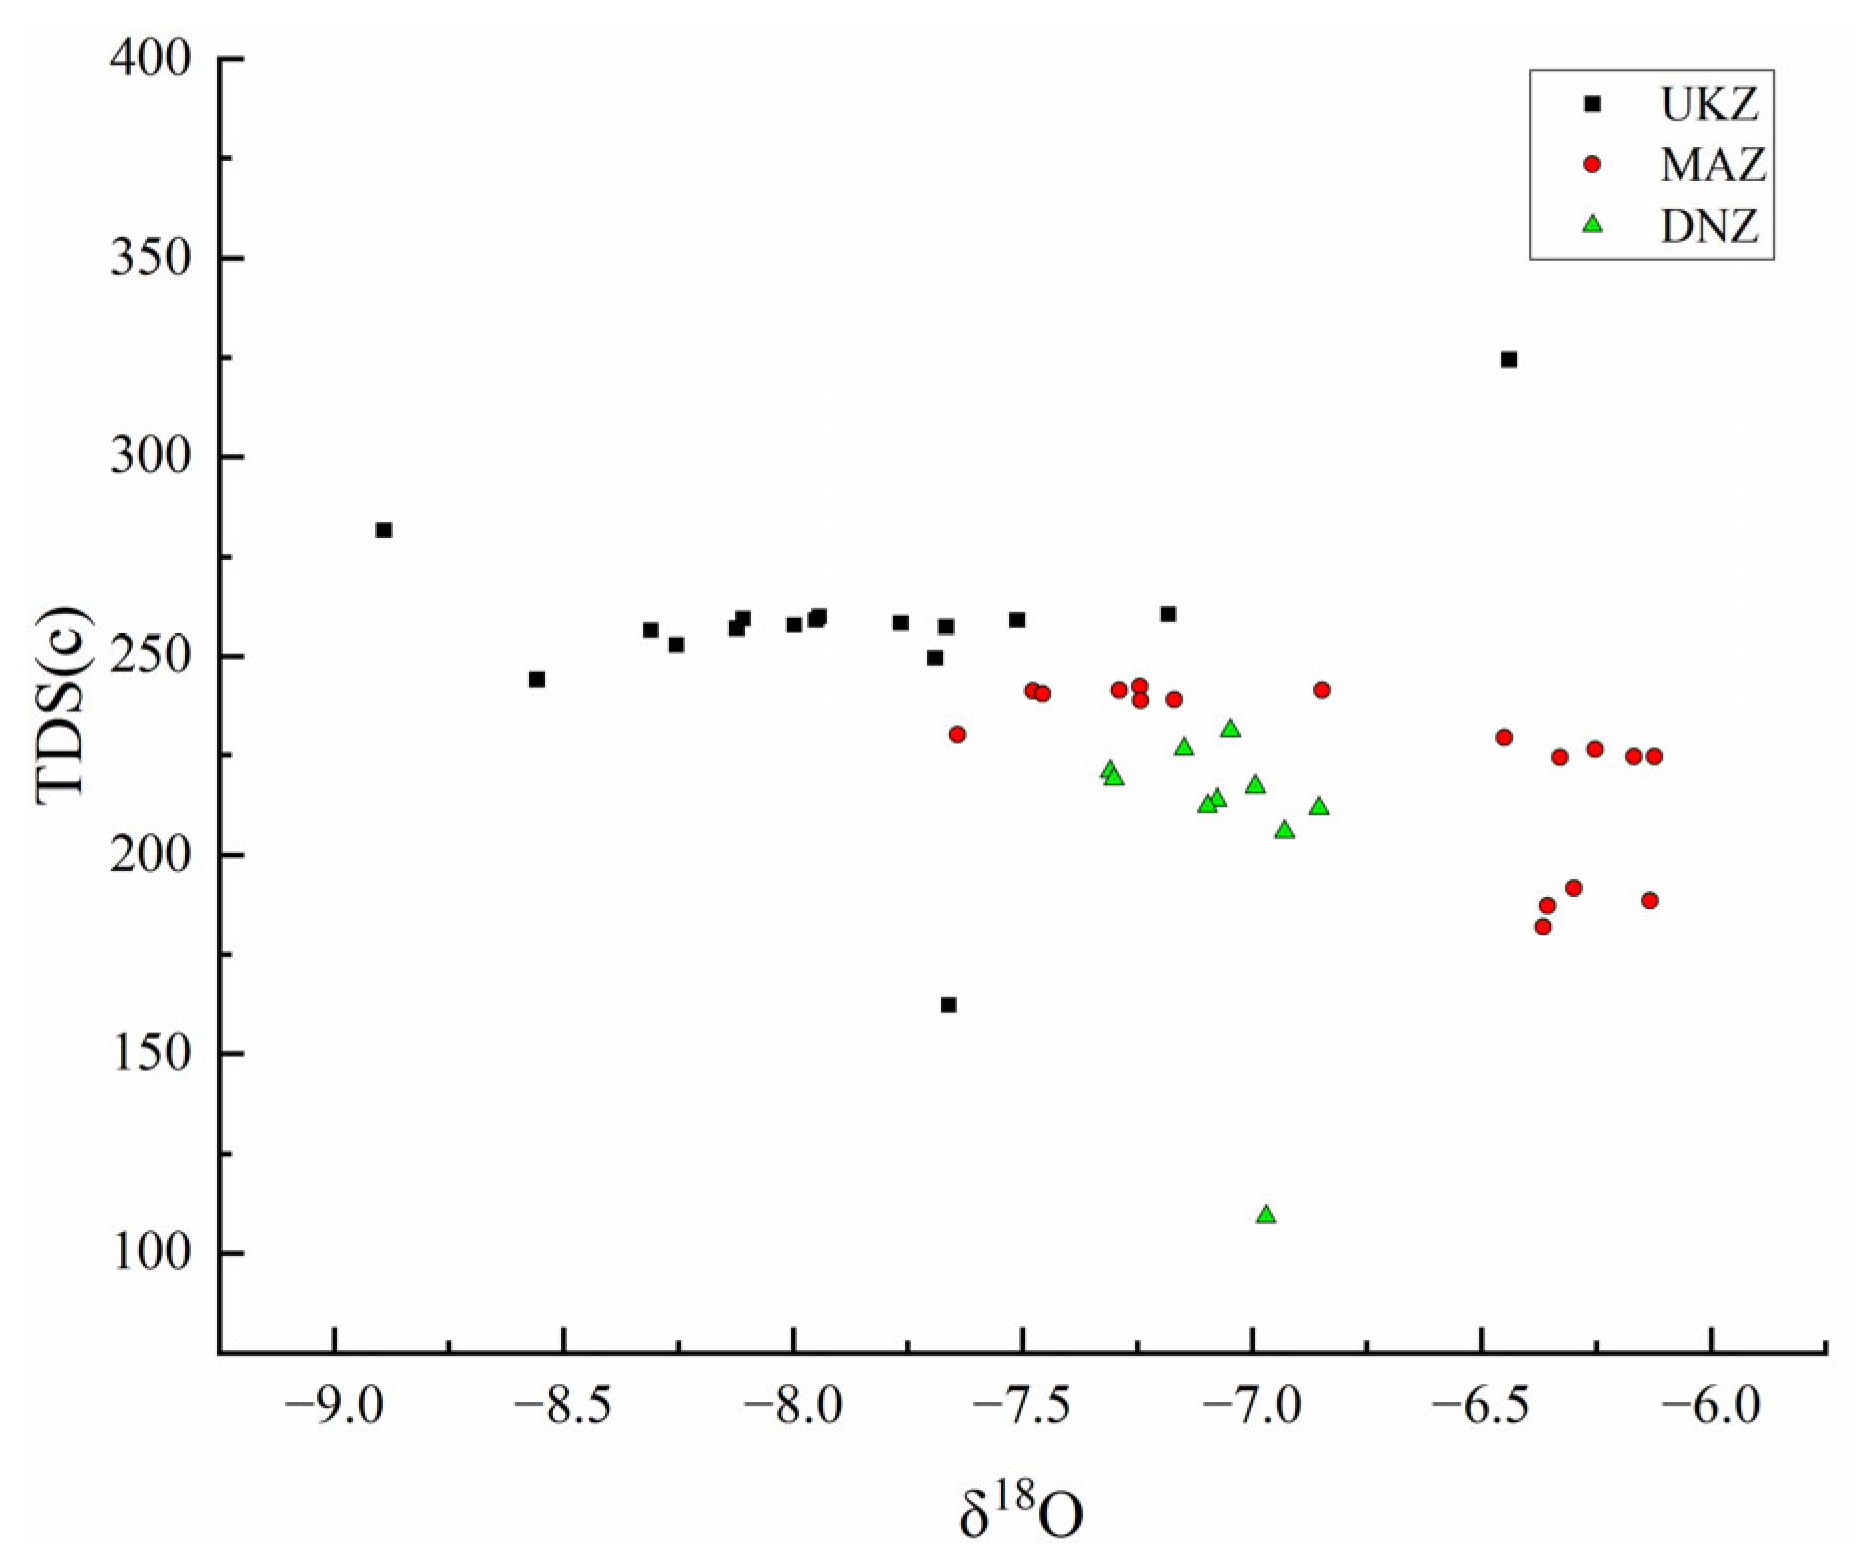
- Water Quality and Human Inputs: A TDS-δ18O examination revealed a progressive δ18O rise from upstream to downstream, which implied a significant hydrological interaction between underground and surface waters. The effects of human activities, particularly farming, were evident, even though pollution from residential areas was relatively low. Denitrification processes in water serve to reduce the risks of eutrophication. The EWQI, determined by 11 parameters, rates the overall water quality as Grade I, meeting drinking water standards. This indicates that the current state of water is predominantly good and fit for drinking and various other purposes.
- Spatial Structure Characteristics of Anthropogenic Factors: Upstream samples (UKZ) showed minimal NO3⁻ (1.78−13.97 mg/L) and stable Cl⁻/Na⁺ ratios (1.8 ± 0.4), indicating limited human impact. Midstream (MAZ) exhibited elevated NO3⁻ (4.41–9.48 mg/L; ZW02 = 13.97 mg/L) and Cl⁻/Na⁺ variance (0.99 CV), correlating with fertilizer application and village wastewater inputs. Downstream (DNZ) showed partial recovery (NO3⁻ = 5.52–6.82 mg/L), likely due to dilution and denitrification in hyporheic zones.
Author Contributions
Funding
Data Availability Statement
Acknowledgments
Conflicts of Interest
References
- Hartmann, A.; Goldscheider, N.; Wagener, T.; Lange, J.; Weiler, M. Karst water resources in a changing world: Review of hydrological modeling approaches. Rev. Geophys. 2014, 52, 218–242. [Google Scholar] [CrossRef]
- Xia, J.; Wang, J.; Zhang, L.; Wang, X.; Yuan, W.; Peng, T.; Zheng, L.; Tian, W.; Feng, X. Migration and transformation of soil mercury in a karst region of southwest China: Implications for groundwater contamination. Water Res. 2022, 226, 119271. [Google Scholar] [CrossRef] [PubMed]
- Lv, Y.; Jiang, J.; Chen, L.; Hu, W.; Jiang, Y. Elaborate simulation and predication of the tunnel drainage effect on karst groundwater field and discharge based on Visual MODFLOW. J. Hydrol. 2022, 612, 128023. [Google Scholar] [CrossRef]
- Li, J.; Yang, G.; Zhu, D.; Xie, H.; Zhao, Y.; Fan, L.; Zou, S. Hydrogeochemistry of karst groundwater for the environmental and health risk assessment: The case of the suburban area of Chongqing (Southwest China). Geochemistry 2022, 82, 125866. [Google Scholar] [CrossRef]
- Zhu, H.; Zhou, J.; Liu, Z.; Yang, L.; Liu, Y. Hydrogeochemistry Evidence for Impacts of Chemical Acidic Wastewater on Karst Aquifer in Dawu Water Source Area, Northern China. Int. J. Environ. Res. Public Health 2021, 18, 8478. [Google Scholar] [CrossRef]
- Dvanajscak, D.; Ratej, J.; Jovicic, V. Sustainability of Water Resources in Karst Undermined by Tunneling: A Case Example. Sustainability 2022, 14, 732. [Google Scholar] [CrossRef]
- Peng, T.; Jin, Z.; Xiao, L. Assessing carrying capacity of regional water resources in karst areas, southwest China: A case study. Environ. Dev. Sustain. 2023, 25, 15139–15162. [Google Scholar] [CrossRef]
- Wang, W.; Li, Z.; Du, F.; Cao, Z.; Li, G. Study of Roof Water Inrush Control Technology and Water Resources Utilization During Coal Mining in a Karst Area. Mine Water Environ. 2023, 42, 546–559. [Google Scholar] [CrossRef]
- Zhang, C.; Xiao, Q.; Wu, Z.; Martin, K. Ecosystem-driven karst carbon cycle and carbon sink effects. J. Groundw. Sci. Eng. 2022, 10, 99–112. [Google Scholar] [CrossRef]
- He, J.; Liu, X.; Meng, W.; Chen, X. Recent advances in studies of soil organic carbon stability in Karst areas. Front. For. Glob. Change 2024, 7, 1453615. [Google Scholar] [CrossRef]
- Jiang, Z.; Lian, Y.; Qin, X. Rocky desertification in Southwest China: Impacts, causes, and restoration. Earth-Sci. Rev. 2014, 132, 1–12. [Google Scholar] [CrossRef]
- Qin, C.; Li, S.-L.; Yu, G.-H.; Bass, A.M.; Yue, F.-J.; Xu, S. Vertical variations of soil carbon under different land uses in a karst critical zone observatory (CZO), SW China. Geoderma 2022, 412, 115741. [Google Scholar] [CrossRef]
- Zhang, J.; Wang, S.; Fu, Z.; Chen, H.; Wang, K. Soil thickness controls the rainfall-runoff relationship at the karst hillslope critical zone in southwest China. J. Hydrol. 2022, 609, 127779. [Google Scholar] [CrossRef]
- Zhang, J.; Chen, H.; Fu, Z.; Wang, F.; Wang, K. Towards hydrological connectivity in the karst hillslope critical zone: Insight from using water isotope signals. J. Hydrol. 2023, 617, 128926. [Google Scholar] [CrossRef]
- Liu, N.; Pei, J.; Cao, C.; Liu, X.; Huang, Y.; Mei, G. Geological investigation and treatment measures against water inrush hazard in karst tunnels: A case study in Guiyang, southwest China. Tunn. Undergr. Space Technol. 2022, 124, 104491. [Google Scholar] [CrossRef]
- Strokova, L.A.; Nechaev, D.A. Role of Hazardous Geological Processes in Operation of the Chayanda-Espo Oil Pipeline. Bull. Tomsk Polytech. Univ.-Geo Assets Eng. 2022, 333, 86–98. [Google Scholar] [CrossRef]
- Chen, L.-L.; Wang, Z.-F.; Zhang, W.; Wang, Y.-Q. Characteristics, numerical analysis and countermeasures of mud inrush geohazards of Mountain tunnel in karst region. Geomat. Nat. Hazards Risk 2023, 14, 2242691. [Google Scholar] [CrossRef]
- Deng, X.; Xiong, K.; Yu, Y.; Zhang, S.; Kong, L.; Zhang, Y. A Review of Ecosystem Service Trade-Offs/Synergies: Enlightenment for the Optimization of Forest Ecosystem Functions in Karst Desertification Control. Forests 2023, 14, 88. [Google Scholar] [CrossRef]
- Guo, B.; Yang, F.; Fan, Y.; Zang, W. The dominant driving factors of rocky desertification and their variations in typical mountainous karst areas of southwest China in the context of global change. Catena 2023, 220, 106674. [Google Scholar] [CrossRef]
- Tang, X.; Xiao, J.; Ma, M.; Yang, H.; Li, X.; Ding, Z.; Yu, P.; Zhang, Y.; Wu, C.; Huang, J.; et al. Satellite evidence for China’s leading role in restoring vegetation productivity over global karst ecosystems. For. Ecol. Manag. 2022, 507, 120000. [Google Scholar] [CrossRef]
- Li, L.; Xu, E. Scenario analysis and relative importance indicators for combined impact of climate and land-use change on annual ecosystem services in the Karst mountainous region. Ecol. Indic. 2023, 147, 109991. [Google Scholar] [CrossRef]
- Zhang, J.; Liesch, T.; Chen, Z.; Goldscheider, N. Global analysis of land-use changes in karst areas and the implications for water resources. Hydrogeol. J. 2023, 31, 1197–1208. [Google Scholar] [CrossRef]
- Mo, C.; Bao, M.; Lai, S.; Deng, J.; Tang, P.; Xing, Z.; Tang, G.; Li, L. Impact of Future Climate and Land Use Changes on Runoff in a Typical Karst Basin, Southwest China. Water 2023, 15, 2240. [Google Scholar] [CrossRef]
- Chen, S.; Xiong, L.; Zeng, L.; Kim, J.-S.; Zhang, Q.; Jiang, C. Distributed rainfall-runoff simulation for a large-scale karst catchment by incorporating landform and topography into the DDRM model parameters. J. Hydrol. 2022, 610, 127853. [Google Scholar] [CrossRef]
- Medici, G.; West, L.J. Review of groundwater flow and contaminant transport modelling approaches for the Sherwood Sandstone aquifer, UK; insights from analogous successions worldwide. Q. J. Eng. Geol. Hydrogeol. 2022, 55, qjegh2021-176. [Google Scholar] [CrossRef]
- Tan, Y.; Dong, N.; Hou, A.; Yan, W. An Improved Xin’anjiang Hydrological Model for Flood Simulation Coupling Snowmelt Runoff Module in Northwestern China. Water 2023, 15, 3401. [Google Scholar] [CrossRef]
- Banusch, S.; Somogyvari, M.; Sauter, M.; Renard, P.; Engelhardt, I. Stochastic Modeling Approach to Identify Uncertainties of Karst Conduit Networks in Carbonate Aquifers. Water Resour. Res. 2022, 58, e2021WR031710. [Google Scholar] [CrossRef]
- Jabrane, O.; Martinez-Pagan, P.; Martinez-Segura, M.A.; Alcala, F.J.; El Azzab, D.; Vasconez-Maza, M.D.; Charroud, M. Integration of Electrical Resistivity Tomography and Seismic Refraction Tomography to Investigate Subsiding Sinkholes in Karst Areas. Water 2023, 15, 2192. [Google Scholar] [CrossRef]
- Zhang, Z.; Li, H.; Yan, Z.; Jing, J.; Gu, H. Deep carbonate fault-karst reservoir characterization by multi-task learning. Geophys. Prospect. 2024, 72, 1092–1106. [Google Scholar] [CrossRef]
- Chen, L.; Liu, X.; Zhou, H.; Zhang, H.; Lyu, F.; Mo, Q. Identification of Carbonate Cave Reservoirs Based on Variational Bayesian Principal Component Analysis. IEEE Trans. Geosci. Remote Sens. 2023, 61, 5922910. [Google Scholar] [CrossRef]
- Mo, C.; Lai, S.; Yang, Q.; Huang, K.; Lei, X.; Yang, L.; Yan, Z.; Jiang, C. A comprehensive assessment of runoff dynamics in response to climate change and human activities in a typical karst watershed, southwest China. J. Environ. Manag. 2023, 332, 117380. [Google Scholar] [CrossRef] [PubMed]
- Dar, T.; Rai, N.; Kumar, S. Distinguishing Mountain Front and Mountain Block Recharge in an Intermontane Basin of the Himalayan Region. Groundwater 2022, 60, 488–495. [Google Scholar] [CrossRef] [PubMed]
- Yan, H.; Liang, Y.; Lu, X.; Zhao, T.; Wu, S.; Xu, P.; Zeng, J. Assessing spatiotemporal dynamics of water use efficiency in ecologically vulnerable karst landscapes. J. Hydrol. Reg. Stud. 2024, 55, 101916. [Google Scholar] [CrossRef]
- Chen, W.; Bai, S.; Zhao, H.; Han, X.; Li, L. Spatiotemporal analysis and potential impact factors of vegetation variation in the karst region of Southwest China. Environ. Sci. Pollut. Res. 2021, 28, 61258–61273. [Google Scholar] [CrossRef]
- Zhou, B.; Wang, H.; Zhang, Q. Assessment of the Evolution of Groundwater Chemistry and Its Controlling Factors in the Huangshui River Basin of Northwestern China, Using Hydrochemistry and Multivariate Statistical Techniques. Int. J. Environ. Res. Public Health 2021, 18, 7551. [Google Scholar] [CrossRef]
- Nica-Badea, D.; Tataru, T. Water Quality and Spatial Assessment of Physicochemical Parameters. Pharmacophore 2023, 14, 40–47. [Google Scholar] [CrossRef]
- Misman, N.A.; Sharif, M.F.; Chowdhury, A.J.K.; Azizan, N.H. Water pollution and the assessment of water quality parameters: A review. Desalination Water Treat. 2023, 294, 79–88. [Google Scholar] [CrossRef]
- Yin, Z.; Lin, Q.; Xu, S. Using hydrochemical signatures to characterize the long-period evolution of groundwater information in the Dagu River Basin, China. Front. Environ. Sci. Eng. 2021, 15, 105. [Google Scholar] [CrossRef]
- Zainudin, A.M.; Isa, N.M.; Husin, N.H.; Looi, L.J.; Aris, A.Z.; Sefie, A.; Idris, A.N. Groundwater potability assessment through integration of pollution index of groundwater (PIG) and groundwater quality index (GWQI) in Linggi River Basin, Negeri Sembilan, Malaysia. Groundw. Sustain. Dev. 2024, 26, 101225. [Google Scholar] [CrossRef]
- Zhu, M.; Xie, Y.; Su, J.; Lu, S. Assessment of groundwater quality of unconfined aquifers in an urbanized area using the water quality index method. Environ. Sci. Pollut. Res. Int. 2024, 31, 64870–64883. [Google Scholar] [CrossRef]
- Hamma, B.; Alodah, A.; Bouaicha, F.; Bekkouche, M.F.; Barkat, A.; Hussein, E.E. Hydrochemical assessment of groundwater using multivariate statistical methods and water quality indices (WQIs). Appl. Water Sci. 2024, 14, 33. [Google Scholar] [CrossRef]
- Su, C.; Zhang, X.; Sun, Y.; Meng, S.; Cui, X.; Fei, Y. Hydrochemical characteristics and evolution processes of karst groundwater in Pingyin karst groundwater system, North China. Environ. Earth Sci. 2023, 82, 67. [Google Scholar] [CrossRef]
- Liu, F.; Qian, H.; Shi, Z.; Wang, H. Long-term monitoring of hydrochemical characteristics and nitrogen pollution in the groundwater of Yinchuan area, Yinchuan basin of northwest China. Environ. Earth Sci. 2019, 78, 700. [Google Scholar] [CrossRef]
- Bai, X.; Tian, X.; Li, J.; Wang, X.; Li, Y.; Zhou, Y. Assessment of the Hydrochemical Characteristics and Formation Mechanisms of Groundwater in A Typical Alluvial-Proluvial Plain in China: An Example from Western Yongqing County. Water 2022, 14, 2395. [Google Scholar] [CrossRef]
- Bo, Y.; Chen, Y.; Che, Q.; Shi, Y.; Zhang, Y. Multivariate Statistical Analysis of the Spatial Variability of Hydrochemical Evolution during Riverbank Infiltration. Water 2022, 14, 3800. [Google Scholar] [CrossRef]
- Zhong, C.; Wang, H.; Yang, Q. Hydrochemical interpretation of groundwater in Yinchuan basin using self-organizing maps and hierarchical clustering. Chemosphere 2022, 309, 136787. [Google Scholar] [CrossRef]
- Feng, Y.; Kang, F.; Guo, Y.; Li, Z.; Liu, B.; Bu, H.; Xia, C.; He, Q. Evolution of hydrochemistry and water quality of karst groundwater under the effects of intense anthropogenic activities. J. Environ. Manag. 2024, 371, 123059. [Google Scholar] [CrossRef]
- Swedberg, D.A.; Mollenhauer, R.; Brewer, S.K. The context dependency of fish-habitat associations in separated karst ecoregions. Ecol. Evol. 2023, 13, e10701. [Google Scholar] [CrossRef]
- Liu, Y.; Zhang, C.; Jiang, J.; Zhang, Y.; Wang, G.; Xu, L.; Qu, Z. Interaction between Groundwater and Surface Water in the Qujiang River Basin in China: Evidence from Chemical Isotope Measurements. Water 2023, 15, 3932. [Google Scholar] [CrossRef]
- Zhang, H.; Han, X.; Wang, G.; Zhou, L.; Huang, D.; Chen, X.; Zhang, F. Hydrogeochemical and isotopic evidences of the underlying produced water intrusion into shallow groundwater in an oil production area, Northwest China. Sci. Total Environ. 2024, 916, 170242. [Google Scholar] [CrossRef]
- Wang, M.; Yang, L.; Li, J.; Liang, Q. Hydrochemical Characteristics and Controlling Factors of Surface Water in Upper Nujiang River, Qinghai-Tibet Plateau. Minerals 2022, 12, 490. [Google Scholar] [CrossRef]
- Liu, X.; Xiang, W.; Song, J.; Si, B. Spatial variations in groundwater hydrochemistry, sources, and controls across catchments on Chinese Loess Plateau. J. Hydrol. Reg. Stud. 2024, 53, 101791. [Google Scholar] [CrossRef]
- Yuan, Z.; Jian, Y.; Chen, Z.; Jin, P.; Gao, S.; Wang, Q.; Ding, Z.; Wang, D.; Ma, Z. Distribution of Groundwater Hydrochemistry and Quality Assessment in Hutuo River Drinking Water Source Area of Shijiazhuang (North China Plain). Water 2024, 16, 175. [Google Scholar] [CrossRef]
- Gao, M.; Li, X.; Qian, J.; Wang, Z.; Hou, X.; Gui, C.; Bai, Z.; Fu, C.; Li, J.; Zuo, X. Hydrochemical Characteristics and Controlling Factors of Shallow and Deep Groundwater in the Heilongdong Spring Basin, Northern China. Sustainability 2023, 15, 15447. [Google Scholar] [CrossRef]
- Kammoun, A.; Abidi, M.; Zairi, M. Hydrochemical characteristics and groundwater quality assessment for irrigation and drinking purposes: A case of Enfidha aquifer system, Tunisia. Environ. Earth Sci. 2022, 81, 41. [Google Scholar] [CrossRef]
- Lu, T.; Li, R.; Ferrer, A.S.N.; Xiong, S.; Zou, P.; Peng, H. Hydrochemical characteristics and quality assessment of shallow groundwater in Yangtze River Delta of eastern China. Environ. Sci. Pollut. Res. 2022, 29, 57215–57231. [Google Scholar] [CrossRef]
- Chidiac, S.; El Najjar, P.; Ouaini, N.; El Rayess, Y.; El Azzi, D. A comprehensive review of water quality indices (WQIs): History, models, attempts and perspectives. Rev. Environ. Sci. Bio-Technol. 2023, 22, 349–395. [Google Scholar] [CrossRef]


| Cat. | Par. | pH | TH | EC | DO | ORP | TDSs | K+ | Na+ | Ca2+ | Mg2+ | Cl− | HCO32− | SO42− | NO32− | PO42− |
|---|---|---|---|---|---|---|---|---|---|---|---|---|---|---|---|---|
| U K Z | Max | 8.18 | 136.4 | 497.00 | 7.40 | 15.10 | 324.50 | 1.40 | 2.32 | 98.96 | 14.08 | 13.01 | 563.42 | 9.54 | 13.97 | 0.90 |
| Min | 6.46 | 69.6 | 248.30 | 4.16 | −39.50 | 162.30 | 0.10 | 0.49 | 32.53 | 1.16 | 0.95 | 292.90 | 4.89 | 1.78 | 0.40 | |
| Mean | 6.82 | 106.9 | 391.00 | 5.53 | −25.30 | 259.25 | 1.06 | 1.04 | 70.49 | 11.40 | 2.91 | 499.35 | 9.40 | 9.75 | 0.55 | |
| SD | 0.61 | 13.9 | 80.36 | 0.97 | 18.56 | 45.22 | 0.39 | 0.52 | 18.01 | 4.12 | 3.79 | 91.14 | 1.61 | 3.82 | 0.15 | |
| CV | 0.09 | 0.13 | 0.22 | 0.18 | −0.98 | 0.18 | 0.42 | 0.44 | 0.26 | 0.42 | 0.99 | 0.19 | 0.19 | 0.46 | 0.27 | |
| M N Z | Max | 8.06 | 106.5 | 404.30 | 6.45 | 244.60 | 260.50 | 1.61 | 2.40 | 71.53 | 11.50 | 5.86 | 520.70 | 10.57 | 9.48 | 0.80 |
| Min | 7.10 | 75.18 | 375.80 | 4.60 | 166.40 | 230.10 | 1.05 | 1.06 | 61.59 | 9.60 | 2.86 | 310.19 | 9.14 | 4.41 | 0.50 | |
| Mean | 7.57 | 93.78 | 392.00 | 5.62 | 188.95 | 251.15 | 1.12 | 1.21 | 68.39 | 11.13 | 3.39 | 469.85 | 9.43 | 8.07 | 0.57 | |
| SD | 0.23 | 9.76 | 7.36 | 0.52 | 22.99 | 9.73 | 0.15 | 0.44 | 3.02 | 0.63 | 0.83 | 76.44 | 0.33 | 1.45 | 0.09 | |
| CV | 0.03 | 0.10 | 0.02 | 0.09 | 0.12 | 0.04 | 0.13 | 0.32 | 0.04 | 0.06 | 0.22 | 0.17 | 0.04 | 0.19 | 0.15 | |
| D N Z | Max | 8.28 | 98.89 | 381.50 | 6.67 | 232.40 | 231.20 | 2.53 | 4.13 | 63.25 | 9.75 | 6.76 | 435.28 | 10.99 | 6.82 | 0.66 |
| Min | 7.60 | 37.99 | 188.80 | 4.80 | 162.60 | 109.20 | 1.25 | 1.40 | 24.87 | 3.37 | 5.30 | 154.58 | 9.56 | 5.52 | 0.36 | |
| Mean | 7.99 | 85.85 | 362.90 | 5.58 | 190.10 | 215.55 | 1.34 | 1.48 | 59.29 | 9.61 | 5.53 | 398.66 | 9.69 | 5.99 | 0.61 | |
| SD | 0.21 | 17.09 | 56.81 | 0.67 | 24.24 | 35.08 | 0.38 | 0.84 | 11.23 | 1.98 | 0.48 | 81.48 | 0.45 | 0.42 | 0.08 | |
| CV | 0.03 | 0.20 | 0.16 | 0.12 | 0.12 | 0.17 | 0.26 | 0.45 | 0.20 | 0.22 | 0.08 | 0.22 | 0.05 | 0.07 | 0.14 | |
| A L L | Max | 8.28 | 136.4 | 497.00 | 7.40 | 244.60 | 324.50 | 2.53 | 4.13 | 98.96 | 14.08 | 13.01 | 563.42 | 11.07 | 13.97 | 0.90 |
| Min | 6.46 | 37.99 | 188.80 | 4.16 | −39.50 | 109.20 | 0.10 | 0.49 | 24.87 | 1.16 | 0.95 | 154.58 | 4.89 | 1.78 | 0.36 | |
| Mean | 7.58 | 96.48 | 381.50 | 5.58 | 181.45 | 238.80 | 1.16 | 1.38 | 63.76 | 9.75 | 4.58 | 423.07 | 9.52 | 6.82 | 0.59 | |
| SD | 0.43 | 15.53 | 48.05 | 0.75 | 86.35 | 34.50 | 0.46 | 0.65 | 11.21 | 2.20 | 2.71 | 79.30 | 1.03 | 2.64 | 0.10 | |
| CV | 0.06 | 0.16 | 0.13 | 0.13 | 0.57 | 0.15 | 0.35 | 0.41 | 0.18 | 0.23 | 0.51 | 0.19 | 0.11 | 0.37 | 0.16 |
| Parameter | UKZ | Parameter | MAZ | Parameter | DNZ | ||||||
|---|---|---|---|---|---|---|---|---|---|---|---|
| PC1 | PC2 | PC3 | PC1 | PC2 | PC3 | PC1 | PC2 | PC3 | |||
| NO32− | 0.954 | −0.018 | −0.201 | EC | 0.949 | −0.256 | −0.09 | Mg2+ | 0.969 | −0.099 | 0.186 |
| EC | 0.951 | 0.202 | −0.13 | TDS | 0.941 | −0.271 | −0.142 | Na+ | −0.967 | 0.069 | −0.184 |
| Ca2+ | 0.938 | −0.291 | −0.076 | Ca2+ | 0.92 | −0.288 | −0.174 | K+ | −0.956 | 0.156 | −0.187 |
| PO42− | 0.936 | 0.012 | 0.161 | SO42− | 0.823 | 0.526 | 0.109 | Ca2+ | 0.953 | 0.089 | 0.281 |
| Cl− | 0.839 | −0.065 | 0.374 | NO32− | 0.783 | 0.466 | −0.235 | PO42− | 0.948 | 0.046 | 0.255 |
| Na+ | 0.82 | 0.227 | 0.343 | Mg2+ | 0.708 | −0.657 | −0.178 | Cl− | −0.689 | 0.162 | 0.689 |
| TDS | 0.787 | −0.584 | −0.055 | PO42− | 0.651 | −0.259 | 0.577 | HCO3− | 0.135 | 0.919 | 0.081 |
| K+ | 0.778 | 0.603 | −0.144 | HCO3− | −0.641 | 0.177 | 0.122 | NO3− | 0.34 | 0.787 | −0.342 |
| HCO3− | 0.664 | −0.352 | −0.238 | Cl− | 0.026 | 0.977 | 0.074 | SO42− | −0.645 | 0.148 | 0.724 |
| Mg2+ | −0.111 | 0.96 | −0.248 | K+ | 0.465 | 0.877 | 0.055 | Eigenvalue | 5.619 | 1.56 | 1.369 |
| SO42− | 0.632 | 0.712 | −0.282 | Na+ | 0.392 | 0.776 | 0.138 | Var% | 62.436 | 17.334 | 15.21 |
| pH | −0.464 | 0.55 | 0.449 | DO | 0.267 | −0.359 | 0.796 | CV | 62.436 | 79.77 | 94.979 |
| DO | 0.512 | 0.177 | 0.61 | pH | −0.231 | −0.31 | −0.032 | ||||
| Eigenvalue | 7.504 | 2.772 | 1.141 | Eigenvalue | 5.755 | 3.798 | 1.167 | ||||
| Var% | 57.723 | 21.324 | 8.78 | Var% | 44.266 | 29.214 | 8.976 | ||||
| CV | 57.723 | 79.047 | 87.827 | CV | 44.266 | 73.48 | 82.456 | ||||
| Type | Index | δD/‰ | δ18O/‰ | d/‰ | Fitted Equation |
|---|---|---|---|---|---|
| UKZ | Max | −37.00 | −6.43 | 18.54 | δD = 4.01δ18O − 16.76 (R2 = 0.5, n = 12) |
| Min | −54.54 | −8.89 | 11.36 | ||
| Mean | −48.35 | −7.94 | 14.92 | ||
| MAZ | Max | −37.59 | −6.12 | 15.19 | δD = 6.04δ18O − 1 (R2 = 0.82, n = 28) |
| Min | −46.51 | −7.64 | 9.30 | ||
| Mean | −39.91 | −6.44 | 12.39 | ||
| DNZ | Max | −40.43 | −6.85 | 15.32 | |
| Min | −45.87 | −7.30 | 10.35 | ||
| Mean | −44.69 | −7.06 | 13.16 |
| CaSO4 | BaSO4 | CaSO4:2H2O | NaCl | Ca5(PO4)3OH | O2 | KCl | |
|---|---|---|---|---|---|---|---|
| max | −2.76 | −0.55 | −2.45 | −9.06 | 10.03 | −9.31 | −8.74 |
| min | −3.2 | −2.2 | −2.9 | −10.87 | 4.41 | −22.35 | −11.11 |
| mean | −2.87 | −1.35 | −2.59 | −9.71 | 0.88 | −20.44 | −9.37 |
| Cl− | Na+ | TH | NO3− | K+ | TDS | Ca2+ | HCO3− | Mg2+ | SO42− | |
|---|---|---|---|---|---|---|---|---|---|---|
| wi | 0.2149 | 0.1834 | 0.0996 | 0.0994 | 0.0873 | 0.0863 | 0.0666 | 0.0634 | 0.0558 | 0.0433 |
| EWQI | UKZ | max | 27.9098 | MAZ | max | 20.7643 | DNZ | max | 19.4695 | |
| min | 12.6140 | min | 16.8011 | min | 11.7148 | |||||
| mean | 21.5481 | mean | 18.7189 | mean | 17.2320 |
Disclaimer/Publisher’s Note: The statements, opinions and data contained in all publications are solely those of the individual author(s) and contributor(s) and not of MDPI and/or the editor(s). MDPI and/or the editor(s) disclaim responsibility for any injury to people or property resulting from any ideas, methods, instructions or products referred to in the content. |
© 2025 by the authors. Licensee MDPI, Basel, Switzerland. This article is an open access article distributed under the terms and conditions of the Creative Commons Attribution (CC BY) license (https://creativecommons.org/licenses/by/4.0/).
Share and Cite
Zhang, J.; Chen, C.; Bu, J.; Xiong, X.; Xiao, C.; Yang, C.; Huang, Y. Hydrochemical Characteristics and Indicative Significance of Terminal Tributaries in Karst Water Systems: A Case Study of the Zhongdu River Basin in Southwest China. Water 2025, 17, 822. https://doi.org/10.3390/w17060822
Zhang J, Chen C, Bu J, Xiong X, Xiao C, Yang C, Huang Y. Hydrochemical Characteristics and Indicative Significance of Terminal Tributaries in Karst Water Systems: A Case Study of the Zhongdu River Basin in Southwest China. Water. 2025; 17(6):822. https://doi.org/10.3390/w17060822
Chicago/Turabian StyleZhang, Jun, Chi Chen, Jianwei Bu, Xing Xiong, Chunshan Xiao, Chenzhou Yang, and Yinhe Huang. 2025. "Hydrochemical Characteristics and Indicative Significance of Terminal Tributaries in Karst Water Systems: A Case Study of the Zhongdu River Basin in Southwest China" Water 17, no. 6: 822. https://doi.org/10.3390/w17060822
APA StyleZhang, J., Chen, C., Bu, J., Xiong, X., Xiao, C., Yang, C., & Huang, Y. (2025). Hydrochemical Characteristics and Indicative Significance of Terminal Tributaries in Karst Water Systems: A Case Study of the Zhongdu River Basin in Southwest China. Water, 17(6), 822. https://doi.org/10.3390/w17060822