Abstract
Intensified human activities such as urbanization, agricultural production, industrialization, mining, and fish farming have led to high concentrations of nutrients in water bodies, resulting in eutrophication. Eutrophication has become a global problem that threatens water ecosystems globally. The present study examines the efficiency of applying a novel modified material as an adsorbent for phosphate and ammonium uptake from natural eutrophic freshwater, called ‘ZeoPhos’. The novel material consists of natural zeolite and the addition of iron, calcium, and humic ions, which have been reported for their high adsorption capacity and nutrient-binding properties. Morphological and chemical composition analysis by SEM/EDS and TEM microscopic analysis results are included for natural and modified zeolite. Ammonium and orthophosphate kinetic adsorption results are aligned with pseudo-second kinetic models and reveal 78% and 70% adsorption removal efficiency for solutions of 1 mg NH4+-N/L and 1 mg PO43−-P/L, respectively. Finally, ‘ZeoPhos’ ammonium and orthophosphate ions adsorption capacity reached up to 28.61 mg/g ± 0.32 and 27.13 mg/g ± 0.57, respectively, after Langmuir fitting isotherm experiments.
1. Introduction
High levels of nutrients, such as ammonium and orthophosphate ions, in freshwater bodies are responsible for rising eutrophication, and this is a major environmental concern today. The increasing demand for food has resulted in a growing demand for nitrogen fertilizers. These fertilizers contain ammonium as their main constituent, which poses a threat to aquatic environments around the world [1]. Recent studies reveal that nitrogen and phosphorus introduction in surface waters from agriculture reach up to 30 and 58%, respectively [2]. Particularly, concentrations of ammonia close to those of 0.2 to 0.5 mg/L are thought to be lethal to fish and other aquatic organisms [3]. As in the case of freshwater ecosystems, concentrations of orthophosphate ions can also be high and cause degradation of those systems [4]. Phosphorus concentrations in eutrophic surface water bodies range from 10−3 mg-P/L to a few mg-P/L [5]. The intense growth of algae in the water and the smell of hydrogen sulfide are characteristics that reveal the existence of an excess of phosphorus. Ideal phosphorus concentrations in water bodies vary (<0.02 mg/L); however, due to both the long-term accumulation of phosphorus in sediments and its re-release into the overlying water after changes in the external environment, such as changes in pH and dissolved oxygen, it becomes difficult to achieve ideal concentrations. In conclusion, to deal with the phenomenon of eutrophication, it is necessary to control the release of endogenous phosphorus from the sediments, as well as its overall management [6].
In attempts of water bodies nutrient control, zeolites have recently been used as inexpensive adsorbents in this context [7]. In addition, numerous new modified clay-based applications have been introduced as cost-effective methods to save freshwater by reducing eutrophication [8].
Researchers agree that nutrients control [9,10,11] approaches to restore eutrophic inland and coastal waters has a lot of potential. The remediation of endogenous pollution is carried out with either physical approaches, like dredging [12], aeration [13], or biological [14], or chemical [15] approaches, like adsorption. The aim is the adoption of non-intrusive methods [12] that do not disturb the biodiversity of the ecosystem by the adsorption of ammonium and orthophosphate ions for the restoration of eutrophic ecosystems.
Zeolites are porous hydrated aluminosilicate compounds, which appear in a three-dimensional form and contain cations of alkaline elements, such as Na+, K+, Ca2+, and Mg2+. The main structural units of the crystal structure of zeolites consist of silicon (SiO4) and aluminum (AlO4), and they form an oxygen tetrahedron structure [16]. In the tetrahedral site, the Si4+ cation is replaced by Al3+, and leads to a negative charge which enhances zeolites with cation exchange abilities with other cations such as Na+, K+, NH4+, H+, Ca2+, Sr2+, and Mg2+ [4,17].
The physicochemical properties of zeolites make them a material with a wide range of applications. The surface active centers they possess are acid–base or oxidizing-reducing in nature, which provides them with catalytic action and excellent adsorption capacity due to the existence of these centers [7].
Due to their unique structures of large specific surface area and reversible water adsorption, natural zeolites have been widely studied as adsorbents for water and wastewater treatment [18]. Despite the strong ammonium ions adsorption capacity of natural zeolites, they have a limited orthophosphate ions adsorption capacity that motivated researchers to seek surface modification techniques to improve their performance in the removal of pollutants [19]. The present study critically evaluates the adsorption capacity of natural and modified zeolites for ammonium and orthophosphate ions control in eutrophic freshwater bodies.
The present paper aspires to examine the application efficiency of a novel modified material as an adsorbent for phosphate and ammonium uptake from natural eutrophic freshwaters. A new material, called ZeoPhos, has been created on the combined action of the natural zeolite and the addition of iron, calcium, and humic ions, which have been reported for their high adsorption capacity and nutrient binding properties. The uptake of phosphate and ammonium was estimated in adsorption kinetics and adsorption isothermal experiments. Also, material characterization analysis results, combined with kinetic and isotherm model results, aim to reveal the adsorption mechanism of the innovative material that was developed, the adsorption efficiency, and the adsorption capacity for both ammonium and orthophosphate ions.
2. Materials and Methods
2.1. Preparation of ZeoPhos
The natural zeolite (N-Z) used for the modification was of Slovakian origin, supplied by Zeocem (Bystré, Slovak) (https://www.zeocem.com/en, accessed on 4 March 2025) with the following composition: 65.1% SiO2, 12.9% Al2O3, 1.2% Na2O, 1.6 K2O, 3% CaO, 100 1.5% MgO, 1.5% FeO, and 12.9% H2O. The natural mineral zeolite was washed with deionized water, dried and crushed in a mortar and sieve in galvanized square wire mesh No. 140, with a final particle size of less than 0.105 mm before treatment. The mineral was stored in a 37 °C oven for 24 h to remove any moisture before weighing it.
To prepare the ZeoPhos material, natural zeolite with calcium was modified first. An amount of 200 mL of calcium chloride (0.1 M) reagent was added to 10 g of natural zeolite. Impregnation was achieved by vigorous stirring at 900 rpm for 24 h. The supernatant was then carefully removed so that only the modified zeolite remained in the container. After removing the supernatant, the impregnation procedure was repeated twice. Then, the modified zeolite was rinsed three times, and again placed under agitation with 200 mL of deionized water at 900 rpm for 10 min to remove excess calcium ions, and dried at 80 °C for 24 h. Finally, the modified material was passed through a sieve and a mortar until the final diameter of the material was less than 0.015 nm. Then, 200 mL of the iron(III) chloride (0.1 M) reagent and 200 mL of the humic acid (100 mg/L) reagent were added and stirred at the same time with 10 g of the modified material with calcium. Impregnation was achieved two more times. The supernatant was then carefully removed and rinsed three times, again placed under agitation with 400 mL of deionized water at 900 rpm for 10 min, and dried at 80 °C for 24 h. Finally, the modified material was passed through a No 250 sieve and a mortar until the final diameter of the material was less than 0.015 nm. The resulting modified material was maintained at 37 °C.
2.2. Characterization Analysis
Scanning electron microscopy (with a type JEOL 6300 microscope of the JEOL Ltd., Croissy-sur-Seine, France) equipped with the energy-dispersive X-ray spectrometer (Link ISIS 300, Oxford Instruments, Abingdon, UK) allowed the rapid qualitative and quantitative microanalysis of natural and modified zeolites’ composition. The samples were coated with a layer of gold (thickness of 15.0 nm) to enhance the quality of the image without changing the zeolite’s internal structure.
2.3. Phosphate and Ammonium Kinetic Experiments Procedure
Batch adsorption experiments were carried out to assess the phosphate and ammonium kinetic removal efficiency. An amount of 100 mL of ammonium aqueous solutions of 1 mg NH4+-N/L were introduced to 0.01 g of adsorbent material, and 150 mL of orthophosphate aqueous solutions of 1 mg PO43−-P/L were introduced to 0.015 g of adsorbent material. In both kinetic experiments, 100 mg/L of adsorbent material and adequate volume were assured for repeated kinetic experiments to validate the results obtained. All experiments were carried out at room temperature (25 °C) and a steady pH level (equal to 7) within 24 h, preventing ammonium assimilations [20]. The ammonium and orthophosphate samples were filtered with gridded filters (of 47 μm) at the following times: 0 min, 15 min, 30 min, 1 h, 2, 4, 8, 12, and 24 h. The remaining ammonium ions concentration was determined with the modified method of indophenol, as described by Pai et al. [21], whereas the remaining orthophosphate ions concentration in the initial and filtered samples was determined with the ascorbic method [22].
2.4. Phosphate and Ammonium Adsorption Experiment Procedure
In addition, batch adsorption experiments were conducted to evaluate the sorption capacity as a function of the ammonium and orthophosphate aquatic solutions. An amount of 0.1 g of adsorbent material was weighed and placed in 100 mL colonial volume flasks of the following ammonium initial concentrations: 0.1, 0.5, 1, 5, 10, 50, 100 mg NH4+-N/L. Also, 0.15 g of adsorbent material was weighed and placed in 150 mL colonial volume flasks of the following orthophosphate initial concentrations: 0.1, 0.5, 1, 5, 10, 50, 100 mg PO43−-P/L. The temperature (25 °C) and pH levels (equal to 7) remained unchanged.
2.5. Adsorption Kinetic Models Evaluated
Pseudo-first [23], pseudo-second [24] and Elovich kinetic analysis was performed to assess which kinetic model best describes the adsorption mechanism of the ZeoPhos material and compare it with the well-known results of natural zeolite.
The pseudo-first-order model of Lagergren [23] which describes the liquid–solid phase adsorption system, is presented in the following Equation (1):
where ‘ks1’ is the pseudo-first sorption constant that refers to rate of sorption per pseudo-first (min−1), ‘qe’ is the equilibrium constant of the adsorption performed (mg/g) and ‘qt’ is the quantity of the sorbed solute material on the surface of the adsorbent at a time t (mg/g).
The pseudo-second model is suitable for the chemical sorption of heterogeneous systems [25] where the kinetics rate governs the mechanism of sorption [24]. The pseudo-second model is presented in Equation (2):
where ‘k2’ is the pseudo-second sorption constant that refers to rate of sorption per pseudo-second (g/mg min), ‘qe’ is the equilibrium constant of the adsorption performed (mg/g) and ‘qt’ is the quantity of the sorbed solute material on the surface of the adsorbent at a time t (mg/g).
Additionally, for the chemical adsorption of heterogeneous materials, the Elovich kinetic model is another empirical model used. The Elovich model best describes materials with uneven and irregular surfaces [26]. The Elovich kinetic model is described by Equation (3):
where ‘a’ is the initial sorption rate (mg/g min), ‘β’ is the extent of surface for the chemisorption mechanism (g/mg), and ‘qt’ is the quantity of the sorbed solute material on the surface of the adsorbent at a time ‘t’ (min).
Finally, in order to evaluate the adsorption mechanism in the Weber–Morris model [27], the model was calculated for the sorbent materials used, and the algorithm is expressed in Equation (4):
where ‘ki’ refers to the rate of intra-particle diffusion (mg/g min−1/2), ‘qe’ is the equilibrium constant of the adsorption performed (mg/g), and ‘qt’ is the quantity of the sorbed solute material on the surface of the adsorbent at a time t (mg/g).
The linear form of the pseudo-first, pseudo-second, and Elovich models used in this study is described in Table 1.

Table 1.
Linearized expression of four kinetic models: pseudo-first-order, pseudo-second, Elovich, and Weber–Morris.
2.6. Adsorption Isotherm Models Evaluated
The adsorption isotherm is a relationship between the concentration in the solution and the concentration in the adsorbent particles at a specific temperature and pressure. The mass of the substance adsorbed ‘Qe’ upon the clay-based material is expressed in ‘mg/g’ for the concentration ‘Ce’ of the adsorbate. The Langmuir model, which proposes that adsorption occurs as a monolayer on a homogeneous surface, is often used to describe the equilibrium adsorption behavior [15], and is presented in Equation (5):
where ‘KL’ is the Langmuir sorption constant in L/mg units at a particular temperature and corresponds with energy of sorption, ‘Qm’ is the maximum sorption capacity in units of mg/g, ‘Ce’ is the concentration of the solution at equilibrium (mg/L), and finally, ‘Qe’ is the amount of nutrients sorbed at equilibrium.
For heterogeneous surface isotherm characteristics, the Freundlich isotherm model [15] is a famous model used to evaluate the equilibrium process, and is described in Equation (6), as follows:
where ‘KF’ is the Freundlich sorption constant in mg/g units at a particular temperature and corresponds with the energy of sorption, ‘Ce’ is the concentration of the solution at equilibrium (mg/L), ‘Qe’ is the amount of nutrients sorbed at equilibrium (mg/g), and ‘n’ is the sorption intensity.
3. Results and Discussions
3.1. Characterization Analysis Results
The produced XRD spectrograph (in Figure 1) qualitatively identified the silicon (Si), oxygen (O), and aluminum (Al) characteristics of zeolite. Iron (Fe), potassium (K), calcium (Ca), and sodium (Na) increased after the modification was performed because of cation exchange enhancement through the modification. The strong peaks of gold (Au) are attributed to the coating of zeolite.
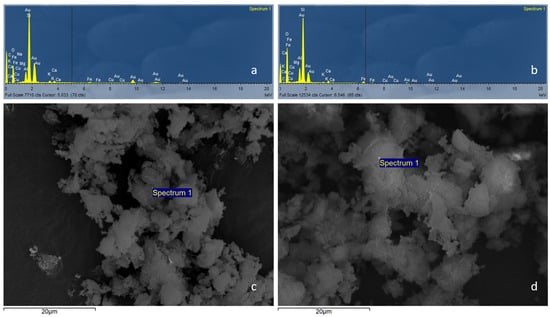
Figure 1.
(a,b) XRD spectrograph and (c,d) SEM microscopic analysis at 20 kV and 2000 resolution of the natural zeolite (N-Z) and ZeoPhos, respectively. The samples were coated with gold—thickness (nm): 15.0, density (g/cm3): 19.32. The analysis was performed at the Laboratory of Electronic Microscope and Microanalysis of the University of Patras.
The chemical composition described in Table 2 verifies the reduced content in carbon (C), copper (Cu), sodium (Na), silicon (Si), and potassium (K), owing to the modification. It is remarked that content of oxygen (O), iron (Fe), and aluminum (Al) increased due to the structural composition of the zeolite, which aimed to increase the ion exchange capacity of zeolite.

Table 2.
Chemical analysis of natural zeolite and ZeoPhos. The samples were coated with gold—thickness (nm): 15.0, density (g/cm3): 19.32. Analysis from the Laboratory of Electronic Microscope and Microanalysis of the University of Patras.
The transmission electron microscope analysis (JEM-2100, JEOL Ltd., Croissy-sur-Seine, France) presented in Figure 2, provides high magnification allowing for atomic-level imaging. The d-spacing values show the distances between particle surfaces in the crystal structure of zeolites. There are many sets of crystal structures in the natural zeolite, as shown by the d-spacing values of Table 3, which range from 0.09807 nm to 0.4229 nm. Whereas the crystal structures in ZeoPhos, as shown by the d-spacing values of Table 3, range from 0.09647 nm to 0.42211 nm.
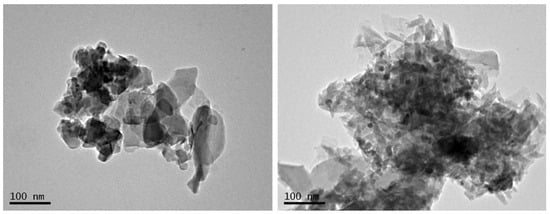
Figure 2.
TEM microscopic analysis at 200,000 resolution of the natural zeolite and ZeoPhos, respectively. The analysis was performed from the Laboratory of Electronic Microscope and Microanalysis of the University of Patras.

Table 3.
TEM microscopic analysis results at 100.000 resolution of natural zeolite and ZeoPhos, respectively. The analysis was performed at the Laboratory of Electronic Microscope and Microanalysis of the University of Patras.
3.2. Adsorption Kinetic Results
Figure 3 presents the adsorption kinetic analysis results of the linearized models that are presented in Table 3. The parameters of the three kinetic models that have been examined (pseudo-first, pseudo-second, and Elovich) are presented in Table 4 and Table 5. The results reveal clear preference in the pseudo-second model for both natural and modified zeolite with 99% correlation efficiency (R2) compared to Elovich and to the pseudo-first model’s poor fit (40 to 60% of experiment data). As expected, the material of zeolite origin is expressed with pseudo-second-order kinetic models because their sorption mechanism is governed. by monolayer chemical sorption. The application of the pseudo-second-order kinetic model is reported in many scientific works [25,28,29] to describe ammonium ion sorption kinetics on natural zeolites. Natural zeolites [30,31] had considerably lower adsorption rates than modified zeolites such as NaCl-immersed and calcined zeolites.
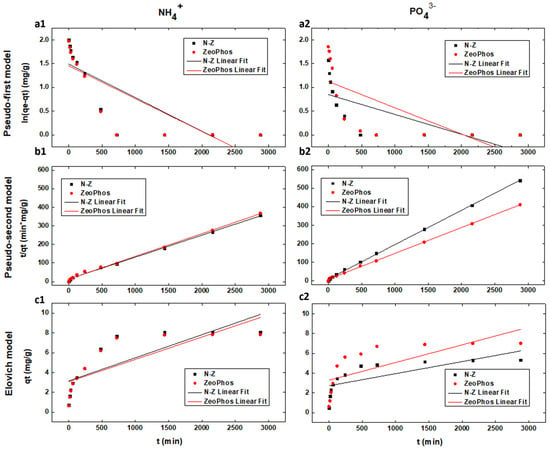
Figure 3.
Kinetic fitting results of (a1,a2) Pseudo-first, (b1,b2) pseudo-second and (c1,c2) Elovich model for natural zeolite (N-Z) in black dots and of ZeoPhos in red dots for both ammonium (left) and orthophosphate (right) adsorption. Black lines symbolize the fitting results of natural zeolite and red lines symbolize the fitting results of ZeoPhos.

Table 4.
Ammonium pseudo-first, pseudo-second and Elovich kinetic model results at solutions of 1 mg NH4+-N/L for both natural zeolite and ZeoPhos after 100 mg/L treatment.

Table 5.
Orthophosphate pseudo-first, pseudo-second, and Elovich kinetic model results at solutions of 1 mg PO43−-P/L for both natural zeolite and ZeoPhos after 100 mg/L treatment.
Also, the pseudo-first-order model’s poor fitting denotes that the dominant mechanism of sorption is chemisorption and not physical sorption [4] due to the small size of the selected zeolite (<0.15 μm). Therefore, the sorption process for both materials is a rate-limiting mechanism [24]. Reliable pseudo-second kinetic order results reveal that under ammonium kinetic analysis, the adsorption rate reached similar results of 8.43 and 8.16 mg/g for natural and modified zeolite.
The Weber–Morris results reveal that the mechanism of adsorption is completed with multiple phases, and not just sole rate-limiting. Figure 4 shows the Weber–Morris intraparticle diffusion model plots for the adsorption of ammonium and orthophosphate ions onto N-Z and ZeoPhos, two zeolite-based materials. Each of the plots show that the relation of ‘qt’ (mg/g) to ‘t0.5’ is the amount of adsorbate NH4+-N or PO43−-P at time ‘t0.5’. This model assists in determining whether the intraparticle diffusion is a rate-controlling step in the adsorption process.
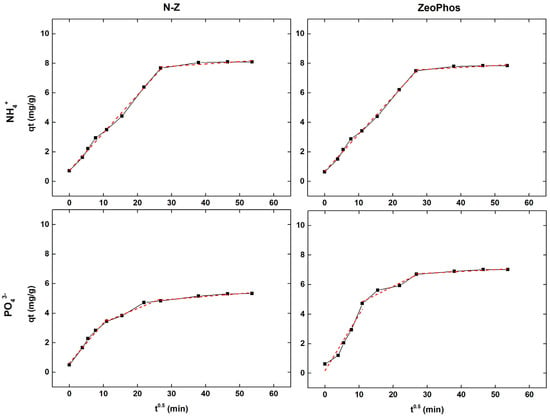
Figure 4.
Weber–Morris kinetic analysis results in red for natural zeolite (N-Z) (right) and ZeoPhos (left), for both ammonium (upper row) and orthophosphate (lower row) results.
From the results of the adsorption of ammonium (Figure 4, upper row) in both the N-Z and ZeoPhos materials, we can note a multi-linear dependency on the time of operation. Firstly, qt exhibits a sharp rise to ‘t0.5’ due to rapid adsorption due to surface adsorption or film diffusion. However, the curve gradually becomes steep, indicating that the rate-controlling step is intraparticle diffusion after the initial phase. Additionally, there is no single straight line in both cases, which suggests that intraparticle diffusion [27] is not the only reason to limit the rate, and that there are many phases of adsorption.
Similar adsorption trends are also observed for orthophosphate ions adsorption (Figure 4, lower row) onto N-Z and ZeoPhos, including an initial phase of fast adsorption and a subsequent diffusion-controlled phase [32]. The multi-linearity of the plots implies that surface adsorption is the initial process in both materials and that intraparticle diffusion follows in later stages. The result is consistent with the Weber–Morris model, in which different slopes in the plot reflect different diffusion mechanisms [33].
Also, Figure 4 reveals that all adsorption curves of the plateau phase seem to indicate that, after about 30 to 40 min, equilibrium had been reached. Compared to ZeoPhos, we mark that the initial adsorption rate in N-Z is slightly faster, possibly because of a higher accessibility of active sites or faster surface diffusion due to its simpler structure.
Finally, ammonium and orthophosphate ions have different removal processes, which explains why their adsorption methods differ in the Weber–Morris model. Figure 4 reveals that Weber–Morris model curves for both natural and modified zeolite of ammonium adsorption shows two linear zones, whereas of orthophosphate three linear zones. The ammonium adsorption of the natural zeolite and ZeoPhos is conducted in two stages: first, on the surface, and then, inside the particle. The first stage involves rapid ion exchange reactions (steep slope) and the second stage involves slower intraparticle diffusion. The adsorption of orthophosphate is conducted in three stages: initial surface complexation (rapid stage), pore diffusion, and intraparticle diffusion. Comparing ammonium and orthophosphate ions surface charge effects [34], orthophosphate ions have a higher charge density (3−) compared to ammonium ions (+1). This can lead to stronger electrostatic interactions [35] with the adsorbents’ surface, and potentially create different diffusion pathways within the zeolite pores compared to ammonium processes. Table 6 presents the parameters derived from the linear form of Weber-Morris model for both ammonium and orthophosphate ions of natural zeolite and ZeoPhos.

Table 6.
Ammonium and orthophosphate Weber–Morris kinetic model results for solutions of 1 mg NH4+-N/L and 1 mg PO43−-P/L for both natural zeolite and ZeoPhos after 100 mg/L treatment.
3.3. Removal Efficiency Results
Figure 5 displays the adsorption efficiency (%) of ammonium and orthophosphate ions for both natural zeolite and ZeoPhos. The initial increase in ammonium adsorption efficiency (Figure 5, left) within the first 10 h is rapid for both ZeoPhos and N-Z, and afterwards, the plateau is reached. About 80% adsorption efficiency is achieved by both materials in 10 h, demonstrating a strong initial adsorption phase. ZeoPhos and N-Z do not show high differences in their adsorption efficiency for ammonium, with ~80–85% efficiency through the rest of the experimental investigation.
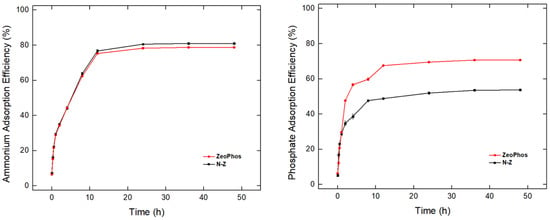
Figure 5.
Ammonium removal efficiency (left) and orthophosphate (right) removal efficiency from solutions of 1 mg NH4+-N/L and 1 mg PO43−-P/L for both natural zeolite (N-Z) and ZeoPhos after 100 mg/L treatment.
The orthophosphate adsorption efficiency (Figure 5, right) reveals a more pronounced difference between the two materials; it is observed that the initial adsorption of ZeoPhos is higher, reaching 60% efficiency in 10 h, compared to 40% adsorption of N-Z in the same time range. Based on the higher adsorption efficiency of ZeoPhos, there may be more favorable chemical or structural properties in phosphate ion adsorption than N-Z.
Other studies have shown that TiO2/zeolite nanocomposites were capable of removing 38.8% of ammonium and 98.1% of phosphate from an aqueous solution composed of 20 mg/100 mL of both ions [36], denoting that the proposed modification is best when applied in aquatic solutions, where the P to N ratio is greater than one.
3.4. Adsorption Isotherm Results
Figure 6 depicts the ammonium and orthophosphate adsorption capacity results for natural zeolite and ZeoPhos. The ammonium adsorption (Figure 6, left) Langmuir isotherm fitting results show that N-Z achieves a greater maximum adsorption capacity for ammonium than ZeoPhos. N-Z has a higher adsorption capacity of 34.3 mg/g, as presented in Table 7, whereas ZeoPhos’ maximum ammonium adsorption capacity reached up to 28.61 mg/g according to Langmuir fitting results. Other applications of modified zeolites (TiO2/zeolite nanocomposites) reached their maximum adsorption capacities at 38.63 mg/g of phosphate and 3.75 mg/g of ammonium after treatment of 20 mg/100 mL solutions [36]. In contrast, the magnetic zeolite (M-Zeo) composite also showed excellent ammonium adsorption capacity of up to 172.41 mg/g, and the adsorption process fit well with the Freundlich adsorption isotherm [37].
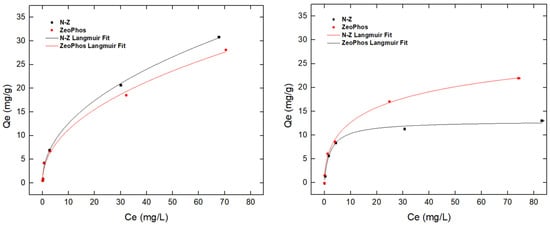
Figure 6.
Ammonium capacity efficiency (left) and orthophosphate (right) removal efficiency from solutions of 1 mg NH4+-N/L and 1 mg PO43−-P/L for both natural zeolite (in black) and ZeoPhos (in red) after 100 mg/L treatment. In straight lines, Langmuir isotherm fitting results are presented in a straight black line for natural zeolite (N-Z) and a red straight line for ZeoPhos.

Table 7.
Ammonium and orthophosphate Langmuir model fitting results from solutions of 0–100 mg NH4+-N/L and 0–100 mg PO43−-P/L for both natural zeolite and ZeoPhos after 1.000 mg/l treatment.
It is remarked that for orthophosphate adsorption, the trend is reversed: the adsorption capacity of ZeoPhos is almost four times higher than N-Z maximum adsorption capacity. Another study was conducted on the bentonite/zeolite-P (BE/ZP) composite, which showed that this composite is powerful in terms of sequestering phosphate and ammonium ions [38]. The modified material had a high surface area (512 m2/g) and ion exchange capacity (387 meq/100 g), and adsorption values of 179.4 mg/g for phosphate and 166 mg/g for ammonium.
Table 7 presents the ammonium and orthophosphate Langmuir model fitting results at solutions of 0–100 mg NH4+-N/L and 0–100 mg PO43−-P/L for both natural zeolite and ZeoPhos after 1.000 mg/L treatment. The tested materials showed poor isothermal fitting results with the Freundlich curve.
4. Conclusions
Natural and modified zeolites are proposed as effective adsorbents for removing ammonium and orthophosphate ions from eutrophic freshwaters. It is verified that the adsorption of natural zeolites improves ammonium ion removal efficiency. The effectiveness of modified zeolites and ZeoPhos in real-world eutrophic freshwater systems has been proven to be very competitive in varying nutrient conditions. Chemical sorption has been proven to be the dominant mechanism of sorption after pseudo-second-order kinetic model high fitting results for both ammonium and orthophosphate ions sorption.
The Weber–Morris plots show the multi-stage adsorption behavior of ammonium and orthophosphate ions on natural zeolite and ZeoPhos, indicating that both surface adsorption and intraparticle diffusion are associated with the adsorption of ammonium and orthophosphate ions on these materials. Therefore, a slower increase indicates intraparticle diffusion, since no single straight line indicates that intraparticle diffusion is not the exclusive rate-limiting step.
The results indicate that ZeoPhos and N-Z have high adsorption removal efficiencies for ammonium ions, reaching up to 85 and 80%, respectively, whereas the orthophosphate ions adsorption removal efficiency of ZeoPhos is superior to that of N-Z, whose removal efficiency reached up to 70 and 55%, respectively. In addition, it was concluded that at 10 h, the ammonium and orthophosphate ions’ adsorption efficiency reaches equilibrium and the adsorption efficiency plateaus.
Langmuir isotherms indicate that both N-Z and ZeoPhos have greater ammonium adsorption efficiency, but weaker orthophosphate ions’ adsorption capacity. Variations in pore size, surface area, Si/Al ratio, and the surface charge of each zeolite are thought to lead to this specificity due to their ability to interact with different ions. These results show that adsorption performance can be optimized when the selected zeolite type reflects the target contaminant.
Author Contributions
Investigation, I.B.; writing—original draft, I.B.; writing—review and editing, I.Z. All authors have read and agreed to the published version of the manuscript.
Funding
This work was funded by EEA and Norway Grants 2014–2021 through the project “BLUE-GREENWAY: Innovative solutions for improving the environmental status of eutrophic and anoxic coastal ecosystems” (project number 2018-1-0284, Support for Regional Cooperation).
Data Availability Statement
The data presented in this study are available on request from the corresponding author.
Conflicts of Interest
The authors declare no conflicts of interest. The funders had no role in the design of the study; in the collection, analyses, or interpretation of data; in the writing of the manuscript; or in the decision to publish the results.
References
- Wang, S.; Peng, Y. Natural Zeolites as Effective Adsorbents in Water and Wastewater Treatment. Chem. Eng. J. 2010, 156, 11–24. [Google Scholar] [CrossRef]
- Beusen, A.H.W.; Doelman, J.C.; Van Beek, L.P.H.; Van Puijenbroek, P.J.T.M.; Mogollón, J.M.; Van Grinsven, H.J.M.; Stehfest, E.; Van Vuuren, D.P.; Bouwman, A.F. Exploring River Nitrogen and Phosphorus Loading and Export to Global Coastal Waters in the Shared Socio-Economic Pathways. Glob. Environ. Chang. 2022, 72, 102426. [Google Scholar] [CrossRef]
- Chanda, R.; Islam, M.S.; Biswas, B.K. N and P Removal from Wastewater Using Rice Husk Ash-Derived Silica-Based Fe-ZSM-5 Zeolite. Clean. Eng. Technol. 2023, 16, 100675. [Google Scholar] [CrossRef]
- Han, B.; Butterly, C.; Zhang, W.; He, J.-Z.; Chen, D. Adsorbent Materials for Ammonium and Ammonia Removal: A Review. J. Clean. Prod. 2021, 283, 124611. [Google Scholar] [CrossRef]
- Goscianska, J.; Ptaszkowska-Koniarz, M.; Frankowski, M.; Franus, M.; Panek, R.; Franus, W. Removal of Phosphate from Water by Lanthanum-Modified Zeolites Obtained from Fly Ash. J. Colloid Interface Sci. 2018, 513, 72–81. [Google Scholar] [CrossRef] [PubMed]
- Wu, Y.; Song, L.; Shi, M.; Gu, C.; Zhang, J.; Lv, J.; Xuan, L. Ca/Fe-Layered Double Hydroxide–Zeolite Composites for the Control of Phosphorus Pollution in Sediments: Performance, Mechanisms, and Microbial Community Response. Chem. Eng. J. 2022, 450, 138277. [Google Scholar] [CrossRef]
- Kordala, N.; Wyszkowski, M. Zeolite Properties, Methods of Synthesis, and Selected Applications. Molecules 2024, 29, 1069. [Google Scholar] [CrossRef] [PubMed]
- Chauhan, T.; Szőri-Dorogházi, E.; Muránszky, G.; Kecskés, K.; Finšgar, M.; Szabó, T.; Leskó, M.; Németh, Z.; Hernadi, K. Application of Modified Clays in the Removal of Phosphates and E. Coli from Aqueous Solution. Environ. Nanotechnol. Monit. Manag. 2024, 22, 100965. [Google Scholar] [CrossRef]
- Yu, C.; Li, Z.; Xu, Z.; Yang, Z. Lake Recovery from Eutrophication: Quantitative Response of Trophic States to Anthropogenic Influences. Ecol. Eng. 2020, 143, 105697. [Google Scholar] [CrossRef]
- Zhao, J.; Gao, Q.; Liu, Q.; Fu, G. Lake Eutrophication Recovery Trajectories: Some Recent Findings and Challenges Ahead. Ecol. Indic. 2020, 110, 105878. [Google Scholar] [CrossRef]
- Biliani, I.; Tsavatopoulou, V.; Zacharias, I. Comparative Study of Ammonium and Orthophosphate Removal Efficiency with Natural and Modified Clay-Based Materials, for Sustainable Management of Eutrophic Water Bodies. Sustainability 2024, 16, 10214. [Google Scholar] [CrossRef]
- Kyriakopoulos, G.L.; Zamparas, M.; Kapsalis, V.C.; Kalavrouziotis, I.K. Eutrophication Control: The Shift to Invasive Methods Managing the Internal Nutrient Loads. A Bibliometric Analysis. Desalin. Water Treat. 2022, 267, 177–185. [Google Scholar] [CrossRef]
- Jilbert, T.; Couture, R.M.; Huser, B.J.; Salonen, K. Preface: Restoration of Eutrophic Lakes: Current Practices and Future Challenges. Hydrobiologia 2020, 847, 4343–4357. [Google Scholar] [CrossRef]
- Baxa, M.; Musil, M.; Kummel, M.; Hanzlík, P.; Tesařová, B.; Pechar, L. Dissolved Oxygen Deficits in a Shallow Eutrophic Aquatic Ecosystem (Fishpond)—Sediment Oxygen Demand and Water Column Respiration Alternately Drive the Oxygen Regime. Sci. Total Environ. 2021, 766, 142647. [Google Scholar] [CrossRef]
- Shaheen, U.; Ye, Z.L.; Abass, O.K.; Zamel, D.; Rehman, A.; Zhao, P.; Huang, F. Evaluation of Potential Adsorbents for Simultaneous Adsorption of Phosphate and Ammonium at Low Concentrations. Microporous Mesoporous Mater. 2024, 379, 113301. [Google Scholar] [CrossRef]
- Wen, J.; Yi, Y.; Zeng, G. Effects of Modified Zeolite on the Removal and Stabilization of Heavy Metals in Contaminated Lake Sediment Using BCR Sequential Extraction. J. Environ. Manag. 2016, 178, 63–69. [Google Scholar] [CrossRef]
- Ayele, L.; Pérez-Pariente, J.; Chebude, Y.; Díaz, I. Conventional versus Alkali Fusion Synthesis of Zeolite A from Low Grade Kaolin. Appl. Clay Sci. 2016, 132–133, 485–490. [Google Scholar] [CrossRef]
- Putra, R.N.; Lee, Y.H. Entrapment of Micro-Sized Zeolites in Porous Hydrogels: Strategy to Overcome Drawbacks of Zeolite Particles and Beads for Adsorption of Ammonium Ions. Sep. Purif. Technol. 2020, 237, 116351. [Google Scholar] [CrossRef]
- Shi, J.; Yang, Z.; Dai, H.; Lu, X.; Peng, L.; Tan, X.; Shi, L.; Fahim, R. Preparation and Application of Modified Zeolites as Adsorbents in Wastewater Treatment. Water Sci. Technol. 2017, 2017, 621–635. [Google Scholar] [CrossRef]
- Biliani, S.E.; Manariotis, I.D. Wastewater Treatment by High Density Algal Flocs for Nutrient Removal and Biomass Production. J. Appl. Phycol. 2023, 35, 1237–1250. [Google Scholar] [CrossRef]
- Zhang, C.; Wang, C.; Cao, G.; Wang, D.; Ho, S.H. A Sustainable Solution to Plastics Pollution: An Eco-Friendly Bioplastic Film Production from High-Salt Contained Spirulina sp. Residues. J. Hazard. Mater. 2019, 388, 121773. [Google Scholar] [CrossRef] [PubMed]
- APHA. Method 4500-P E: Phosphorus (Orthophosphate) by Ascorbic Acid Method. In Standard Methods for the Examination of Water and Wastewater; American Public Health Association: Washington, DC, USA, 2017; pp. 4.113–4.116. [Google Scholar]
- Ho, Y.S. Citation Review of Lagergren Kinetic Rate Equation on Adsorption Reactions. Scientometrics 2004, 59, 171–177. [Google Scholar] [CrossRef]
- Ho, Y.S.; McKay, G. Pseudo-Second Order Model for Sorption Processes. Process Biochem. 1999, 34, 451–465. [Google Scholar] [CrossRef]
- Jiménez-Cedillo, M.J.; Olguín, M.T.; Fall, C. Adsorption Kinetic of Arsenates as Water Pollutant on Iron, Manganese and Iron-Manganese-Modified Clinoptilolite-Rich Tuffs. J. Hazard. Mater. 2009, 163, 939–945. [Google Scholar] [CrossRef]
- Low, M.J.D. Kinetics of Chemisorption of Gases on Solids. Chem. Rev. 1960, 60, 267–312. [Google Scholar] [CrossRef]
- Weber, W.; Morris, C. Kinetics of Adsorption on Carbon from Solution. J. Sanit. Eng. Div. 1963, 89, 31–59. [Google Scholar] [CrossRef]
- Salvestrini, S.; Debord, J.; Bollinger, J.C. Enhanced Sorption Performance of Natural Zeolites Modified with PH-Fractionated Humic Acids for the Removal of Methylene Blue from Water. Molecules 2023, 28, 7083. [Google Scholar] [CrossRef]
- Naghizadeh, A.; Etemadinia, T.; Rezaei, O.M.; Mehrpour, O.; Mousavi, S.J.; Sadeghi, M. Application of Polypyrrole Coated on Perlite Zeolite for Removal of Nitrate from Wood and Paper Factories Wastewater. Desalin. Water Treat. 2018, 124, 177–183. [Google Scholar] [CrossRef]
- Georgiev, D.; Bogdanov, B.; Hristov, Y.; Markovska, I. Second-Order Kinetic Model for the Sorption of Cu(II) Ions in Aqueous Solutions of Zeolite NaA. Adv. Mater. Res. 2012, 560–561, 1174–1177. [Google Scholar] [CrossRef]
- Cheng, Z.; Ding, W. Ammonium Removal from Water by Natural and Modified Zeolite: Kinetic, Equilibrium, and Thermodynamic Studies. Desalin. Water Treat. 2015, 55, 978–985. [Google Scholar] [CrossRef]
- Liang, Z.; Gao, Q.; Wu, Z.; Gao, H. Removal and Kinetics of Cadmium and Copper Ion Adsorption in Aqueous Solution by Zeolite NaX Synthesized from Coal Gangue. Environ. Sci. Pollut. Res. 2022, 29, 84651–84660. [Google Scholar] [CrossRef] [PubMed]
- Biliani, S.E.; Vakros, J.; Manariotis, I.D. Screening of Raw and Modified Biochars from Food Processing Wastes for the Removal of Phosphates, Nitrates, and Ammonia from Water. Sustainability 2022, 14, 16483. [Google Scholar] [CrossRef]
- Zhi, Y.; Zhang, C.; Hjorth, R.; Baun, A.; Duckworth, O.W.; Call, D.F.; Knappe, D.R.U.; Jones, J.L.; Grieger, K. Emerging Lanthanum (III)-Containing Materials for Phosphate Removal from Water: A Review towards Future Developments. Environ. Int. 2020, 145, 106115. [Google Scholar] [CrossRef] [PubMed]
- Xiong, W.; Tong, J.; Yang, Z.; Zeng, G.; Zhou, Y.; Wang, D.; Song, P.; Xu, R.; Zhang, C.; Cheng, M. Adsorption of Phosphate from Aqueous Solution Using Iron-Zirconium Modified Activated Carbon Nanofiber: Performance and Mechanism. J. Colloid Interface Sci. 2017, 493, 17–23. [Google Scholar] [CrossRef]
- Ashfaq, M.H.; Shahid, S.; Javed, M.; Iqbal, S.; Hakami, O.; Aljazzar, S.O.; Fatima, U.; Elkaeed, E.B.; Pashameah, R.A.; Alzahrani, E.; et al. Controlled Growth of TiO2/Zeolite Nanocomposites for Simultaneous Removal of Ammonium and Phosphate Ions to Prevent Eutrophication. Front. Mater. 2022, 9, 1007485. [Google Scholar] [CrossRef]
- Huang, X.; Wang, N.; Kang, Z.; Yang, X.; Pan, M. An Investigation into the Adsorption of Ammonium by Zeolite-Magnetite Composites. Minerals 2022, 12, 256. [Google Scholar] [CrossRef]
- Abukhadra, M.R.; Abukhadra, M.R.; Ali, S.M.; Ali, S.M.; Nasr, E.A.; Nasr, E.A.; Mahmoud, H.A.A.; Mahmoud, H.A.A.; Awwad, E.M. Effective Sequestration of Phosphate and Ammonium Ions by the Bentonite/Zeolite Na-P Composite as a Simple Technique to Control the Eutrophication Phenomenon: Realistic Studies. ACS Omega 2020, 5, 14656–14668. [Google Scholar] [CrossRef]
Disclaimer/Publisher’s Note: The statements, opinions and data contained in all publications are solely those of the individual author(s) and contributor(s) and not of MDPI and/or the editor(s). MDPI and/or the editor(s) disclaim responsibility for any injury to people or property resulting from any ideas, methods, instructions or products referred to in the content. |
© 2025 by the authors. Licensee MDPI, Basel, Switzerland. This article is an open access article distributed under the terms and conditions of the Creative Commons Attribution (CC BY) license (https://creativecommons.org/licenses/by/4.0/).