Article

Multi-Scale Analysis Based on Wavelet Transform of Reservoir and River Total Phosphorus Correlation and Determination of Monitoring Time Scales

1
College of Agricultural Science and Engineering, Hohai University, Nanjing 210098, China
2
Institute of Bio- and Geosciences—Agrosphere (IBG-3), Forschungszentrum Juelich GmbH, 52425 Juelich, Germany
3
Beijing Engineering Corporation Limited, Beijing 100024, China
*
Author to whom correspondence should be addressed.
Water 2025, 17(5), 712; https://doi.org/10.3390/w17050712
Submission received: 23 January 2025 / Revised: 26 February 2025 / Accepted: 27 February 2025 / Published: 28 February 2025

Abstract

:
Total phosphorus (TP) dynamics between reservoirs and inflowing rivers critically affect eutrophication risks, but their multi-scale interactions remain insufficiently quantified. This study applied wavelet transform analysis to 8-year TP time series data from the Shanxi Reservoir and its inflowing rivers. Key findings include the following: (1) Morlet wavelet decomposition revealed dominant 8–16-month cycles for reservoir TP, contrasting with 4–8-month cycles in river TP; (2) wavelet coherence analysis identified a 90° phase lag (2–4 months delay) between reservoir and river TP at the 8–16-month scale; and (3) the time–frequency localization capability quantified rapid responses—reservoir TP reacted within 2 months to abrupt river TP increases, showing stronger intensity. Multi-resolution analysis further distinguished the driving mechanisms: interannual cycles (>12 months) governed reservoir TP variations, while seasonal cycles (<8 months) controlled river TP fluctuations. The study demonstrated wavelet analysis’ dual strengths: resolving scale-specific interactions through multi-scale decomposition and quantifying transient responses via phase coherence metrics. The 90° phase shift exposes hysteresis in TP transport, and the 2-month response threshold defines critical intervention timing. An adaptive monitoring framework is proposed as follows: ≤8-month sampling under stable conditions and 2-month intervals during TP surges, providing a time–frequency decision tool for precise reservoir water quality management.

1. Introduction

Drinking water reservoirs play a critical role worldwide, not only by providing reliable water sources to populations but also by maintaining ecosystem health and public safety [1,2,3]. In managing water quality within reservoirs, TP is one of the key nutrients. It can indirectly influence the nutrient levels of water bodies by regulating the supply of bioavailable phosphorus. [4,5,6]. Due to the potential threat that TP poses to both the ecosystem of the reservoir and the safety of drinking water, it is crucial to understand the dynamics of TP between the reservoir and its inflowing rivers.
The transport and response dynamics of nutrients between reservoirs and their inflowing rivers are complex [7,8]. As large water storage bodies, reservoirs are significantly influenced by the nutrient inputs from inflowing rivers [9]. However, the speed and periodicity of TP changes in reservoirs and rivers often differ [10]. This difference is not only reflected in the reservoir’s lag effect but also in the river’s rapid response to external environmental changes [11,12]. Therefore, studying the time-scale characteristics of TP concentrations in reservoirs and rivers is crucial for developing effective water quality management strategies.
In recent years, research on the nutrient dynamics between reservoirs and their inflowing rivers has been increasing [13,14,15]. Some studies have focused on how river inputs affect the transport and response characteristics of nutrients, such as TP, under different seasonal and hydrological conditions [16,17]. For example, Marcé et al. [18] found that during the summer, the inflow of river water into the reservoir is the main driving factor for nutrient concentrations. The inputs of riverine dissolved oxygen and nitrates were shown to control the internal loading of TP in the reservoir.
However, most studies are limited to macro time-scale analyses and ignore the interactions between reservoirs and rivers at different time scales [2,19,20]. Although this macro analysis reveals overall trends, it is difficult to capture short-term fluctuations and sudden events in TP concentration changes between reservoirs and rivers. For example, Araújo et al. [21] found that inflowing rivers influence the seasonal variations in TP concentrations in tropical reservoirs. However, they did not examine how short-term TP surge events in rivers affect the reservoir. These limitations make it challenging to consider the potential for sudden increases in nutrient concentrations when developing reservoir water quality management strategies.
Wavelet analysis, as a multi-scale time–frequency analysis tool, has been increasingly applied in environmental science, particularly for capturing the complex dynamics of environmental variables [22,23,24]. For example, W. Li [25] used wavelet analysis to study nutrient fluctuations in lake systems, successfully revealing the multi-scale characteristics of algal biomass changes regarding TP concentrations. However, despite the growing application of wavelet analysis in water quality monitoring [22,23,24], multi-scale analyses of the interactions between reservoir and river TP concentrations remain relatively limited. Specifically, the reservoir’s response mechanisms to sudden events, such as abrupt increases in river TP concentrations, have not been adequately studied, creating uncertainties in water quality management.
Given the aforementioned research gaps, this study poses the following key questions: How does the Shanxi Reservoir respond when the TP concentration in the inflowing rivers suddenly surges or remains low and stable? What are the time scales of these responses?
The overall goal of this study is to use wavelet analysis to reveal the time–frequency characteristics of TP in the Shanxi Reservoir and its inflowing rivers, particularly in response to sudden increases in river TP concentrations. Our specific objectives are to determine the intensity and extent of the reservoir’s response to these TP surges and, based on this, to propose appropriate monitoring time scales for the reservoir under varying TP concentration conditions. To achieve the goal, we proposed the following hypothesis: firstly, the response intensity and lag time of TP concentrations in the Shanxi Reservoir to sudden TP surge events in its inflowing rivers differ significantly across time scales, and wavelet analysis can identify the key time scales governing these reservoir responses. Additionally, the sudden increases in and low concentrations of TP in the inflowing rivers mentioned in this study represent two typical dynamic features observed in actual monitoring data, rather than artificially assumed scenarios.
The uniqueness of this study lies in its systematic application of continuous wavelet transform (CWT), cross wavelet transform (XWT), and wavelet coherence (WTC) analysis methods to reveal the dynamics of TP concentrations in the Shanxi Reservoir and its inflowing rivers across multiple time scales. This approach not only fills a gap in the existing research but also provides reservoir managers with a more scientific basis for water quality monitoring and management, particularly in response to sudden events.

2. Materials and Methods

2.1. Study Site and Data

The Shanxi Reservoir is located in the midriver of the Feiyun River in Wencheng County, Wenzhou City, Zhejiang Province (119°36′54″ E–120°04′37″ E, 27°26′38″ N–27°58′37″ N). It serves as an important source of drinking water for Wenzhou City, providing potable water to approximately 7 million people. The watershed area of the Shanxi Reservoir spans 1529 km2, with a total storage capacity of 1.84 × 10⁹ m3. The region experiences a subtropical humid monsoon climate with an average annual temperature of 19.6 °C and an average yearly precipitation of 1876.9 mm. The average number of rainy days per year is 149, with the primary rainy season occurring from April to September, accounting for 74.7% of the annual rainfall. The normal water storage level of the Shanxi Reservoir is 142 m, featuring terrain that is high in the west and low in the east. Medium and low mountainous areas characterize the upper and middle reaches, while the lower reaches consist of low mountainous hills and river valley plains. The Shanxi Reservoir is part of the Shanxi Hydraulic Hub, which also includes the Zhaoshandu Reservoir. Within the Shanxi Reservoir watershed, the Hongkou River, Liguang River, Sancha River, Xuezuokou River, Huangtankeng River, and Jujiang River are the main inflow rivers [26,27]. Per the actual geographical and ecological characteristics of the Shanxi Reservoir, this study monitored the main reservoir area and its six inflow rivers. We established seven cross-sections for this purpose, each located in the main reservoir area or on one of the inflow rivers, with water sample monitoring data representing the average concentration of pollutants in the river or reservoir.
The layout of the study area and the monitoring cross-sections are shown in Figure 1. Each cross-section had three sampling points on the left, right, and midstream. Water samples were collected from the surface layer (0–0.5 m) using a 5 L stainless steel water sampler and stored in 500 mL clean polyethylene bottles. The pH was adjusted to less than 2, and the samples were placed in an ice-cooled insulated box and transported back to the laboratory within 48 h for testing. TP was measured using the acidic potassium persulfate digestion–ammonium molybdate spectrophotometric method. Each sample was tested in triplicate.

2.2. Indicator Selection and Data Source

Phosphorus is a limiting element in eutrophication, and it can effectively reflect changes in water quality and their impact on the reservoir’s ecosystem. This study selected TP concentration as a water quality evaluation indicator. Data on the monthly TP concentration in the Shanxi Reservoir and its six inflowing rivers were collected from January 2009 to December 2016. These data originated from regular monitoring conducted by our laboratory, with a portion provided by the Wenzhou City Shanxi Reservoir Management Office.
The main rivers feeding into the Shanxi Reservoir include the Liguangxi River, Sanchaxi River, Xuezuokouxi River, Hongkouxi River, Huangtankeng River, and Jujiangxi River. To clearly illustrate the overall impact of sudden water quality events in the rivers on the water quality of the main reservoir area, this study used the drainage area of each river as a weight. Using the weighted average algorithm [28], TP concentration data from the same month across these six rivers were integrated into a single data point, representing the TP concentration for that month.
X ω ¯ = ω 1 x 1 + ω 2 x 2 + L + ω n x n ω 1 + ω 2 + L + ω n
where x 1 ,…, x n represent data values; ω 1 , ω 2 ,…, ω n correspond to the respective weights. The numerator represents the weighted sum. The denominator represents the sum of all weights. The annual runoff volumes and weight coefficients for the six inflowing rivers of the Shanxi Reservoir are listed in Table 1.

2.3. Nonlinear Time Series Analysis Methods

Long-term monitoring data of water environmental indicators are typical examples of nonlinear time series [29]. In practice, time series obtained through observation or experimentation are often complex. Without a known analytical model for the actual system, analyzing the patterns of changes in observed time series can effectively capture the dynamics of complex systems, such as reservoir ecosystems, whose processes are unpredictable but whose unpredictability can be predicted [30]. Wavelet analysis can proficiently extract features of reservoir water quality, such as periodicity and seasonality, and simultaneously reveal characteristics of the reservoir ecosystem in both the time and frequency domains [31].

2.3.1. Wavelet Transform

Wavelet transform, emerging as a new branch of mathematics in the late 1980s, represents an advancement built upon the foundation of Fourier transform [32,33]. From a macro perspective, Fourier transform performs an overall domain analysis, characterizing signal features solely in the time or frequency domain. In contrast, wavelet transform provides localized time–frequency analysis, representing signal characteristics through a combined approach of both time and frequency domains [20,34].
In this study, we used WT, XWT, and WTC to analyze time series data. These methods provide localized characteristics of signals in the time and frequency domains, revealing the correlations and coherence between signals [35,36,37].
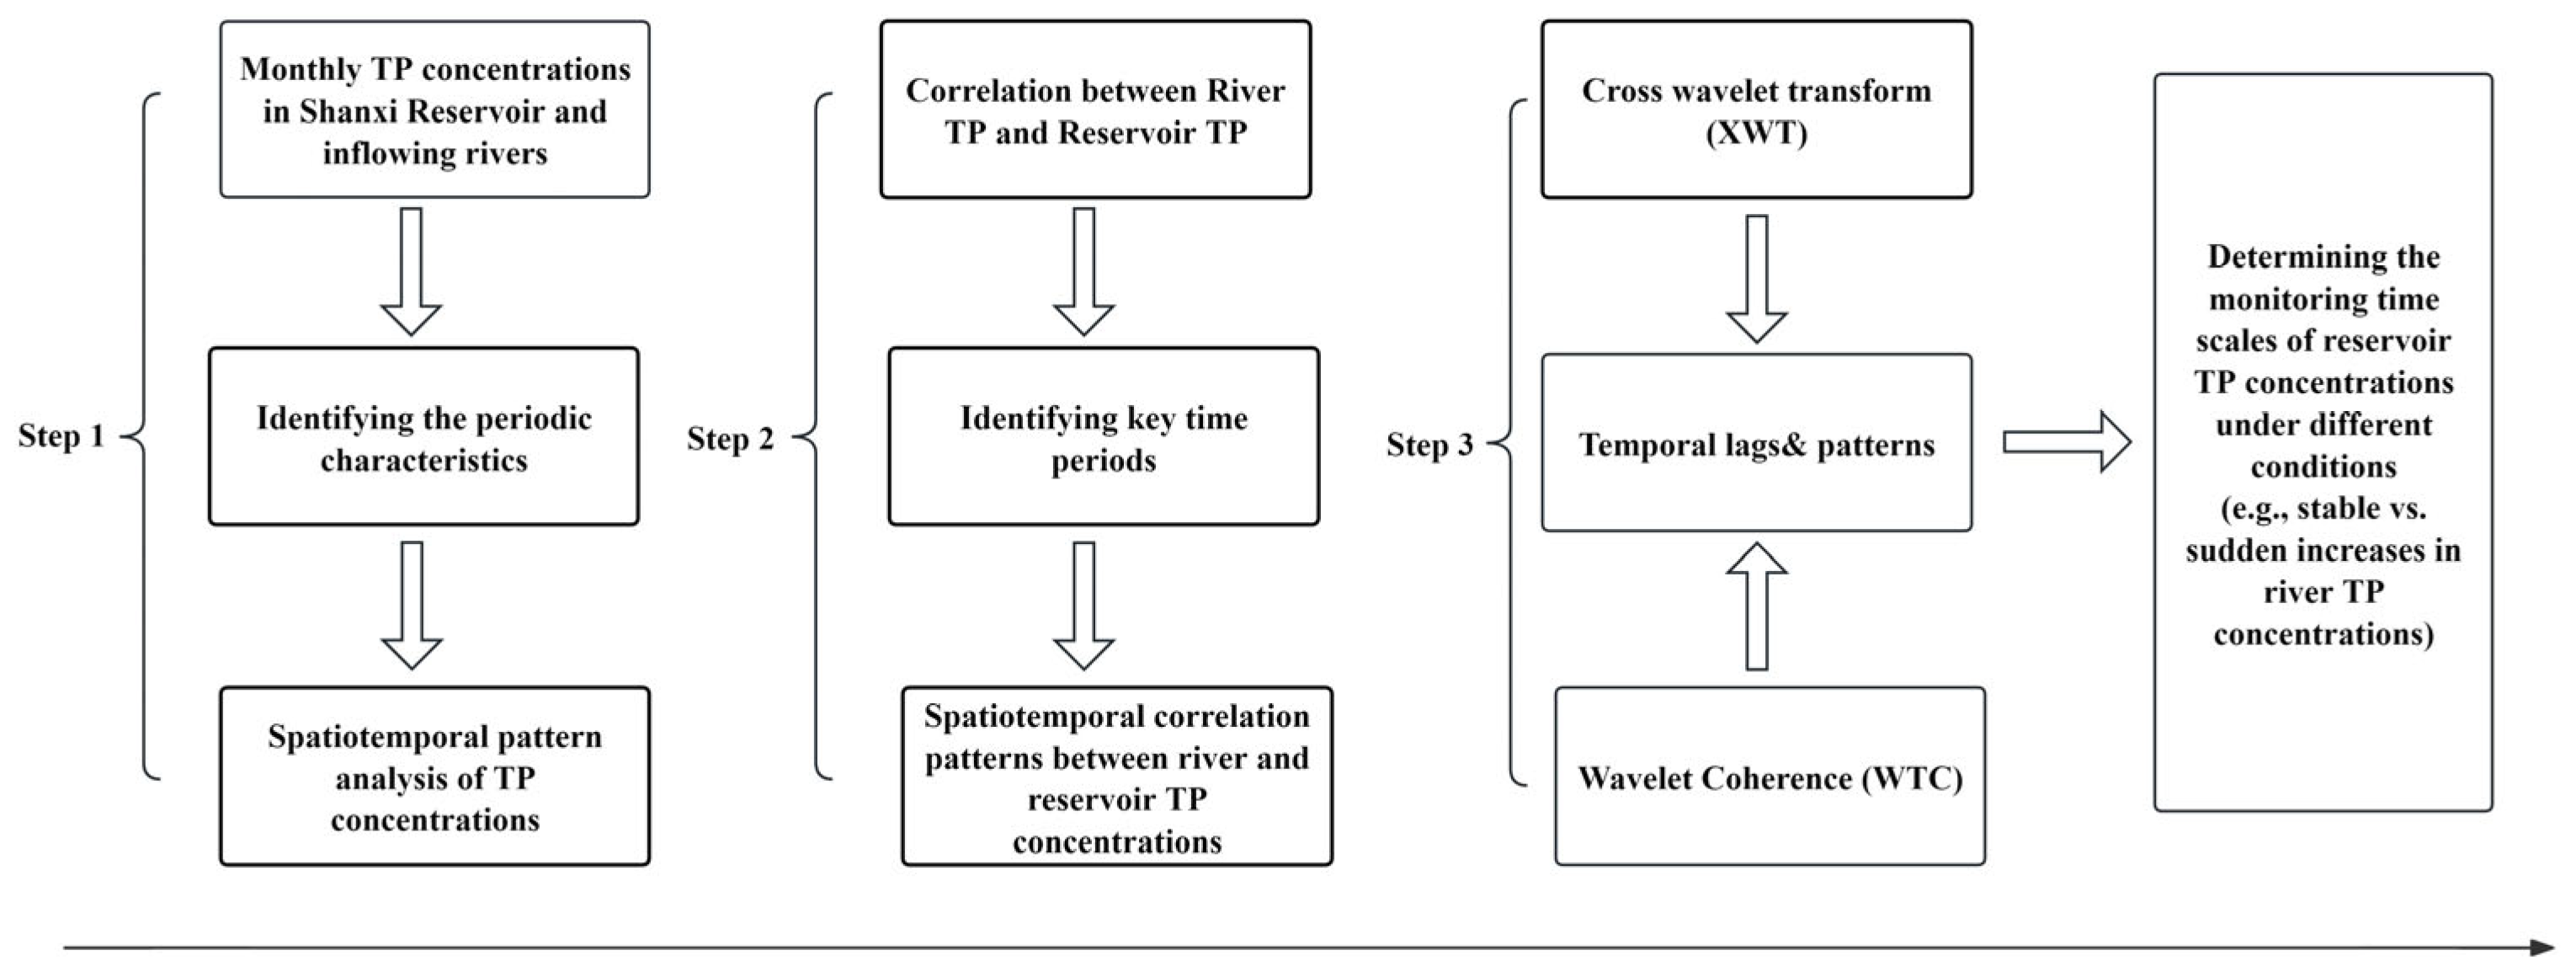
The schematic framework (Figure 2) shows that this study analyzed the time series of TP concentrations in the reservoir and inflowing rivers, identifying their periodic and spatiotemporal characteristics. Using XWT and WTC, the study determined the correlation and coherence between the TP concentrations in the reservoir and inflowing rivers, identifying their time lags and patterns. The ultimate goal was to understand the response patterns of reservoir TP to inflowing river TP under different conditions, such as river TP increasing suddenly or stable low concentrations.
The idea of wavelet transform is to approximate the function x(t) using a series of successive approximations [38], which can be expressed as follows:
W a , b = 1 a x t φ * t b a dt
where W a , b is the result of continuous wavelet transform; x t is the original signal to be analyzed; φ t is the chosen wavelet function, the mother wavelet; φ * t is the complex conjugate of the wavelet function; a is the scale factor and b is the time factor.
The distribution of wave energy with scale factor a can be measured by wavelet variance; Torrence, C. and Compo, G.P. provided practical application examples of wavelet variance in meteorology and thoroughly discussed the selection of scale factors [39]:
Var a = + W a , b 2 db
The advantage of wavelet variance is that it allows for the analysis of the main periods of each time series.
The wavelet energy spectrum can be defined as follows [33]:
W X a , b = W X a , b W X * a , b = W X a , b 2
where W X a , b is the wavelet transform coefficient of sequence x t ; * is the complex conjugate. The wavelet energy spectrum can be used to identify the multi-scale evolution and mutation features of sequences.

2.3.2. Cross Wavelet Transform and Wavelet Coherence

Cross wavelet transform (XWT) is based on wavelet transform and is primarily used to analyze the correlation between two time series [40]. It is a multi-signal, multi-scale analysis technique. Traditional cross-correlation analysis converts signals from the time domain to the frequency domain using Fourier transform and then analyzes the correlations between the data in the frequency domain. This method is generally more suitable for stationary signals and performs poorly with non-stationary signals. To effectively handle the correlation between two non-stationary signals, XWT provides better performance. This is because XWT combines wavelet transform with cross-spectral analysis, allowing the simultaneous representation of the relationship between two time series in both the time and frequency domains.
Suppose W n x s and W n y s are the continuous wavelet transforms of two time series X = x 1 , x 2 , L , x n and Y = y 1 , y 2 , L , y n , respectively. Then, their cross wavelet transform is defined as follows [38]:
W n XY s = W n X s W n γ * s
where W n γ * s is the complex conjugate of W n Y s , and s is the time shift.
The cross wavelet power spectrum can be defined as W n XY s , which contains time–frequency–amplitude information. The greater this value, the higher the correlation between the two time series.
The relationship between different power spectra is as follows [38]:
W n X s W n Y * s σ X σ Y < p = Z v p v P k X P k Y
where P k X and P k Y are the background power spectra of sequences X and Y , respectively; σ X and σ Y are the standard deviations of sequences X and Y , respectively; Z v p is the confidence coefficient related to probability p ; v is the degree of freedom.
The coherence of wavelet transforms can be expressed as follows [38]:
R XY 2 a , b = S XY a , b 2 S X a , b S Y a , b
where S XY a , b = W X a , b W Y * a , b is the smoothed cross wavelet spectrum; S X a , b = W X a , b 2 is the smoothed wavelet power spectrum of X ; S Y a , b = W Y a , b 2 is the smoothed wavelet power spectrum of Y ; S is a smoothing operator.
In the time–frequency domain, the degree of coherence between two wavelet transforms can be demonstrated by wavelet coherence spectrogram, where the phase spectrum reflects the response and lag between two sequences, and the phase angle reveals the direction of correlation of two sequences.
In this study, we applied XWT and WTC analyses using “A Matlab Toolbox for Cross-Wavelet and Wavelet Coherence Analysis” provided by Dr. Aslak Grinsted. The specific parameter settings are as follows: First, we selected the Morlet wavelet as the wavelet basis function due to its excellent balance in time–frequency analysis. The scale range was set from 1 to 128 to cover the main frequency components in the research data. The sampling interval was determined as 0.001 s based on the temporal resolution of the data, ensuring the accuracy of frequency calculations. The significance level was set at 95% to identify statistically significant regions. These parameter settings were designed to ensure the accuracy and reliability of the analysis, providing a solid theoretical foundation and data support for subsequent research.

2.3.3. Statistical Analysis

The dataset included a long-term series of monthly total phosphorus concentrations in the Shanxi Reservoir and its inflowing rivers from January 2009 to December 2016. Before conducting the continuous wavelet transform, the data underwent preprocessing, which included the removal of missing values and seasonal adjustment to minimize potential biases in subsequent analyses.
In this study, the 3σ criterion (three-sigma rule) was applied to identify outliers by calculating the mean (μ) and standard deviation (σ) of the data. Values falling outside the range [μ − 3σ, μ + 3σ] were considered outliers. To maintain the continuity of the time series and avoid data loss, linear interpolation was used to correct the outliers. The specific steps are as follows: (1) the outliers were removed; (2) based on the local continuity characteristics of the time series, a reference window of three months before and after the outliers was selected; (3) a linear relationship was established using adjacent valid data points to calculate the interpolated TP concentration; (4) the mean and standard deviation of the data before and after correction were compared to ensure that the corrected total phosphorus concentration values conformed to the 3σ criterion.
The preprocessing of the TP concentration dataset from the Shanxi Reservoir and its inflowing rivers was essential to ensure the reliability of subsequent analyses. By applying the 3σ criterion, outliers were effectively identified and corrected using linear interpolation, which preserved the continuity of the time series and minimized data loss.

3. Results

3.1. Total Phosphorus Characteristics

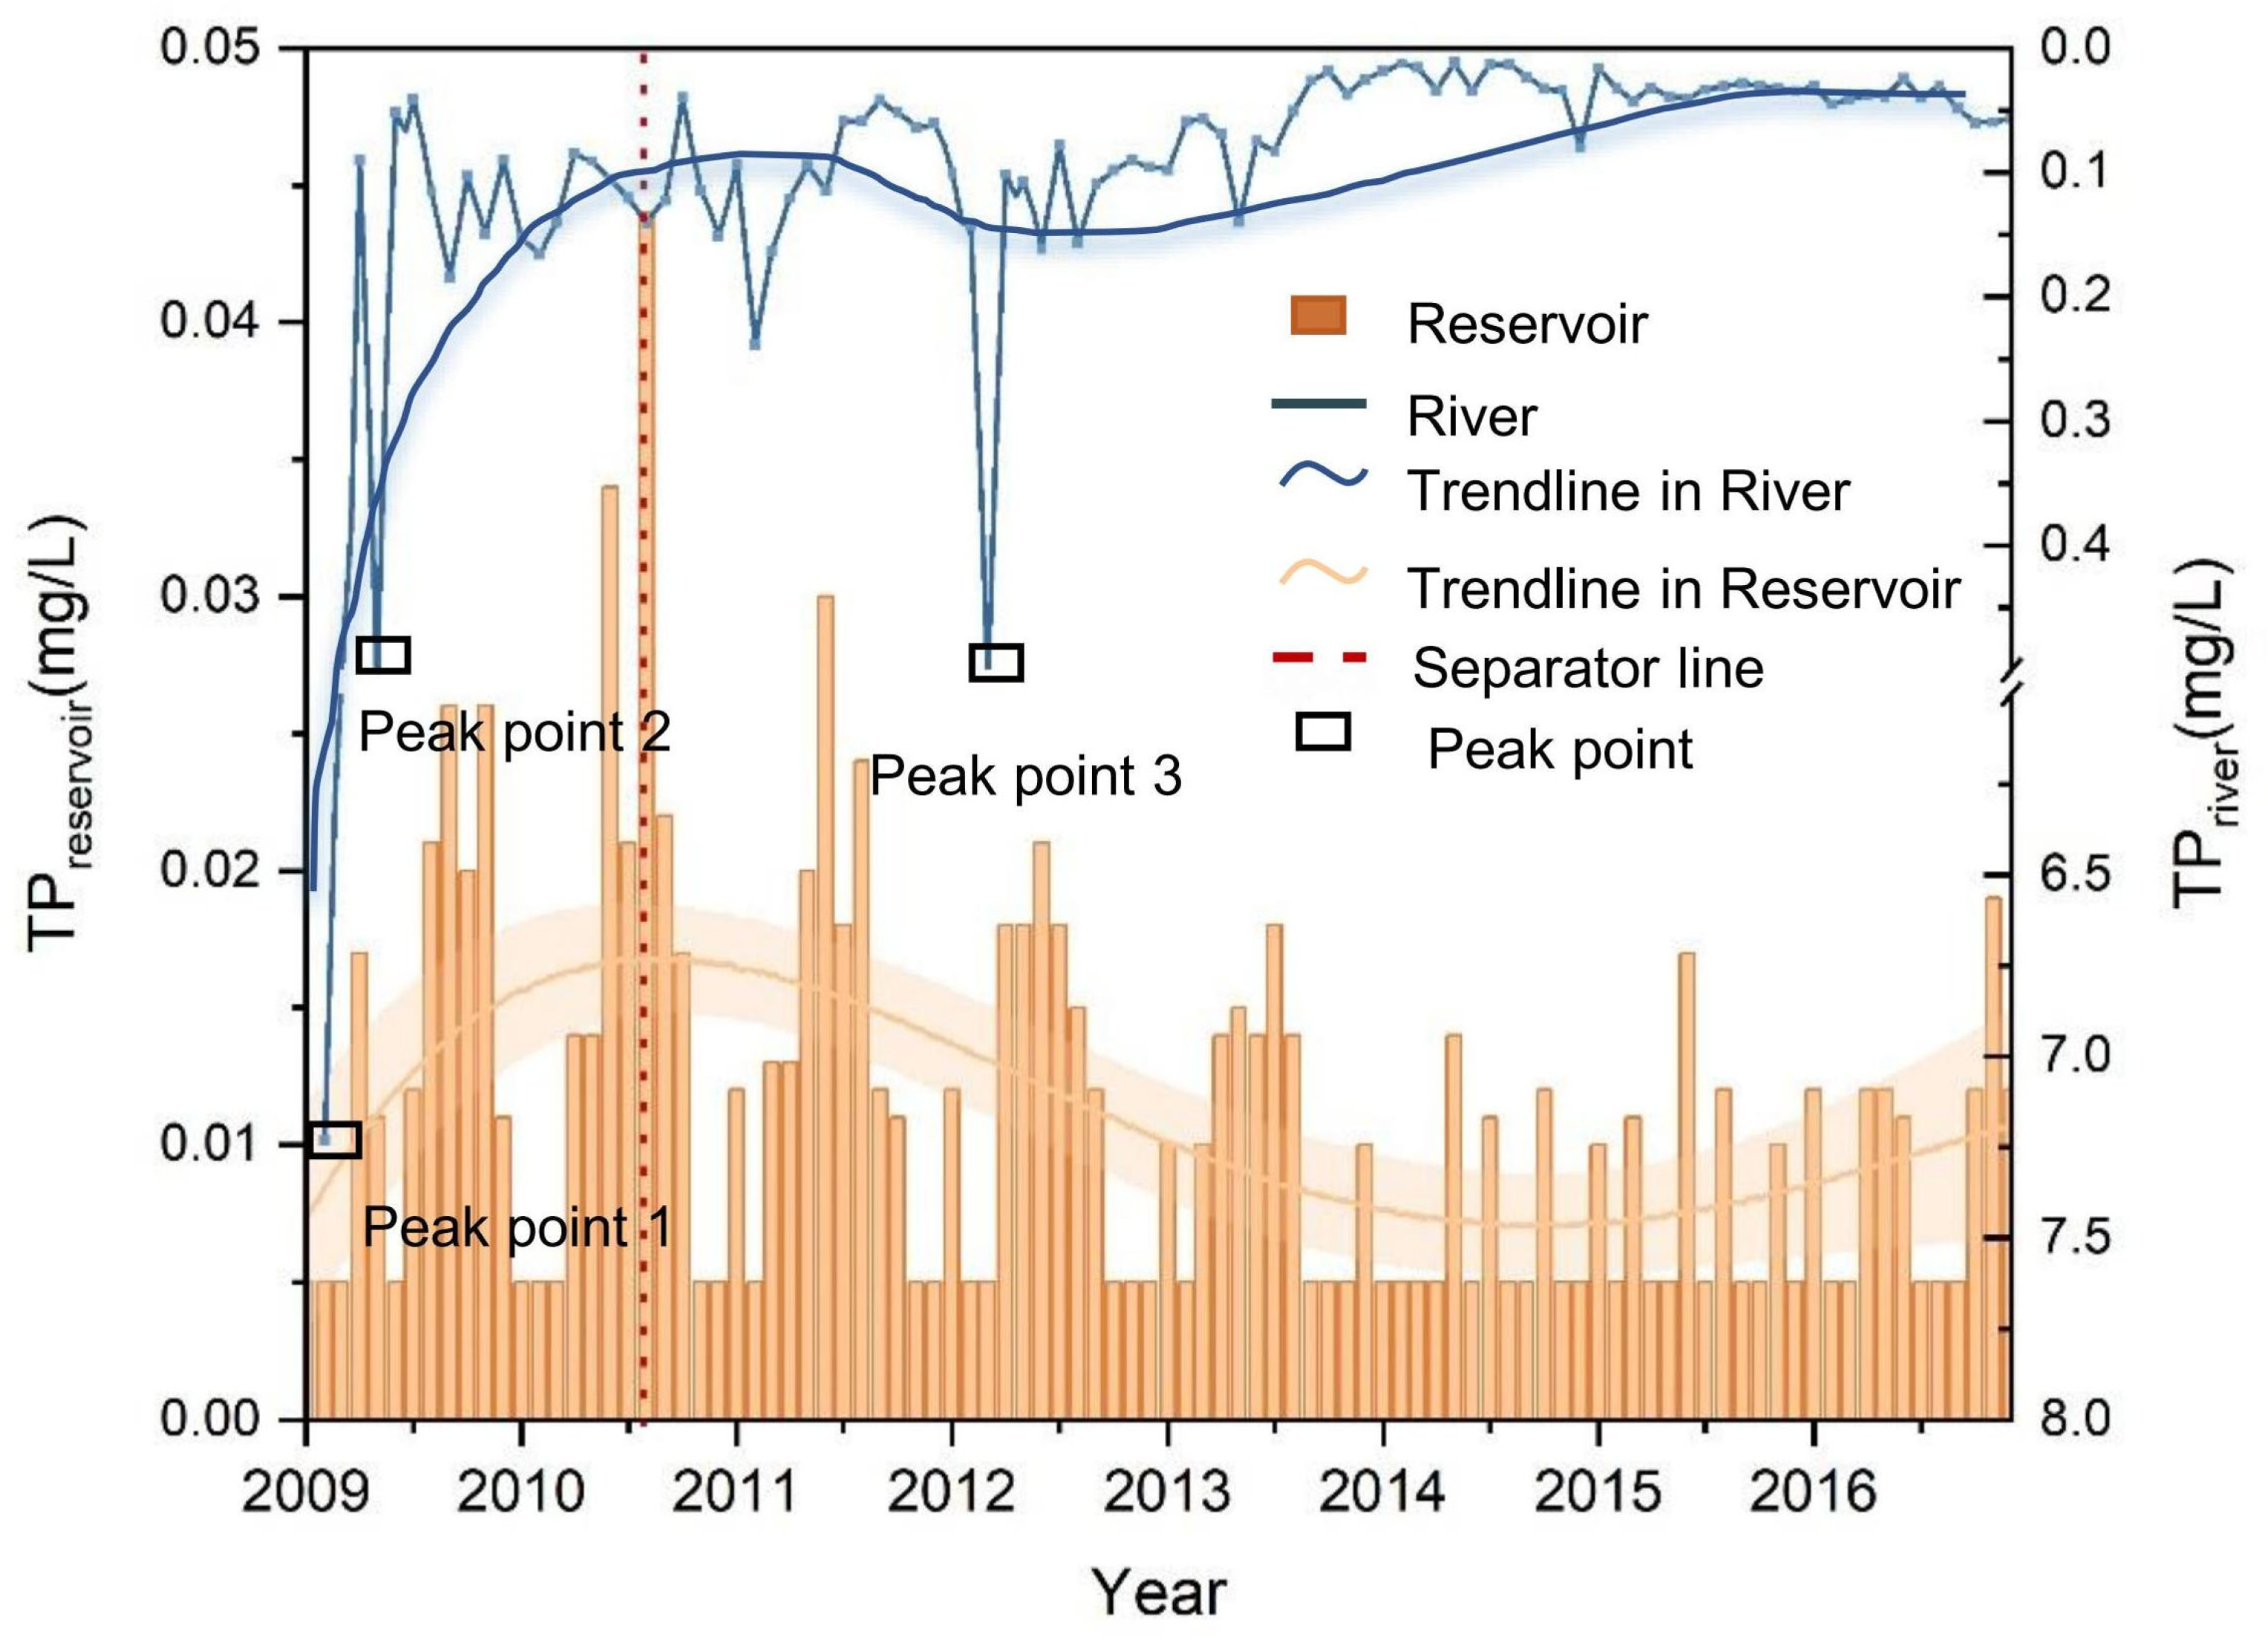
The TP concentration of the Shanxi Reservoir has generally demonstrated a positive trend, with TP concentrations ranging from 0.005 to 0.044 mg L−1 and an average concentration of 0.01 mg L−1 (Figure 3).
From January 2009 to December 2013, a clear seasonal pattern in TP concentrations was observed in the Shanxi Reservoir, with higher concentrations recorded from June to August each year, indicating a pattern of summer > autumn > spring = winter. In autumn and winter, lower TP concentrations are observed in the Shanxi Reservoir, particularly from November to January, reaching a low of 0.005 mg L−1. Interannually, peaks in TP concentrations were noted in April, September, and November 2009; June and August 2010; June and August 2011; June 2012; and July 2013. Notably, the highest concentration of 0.044 mg L−1 was recorded in August 2010.
Between 2009 and 2016, TP concentrations in these rivers fluctuated significantly, ranging from 0.01 to 7.23 mg L−1, with an average concentration of 0.22 mg L−1. Notably, a significant anomaly in TP concentration was detected before June 2009, peaking at 7.23 mg L−1 in February 2009. Moreover, from January to June 2009, the average TP concentration in the rivers reached 2.68 mg L−1. The standard deviation of TP in the inflowing rivers reached 2.096 in 2009, indicating severe fluctuations within the year. This trend is similar to the overall changes in TP concentrations in the Shanxi Reservoir.

3.2. Exploration of Wavelet Basis and Temporal Scale Rationality

Sensitivity analysis conducted on the continuous wavelet transform revealed a significant dependence of the results on the type of wavelet bases selected. Notable differences were observed between the two most commonly used wavelet bases for signal analysis, Morlet and Daubechies wavelets, particularly in capturing high-frequency features. The Morlet wavelet demonstrated superior performance in identifying characteristics of non-stationary signals, especially in higher-frequency domains. In contrast, Daubechies wavelets excelled in processing signals with abrupt changes and sharp transitions. This study emphasized the characteristics manifested at different temporal scales in the long-time series data of TP concentration in the Shanxi Reservoir and inflowing rivers, which are inherently non-stationary signals. Given the rarity of abrupt signal changes in the TP concentration in the Shanxi Reservoir, all evidence pointed towards selecting the Morlet wavelet as the wavelet base for this study.
In conducting CWT on water quality data, the choice of temporal scale significantly impacts the interpretation of environmental data, especially within complex aquatic systems [23]. We found that smaller scale ranges are more suitable for detecting rapid changes. For instance, when the entire time series of TP concentration in the Shanxi Reservoir was used as the scale range, the extraction of phosphorus features was not prominent in the low-frequency domain, with periodic changes in phosphorus concentration observable only in the high-frequency domain. Considering the cycles and frequencies of reservoir management, selecting a smaller scale range proves to be more effective for exploring the characteristics of TP concentration changes. In wavelet transform, an inverse relationship exists between frequency and scale, which can be explained through the properties of the wavelet function [41]. Changes in the scale parameter determine the stretching or compressing of the wavelet function, with frequency inversely related to this degree of scaling. When a smaller scale parameter is selected, the wavelet function is compressed, corresponding to the high-frequency portion of the TP concentration signal, thereby sensitively capturing the rapid changes in reservoir phosphorus content. Moreover, this study noted that reducing the step size of the shift can improve the resolution of results but increase computational complexity.

3.3. Temporal Characteristics of the Wavelet Spectrum of Total Phosphorus

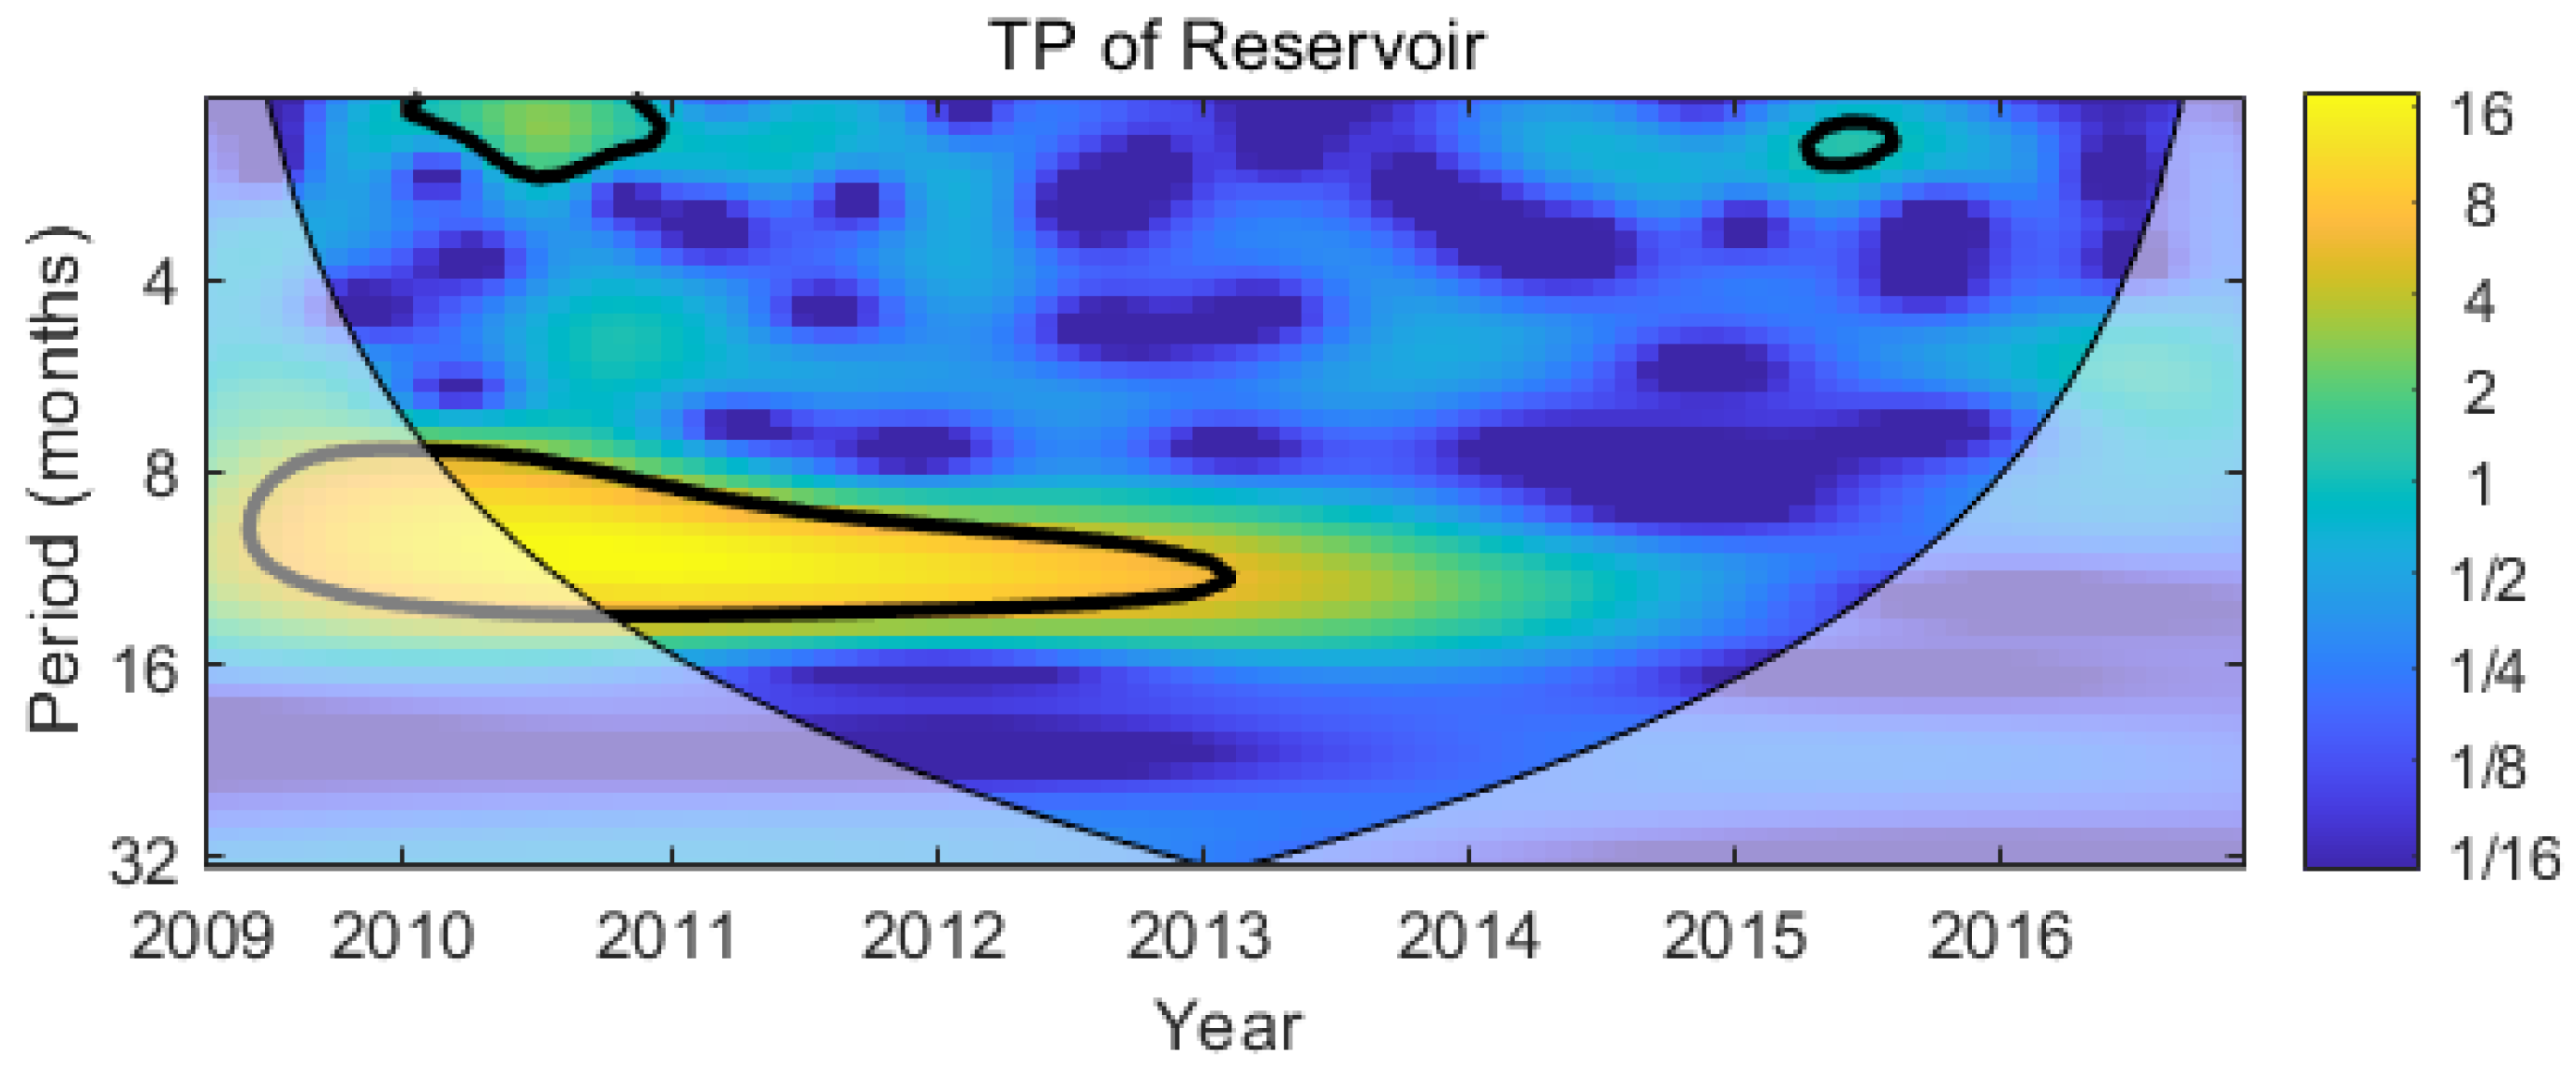
From 2009 to 2016, the TP concentrations in the Shanxi Reservoir and its inflowing rivers exhibited significant time domain characteristics. These characteristics revealed patterns in TP concentration changes in both the reservoir and the rivers. The continuous wavelet transform of the TP concentrations in the Shanxi Reservoir and its inflowing rivers produced wavelet power spectra (Figure 4 and Figure 5) that display the variation patterns of TP concentrations over time.
The TP concentration in the reservoir was notably higher between 2010 and 2013, with a continuous increase in signal particularly evident from mid-2012 to early 2013. Starting in 2013, there was a significant downward trend in the reservoir TP concentration. Additionally, the TP concentration in the Shanxi Reservoir exhibited clear seasonal variation, peaking annually from June to August. The periodicity of TP concentration fluctuations is also a notable aspect, with major fluctuations occurring within the 8 to 16-month period range. Understanding these periodic fluctuations is crucial for developing effective water quality management and pollution control strategies for the reservoir.
For the inflowing rivers (Figure 5), the TP concentration peaked in 2010 and early 2011. Starting in 2011, the TP concentration in the inflowing rivers gradually decreased, especially after 2013. Moreover, the inflowing rivers’ TP concentration also exhibited clear seasonal patterns, with peaks in the summer and lower concentrations in the winter and spring. The fluctuations in the inflowing rivers’ TP concentration primarily occurred within the 4 to 8-month period range. Understanding these seasonal and periodic fluctuations is crucial for developing targeted water quality management strategies.
Through the continuous wavelet transform analysis of TP concentrations in the Shanxi Reservoir and its inflowing rivers, significant differences in temporal, seasonal, and periodic variations between the two can be observed. The TP concentration fluctuations in the reservoir exhibit a longer periodicity (8 to 16 months), while those in the rivers show a shorter periodicity (4 to 8 months). Additionally, both the reservoir and the rivers display distinct seasonal patterns, with higher concentrations occurring during the summer months. These findings provide critical insights for developing regional water environment management strategies, emphasizing the necessity of seasonal monitoring and targeted interventions to reduce phosphorus pollution and improve water quality.

3.4. Frequency Domain Characteristics of the Wavelet Spectrum of Total Phosphorus

Frequency domain analysis primarily focused on the strength and distribution of signals at different frequencies. By conducting a comparative analysis of the wavelet power spectra of total phosphorus in the Shanxi Reservoir and its inflowing rivers, we can reveal significant differences and interrelations in their frequency domain characteristics. The TP concentration in the reservoir shows prominent high energy within the 8 to 16-month period range, particularly from 2010 to 2013, indicating a strong annual periodic variation; this periodic characteristic diminished after 2013.
In contrast, the TP concentration in the inflowing rivers shows significant energy within the 4 to 8-month short-period range, especially between 2009 and 2011, suggesting that the river TP changes are mainly driven by short-period factors such as seasonal rainfall, flow fluctuations, and human activities. These short-period variations highlight the inflowing rivers’ rapid response to environmental changes, particularly during the alternating rainy and dry seasons. Unlike the reservoir, the inflowing rivers’ TP changes lack significant annual periodic characteristics, likely due to the greater impact of seasonal factors and abrupt events on river flow and water quality, resulting in more pronounced short-term fluctuations in their frequency domain characteristics.
Through this analysis, we observe distinct differences in the frequency domain characteristics of TP concentrations between the reservoir and the inflowing rivers. The reservoir TP is primarily influenced by annual periodic factors, while the inflow river TP is mainly driven by short-period factors. This discrepancy reflects the different mechanisms of water quality management and environmental response between the reservoir and the inflowing rivers. As a large-scale regulation system, the reservoir has the ability to smooth out seasonal fluctuations, resulting in more stable annual periodic changes in TP concentration. Conversely, the inflowing rivers, being a dynamic system directly impacted by natural and human activities, are more susceptible to short-term environmental changes, leading to significant short-period fluctuations in TP concentration.

3.5. Cross Wavelet Transform and Wavelet Coherence Analysis

3.5.1. Common Periodic Fluctuations at Different Time Scales

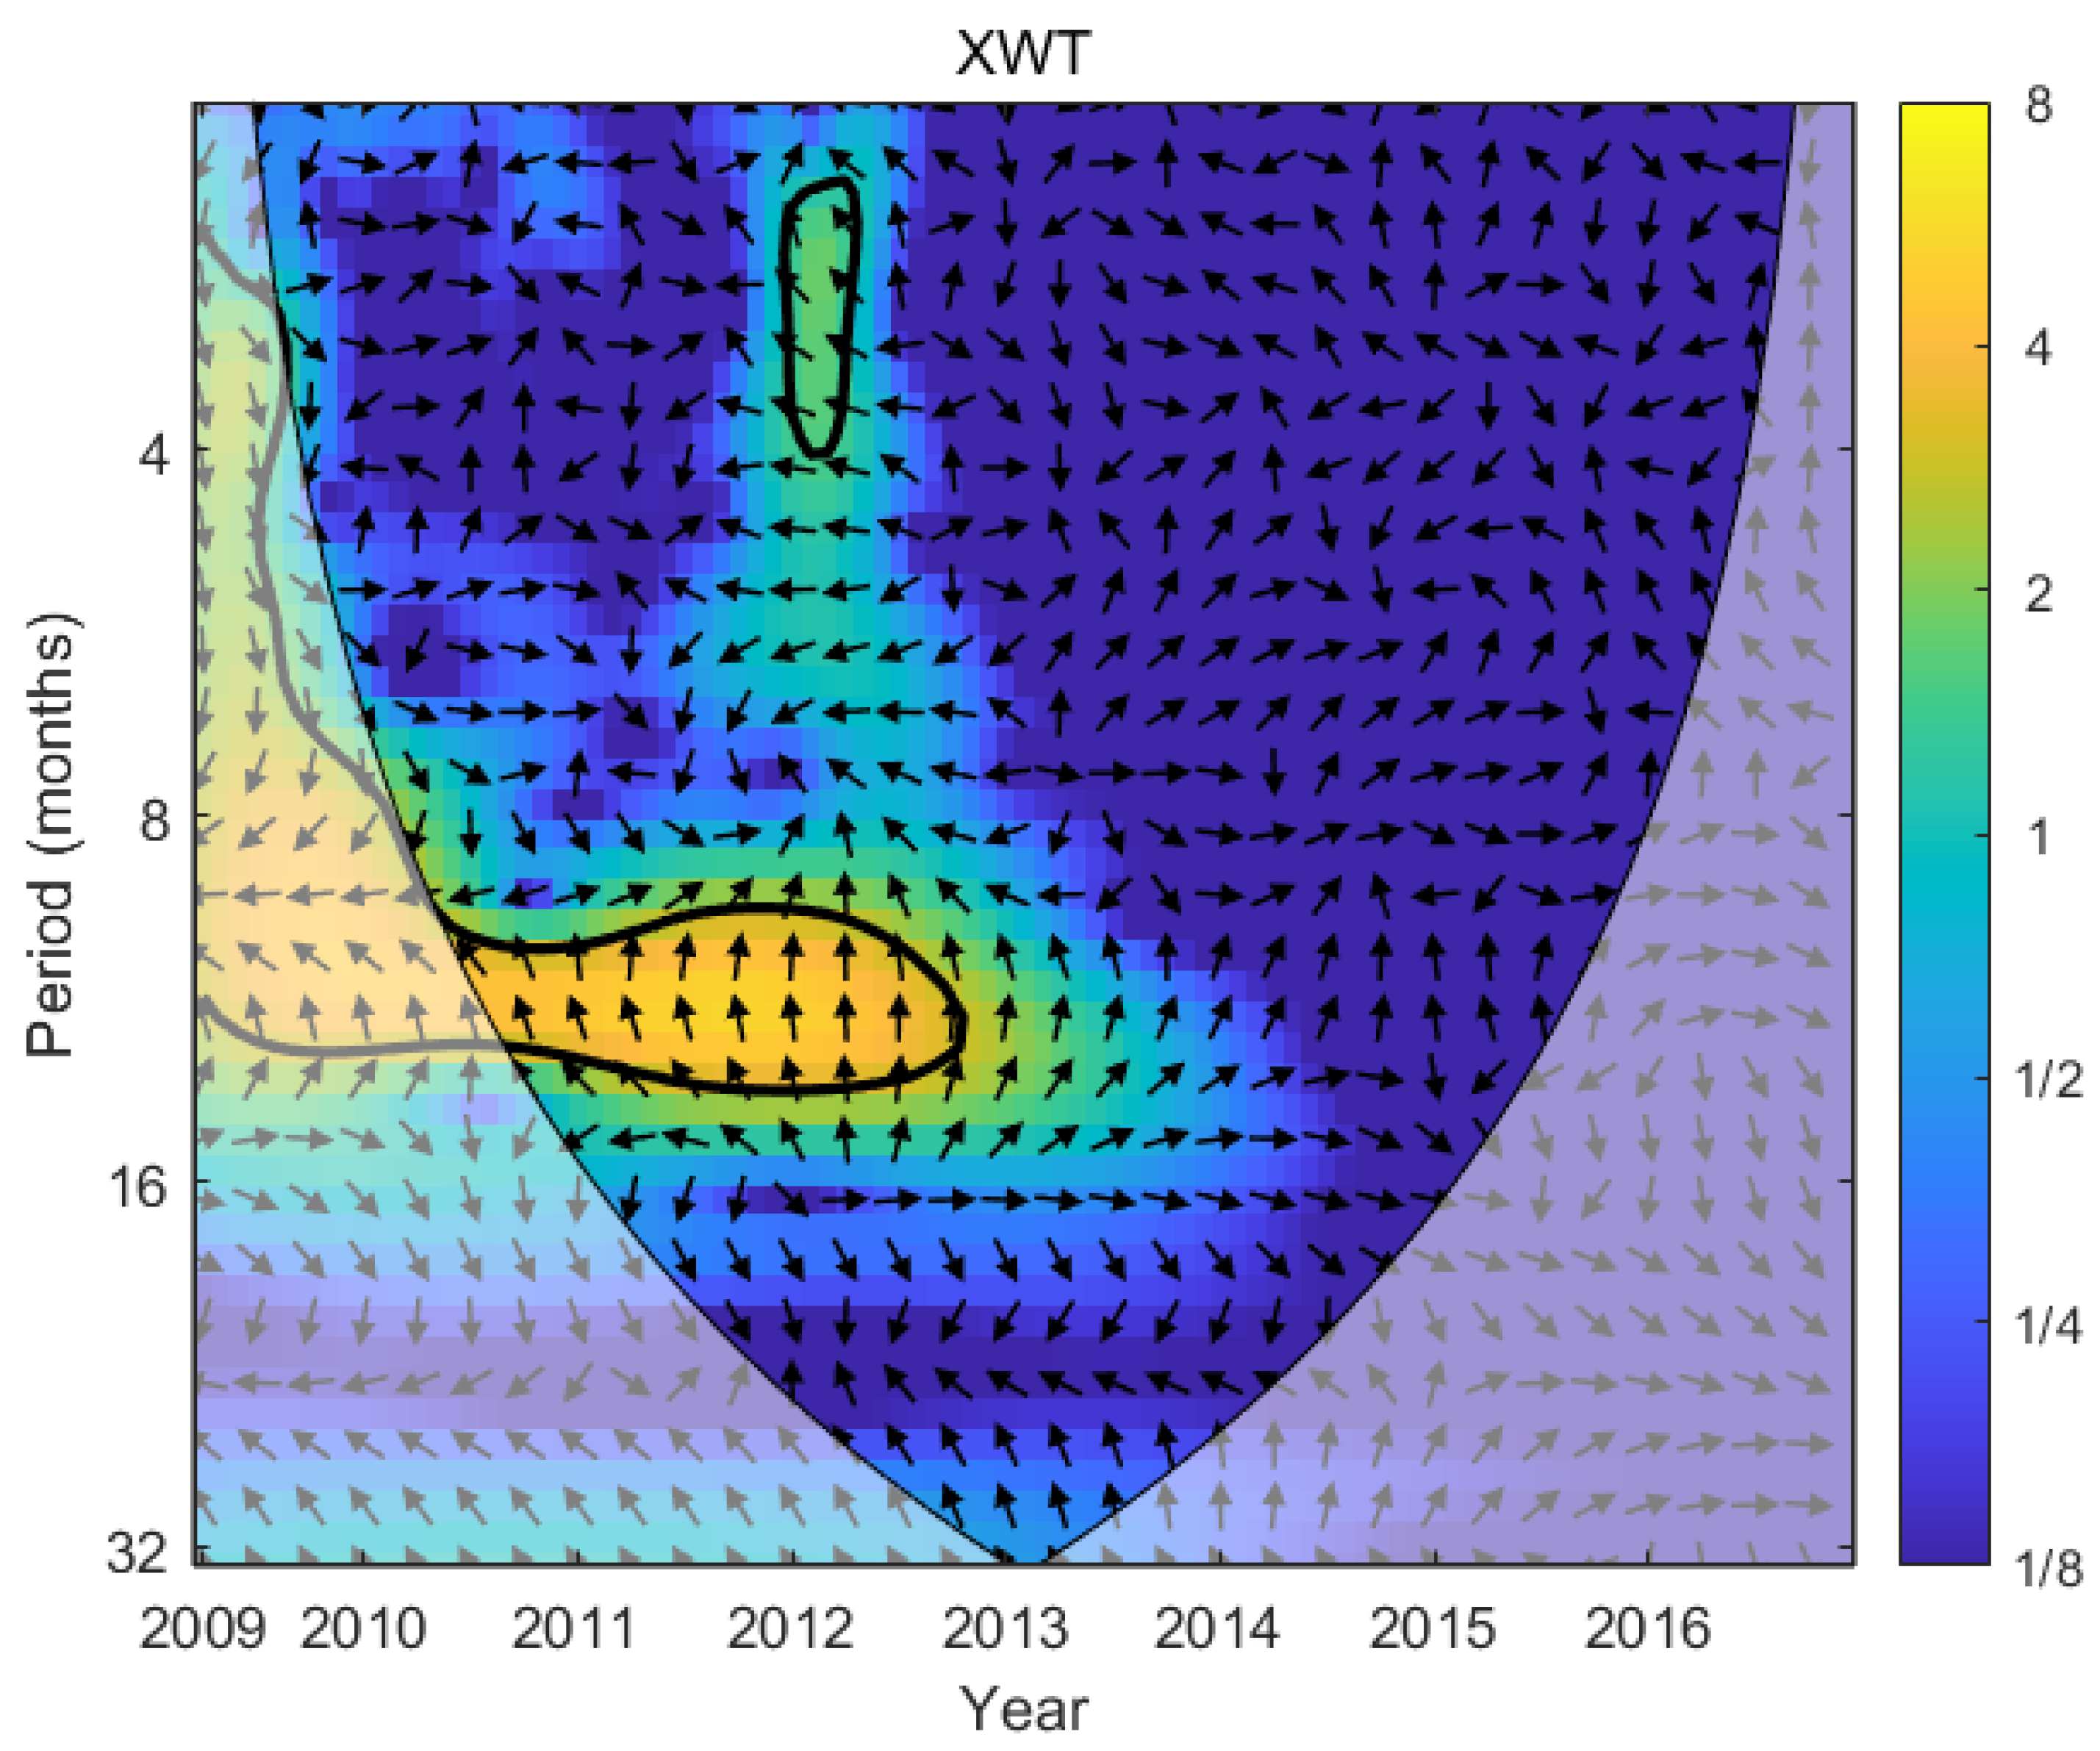
From the XWT power spectrum (Figure 6), significant high-energy regions can be observed in the 8 to 16-month period range from 2010 to 2013. This indicates that during this period, the reservoir TP and inflowing rivers’ TP exhibited strong common annual periodic fluctuations. Additionally, a high-energy region in the 4 to 8-month period range is noticeable around 2010, suggesting shorter-term periodic fluctuations.
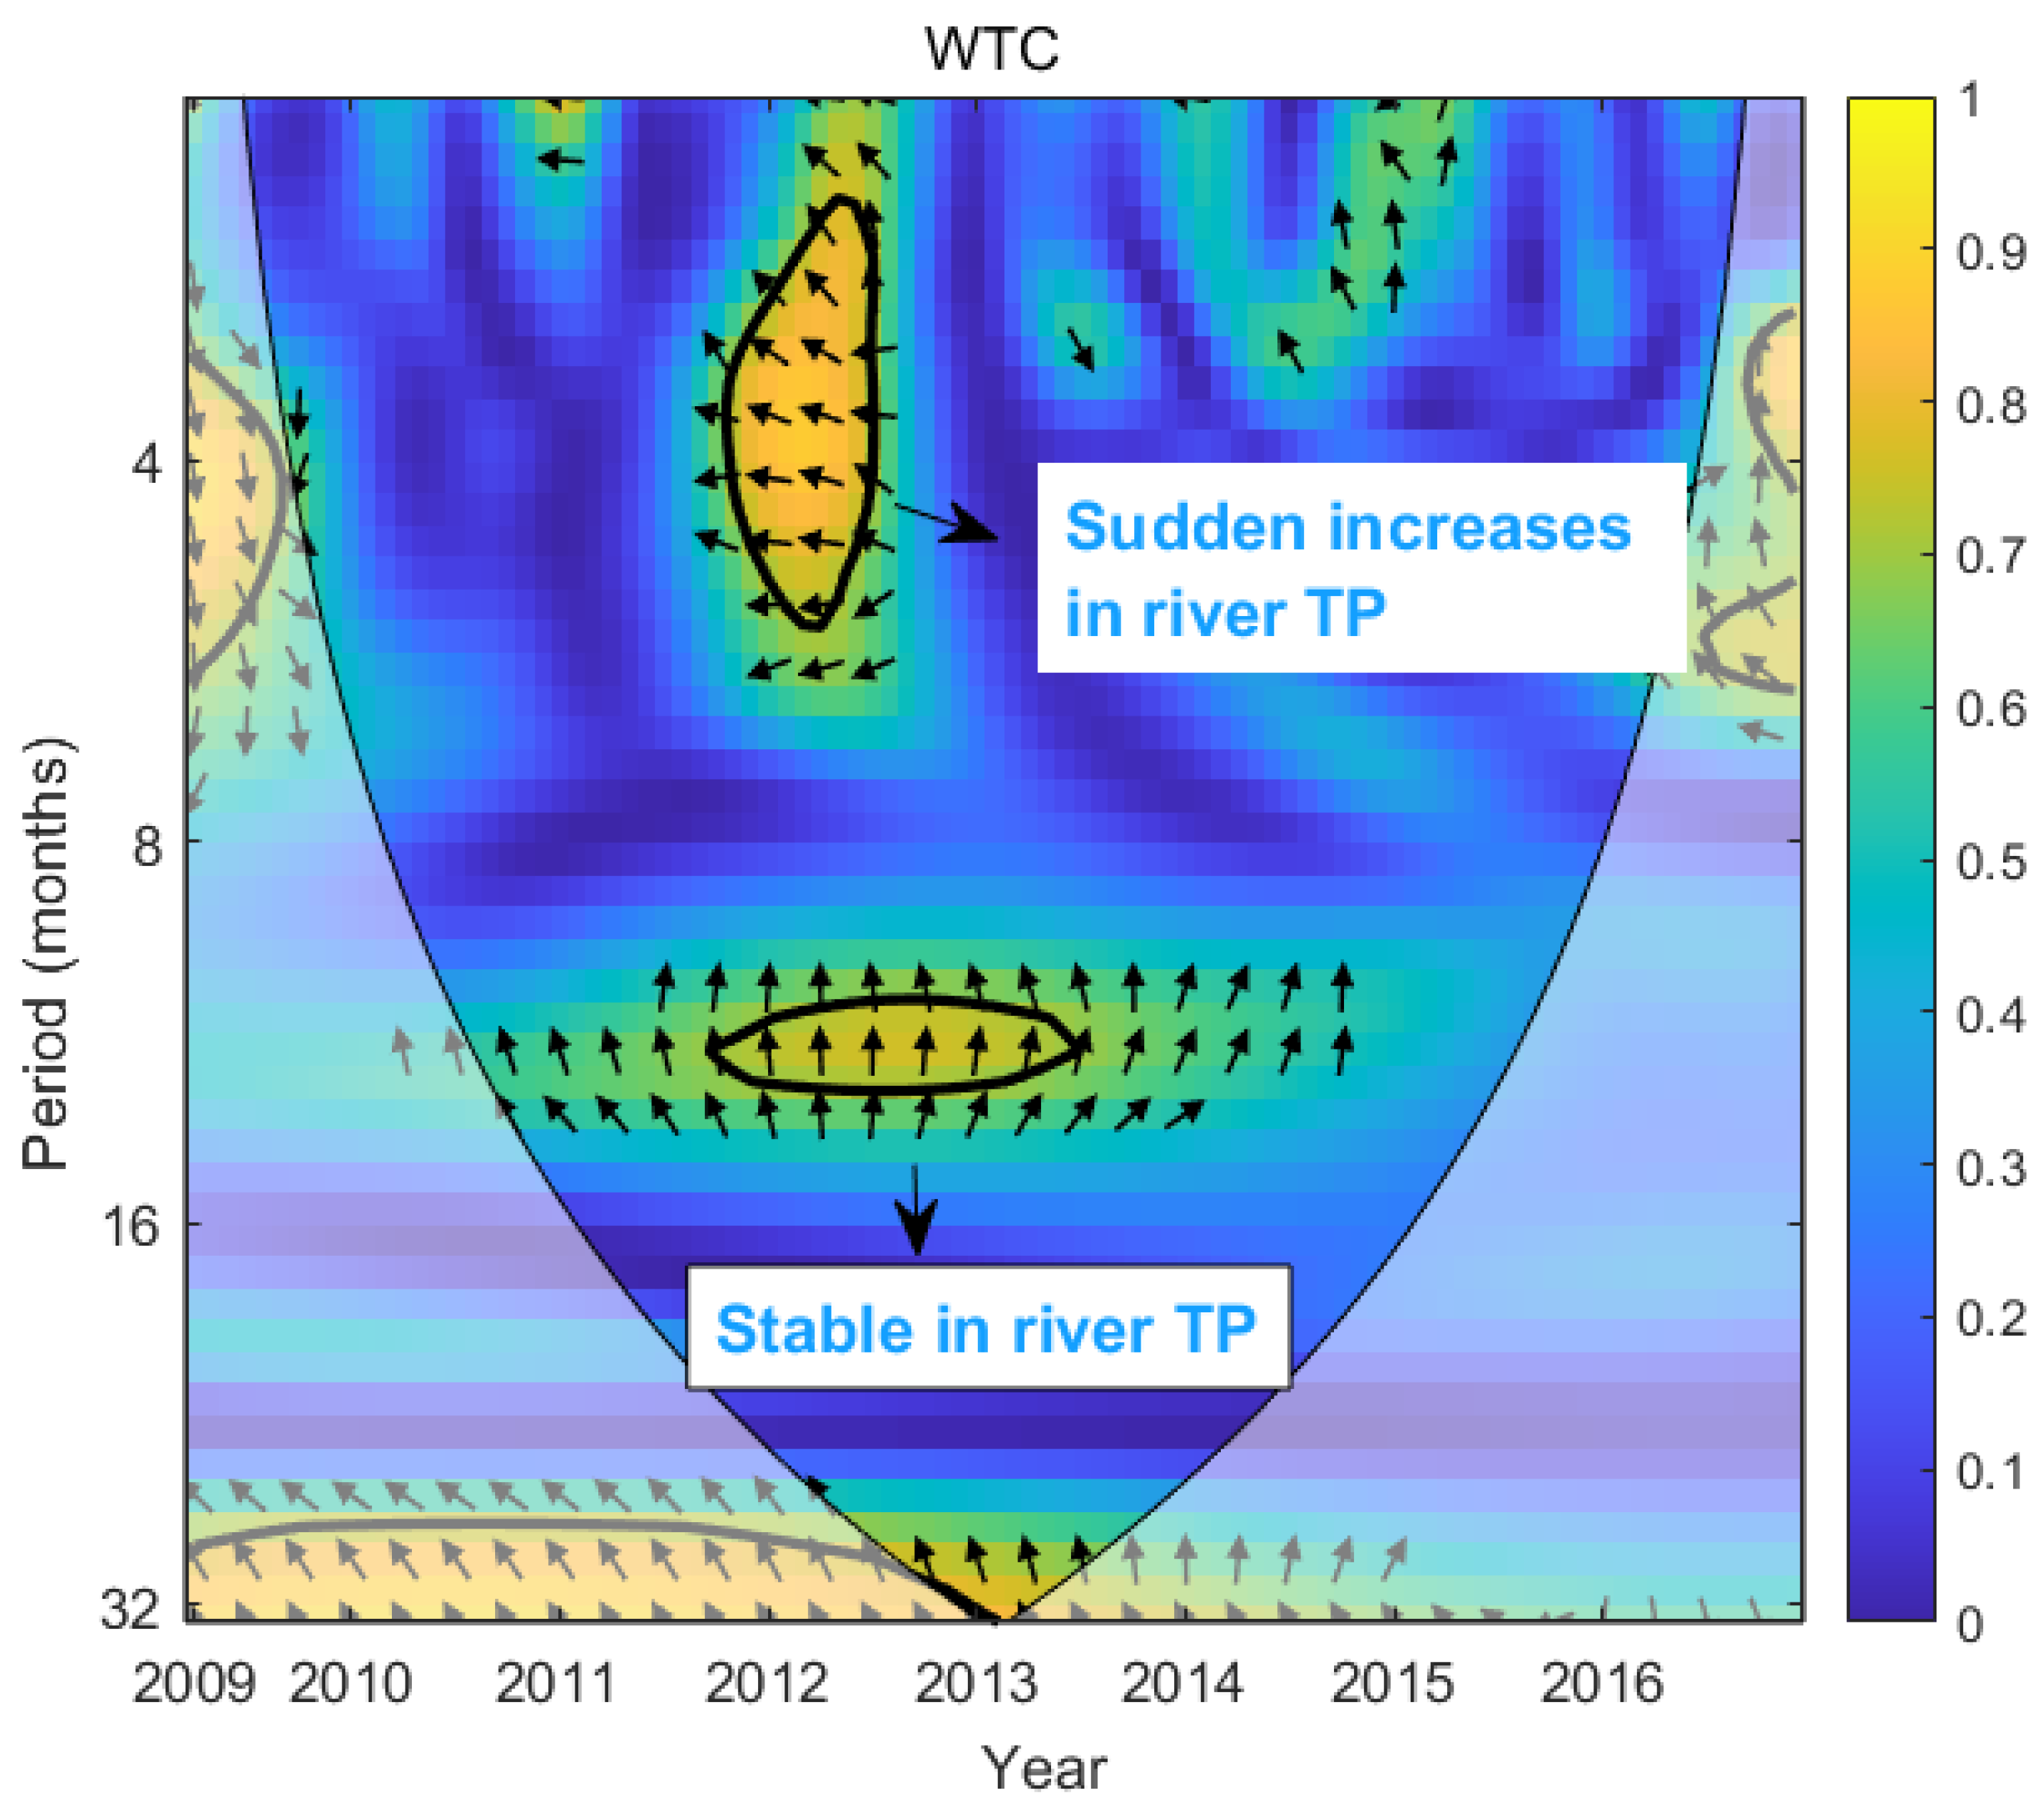
The WTC analysis further confirms these findings by showing high coherence in the same periods (Figure 7). The significant coherence in the 8 to 16-month period range indicates that the annual cycle of TP in the reservoir is closely related to that in the inflowing rivers from 2010 to 2013. This strong coherence suggests a synchronized response to common environmental factors.

3.5.2. Phase Relationship

The XWT (Figure 6) phase arrows provide insight into the phase relationship between the reservoir and inflowing rivers’ TP. During the 8 to 16-month period range, the arrows mostly point to the right, indicating that the two time series are in phase. This means that changes in the inflowing rivers’ TP are closely followed by changes in the reservoir TP without significant lag. The in-phase relationship suggests that the reservoir TP quickly responds to the inflowing rivers’ TP fluctuations, likely due to direct hydraulic connectivity and immediate water mixing processes.
In the shorter 4 to 8-month period range around 2010, the phase arrows show a combination of in-phase and out-of-phase relationships, indicating more complex interactions and potentially different lag times at shorter time scales. This could be due to more localized and transient factors affecting the inflowing rivers’ TP, which may not immediately translate to changes in the reservoir TP.

4. Discussion

4.1. Differences in TP Fluctuation Cycles Between Reservoir and Inflowing Rivers

Comparing the time domain characteristics of TP concentrations in the reservoir and the inflowing rivers reveals similar overall trends, with both showing a marked decrease in TP concentrations starting around 2013. These peaks are influenced by agricultural fertilization, livestock farming, and rainfall, but the river’s response is faster and more direct. Additionally, both the reservoir and the inflowing rivers’ TP concentrations exhibit similar seasonal patterns, with peaks in the summer. However, there are notable differences in the periodicity of TP concentration changes between the reservoir and the inflowing rivers. The periodic fluctuations in the reservoir are concentrated within the 8 to 16-month range, whereas the inflowing rivers show fluctuations within a shorter 4 to 8-month range.
There are three main reasons for these differences in periodicity: (1) Reservoir lag effect: as a large water storage body, the reservoir has a slower water renewal rate compared to the river. This slower rate results in longer lag effects in TP concentration changes, which in turn extend the time scale of its periodic fluctuations. In contrast, rivers, with their faster water flow, exhibit weaker lag effects. This finding aligns with other studies. For instance, S. Zhang et al. [42] noted that large reservoirs, such as the Three Gorges Reservoir, often display longer periodic fluctuations in nutrient concentrations like phosphorus and nitrogen due to slower water renewal rates. Similar results have been observed in lake ecosystems, especially when studying the long-term accumulation and release of nutrients [43]. (2) River’s rapid response: Rivers, with their fast flow and strong hydrodynamics, can respond more quickly to external inputs such as agricultural fertilization, livestock activities, and rainfall. This rapid response results in short-period fluctuations in TP concentrations. For example, Haynes and Naidu [44] demonstrated that rivers in agricultural areas experience sharp TP concentration spikes shortly after rainfall due to surface runoff entering the water body. This short-period fluctuation is also reflected in our study, particularly on the 4 to 8-month time scale, where TP changes in the river were more frequent. (3) Different nutrient accumulation rates: Reservoirs may experience long-term nutrient accumulation effects, which extend the periodic changes in TP concentrations. In contrast, due to their faster flow, rivers can more quickly transport and dilute nutrients, resulting in shorter cycles of TP concentration changes. This phenomenon echoes findings from studies on lakes and reservoirs. For instance, P. Zhang et al. [45] noted that semi-enclosed water bodies often exhibit longer cycles of nutrient concentration changes due to long-term nutrient accumulation. Meanwhile, rivers, with continuous water flow, can rapidly discharge nutrients from the system, reducing long-term accumulation effects [46,47,48].
In comparison with the existing literature, the findings of this study further confirm the differences between reservoirs and rivers in terms of hydrological characteristics and nutrient cycling. For example, research by Y. Li et al. [49] demonstrated that in another large reservoir in southern China, the periodic fluctuations in TP concentrations within the reservoir were significantly longer than those in the inflowing rivers, consistent with our findings in the Shanxi Reservoir. Additionally, studies from Europe and North America have shown that TP concentration fluctuations in rivers, driven by agricultural runoff, tend to exhibit short-period characteristics, which are further corroborated in this study.
However, this study refined the time scales of these periodic differences using wavelet analysis, providing more precise guidance for nutrient management in reservoir–river systems. For instance, considering the long-term accumulation effects in reservoirs, longer monitoring and regulation cycles could be introduced into management strategies. In contrast, for rivers, attention should be given to potential short-term fluctuations, and rapid response strategies should be employed accordingly.

4.2. Sensitive Time Scales of Reservoir TP Response to River TP Under Varying Conditions

The WTC analysis reveals the coherence intensity between the Shanxi Reservoir and its inflowing rivers’ TP over different time scales. During the period from 2010 to 2013, the significant coherence observed in the 8–16-month range indicates strong long-term interactions [50], with annual cycles dominating the relationship between the TP concentrations in the Shanxi Reservoir and its inflowing rivers.
In the shorter 4–8-month cycles, the coherence between the reservoir and its inflowing rivers’ TP shows fluctuations, indicating that the interaction is less stable at this time scale and more influenced by short-term events, such as storms or changes in land use within the watershed.
When there is a sudden increase in rivers’ TP concentration, the reservoir responds rapidly within about two months, with much stronger reactions compared to periods when the rivers’ TP remains stable. This is consistent with the findings of Hughes and Marion [51], who noted that reservoirs often show strong responses to sudden nutrient inputs. This emphasizes the reservoir’s rapid adjustment mechanisms in response to nutrient inflows. However, Garcia et al. [52] found that some reservoirs take longer to respond to sudden events, which contrasts with the quick response seen in the Shanxi Reservoir, likely due to differences in hydrodynamic properties and watershed management strategies [53,54].
Based on the cross wavelet transform power spectrum and wavelet coherence power spectrum results, the most sensitive time scale for the Shanxi Reservoir’s response to changes in river TP is 8–16 months. These long-term interactions suggest that the reservoir’s ability to regulate and buffer TP levels is closely linked to the periodic input of TP from the river [55,56]. This research highlights the reservoir’s capacity to mitigate short-term TP fluctuations on an annual cycle.
In conclusion, this study not only confirms the similarities in nutrient inputs between reservoirs and their inflowing rivers but also reveals significant differences in their short-term and long-term interactions. These differences provide more detailed guidance for future reservoir management, suggesting that differentiated monitoring and management strategies should be applied based on watershed conditions.

4.3. Determination of Monitoring Time Scales

The determination of monitoring time scales is based on a multi-scale analysis of the dynamics of TP concentrations in the Shanxi Reservoir and its inflowing rivers. By using CWT, XWT, and WTC, this study revealed the characteristics of TP concentration changes and their interaction mechanisms at different time scales. The results showed that the periodic fluctuations of TP concentrations in the reservoir mainly occur within the 8 to 16-month range, reflecting interannual variations. This is closely related to the reservoir’s hydrological regulation function and its ability to buffer pollutants. In contrast, the fluctuations of TP concentrations in the inflowing rivers were concentrated within the shorter 4 to 8-month range, indicating that they were more influenced by seasonal hydrological events (such as rainfall and runoff) and short-term pollution inputs. Additionally, WTC showed that from 2010 to 2013, there was significant coherence between the reservoir and river TP concentrations at the 8 to 16-month scale, indicating a long-term interaction. At the shorter 4 to 8-month scale, the coherence was weaker and more variable, suggesting that short-term events (such as storms or land use changes) had a greater impact on river TP concentrations. Notably, when there was a sudden increase in river TP concentrations, the reservoir responded rapidly and strongly within about two months, highlighting the importance of short-term monitoring. Based on these findings, this study recommends using a sampling interval of no more than 8 months when river TP concentrations are relatively stable to capture seasonal variations. During periods of sudden TP concentration increases, the monitoring interval should be reduced to 2 months to track the reservoir’s response in real time. This time–frequency-based monitoring framework not only effectively addresses TP concentration changes under different hydrological conditions but also provides precise decision-making tools for reservoir water quality management. It helps develop targeted pollution control strategies, thereby enhancing the scientific and practical effectiveness of regional water environment management.

5. Conclusions

This study shows that the Shanxi Reservoir’s response to changes in TP concentrations from its inflowing rivers mainly occurs on a long-term time scale (8–16 months). However, when there is a sudden increase in river TP concentrations, the reservoir reacts within 2 months. The reservoir’s TP concentrations exhibit periodicity in the 8–16-month range, while the river TP fluctuates over shorter cycles of 4–8 months. The frequency characteristics of TP in the reservoir and rivers reveal different driving factors: the reservoir’s TP is primarily influenced by annual cycles (>12 months), while the river’s TP is driven by shorter cycles (<8 months). These differing cycles reflect the reservoir and river systems’ distinct responses to external changes. The reservoir responds more rapidly and strongly to sudden increases in river TP, and a monitoring time scale of no more than 2 months is recommended in such cases. When river TP levels are stable, the reservoir is most sensitive to changes over an 8–16-month time scale. Therefore, this study suggests adopting differentiated monitoring strategies based on hydrological conditions, adjusting the monitoring frequency according to the reservoir’s specific situation. This research highlights the time–frequency dynamics of TP in reservoirs and rivers but may have overlooked other environmental and human factors influencing TP levels. Future research could extend the time scale of the data and include more environmental variables to provide a more comprehensive understanding of TP dynamics in reservoirs. Future research will focus on the following directions: (1) quantifying the impact of human activities, such as agricultural runoff and industrial wastewater, on TP concentrations; (2) comparing wavelet analysis with traditional statistical models and machine learning methods to evaluate its applicability; and (3) optimizing multi-scale monitoring strategies to achieve real-time dynamic management of TP concentrations. Despite some limitations, this study offers valuable insights into water quality management in drinking water reservoirs, particularly in adjusting monitoring strategies swiftly and effectively in response to sudden increases in river nutrient levels.

Author Contributions

Conceptualization, Z.L. and J.X.; methodology, Z.L.; validation, M.L., Y.W., J.Z. and Q.W. (Qihua Wang); investigation, Z.L. and Y.W.; writing—original draft preparation, Z.L.; writing—review and editing, Q.W. (Qiqi Wang), S.J. and H.Z.; supervision, J.X. and R.B. All authors have read and agreed to the published version of the manuscript.

Funding

This research was funded by the Science & Technology Fundamental Resources Investigation Program of China [Grant No. 2022FY100404]; and the Fundamental Research Funds for the Central Universities of Hohai University [1065/423178].

Data Availability Statement

All data generated or used during the study appear in the submitted article.

Acknowledgments

In this study, special thanks are extended to the Shanxi Management Bureau of the Wenzhou City Water Resources Bureau for their support in the sampling work.

Conflicts of Interest

The authors declare no conflicts of interest.

Abbreviations

The following abbreviations are used in this manuscript:
TPTotal phosphorus
CWTWavelet transform
XWTCross wavelet transform
WTCWavelet coherence

References

  1. Di Baldassarre, G.; Wanders, N.; AghaKouchak, A.; Kuil, L.; Rangecroft, S.; Veldkamp, T.I.E.; Garcia, M.; Van Oel, P.R.; Breinl, K.; Van Loon, A.F. Water shortages worsened by reservoir effects. Nat. Sustain. 2018, 1, 617–622. [Google Scholar] [CrossRef]
  2. Kong, X.; Ghaffar, S.; Determann, M.; Friese, K.; Jomaa, S.; Mi, C.; Shatwell, T.; Rinke, K.; Rode, M. Reservoir water quality deterioration due to deforestation emphasizes the indirect effects of global change. Water Res. 2022, 221, 118721. [Google Scholar] [CrossRef] [PubMed]
  3. Yan, T.; Shen, S.-L.; Zhou, A. Indices and models of surface water quality assessment: Review and perspectives. Environ. Pollut. 2022, 308, 119611. [Google Scholar] [CrossRef]
  4. Mullungal, M.N.; Thalayappil, S.; Peediyakkathodi, S.; Salas, P.M.; Sujatha, C.H.; Kumar, C.S.R. Vertical Distribution of Phosphorous Fractions and Bioavailability of the Nutrient in the Southern Indian Ocean. Int. J. Environ. Res. 2022, 16, 77. [Google Scholar] [CrossRef]
  5. Varol, M. Spatio-temporal changes in surface water quality and sediment phosphorus content of a large reservoir in Turkey. Environ. Pollut. 2020, 259, 113860. [Google Scholar] [CrossRef]
  6. Wang, T.; Sun, Y.; Wang, T.; Wang, Z.; Hu, S.; Gao, S. Dynamic spatiotemporal change of net anthropogenic phosphorus inputs and its response of water quality in the Liao river basin. Chemosphere 2023, 331, 138757. [Google Scholar] [CrossRef]
  7. Bao, Y.; Zhang, D.; Wang, Y.; Yang, Z.; Hu, P.; Chen, H.; Nie, B.; Liu, X.; Huang, W.; Li, J.; et al. Analysis of nitrogen migration and transformation in the typical deep and large reservoir of the Lancang River—Evidence from nitrogen and oxygen isotopes. J. Hydrol. 2024, 640, 131701. [Google Scholar] [CrossRef]
  8. Yang, N.; Zhang, C.; Wang, L.; Li, Y.; Zhang, W.; Niu, L.; Zhang, H.; Wang, L. Nitrogen cycling processes and the role of multi-trophic microbiota in dam-induced river-reservoir systems. Water Res. 2021, 206, 117730. [Google Scholar] [CrossRef] [PubMed]
  9. Gao, M.; Xu, C.; Yang, S.; Li, B. Investigating the effects of inflow river water quality on lake nutrient-concentration variations: A case study in Gehu Lake, China. Mar. Freshw. Res. 2023, 74, 865–876. [Google Scholar] [CrossRef]
  10. Tang, X.; Li, R.; Wang, D.; Jing, Z.; Zhang, W. Reservoir flood regulation affects nutrient transport through altering water and sediment conditions. Water Res. 2023, 233, 119728. [Google Scholar] [CrossRef]
  11. Ibáñez, C.; Caiola, N.; Barquín, J.; Belmar, O.; Benito-Granell, X.; Casals, F.; Fennessy, S.; Hughes, J.; Palmer, M.; Peñuelas, J.; et al. Ecosystem-level effects of re-oligotrophication and N:P imbalances in rivers and estuaries on a global scale. Glob. Change Biol. 2023, 29, 1248–1266. [Google Scholar] [CrossRef]
  12. Whitney, C.T.; Wollheim, W.M.; Gold, A.J.; Buonpane, J.M. Small Reservoirs as Nitrogen Transformers: Accounting for Seasonal Variability in Inorganic and Organic Nitrogen Processing. J. Geophys. Res. Biogeosci. 2023, 128, e2023JG007635. [Google Scholar] [CrossRef]
  13. Liu, Q.; Jiang, Y.; Huang, X.; Liu, Y.; Guan, M.; Tian, Y. Hydrological conditions can change the effects of major nutrients and dissolved organic matter on phytoplankton community dynamics in a eutrophic river. J. Hydrol. 2024, 628, 130503. [Google Scholar] [CrossRef]
  14. Montefiore, L.R.; Kaplan, D.; Phlips, E.J.; Milbrandt, E.C.; Arias, M.E.; Morrison, E.; Nelson, N.G. Downstream Nutrient Concentrations Depend on Watershed Inputs More Than Reservoir Releases in a Highly Engineered Watershed. Water Resour. Res. 2024, 60, e2023WR035590. [Google Scholar] [CrossRef]
  15. Zhi, X.; Xu, Y.; Chen, L.; Chen, S.; Zhang, Z.; Meng, X.; Shen, Z. The synergistic response between temperature, flow field and nutrients in the tributary disturbed by the Three Gorges reservoir. J. Hydrol. 2024, 639, 131636. [Google Scholar] [CrossRef]
  16. Kim, D.; Lim, J.-H.; Chun, Y.; Nayna, O.K.; Begum, M.S.; Park, J.-H. Phytoplankton nutrient use and CO2 dynamics responding to long-term changes in riverine N and P availability. Water Res. 2021, 203, 117510. [Google Scholar] [CrossRef]
  17. Yang, H.F.; Zhu, Q.Y.; Liu, J.A.; Zhang, Z.L.; Yang, S.L.; Shi, B.W.; Zhang, W.X.; Wang, Y.P. Historic changes in nutrient fluxes from the Yangtze River to the sea: Recent response to catchment regulation and potential linkage to maritime red tides. J. Hydrol. 2023, 617, 129024. [Google Scholar] [CrossRef]
  18. Marcé, R.; Moreno-Ostos, E.; Armengol, J. The role of river inputs on the hypolimnetic chemistry of a productive reservoir: Implications for management of anoxia and total phosphorus internal loading. Lake Reserv. Manag. 2008, 24, 87–98. [Google Scholar] [CrossRef]
  19. Sunardi, S.; Ariyani, M.; Agustian, M.; Withaningsih, S.; Parikesit, P.; Juahir, H.; Ismail, A.; Abdoellah, O.S. Water corrosivity of polluted reservoir and hydropower sustainability. Sci. Rep. 2020, 10, 11110. [Google Scholar] [CrossRef]
  20. Tefs, A.A.G.; Stadnyk, T.A.; Koenig, K.A.; Déry, S.J.; MacDonald, M.K.; Slota, P.; Crawford, J.; Hamilton, M. Simulating river regulation and reservoir performance in a continental-scale hydrologic model. Environ. Model. Softw. 2021, 141, 105025. [Google Scholar] [CrossRef]
  21. Araújo, F.G.; Costa De Azevedo, M.C.; Lima Ferreira, M.D.N. Seasonal changes and spatial variation in the water quality of a eutrophic tropical reservoir determined by the inflowing river. Lake Reserv. Manag. 2011, 27, 343–354. [Google Scholar] [CrossRef]
  22. Carey, C.C.; Hanson, P.C.; Lathrop, R.C.; St. Amand, A.L. Using wavelet analyses to examine variability in phytoplankton seasonal succession and annual periodicity. J. Plankton Res. 2016, 38, 27–40. [Google Scholar] [CrossRef]
  23. Nalley, D.; Adamowski, J.; Khalil, B. Using discrete wavelet transforms to analyze trends in streamflow and precipitation in Quebec and Ontario (1954–2008). J. Hydrol. 2012, 475, 204–228. [Google Scholar] [CrossRef]
  24. Zhang, X.; Chen, Q.; Recknagel, F.; Li, R. Wavelet analysis of time-lags in the response of cyanobacteria growth to water quality conditions in Lake Taihu, China. Ecol. Inform. 2014, 22, 52–57. [Google Scholar] [CrossRef]
  25. Li, W.; Qin, B.; Zhang, Y. Multi-temporal scale characteristics of algae biomass and selected environmental parameters based on wavelet analysis in Lake Taihu, China. Hydrobiologia 2015, 747, 189–199. [Google Scholar] [CrossRef]
  26. Yin, J.; Xia, J.; Xia, Z.; Cai, W.; Liu, Z.; Xu, K.; Wang, Y.; Zhang, R.; Dong, X. Temporal Variation and Spatial Distribution in the Water Environment Helps Explain Seasonal Dynamics of Zooplankton in River-Type Reservoir. Sustainability 2022, 14, 13719. [Google Scholar] [CrossRef]
  27. Zhu, S.; Dong, Z.; Yang, B.; Zeng, G.; Liu, Y.; Zhou, Y.; Meng, J.; Wu, S.; Shao, Y.; Yang, J.; et al. Spatial Distribution, Source Identification, and Potential Ecological Risk Assessment of Heavy Metal in Surface Sediments from River-Reservoir System in the Feiyun River Basin, China. Int. J. Environ. Res. Public Health 2022, 19, 14944. [Google Scholar] [CrossRef]
  28. Yates, F. The Analysis of Multiple Classifications with Unequal Numbers in the Different Classes. J. Am. Stat. Assoc. 1934, 29, 51–66. [Google Scholar] [CrossRef]
  29. Zhang, C.; Yan, Q.; Kuczyńska-Kippen, N.; Gao, X. An Ensemble Kalman Filter approach to assess the effects of hydrological variability, water diversion, and meteorological forcing on the total phosphorus concentration in a shallow reservoir. Sci. Total Environ. 2020, 724, 138215. [Google Scholar] [CrossRef]
  30. Weigand, S.; Bol, R.; Reichert, B.; Graf, A.; Wiekenkamp, I.; Stockinger, M.; Luecke, A.; Tappe, W.; Bogena, H.; Puetz, T.; et al. Spatiotemporal Analysis of Dissolved Organic Carbon and Nitrate in Waters of a Forested Catchment Using Wavelet Analysis. Vadose Zone J. 2017, 16, 1–2. [Google Scholar] [CrossRef]
  31. Yuan, W.; Liu, Q.; Song, S.; Lu, Y.; Yang, S.; Fang, Z.; Shi, Z. A climate-water quality assessment framework for quantifying the contributions of climate change and human activities to water quality variations. J. Environ. Manag. 2023, 333, 117441. [Google Scholar] [CrossRef]
  32. Guo, W.; He, N.; Ban, X.; Wang, H. Multi-scale variability of hydrothermal regime based on wavelet analysis—The middle reaches of the Yangtze River, China. Sci. Total Environ. 2022, 841, 156598. [Google Scholar] [CrossRef] [PubMed]
  33. Li, Y.; Wen, Y.; Lai, H.; Zhao, Q. Drought response analysis based on cross wavelet transform and mutual entropy. Alex. Eng. J. 2020, 59, 1223–1231. [Google Scholar] [CrossRef]
  34. Yerdelen, C.; Abdelkader, M.; Eris, E. Assessment of drought in SPI series using continuous wavelet analysis for Gediz Basin, Turkey. Atmos. Res. 2021, 260, 105687. [Google Scholar] [CrossRef]
  35. Dong, H.; Yu, G.; Lin, T.; Li, Y. An energy-concentrated wavelet transform for time-frequency analysis of transient signal. Signal Process. 2023, 206, 108934. [Google Scholar] [CrossRef]
  36. Robinson, K.-L.; Bogena, H.R.; Wang, Q.; Cammeraat, E.; Bol, R. Effects of deforestation on dissolved organic carbon and nitrate in catchment stream water revealed by wavelet analysis. Front. Water 2022, 4, 1003693. [Google Scholar] [CrossRef]
  37. Wang, Q.; Qu, Y.; Robinson, K.-L.; Bogena, H.; Graf, A.; Vereecken, H.; Tietema, A.; Bol, R. Deforestation alters dissolved organic carbon and sulfate dynamics in a mountainous headwater catchment—A wavelet analysis. Front. For. Glob. Chang. 2022, 5, 1044447. [Google Scholar] [CrossRef]
  38. Grinsted, A.; Moore, J.C.; Jevrejeva, S. Application of the cross wavelet transform and wavelet coherence to geophysical time series. Nonlinear Process. Geophys. 2004, 11, 561–566. [Google Scholar] [CrossRef]
  39. A Practical Guide to Wavelet Analysis in: Bulletin of the American Meteorological Society Volume 79 Issue 1. 1998. Available online: https://journals.ametsoc.org/view/journals/bams/79/1/1520-0477_1998_079_0061_apgtwa_2_0_co_2.xml (accessed on 17 February 2025).
  40. Damos, P.; Caballero, P. Detecting seasonal transient correlations between populations of the West Nile Virus vector Culex sp. and temperatures with wavelet coherence analysis. Ecol. Inform. 2021, 61, 101216. [Google Scholar] [CrossRef]
  41. Broday, D.M. Studying the Time Scale Dependence of Environmental Variables Predictability Using Fractal Analysis. Environ. Sci. Technol. 2010, 44, 4629–4634. [Google Scholar] [CrossRef]
  42. Zhang, S.; Zeng, Y.; Zha, W.; Huo, S.; Niu, L.; Zhang, X. Spatiotemporal variation of phosphorus in the Three Gorges Reservoir: Impact of upstream cascade reservoirs. Environ. Sci. Pollut. Res. 2022, 29, 56739–56749. [Google Scholar] [CrossRef] [PubMed]
  43. Howarth, R.W.; Chan, F.; Swaney, D.P.; Marino, R.M.; Hayn, M. Role of external inputs of nutrients to aquatic ecosystems in determining prevalence of nitrogen vs. phosphorus limitation of net primary productivity. Biogeochemistry 2021, 154, 293–306. [Google Scholar] [CrossRef]
  44. Haynes, R.J.; Naidu, R. Phosphorus—An essential input for agriculture yet a key pollutant of surface waters. In Inorganic Contaminants and Radionuclides; Elsevier: Amsterdam, The Netherlands, 2024; pp. 405–426. ISBN 978-0-323-90400-1. [Google Scholar]
  45. Zhang, P.; Peng, C.; Zhang, J.; Zhang, J.; Chen, J.; Zhao, H. Long-Term Harmful Algal Blooms and Nutrients Patterns Affected by Climate Change and Anthropogenic Pressures in the Zhanjiang Bay, China. Front. Mar. Sci. 2022, 9, 849819. [Google Scholar] [CrossRef]
  46. Hejzlar, J.; Šámalová, K.; Boers, P.; Kronvang, B. Modelling Phosphorus Retention in Lakes and Reservoirs. Water Air Soil Pollut. Focus 2006, 6, 487–494. [Google Scholar] [CrossRef]
  47. Li, C.; Zhang, P.; Zhu, G.; Chen, C.; Wang, Y.; Zhu, M.; Xu, H.; Jiang, C.; Zou, W.; Shi, P.; et al. Dynamics of nitrogen and phosphorus profile and its driving forces in a subtropical deep reservoir. Environ. Sci. Pollut. Res. 2022, 29, 27738–27748. [Google Scholar] [CrossRef] [PubMed]
  48. Vaughan, M.C.H.; Bowden, W.B.; Shanley, J.B.; Vermilyea, A.; Wemple, B.; Schroth, A.W. Using in situ UV-Visible spectrophotometer sensors to quantify riverine phosphorus partitioning and concentration at a high frequency. Limnol. Ocean. Methods 2018, 16, 840–855. [Google Scholar] [CrossRef]
  49. Li, Y.; Zhang, Y.; Shi, K.; Zhu, G.; Zhou, Y.; Zhang, Y.; Guo, Y. Monitoring spatiotemporal variations in nutrients in a large drinking water reservoir and their relationships with hydrological and meteorological conditions based on Landsat 8 imagery. Sci. Total Environ. 2017, 599–600, 1705–1717. [Google Scholar] [CrossRef]
  50. Jiang, J.; Zheng, Y.; Pang, T.; Wang, B.; Chachan, R.; Tian, Y. A comprehensive study on spectral analysis and anomaly detection of river water quality dynamics with high time resolution measurements. J. Hydrol. 2020, 589, 125175. [Google Scholar] [CrossRef]
  51. Hughes, S.E.; Marion, J.W. Cyanobacteria Growth in Nitrogen- & Phosphorus-Spiked Water from a Hypereutrophic Reservoir in Kentucky, USA. J. Environ. Prot. 2021, 12, 75–89. [Google Scholar] [CrossRef]
  52. Garcia, M.; Ridolfi, E.; Di Baldassarre, G. The interplay between reservoir storage and operating rules under evolving conditions. J. Hydrol. 2020, 590, 125270. [Google Scholar] [CrossRef]
  53. Dai, H.; Mao, J.; Jiang, D.; Wang, L. Longitudinal Hydrodynamic Characteristics in Reservoir Tributary Embayments and Effects on Algal Blooms. PLoS ONE 2013, 8, e68186. [Google Scholar] [CrossRef] [PubMed]
  54. Song, Y. Hydrodynamic impacts on algal blooms in reservoirs and bloom mitigation using reservoir operation strategies: A review. J. Hydrol. 2023, 620, 129375. [Google Scholar] [CrossRef]
  55. Lu, T.; Chen, N.; Duan, S.; Chen, Z.; Huang, B. Hydrological controls on cascade reservoirs regulating phosphorus retention and downriver fluxes. Environ. Sci. Pollut. Res. 2016, 23, 24166–24177. [Google Scholar] [CrossRef]
  56. Withers, P.J.A.; Jarvie, H.P. Delivery and cycling of phosphorus in rivers: A review. Sci. Total Environ. 2008, 400, 379–395. [Google Scholar] [CrossRef] [PubMed]
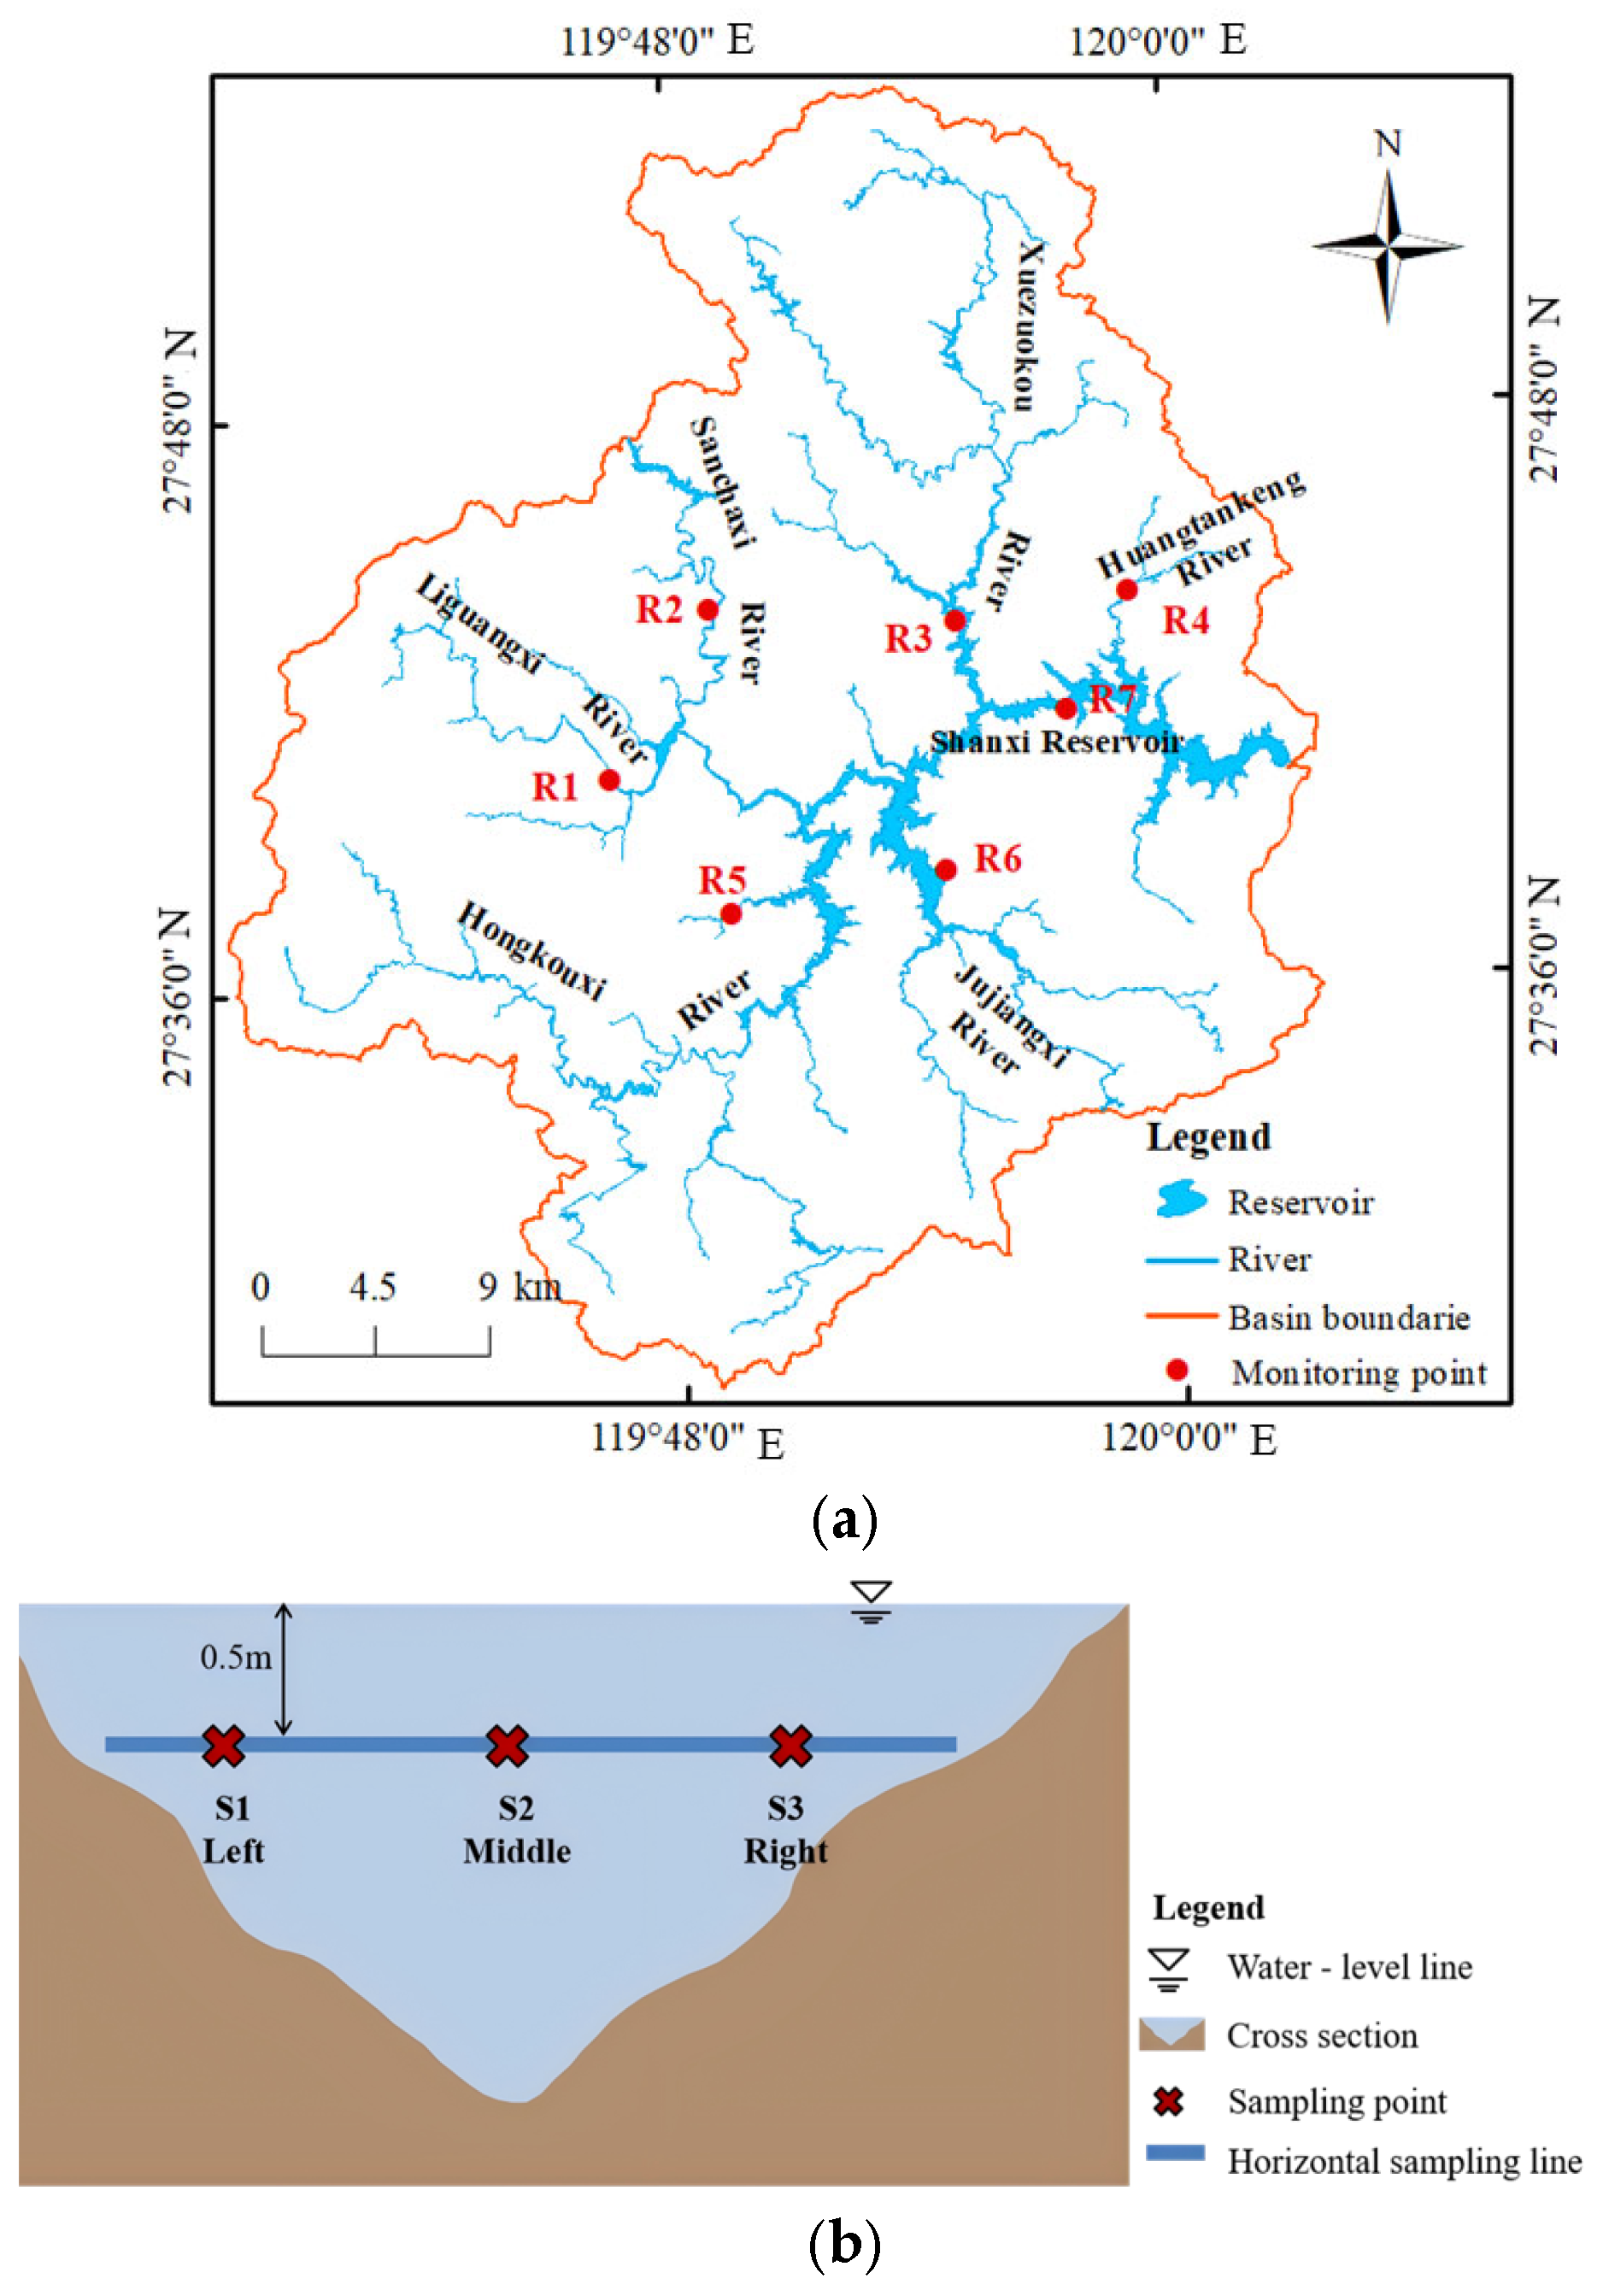
Figure 1. Map of the Shanxi Reservoir and its inflowing rivers. (a) Monitoring sites in Shanxi Reservoir and its inflowing rivers. (b) Monitoring cross-section in Shanxi Reservoir and its inflowing rivers.
Water 17 00712 g001
Figure 2. The schematic framework of the methodology used in this study.
Water 17 00712 g002
Figure 3. Concentration variation in monthly TP in the Shanxi Reservoir and its inflowing rivers.
Water 17 00712 g003
Figure 4. Wavelet power spectrum of TP concentration variations in the Shanxi Reservoir (the black circle marks a specific time-frequency point in the scalogram, highlighting a key signal feature and indicating concentrated signal energy at that time and frequency).
Water 17 00712 g004
Figure 5. Wavelet power spectrum of TP concentration variations in the inflowing rivers (the black circle marks a specific time-frequency point in the scalogram, highlighting a key signal feature and indicating concentrated signal energy at that time and frequency).
Water 17 00712 g005
Figure 6. Cross wavelet transform between TP concentrations in the Shanxi Reservoir and its inflowing rivers (January 2009–December 2016) on a monthly basis. (Thick contour lines indicate the 5% significance level against red noise. Arrows pointing from left to right indicate a positive correlation between the reservoir and inflowing rivers’ TP concentrations, while arrows pointing from right to left indicate a negative correlation. Arrows pointing straight down indicate that the reservoir TP concentration leads the inflowing rivers’ TP concentration by 90°, and arrows pointing straight up indicate that the reservoir TP concentration lags behind the inflowing rivers’ TP concentration by 90°. The black circle marks a specific time-frequency point in the scalogram, highlighting a key signal feature and indicating concentrated signal energy at that time and frequency).
Water 17 00712 g006
Figure 7. Wavelet coherence between TP concentrations in the Shanxi Reservoir and its inflowing rivers (January 2009–December 2016) on a monthly basis. (Thick contour lines indicate the 5% significance level against red noise. Arrows pointing from left to right indicate a positive correlation between the reservoir and inflowing rivers’ TP concentrations, while arrows pointing from right to left indicate a negative correlation. Arrows pointing straight down indicate that the reservoir TP concentration leads the inflowing rivers’ TP concentration by 90°, and arrows pointing straight up indicate that the reservoir TP concentration lags behind the inflowing rivers’ TP concentration by 90°. The black circle marks a specific time-frequency point in the scalogram, highlighting a key signal feature and indicating concentrated signal energy at that time and frequency).
Water 17 00712 g007
Table 1. Annual inflow rivers’ runoff and weight.
Site NumberName of RiverAnnual Runoff Volume
(m3/s)
Weight Coefficient
R1Liguangxi River1.770.12
R2Sanchaxi River3.130.21
R3Xuezuokou River3.370.22
R4Huangtankeng River0.630.04
R5Hongkouxi River4.180.28
R6Jujiangxi River2.040.13
Disclaimer/Publisher’s Note: The statements, opinions and data contained in all publications are solely those of the individual author(s) and contributor(s) and not of MDPI and/or the editor(s). MDPI and/or the editor(s) disclaim responsibility for any injury to people or property resulting from any ideas, methods, instructions or products referred to in the content.