


Numerical Investigation into the Runout Dynamics of Reservoir Landslides: Insights from the Yanguan Landslide


Abstract
1. Introduction
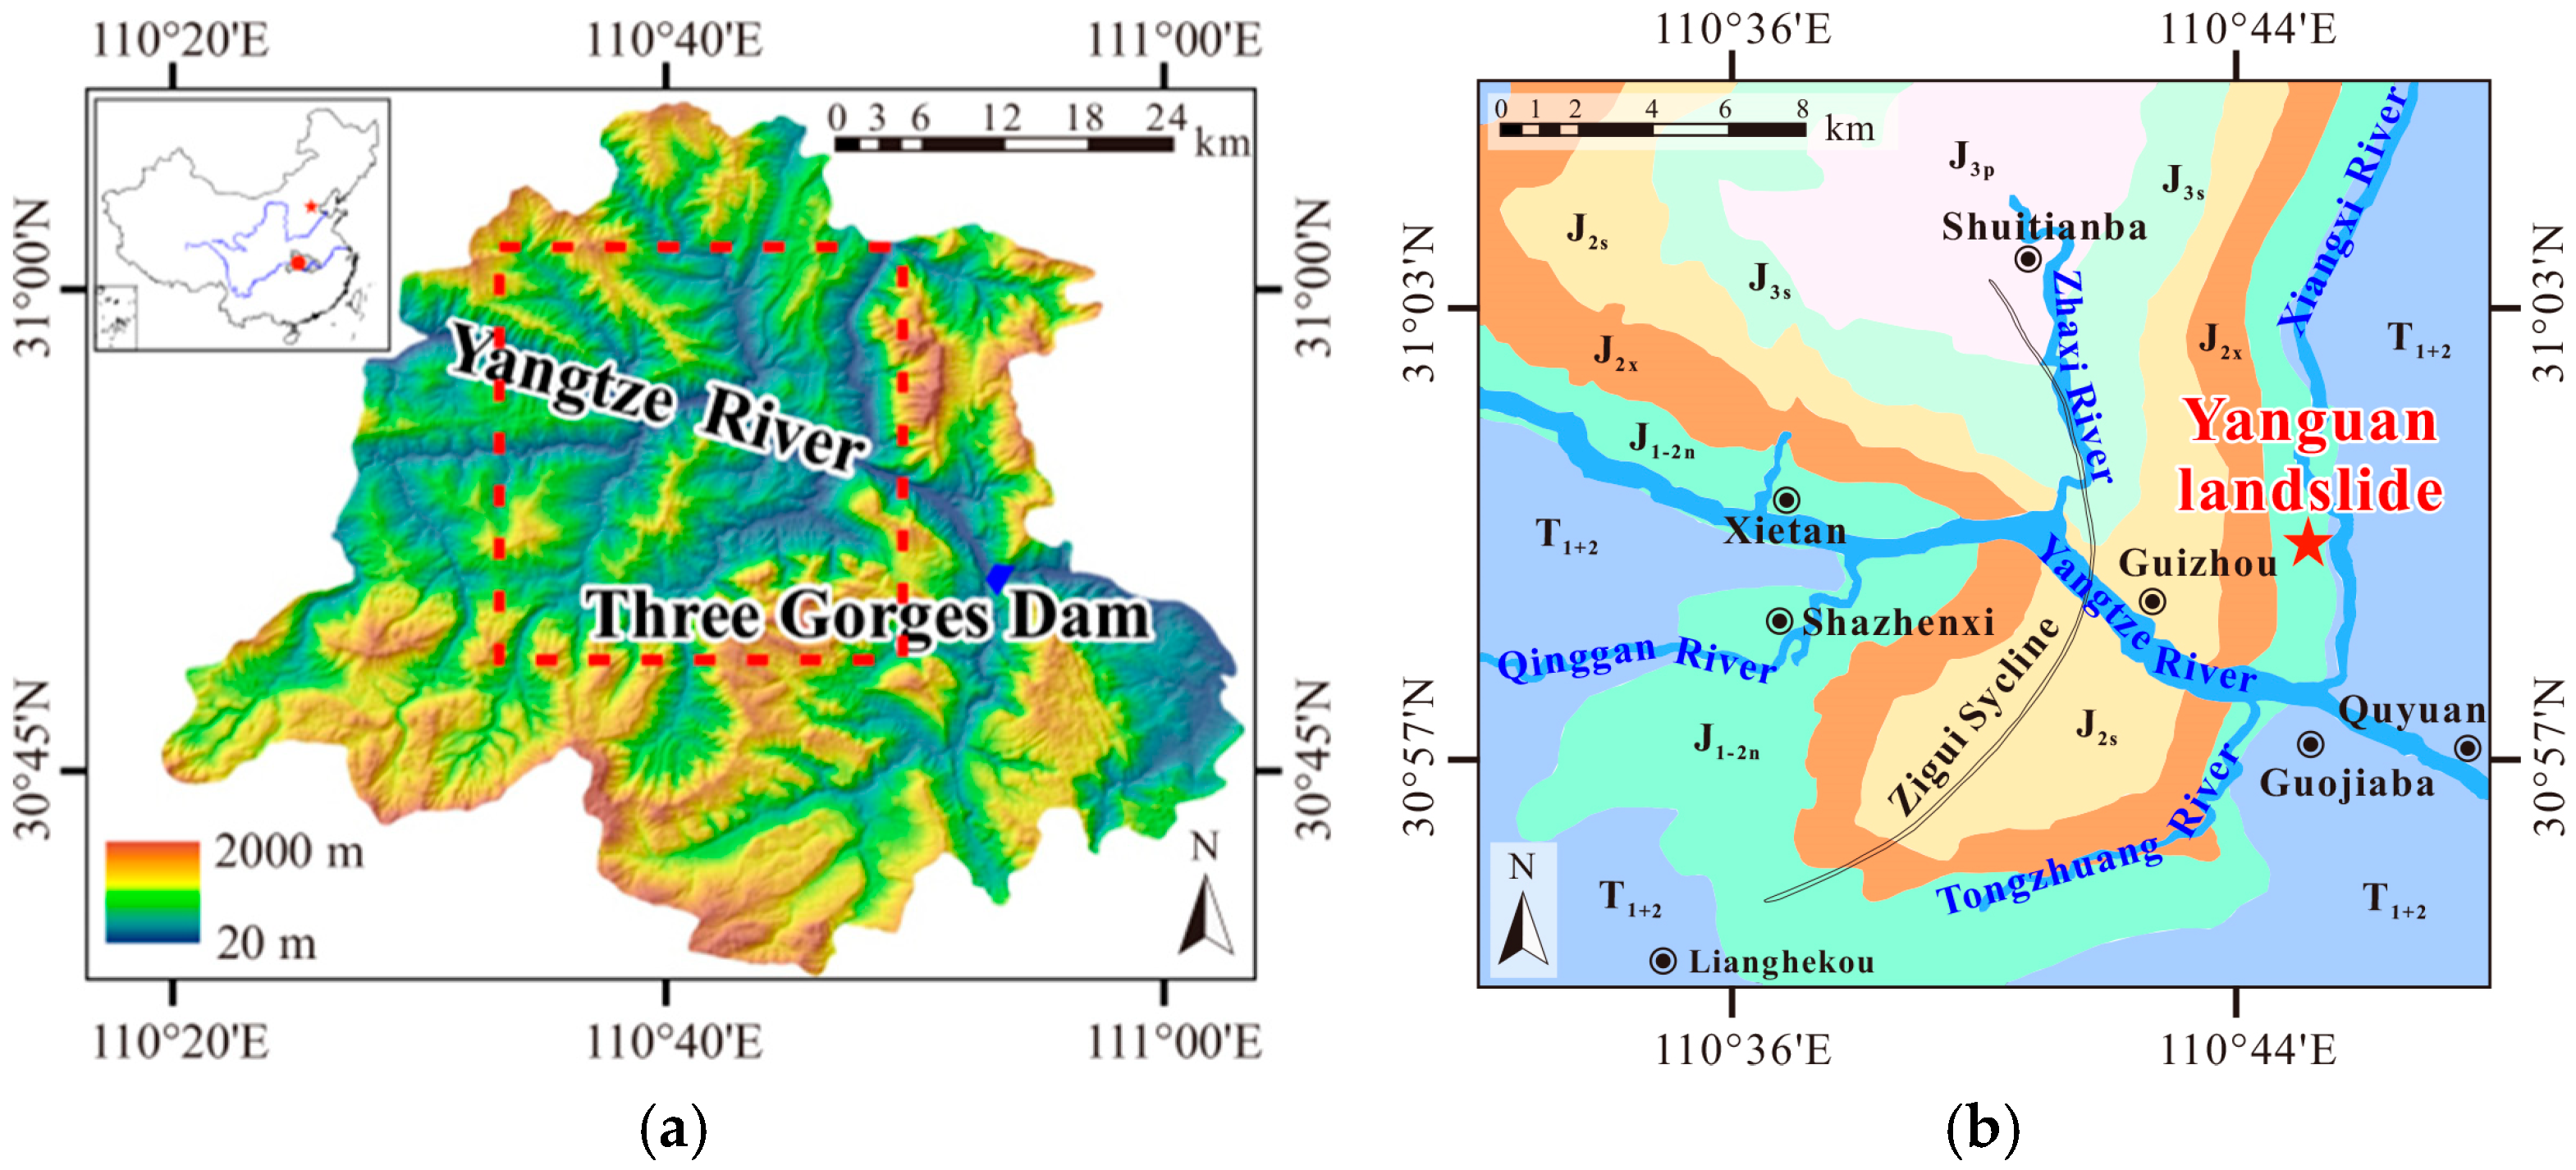
2. Study Area
2.1. Overview of the Research Area
2.2. Geological Conditions
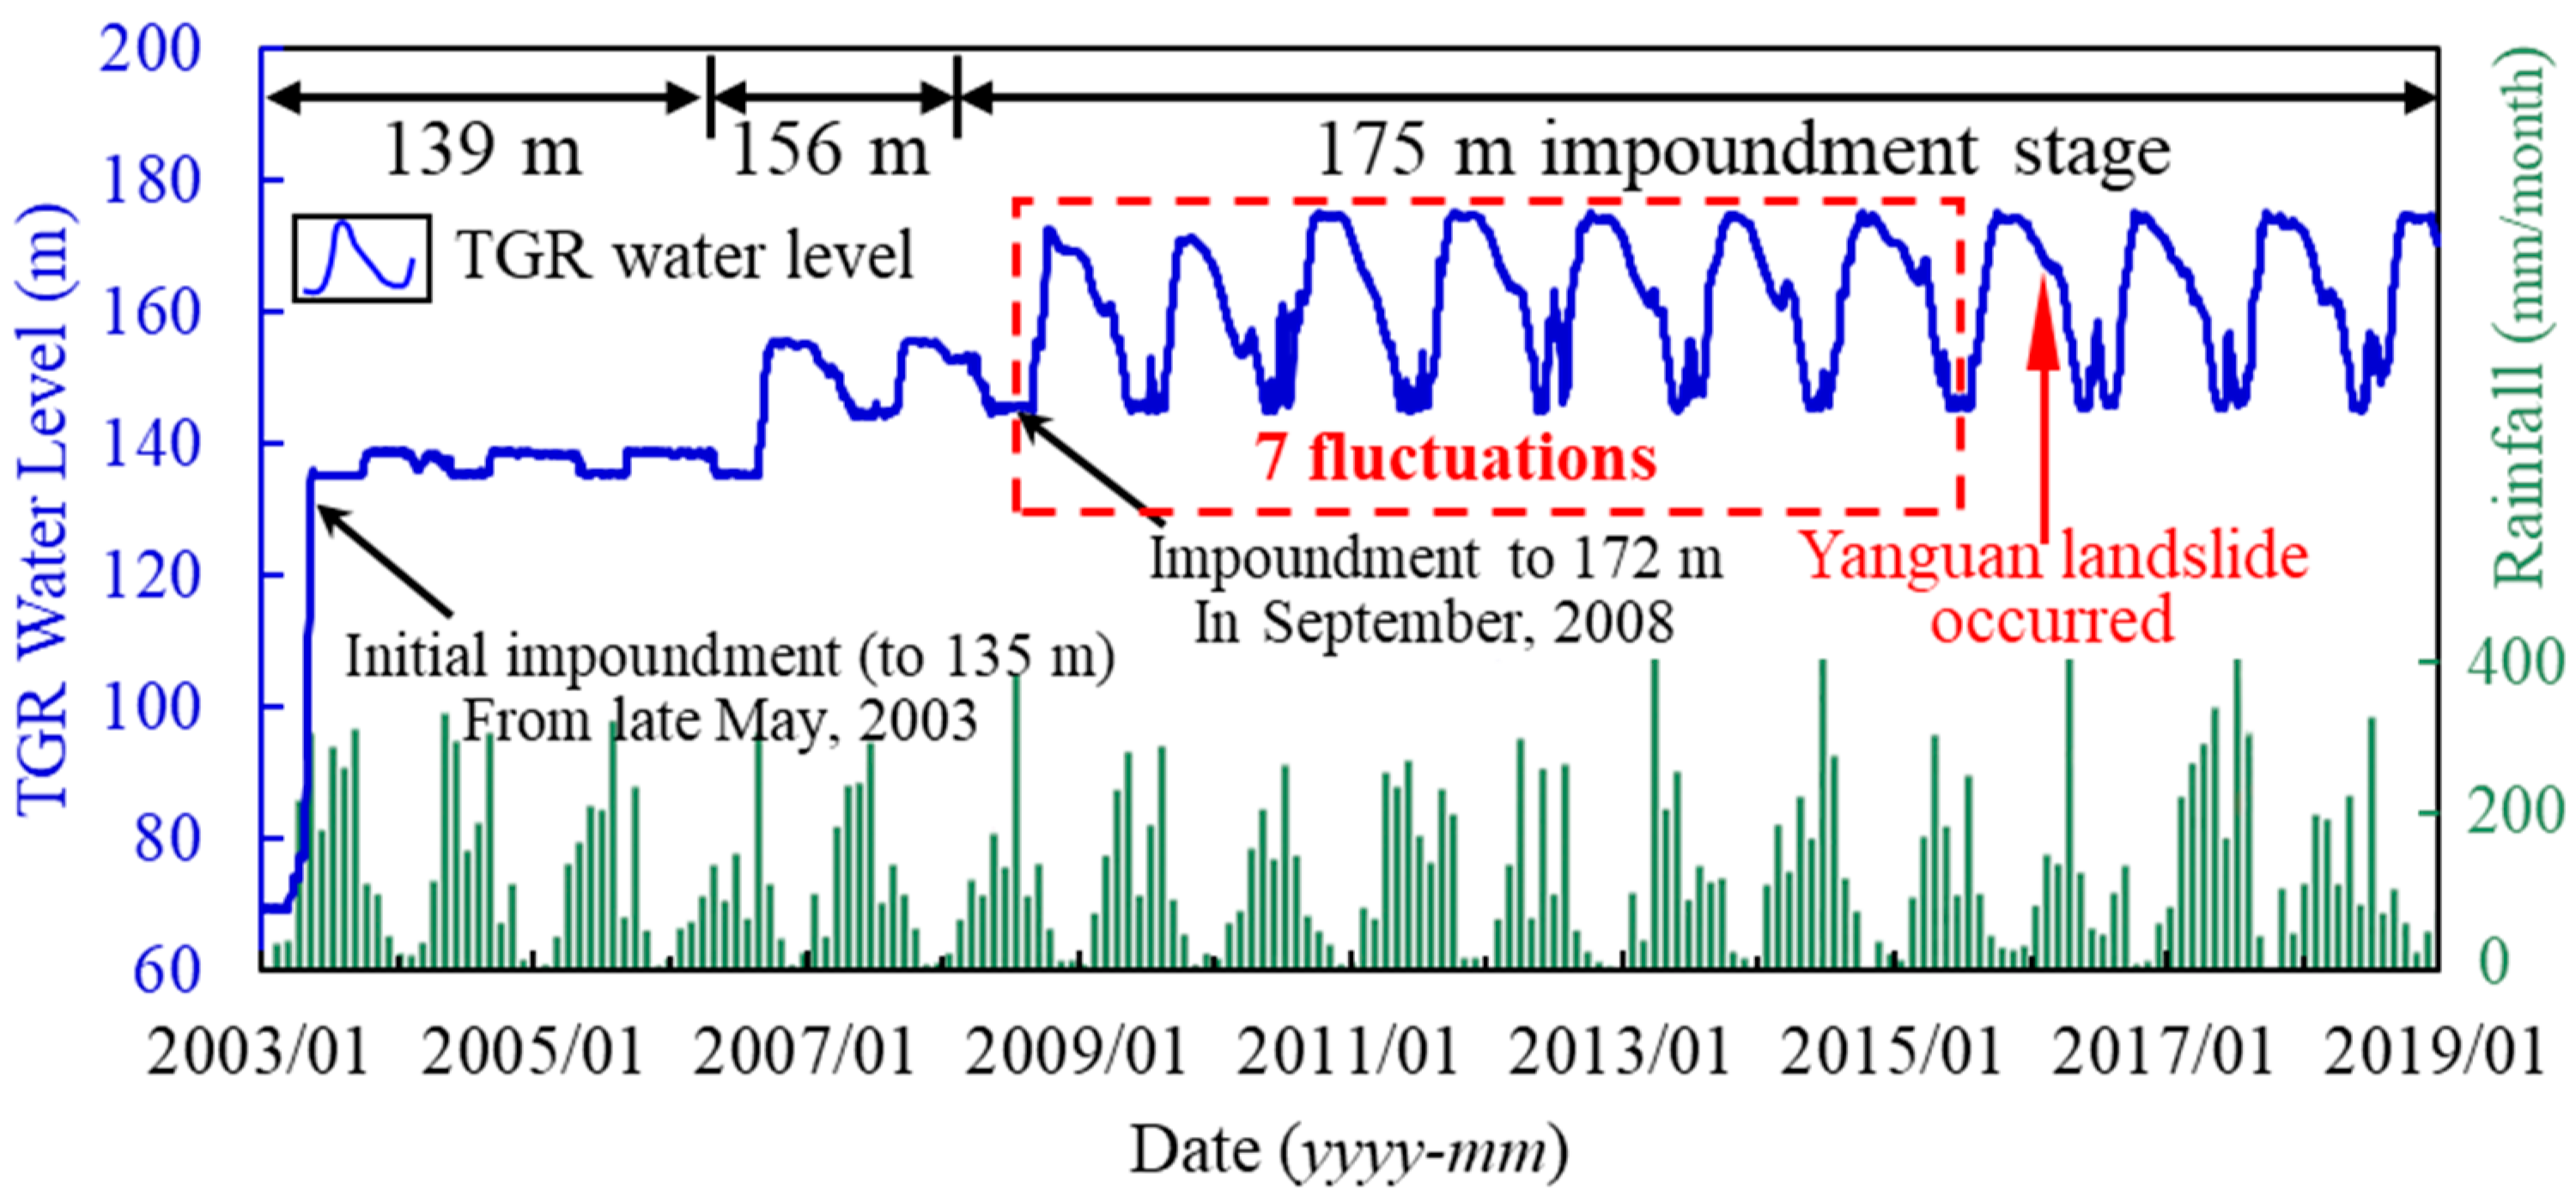
2.3. Meteorological and Hydrological Settings
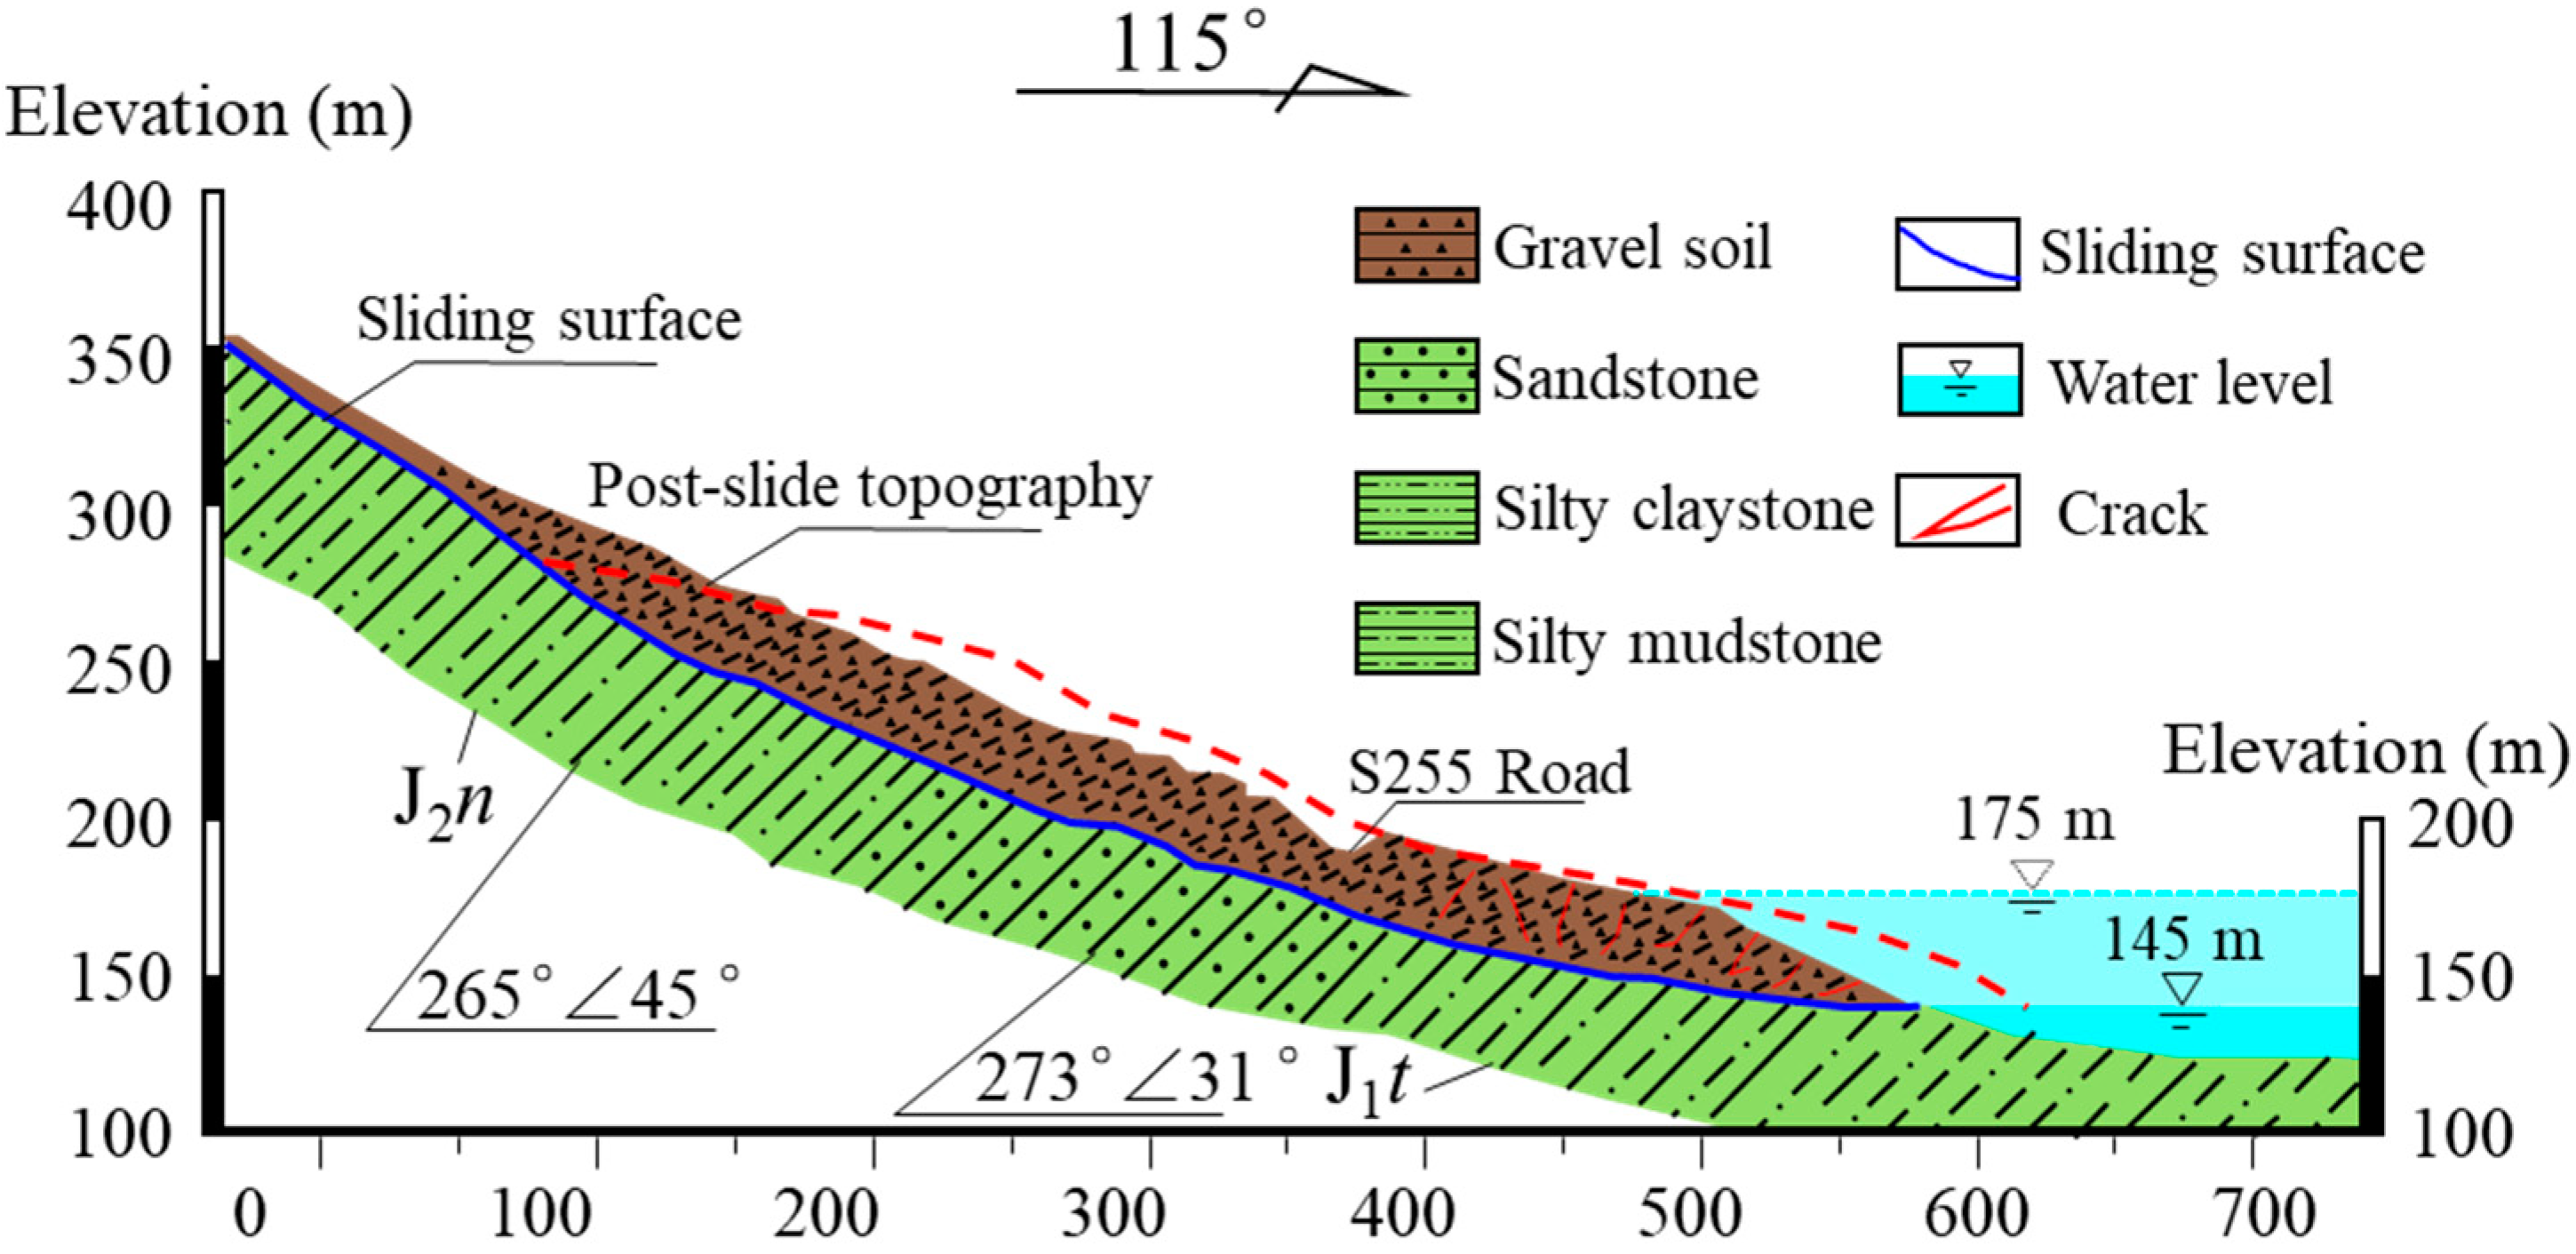
2.4. Failure Process and Mechanism
3. Methodology
3.1. Numerical Model of the Yanguan Landslide
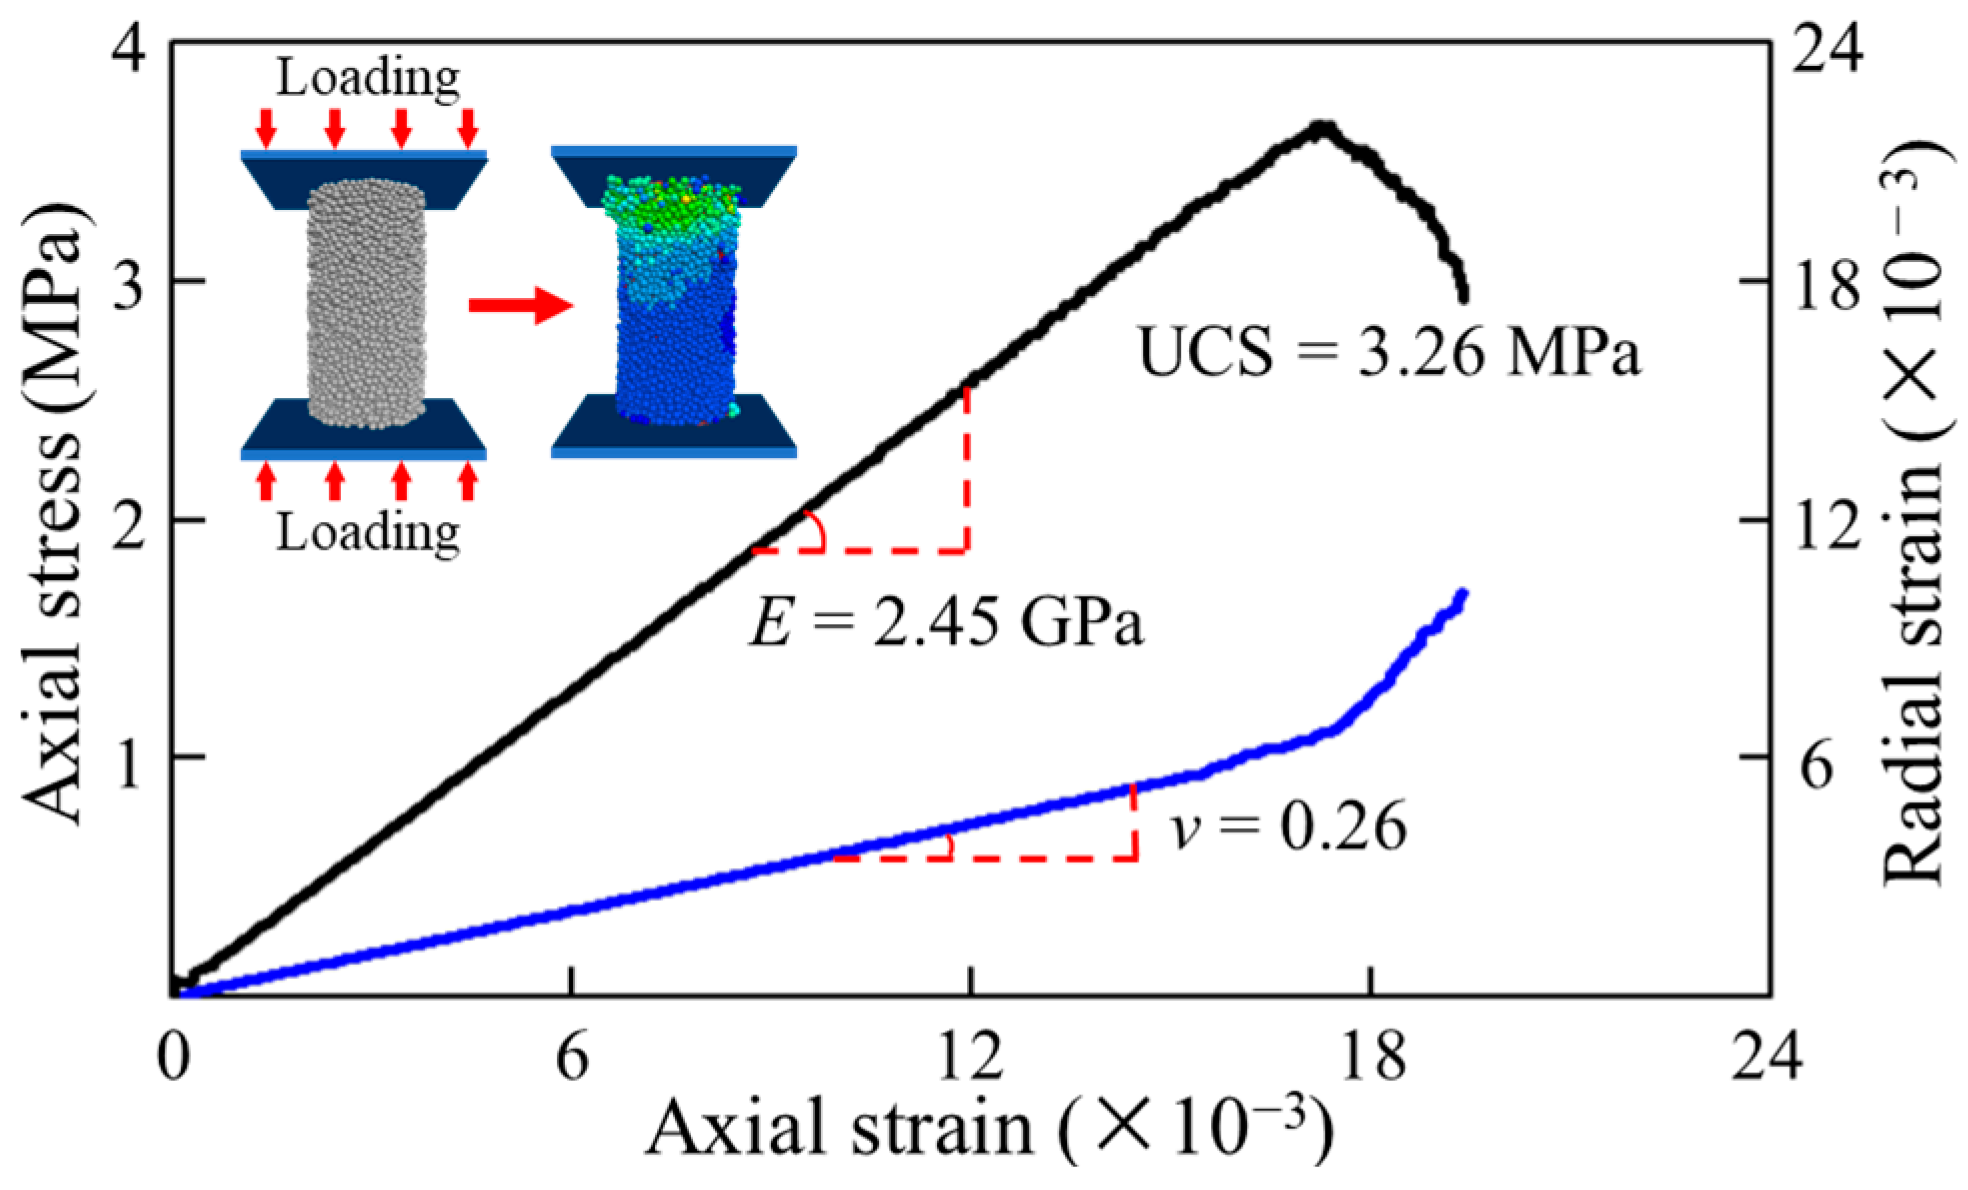
3.2. Determination of the Modeling Parameters of the Built PFC Model
4. Results
4.1. Effectiveness of the Built Numerical Model of the Yanguan Landslide
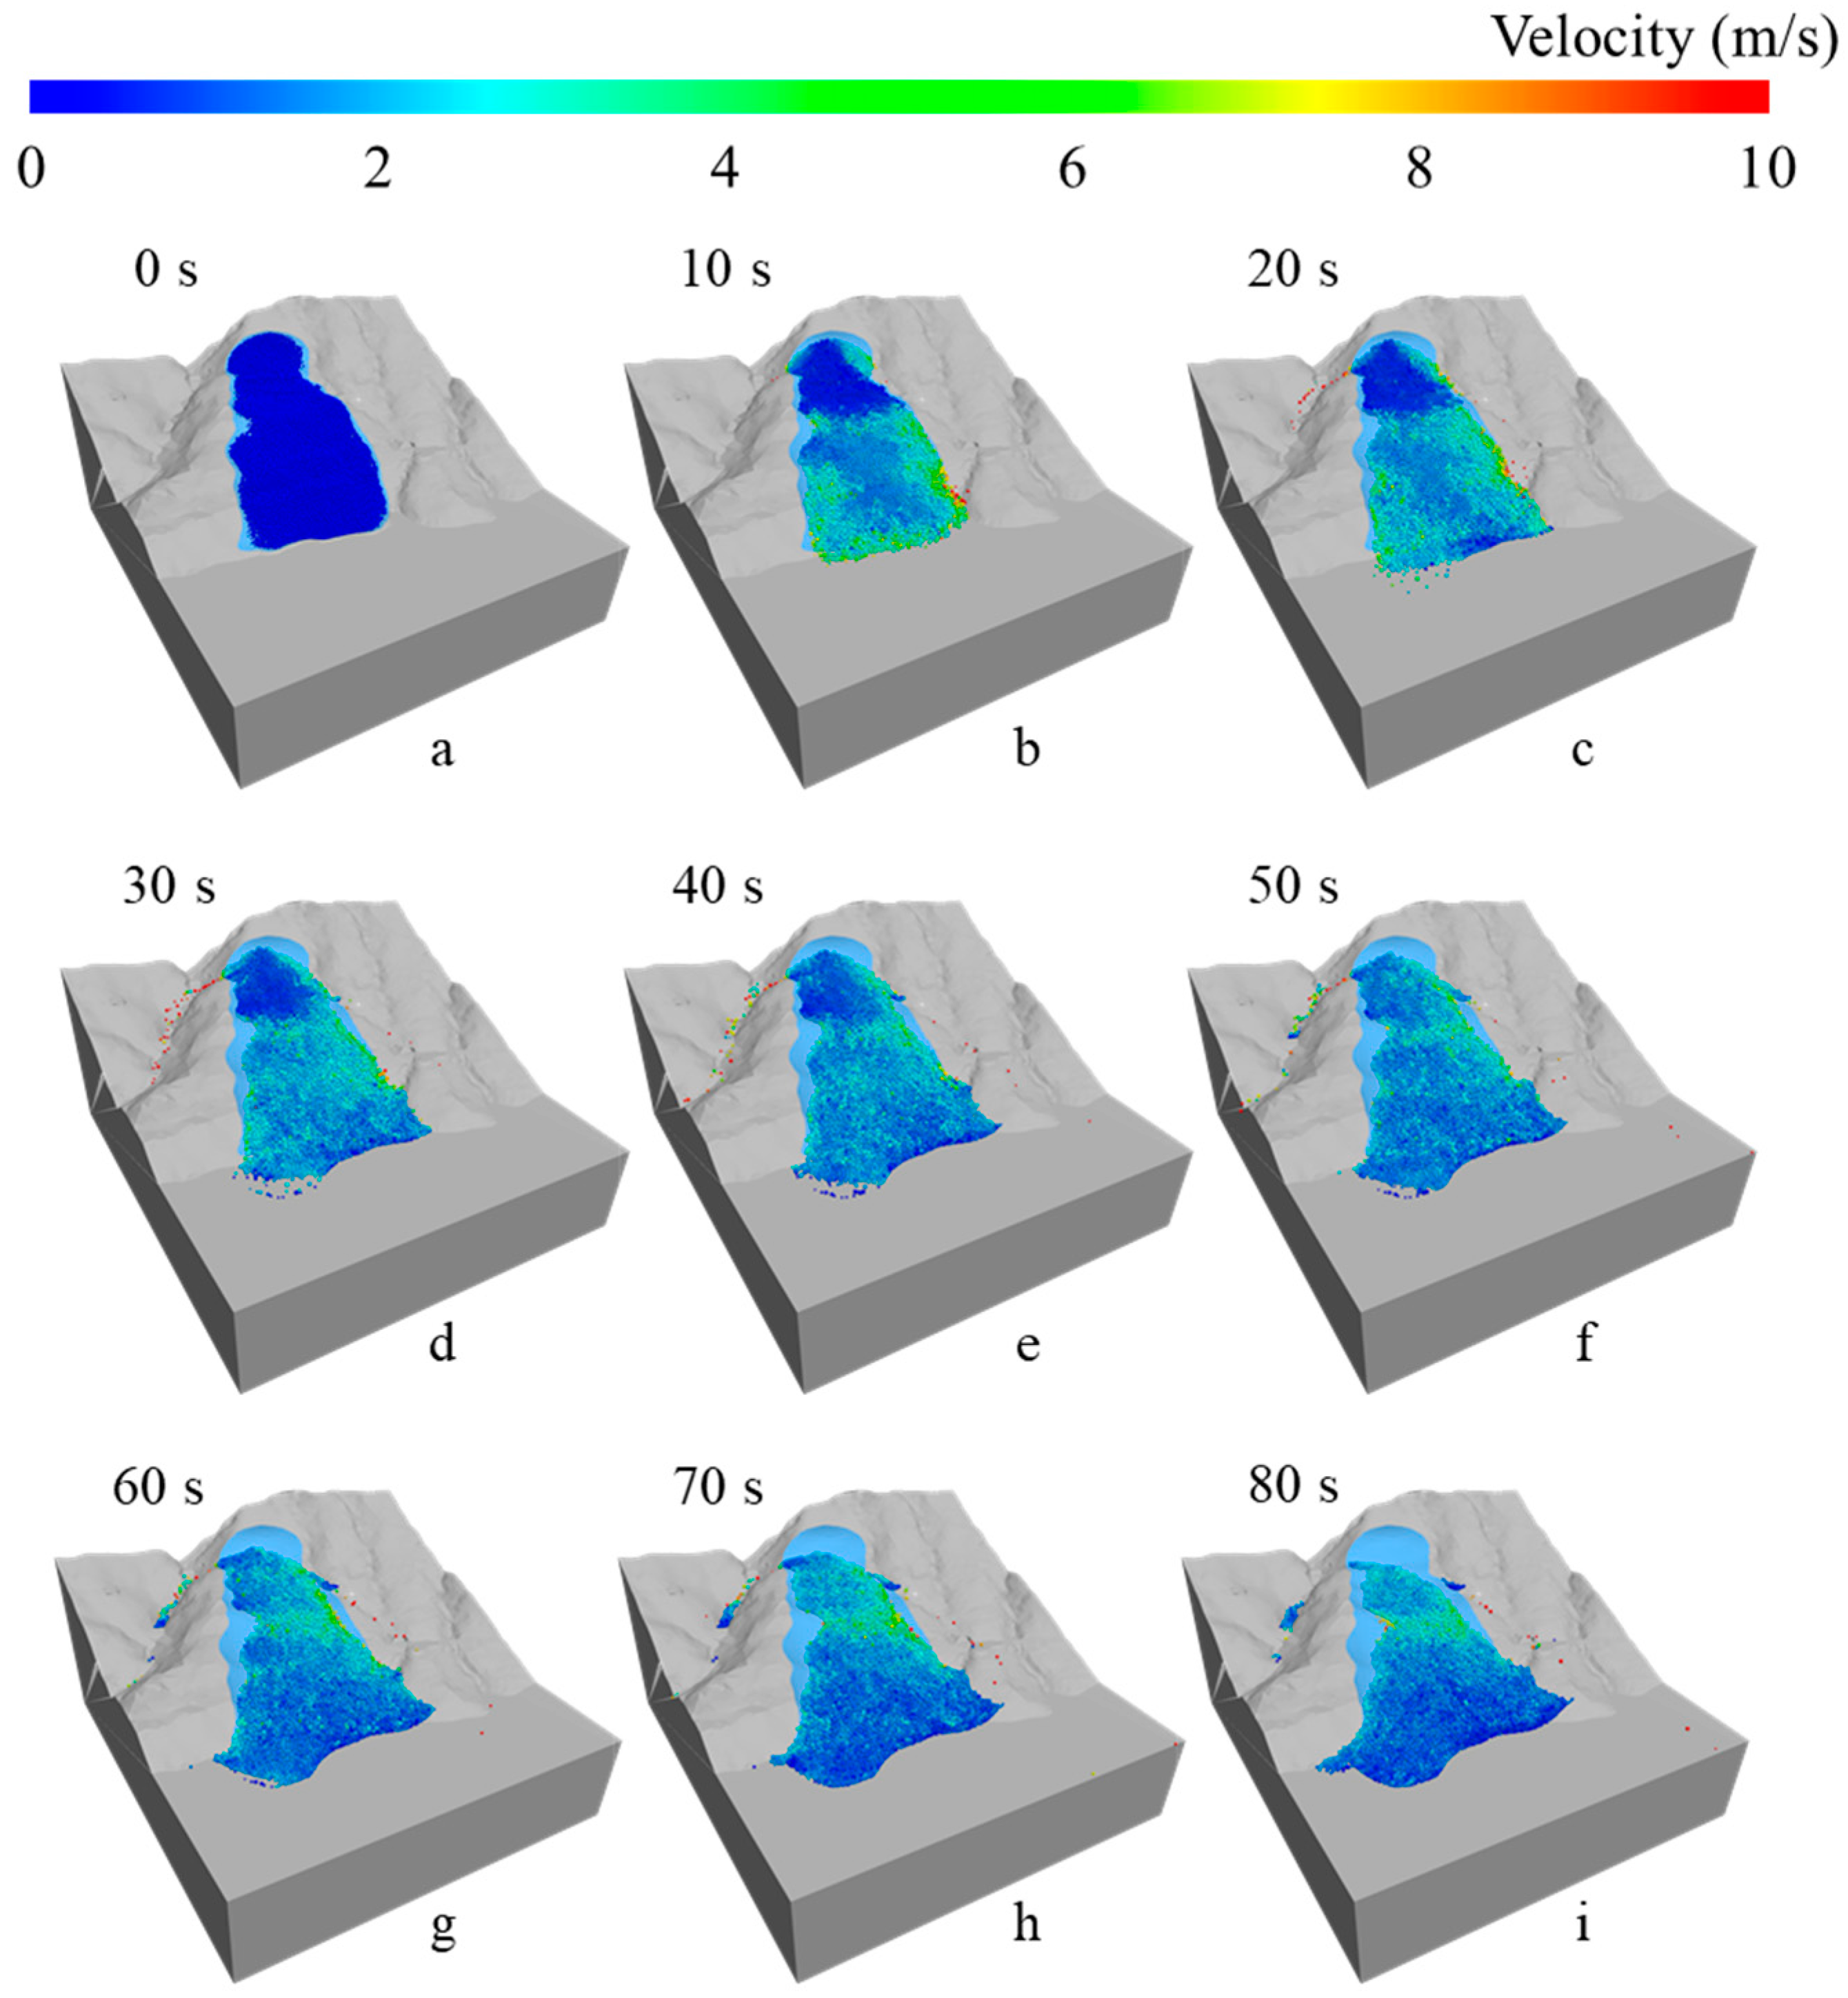
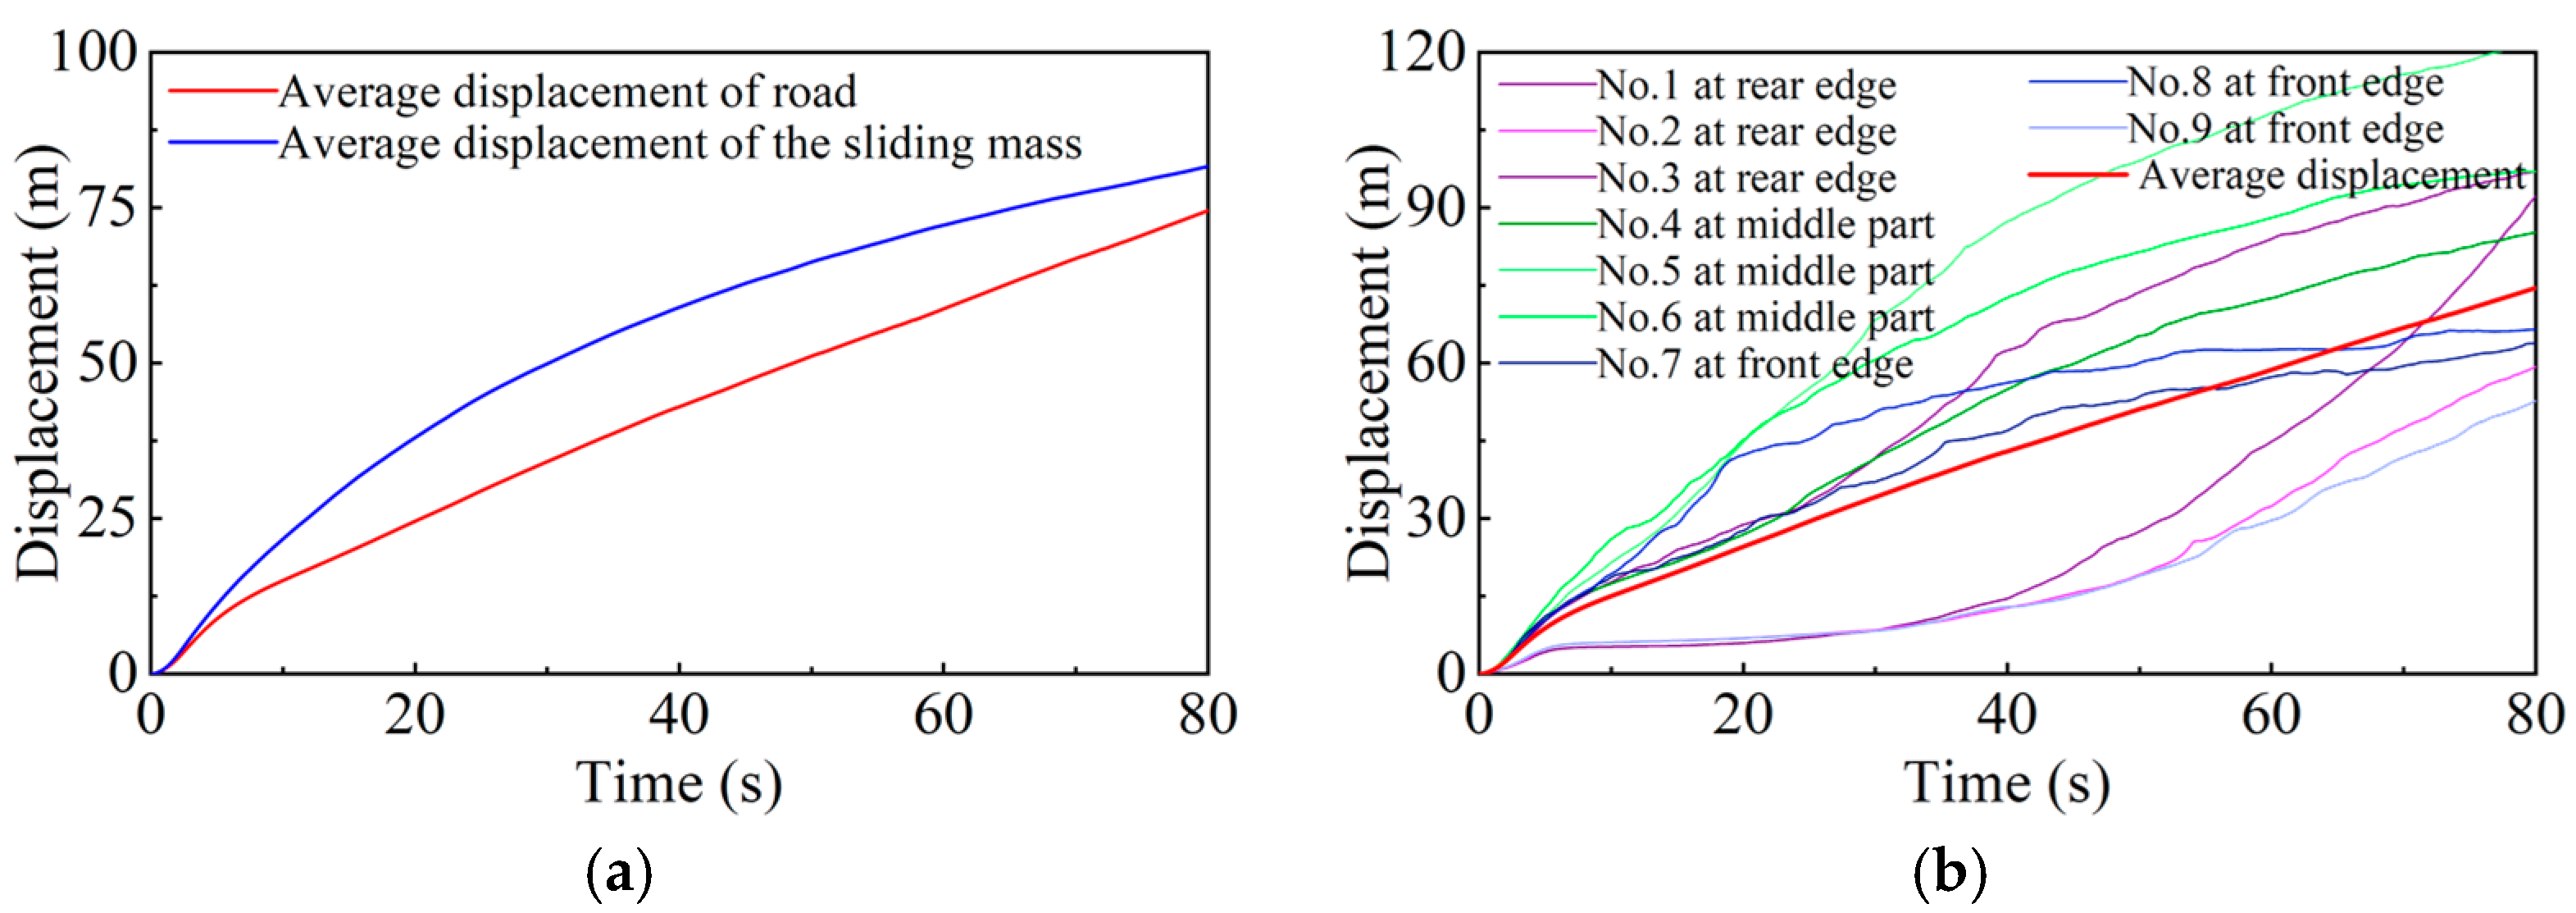
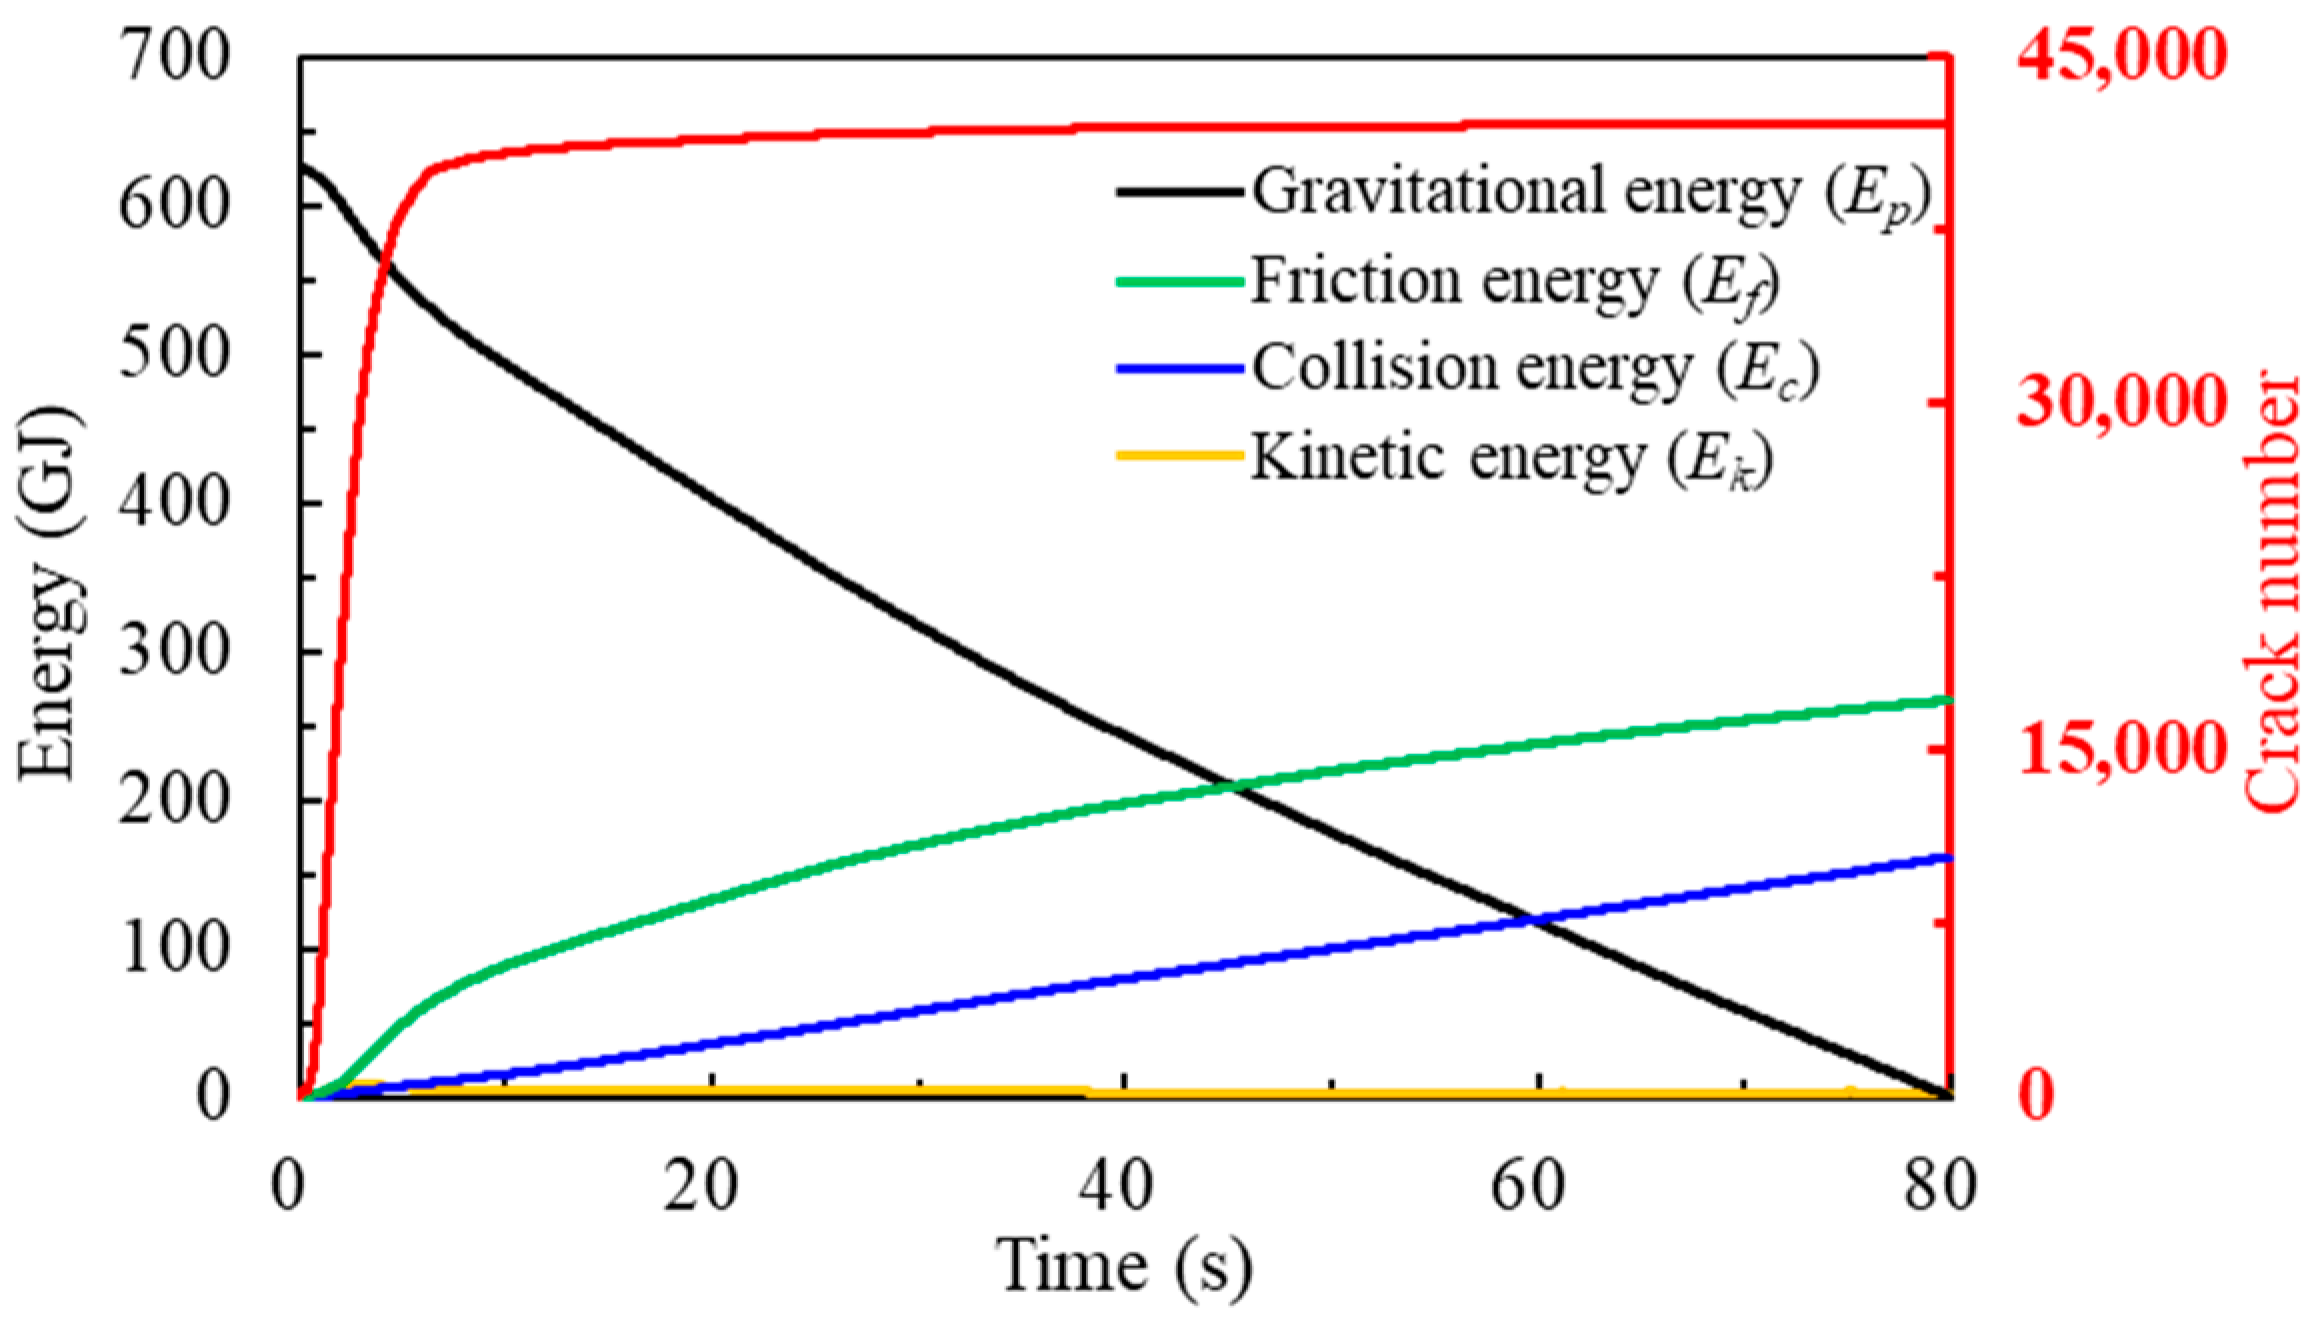
4.2. Numerical Analysis of the Yanguan Landslide
5. Conclusions
- (1)
- The Yanguan landslide was likely triggered by a combination of water level fluctuations in the TGR area and intense rainfall. Reservoir drawdown induced basal erosion and pore pressure disequilibrium, reducing shear resistance at the sliding surface, and rainfall accelerated strength degradation through preferential infiltration pathways, triggering progressive failure propagation. These factors may have weakened the physical and mechanical properties of the sliding mass and potentially caused erosion at the landslide base.
- (2)
- The spatial velocity gradient observed in the landslide’s sliding mass fundamentally stems from energy redistribution mechanisms: unobstructed gravitational acceleration at the front edge created momentum dominance, while progressive energy dissipation through particle collisions and basal friction moderated middle/rear velocities. This self-reinforcing velocity disparity governs both runout dynamics and final deposition patterns, demonstrating that slope failure evolution in reservoir environments is intrinsically controlled by differential energy partitioning along sliding trajectories. The simulated velocity structure’s alignment with field-observed kinematic signatures (orientation/deposition geometry) validates the model’s capacity to capture essential motion characteristics despite current hydrodynamic simplifications.
- (3)
- This study enhances landslide risk assessment practices by quantifying dynamic parameters critical for impact prediction: First, energy dissipation patterns showing 55–65% of kinetic energy conversion into basal friction during stabilization phases; second, particle interaction mechanisms explaining preferential flow paths along weak geological interfaces. These findings enable more accurate mobility predictions through DEM-based scenario libraries specifically developed for reservoir bank slopes, while the calibration methodology provides a replicable framework for determining region-specific micro-mechanical parameters using limited monitoring data. Further, the results of this work can provide a scientific basis for the study of this type of landslide in the TGR area and contribute to disaster prevention and mitigation.
Author Contributions
Funding
Data Availability Statement
Conflicts of Interest
Abbreviations
| TGR | Three Gorges Reservoir |
| DEM | Digital Elevation Model |
| PFC | Particle Flow Code |
| UAV | Unmanned Aerial Vehicle |
| asl | Above sea level |
| UCS | Uniaxial compressive strength |
| E | Young’s modulus |
| ν | Poisson’s ratio |
| ρ | Density |
| SVM | Support Vector Machine |
| Rmin | Minimum particle radius |
| Rmax | Maximum particle radius |
| ρb | Particle density |
| Ec | Effective modulus |
| K | Normal/shear stiffness ratio |
| σc | Bond’s normal strength |
| τc | Bond’s shear strength |
| Ec′ | Parallel bond normal strength |
| K′ | Parallel bond normal/shear stiffness ratio |
| μ | Friction coefficient |
| R2 | Correlation coefficient |
References
- Tang, H.; Wasowski, J.; Juang, C.H. Geohazards in the Three Gorges Reservoir Area, China–Lessons learned from decades of research. Eng. Geol. 2019, 261, 105267. [Google Scholar] [CrossRef]
- Gong, W.; Zhang, S.; Juang, C.H.; Tang, H.; Pudasaini, S.P. Displacement prediction of landslides at slope-scale: Review of physics-based and data-driven approaches. Earth-Sci. Rev. 2024, 258, 104948. [Google Scholar] [CrossRef]
- Petley, D. Global patterns of loss of life from landslides. Geology 2012, 40, 927–930. [Google Scholar] [CrossRef]
- Froude, M.J.; Petley, D.N. Global fatal landslide occurrence from 2004 to 2016. Nat. Hazards Earth Syst. Sci. 2018, 18, 2161–2181. [Google Scholar] [CrossRef]
- Gong, W.; Juang, C.H.; Wasowski, J. Geohazards and human settlements: Lessons learned from multiple relocation events in Badong, China–Engineering geologist’s perspective. Eng. Geol. 2021, 285, 106051. [Google Scholar] [CrossRef]
- Yin, Y.; Huang, B.; Wang, W.; Wei, Y.; Ma, X.; Ma, F.; Zhao, C. Reservoir-induced landslides and risk control in Three Gorges Project on Yangtze River, China. J. Rock Mech. Geotech. Eng. 2016, 8, 577–595. [Google Scholar] [CrossRef]
- Wang, J.; Xiao, L.; Zhang, J.; Zhu, Y. Deformation characteristics and failure mechanisms of a rainfall-induced complex landslide in Wanzhou County, Three Gorges Reservoir, China. Landslides 2020, 17, 419–431. [Google Scholar] [CrossRef]
- Zhang, Y.; Hu, X.; Tannant, D.D.; Zhang, G.; Tan, F. Field monitoring and deformation characteristics of a landslide with piles in the Three Gorges Reservoir area. Landslides 2018, 15, 581–592. [Google Scholar] [CrossRef]
- Zhang, J.; Tang, H.; Tan, Q.; Mao, M.; Zhou, B.; Zhang, Y. A generalized early warning criterion for the landslide risk assessment: Deformation probability index (DPI). Acta Geotech. 2024, 19, 2607–2627. [Google Scholar] [CrossRef]
- Zhang, J.; Tang, H.; Zhou, B.; Wen, T.; Zhang, S. A new early warning criterion for landslides movement assessment: Deformation Standardized Anomaly Index. Bull. Eng. Geol. Environ. 2024, 83, 205. [Google Scholar] [CrossRef]
- Huang, D.; Gu, D.; Song, Y.; Cen, D.; Zeng, B. Towards a complete understanding of the triggering mechanism of a large reactivated landslide in the Three Gorges Reservoir. Eng. Geol. 2018, 238, 36–51. [Google Scholar] [CrossRef]
- Li, Y.; Xie, X.; Jin, B.; Chen, L.; Liang, X.; Yin, K. Comprehensive risk management of reservoir landslide-tsunami hazard chains: A case study of the Liangshuijing landslide in the Three Gorges Reservoir area. Landslides 2024, 22, 671–691. [Google Scholar] [CrossRef]
- Du, W.; Sheng, Q.; Fu, X.; Chen, J.; Zhou, Y. A TPDP-MPM-based approach to understanding the evolution mechanism of landslide-induced disaster chain. J. Rock Mech. Geotech. Eng. 2022, 14, 1200–1209. [Google Scholar] [CrossRef]
- Gu, D.; Huang, D.; Yang, W.; Zhu, J.; Fu, G. Understanding the triggering mechanism and possible kinematic evolution of a reactivated landslide in the Three Gorges Reservoir. Landslides 2017, 14, 2073–2087. [Google Scholar] [CrossRef]
- Song, K.; Wang, F.; Yi, Q.; Lu, S. Landslide deformation behavior influenced by water level fluctuations of the Three Gorges Reservoir (China). Eng. Geol. 2018, 247, 58–68. [Google Scholar] [CrossRef]
- Xu, S.; Niu, R. Displacement prediction of Baijiabao landslide based on empirical mode decomposition and long short-term memory neural network in Three Gorges area, China. Comput. Geosci. 2018, 111, 87–96. [Google Scholar] [CrossRef]
- Ma, J.; Tang, H.; Liu, X.; Wen, T.; Zhang, J.; Tan, Q.; Fan, Z. Probabilistic forecasting of landslide displacement accounting for epistemic uncertainty: A case study in the Three Gorges Reservoir area, China. Landslides 2018, 15, 1145–1153. [Google Scholar] [CrossRef]
- Kang, X.; Xu, G.; Yu, Z.; Wang, S.; Wang, M. Experimental investigation of the interaction between water and shear-zone materials of a bedding landslide in the Three Gorges Reservoir Area, China. Bull. Eng. Geol. Environ. 2020, 79, 4079–4092. [Google Scholar] [CrossRef]
- Miao, F.; Wu, Y.; Török, Á.; Li, L.; Xue, Y. Centrifugal model test on a riverine landslide in the Three Gorges Reservoir induced by rainfall and water level fluctuation. Geosci. Front. 2022, 13, 101378. [Google Scholar] [CrossRef]
- Yin, Y.; Huang, B.; Chen, X.; Liu, G.; Wang, S. Numerical analysis on wave generated by the Qianjiangping landslide in Three Gorges Reservoir, China. Landslides 2015, 12, 355–364. [Google Scholar] [CrossRef]
- Li, B.; Tang, H.; Gong, W.; Cheng, Z.; Li, T.; Wang, L. Numerical study of the runout behavior of the Kamenziwan landslide in the Three Gorges Reservoir region, China. Landslides 2022, 19, 963–976. [Google Scholar] [CrossRef]
- Li, B.; Gong, W.; Tang, H.; Zou, Z.; Bowa, V.M.; Juang, C.H. Probabilistic analysis of a discrete element modelling of the runout behavior of the Jiweishan landslide. Int. J. Numer. Anal. Methods Geomech. 2021, 45, 1120–1138. [Google Scholar] [CrossRef]
- Gong, W.; Zhao, C.; Juang, C.H.; Zhang, Y.; Tang, H.; Lu, Y. Coupled characterization of stratigraphic and geo-properties uncertainties–a conditional random field approach. Eng. Geol. 2021, 294, 106348. [Google Scholar] [CrossRef]
- Zhao, C.; Gong, W.; Li, T.; Juang, C.H.; Tang, H.; Wang, H. Probabilistic characterization of subsurface stratigraphic configuration with modified random field approach. Eng. Geol. 2021, 288, 106138. [Google Scholar] [CrossRef]
- Zhang, J.; Lin, C.; Tang, H.; Wen, T.; Tannant, D.D.; Zhang, B. Input-parameter optimization using a SVR based ensemble model to predict landslide displacements in a reservoir area—A comparative study. Appl. Soft Comput. 2024, 150, 111107. [Google Scholar] [CrossRef]
- Luo, S.L.; Jin, X.G.; Huang, D. Long-term coupled effects of hydrological factors on kinematic responses of a reactivated landslide in the Three Gorges Reservoir. Eng. Geol. 2019, 261, 105271. [Google Scholar] [CrossRef]
- Zhang, J.; Chen, C.; Wu, C.; Zhang, Y. Development of An Image-based Borehole Flowmeter for Real-time Monitoring of Groundwater Flow Velocity and Direction in Landslide Boreholes. IEEE Sens. J. 2024, 24, 42079–42087. [Google Scholar] [CrossRef]
- Pudasaini, S.P.; Mergili, M. A multi-phase mass flow model. J. Geophys. Res. Earth Surf. 2019, 124, 2920–2942. [Google Scholar] [CrossRef]
- Wang, Q.; Xing, A.; Liao, L.; Liu, Y.; Zhuang, Y. Insights into small landslides inducing major disasters in the Wumeng Mountain area from the Liangshui landslide. Landslides 2024, 22, 857–875. [Google Scholar] [CrossRef]
- Yerro, A.; Soga, K.; Bray, J. Runout evaluation of Oso landslide with the material point method. Can. Geotech. J. 2019, 56, 1304–1317. [Google Scholar] [CrossRef]
- Zhang, T.; Yin, Y.; Li, B.; Liu, X.; Wang, M.; Gao, Y.; Wan, J.; Gnyawali, K.R. Characteristics and dynamic analysis of the February 2021 long-runout disaster chain triggered by massive rock and ice avalanche at Chamoli, Indian Himalaya. J. Rock Mech. Geotech. Eng. 2023, 15, 296–308. [Google Scholar] [CrossRef]
- Hungr, O.; Leroueil, S.; Picarelli, L. The Varnes classification of landslide types, an update. Landslides 2014, 11, 167–194. [Google Scholar] [CrossRef]
- Hungr, O.; McDougall, S. Two numerical models for landslide dynamic analysis. Comput. Geosci. 2009, 35, 978–992. [Google Scholar] [CrossRef]
- Li, B.; Tang, H.; Gong, W. Probabilistic analysis of post-failure runout behavior of landslides. In Proceedings of the 7th International Symposium on Geotechnical Safety and Risk (ISGSR 2019), Taipei, Taiwan, 11–13 December 2019; pp. 11–13. [Google Scholar]
- Li, B.; Gong, W.; Tang, H.M.; Wang, L. DEM Simulation of the Bridge Collapse under the Impact of Rock Avalanche: A Case Study of the 2020 Yaoheba Rock Avalanche in Southwest China. Bull. Eng. Geol. Environ. 2024, 83, 104. [Google Scholar] [CrossRef]
- Wang, H.; Liu, S.; Xu, W.; Yan, L.; Qu, X.; Xie, W. Numerical investigation on the sliding process and deposit feature of an earthquake-induced landslide: A case study. Landslides 2020, 17, 2671–2682. [Google Scholar] [CrossRef]
- Wei, L.; Cheng, H.; Dai, Z. Propagation Modeling of Rainfall-Induced Landslides: A Case Study of the Shaziba Landslide in Enshi, China. Water 2023, 15, 424. [Google Scholar] [CrossRef]
- Sun, L.; Shen, F.; Li, C. Water-induced weakening retrogressive landslides: A study on the progressive failure process and formation mechanism of trailing edge fracture surfaces. Bull. Eng. Geol. Environ. 2023, 82, 201. [Google Scholar] [CrossRef]
- Zhu, D.; Song, K.; Mu, J.; Huang, H.; Du, H.; Xiazhuang, F.; Sun, C. Effect of climate change induced extreme precipitation on landslide activity in the Three Gorges Reservoir, China. Bull. Eng. Geol. Environ. 2021, 80, 781–794. [Google Scholar] [CrossRef]
- Wu, Q.; Liu, Y.; Tang, H.; Kang, J.; Wang, L.; Li, C.; Wang, D.; Liu, Z. Experimental study of the influence of wetting and drying cycles on the strength of intact rock samples from a red stratum in the Three Gorges Reservoir area. Eng. Geol. 2023, 314, 107013. [Google Scholar] [CrossRef]
- Yin, Y.; Huang, B.; Zhang, Q.; Yan, G.; Dai, Z. Research on recently occurred reservoir-induced Kamenziwan rockslide in Three Gorges Reservoir, China. Landslides 2020, 17, 1935–1949. [Google Scholar] [CrossRef]
- Yue, X.; Wang, Y.; Wen, T. An Inversion Study of Reservoir Colluvial Landslide Permeability Coefficient by Combining Physical Model and Data-Driven Models. Water 2024, 16, 686. [Google Scholar] [CrossRef]
- ICG (Itasca Consulting Group). PFC—Particle Flow Code Documentation, version 6.0; Itasca Consulting Group Inc.: Minneapolis, MN, USA, 2020.
- Castro-Filgueira, U.; Alejano, L.R.; Arzúa, J.; Ivars, D.M. Sensitivity analysis of the micro-parameters used in a PFC analysis towards the mechanical properties of rocks. In Proceedings of the ISRM EUROCK, Ostrava, Czech Republic, 20–22 June 2017. [Google Scholar]
- Potyondy, D.O.; Cundall, P.A. A bonded-particle model for rock. Int. J. Rock Mech. Min. Sci. 2007, 41, 1329–1364. [Google Scholar] [CrossRef]
- Cheng, Z.; Gong, W.; Tang, H.; Juang, C.H.; Deng, Q.; Chen, J.; Ye, X. UAV photogrammetry-based remote sensing and preliminary assessment of the behavior of a landslide in Guizhou, China. Eng. Geol. 2021, 289, 106172. [Google Scholar] [CrossRef]
- Wei, J.; Zhao, Z.; Xu, C.; Wen, Q. Numerical investigation of landslide kinetics for the recent Mabian landslide (Sichuan; China). Landslides 2019, 16, 2287–2298. [Google Scholar] [CrossRef]
- Calvello, M.; Cuomo, S.; Ghasemi, P. The role of observations in the inverse analysis of landslide propagation. Comput. Geotech. 2017, 92, 11–21. [Google Scholar] [CrossRef]
- Fathipour-Azar, H. Machine learning-assisted distinct element model calibration: ANFIS, SVM, GPR, and MARS approaches. Acta Geotech. 2021, 17, 1207–1217. [Google Scholar] [CrossRef]
- Hungr, O.; Evans, S.G. Entrainment of debris in rock avalanches: An analysis of a long run-out mechanism. Geol. Soc. Am. Bull. 2004, 116, 1240–1252. [Google Scholar] [CrossRef]
- Dai, Z.; Huang, Y.; Xu, Q. A hydraulic soil erosion model based on a weakly compressible smoothed particle hydrodynamics method. Bull. Eng. Geol. Environ. 2019, 78, 5853–5864. [Google Scholar] [CrossRef]


| Particle–Particle Contact Micro-Parameters | Macro-Parameters | ||
|---|---|---|---|
| Item | Value | Item | Value |
| Minimum particle radius, Rmin (m) | 1.40 | Density, ρ (kg/m3) | 2750.00 |
| Maximum particle radius, Rmax (m) | 3.50 | ||
| Particle density, ρb (kg/m3) | 2750.00 | Uniaxial compressive strength, UCS (MPa) | 3.26 |
| Effective modulus, Ec (GPa) | 1.80 | ||
| Normal/shear stiffness ratio, K | 2.00 | Young’s modulus, E (GPa) | 2.45 |
| Parallel bond normal strength, σc (MPa) | 3.60 | ||
| Parallel bond shear strength, τc (MPa) | 3.60 | ||
| Parallel bond modulus, Ec′ (GPa) | 1.80 | Poisson’s ratio, ν | 0.26 |
| Parallel bond normal/shear stiffness ratio, K′ | 2.00 | ||
| Friction coefficient, μ | 0.40 | ||
Disclaimer/Publisher’s Note: The statements, opinions and data contained in all publications are solely those of the individual author(s) and contributor(s) and not of MDPI and/or the editor(s). MDPI and/or the editor(s) disclaim responsibility for any injury to people or property resulting from any ideas, methods, instructions or products referred to in the content. |
© 2025 by the authors. Licensee MDPI, Basel, Switzerland. This article is an open access article distributed under the terms and conditions of the Creative Commons Attribution (CC BY) license (https://creativecommons.org/licenses/by/4.0/).
Share and Cite
Fang, H.; Li, B.; Liu, K.; Meng, Y. Numerical Investigation into the Runout Dynamics of Reservoir Landslides: Insights from the Yanguan Landslide. Water 2025, 17, 695. https://doi.org/10.3390/w17050695
Fang H, Li B, Liu K, Meng Y. Numerical Investigation into the Runout Dynamics of Reservoir Landslides: Insights from the Yanguan Landslide. Water. 2025; 17(5):695. https://doi.org/10.3390/w17050695
Chicago/Turabian StyleFang, Hao, Bing Li, Kai Liu, and Yaobin Meng. 2025. "Numerical Investigation into the Runout Dynamics of Reservoir Landslides: Insights from the Yanguan Landslide" Water 17, no. 5: 695. https://doi.org/10.3390/w17050695
APA StyleFang, H., Li, B., Liu, K., & Meng, Y. (2025). Numerical Investigation into the Runout Dynamics of Reservoir Landslides: Insights from the Yanguan Landslide. Water, 17(5), 695. https://doi.org/10.3390/w17050695