Article

Opoka as a Natural Material for Phosphorus Removal: Properties and Applications

by
Evelina Svedaite
*,
Kestutis Baltakys
and
Tadas Dambrauskas
Department of Silicate Technology, Kaunas University of Technology, Radvilenu Rd. 19, LT-50254 Kaunas, Lithuania
*
Author to whom correspondence should be addressed.
Water 2025, 17(20), 3017; https://doi.org/10.3390/w17203017 (registering DOI)
Submission received: 29 August 2025 / Revised: 15 October 2025 / Accepted: 17 October 2025 / Published: 20 October 2025
(This article belongs to the Section Wastewater Treatment and Reuse)

Abstract

This study investigates the adsorption efficiency of thermally activated natural opoka, a siliceous–calcareous sedimentary rock, as a low-cost adsorbent for removing phosphorus from aqueous solutions. Comprehensive characterization using XRF, XRD, and STA revealed that raw opoka is primarily composed of quartz, tridymite, and calcite, with a CaO/SiO2 molar ratio of approximately 0.45. After calcination at 850 °C, calcite decomposes and reacts with silica to form wollastonite, enhancing surface reactivity. Adsorption experiments conducted at phosphorus concentrations of 0.2, 2.6, and 5.0 g of P/L demonstrated that the material’s removal efficiency for phosphorus was highest at low concentrations (25.7% at 0.2 g/L) and decreased with an increase in concentration (20.8% at 2.6 g/L and 18.6% at 5.0 g/L). The adsorption process followed pseudo-second-order kinetics (R2 > 0.999), indicating that chemisorption is the dominant mechanism. It is assumed that amorphous calcium phosphate forms at low phosphorus concentrations and an alkaline pH, whereas brushite is more prevalent at higher concentrations under acidic conditions. Potassium adsorption was negligible and reversible in all cases. The findings demonstrate that calcined opoka has promising applications as a reactive calcium silicate material for sustainable phosphorus management in decentralized water treatment systems.

1. Introduction

The European Green Deal and the Circular Economy Action Plan promote the recycling of materials in accordance with the principles of a circular economy, thereby enhancing materials’ value [1]. A circular economy entails a continuous search for improvement in several forms, including through reducing resource consumption, reusing resources that can be transformed into other types of products, and recycling or upcycling materials and components at the end of their useful lives [2,3]. The European Commission has developed a proposal for an EU Circular Economy Act focusing on “Environment, Water Resilience, and a Competitive Circular Economy,” which includes a comprehensive list of critical raw materials. The act specifies that measures to generate market demand for secondary materials and establish a single market for waste, particularly critical raw materials, should be taken. Phosphorus has been on the EU Critical Raw Materials List since 2014 and was confirmed to be such a material in the EU Critical Raw Materials Act of 2024 [4]. Phosphorus is classified as a critical raw material in the EU due to the potential for supply disruptions and its economic importance for chemical production, defense, and agriculture [4,5].
Nevertheless, excessive concentrations of P are the most common cause of eutrophication in freshwater lakes, reservoirs, and streams [6,7]. In addition, due to the wide range and prevalence of agricultural activities, a large amount of P accumulation results in nonpoint source pollution of farmland, which is considered one of the primary sources of pollution of water environments [8,9]. There are other sources and means through which phosphorus is believed to be released into the environment from water distribution systems, including outdoor water use near homes, industrial cooling process effluent, and water leaks from public water supply pipes [10,11]. When phosphorus enters the aquatic system, it accumulates in the sediments at the bottom [12]. However, under certain conditions, mainly when there is deoxygenation of the near-bottom layers and a decrease in redox potential below 0.2 V, this reduction triggers the release of previously bound phosphorus back into the water, a process often referred to as internal phosphorus loading [13]. During the mixing process or the circulation of water, released phosphorus can enter the upper trophic layers, exacerbate algae blooms, and decrease water quality, leading to eutrophication [14].
As a valuable resource, managing phosphorus by both reducing its environmental impact on aquatic systems and recovering it from such systems is critical to achieving sustainable phosphorus consumption [15,16]. Various methodologies for eliminating pollutants containing phosphorus have been developed [17]. These methods can be broadly categorized into chemical processes (e.g.; precipitation and adsorption), physical processes (e.g.; reverse osmosis, sedimentation, and filtration), biological processes (e.g.; enhanced biological phosphorus removal and microalgae cultivation), and integrated and regenerative systems [17,18].
In recent years, adsorption has gained prominence as a flexible and potentially regenerative method for phosphorus removal, especially in small- or decentralized systems [19,20]. Adsorption can effectively target low concentrations of phosphorus, often under conditions where biological or chemical methods become inefficient or economically unviable [21,22]. A wide range of adsorbent materials has been explored, including both natural and synthetic types, such as clays, zeolites, biochar, metal oxides, and industrial byproducts [22]. These materials are designed to have a large surface area, high porosity, and active functional groups, making them effective even in complex wastewater samples. These adsorbents have been demonstrated to be effective in the selective removal of phosphorus, thereby facilitating its recovery and reuse [23]. In addition, they are inexpensive, locally available, and environmentally compatible [24,25]. However, many natural adsorbents have low adsorption capacities, often below 5 mg/g, limiting their practical effectiveness [26,27]. The efficacy of the adsorption process can be attributed not only to the material’s structure but also to the pH values of the water medium. Metal oxides, such as Fe, Al, and Ti, exhibit the best phosphorus adsorption effectiveness at acidic pH values due to a property known as the point of zero charge. Calcium-containing adsorbents require more alkaline conditions because of the need to release calcium into the water. pH values determine the form in which phosphorus exists, and the presence of these ions also determines the efficiency of phosphorus removal [28,29]. To improve performance, modification techniques, such as thermal activation, acid treatment, or metal doping of the adsorbent, are frequently applied [30]. Such strategies improve the affinity of the material for phosphate anions by increasing the surface area, altering the pH buffering behavior, and introducing new active sites [31].
Within this context, opoka, a type of bedrock primarily found in deep strata covering areas of the North Sea, Poland, Lithuania, and Ukraine, is attracting an increasing amount of interest regarding its use as a low-cost, abundant, and modifiable natural adsorbent for phosphate removal [32]. It mainly consists of SiO2 and CaCO3 but also contains significant amounts of Al2O3 and Fe2O3. It can resemble limestone in terms of its chemical composition, but the composition of opoka rock can vary depending on the excavation site from which it was obtained. In contrast to limestone, which is crystalline, opoka is amorphous, resulting in high porosity [33]. Opoka exhibits biological activity, which partially links it to biosorbents, giving it significant advantages over similar materials. A major benefit of this type of sorbent is its availability and low cost, being approximately 10–15 times less expensive than synthetic sorbents. Opoka is free of toxic impurities, making it suitable for water treatment. In natural opoka, the silica content ranges from 37.5% to 52.1%, while the calcium carbonate content ranges from 34.5% to 50.4%. Silica enhances the total porosity of opoka, making this bedrock soft and increasing its water-holding capacity. Additionally, calcium compounds serve as active adsorption sites or binding centers [34].
Some researchers have stated that opoka is better suited for removing phosphorus, especially when calcinated at approximately 900 °C, as it becomes more reactive due to the formation of calcium oxide [35,36]. Heating opoka gradually activates its sorption capacity as its physicochemical properties alter. Thermal modification of opoka not only enhances its sorption abilities by removing moisture from its internal pores but also eliminates organics and contaminants [34]. The bedrock’s solid-phase density increases slightly from approximately 2.52 g/cm3 to 2.94 g/cm3 during heating. Thermal treatment also causes partial sintering, which strengthens the rock’s macrostructure and ensures the particles have up to 98% water resistance. This process also improves opoka’s macro-structural strength and porosity by 35–40% and 12–15%, respectively. Natural opoka has a high pH (7.5–7.8), but a significant rise in pH occurs when opoka is heated above 750 °C, reaching values close to 13. Given these changes, thermally activated opoka is a promising industrial mineral and a useful material for purifying natural waterbodies [37].
However, despite its promising mineral qualities, there is still a lack of systematic studies assessing natural opoka’s phosphorus adsorption capacity under controlled and realistic environmental conditions [38]. Specifically, the effects of key operational parameters—such as pH, initial phosphate concentration, contact time, and adsorbent dosage—on phosphorus removal efficiency remain incompletely understood [39,40].
Thus, in this study, we aimed to determine the chemical and mineral composition, thermal stability, and phosphorus adsorption capacity of natural opoka after thermal treatment. We further investigated the mechanisms of phosphate uptake and evaluated kinetic behavior under varying phosphorus concentrations, providing new insights into opoka’s applicability for sustainable phosphorus management.

2. Materials and Methods

2.1. Raw Materials

In this study, the following reagents were used:
Natural opoka (Ecofiltration sp. z o.o.; Poland, Wrocław) was crushed in a crusher (“Pulverisette 1” (Fritsch, Germany, Idar-Oberstein)) and then ground for 5 h in a ball mill and for 5 min in a vibrating disk mill (“Pulverisette 9” Fritsch, Germany, Idar-Oberstein) at 900 rpm.
Potassium dihydrogen phosphate solution (c = 0.2, 2.6, and 5.0 g of P5+/L) was prepared by dissolving KH2PO4 (Chempur, Poland, Piekary, purity 99.5%) in distilled water. The pH of all the solutions was acidic (4.2–4.8).

2.2. Synthesis of an Adsorbent

Adsorption experiments were conducted at 25 °C, with an uncertainty of ±0.2 °C, using a Grant Sub 14 thermostat (Grant Instruments, United Kingdom, Royston). For adsorption, 10 g of adsorbent (opoka) was poured into 1 L of KH2PO4 solution, in which the phosphorus concentrations were 0.2, 2.6, and 5.0 g of P5+/L (hereafter presented as g of P/L). During adsorption, 10 mL liquid samples were taken after 0.5 min, 1 min, 3 min, 5 min, 10 min, 15 min, 30 min, 1 h, 3 h, 5 h, 8 h, 24 h, 48 h, 72 h, and 1 week of adsorption. After the adsorption experiment, the adsorbent was filtered and dried at 50 °C ± 5 °C for 24 h.
The chemical and mineralogical compositions, thermal properties, and phase transformations of natural opoka during calcination were investigated using simultaneous thermal analysis (STA) and X-ray diffraction (XRD).
XRD analysis was performed to determine the mineralogical compositions of the obtained samples. Measurements were performed at room temperature using a D8 Advance diffractometer (Bruker AXS GmbH, Germany, Karlsruhe) equipped with a Cu Kα X-ray tube operated at 40 kV and 40 mA. Diffraction patterns were recorded in Bragg–Brentano geometry using a fast-counting detector (Bruker LynxEye, (Bruker AXS GmbH, Germany Karlsruhe)) based on silicon strip technology. The measurement range was 2θ  =  3–70° with a step of 0.020° per 0.2 s, corresponding to a total measurement duration of  ~12 min per sample.
The compositions of the natural opoka samples were measured by X-Ray Fluorescence Spectroscopy (XRF) in a helium atmosphere, and the data were analyzed with standard SPECTRA Plus QUANT EXPRESS software v3 for S8 TIGER. XRF analysis is based on the measurement of secondary X-ray radiation emitted by chemical elements.
Simultaneous thermal analysis (STA) was used to analyze the thermal stability of the products. Analysis was performed using a Linseis PT1000 instrument (Linseis, Germany). The operating conditions were as follows: a heating rate of 15 °C/min, a temperature range of 30 to 1000 °C, a nitrogen atmosphere, ceramic sample handlers, Pt crucibles, and a sample mass of ~13 mg.

2.3. Determination of the Phosphorus Concentration

pH measurements. pH values were measured with a Hanna instrument pH meter (Hi 9321, Hanna Instruments, Woonsocket, RI, USA).
The concentrations of existing elements in the solution after adsorption were determined using X-ray fluorescence (XRF) spectroscopy via a Bruker X-ray S8 Tiger WD spectrometer (Bruker AXS GmbH, Germany, Karlsruhe) equipped with a Rh tube capable of delivering an energy of up to 60 keV. The liquid sample was poured directly into a plastic cup covered with a thin Mylar TF-135 film. Measurements were performed three times, and their average was calculated. XRF spectroscopy provided quantitative chemical information on the elements of opoka, which were then converted into oxide concentrations. To enable a proper comparison of the results, the concentration of phosphorus was expressed in mg or g of P5+/L for further analysis.

3. Results

3.1. Characterization of Natural Opoka

XRF analysis revealed that the opoka was primarily composed of silicon dioxide (SiO2, 53.8 wt.%) and calcium oxide (CaO, 24.72 wt.%) (Table 1). In addition, Al2O3 (4.89 wt.%), Fe2O3 (2.55 wt.%), and K2O (1.08 wt.%) were detected. The total oxide content reached 88.14 wt.%; the other part of the composition (11.86 wt.%) corresponded to loss on ignition, which was confirmed by calcinating opoka at 1000 °C for 2 h.
Based on the XRF measurements, X-ray diffraction (XRD) analysis was performed to determine the phase composition of the opoka by using elemental data to identify specific crystalline phases and distinguish minerals with similar chemical compositions but different structures. Natural opoka was determined to be composed of calcium carbonate (PDF 00-024-0733, d-spacing–0.385; 0.344; 0.321 nm) and different forms of silicon dioxide {quartz (PDF-01-089-1961, d-spacing–0.426; 0.334; 0.228 nm, tridymite (PDF-04-008-8461, d-spacing–0.430; 0.410 nm, and amorphous)} (Figure 1). Although some elements were detected in low concentrations using XRF, no corresponding diffraction peaks or identifiable amorphous phases related to these trace elements appeared in the XRD patterns, suggesting that they are present in a non-crystalline form or at concentrations below the detection limit of the method employed.
These findings generally align with the data in the literature. For example, previous studies on opoka from the Stoniškis quarry describe the material as predominantly being dark-gray, dense carbonate opoka, with occasional layers of light-gray opoka marl [41,42]. The mineralogical composition of this carbonate opoka typically includes approximately 50 wt.% silicon dioxide and 48 wt.% calcium carbonate, forming a siliceous–calcareous mixture commonly referred to as carbonate opoka. The oxide composition data presented in Table 2 confirm this general compositional trend.
The results indicate that the SiO2 content ranges from 24.55 wt.% to 73.18 wt.%, with an average of 55.84 wt.%, while the CaO content varies from 0.80 wt.% to 37.98 wt.%, averaging 20.71 wt.%. These values demonstrate the heterogeneous nature of opoka and its variable silicified and carbonated character, which are heavily influenced by the corresponding depositional environment and diagenetic processes. The presence of CO2 (6.84–29.34 wt.%, avg. 16.19 wt.%) and the loss-on-ignition values (9.14–31.12 wt.%, avg. 18.72 wt.%) further support the presence of carbonates and volatile compounds, consistent with the decomposition of calcium carbonate and hydrated silicates during thermal treatment.
The literature data align with the results regarding the opoka composition obtained in this study, especially concerning the most important components, calcium and silica. After elements were added, slight variation was observed, which could be due to the quarry from which the mineral was sourced.

3.2. Physical Properties

Simultaneous thermal analysis (STA), combining thermogravimetry (TG) and differential scanning calorimetry (DSC), was applied to investigate the thermal behavior, stability, and phase transformations of the natural opoka samples (Figure 2). TG analysis indicated that the total mass loss was 12.44% and occurred in two separate thermal effects. The first endothermic effect, observed below 200 °C, was attributed to the release of physically adsorbed moisture and non-structural water within the porous structure of the material. The mass loss of 0.56% showed that only a very small quantity of surface and pore water was present in the material. This low moisture level is consistent with pre-drying or handling procedures typically carried out before thermal testing. Notably, there was no evidence of structural water loss in this temperature range, suggesting that the mineral framework of opoka remains stable and unchanged up to approximately 200 °C.
The second endothermic effect was observed at 748 °C, accompanied by a mass loss of 9.42%. This process corresponded to the decomposition of calcium carbonate (CaCO3), producing calcium oxide and releasing carbon dioxide. The reaction required a considerable amount of energy, as indicated by the enthalpy change equal to 322 J/g. The relatively high decomposition temperature suggested that the CaCO3 present in the material was predominantly crystalline, thus requiring greater thermal energy for decomposition compared to less ordered forms. This transformation is particularly relevant in material-processing contexts, as the CaO generated becomes an active component for subsequent solid-state reactions.
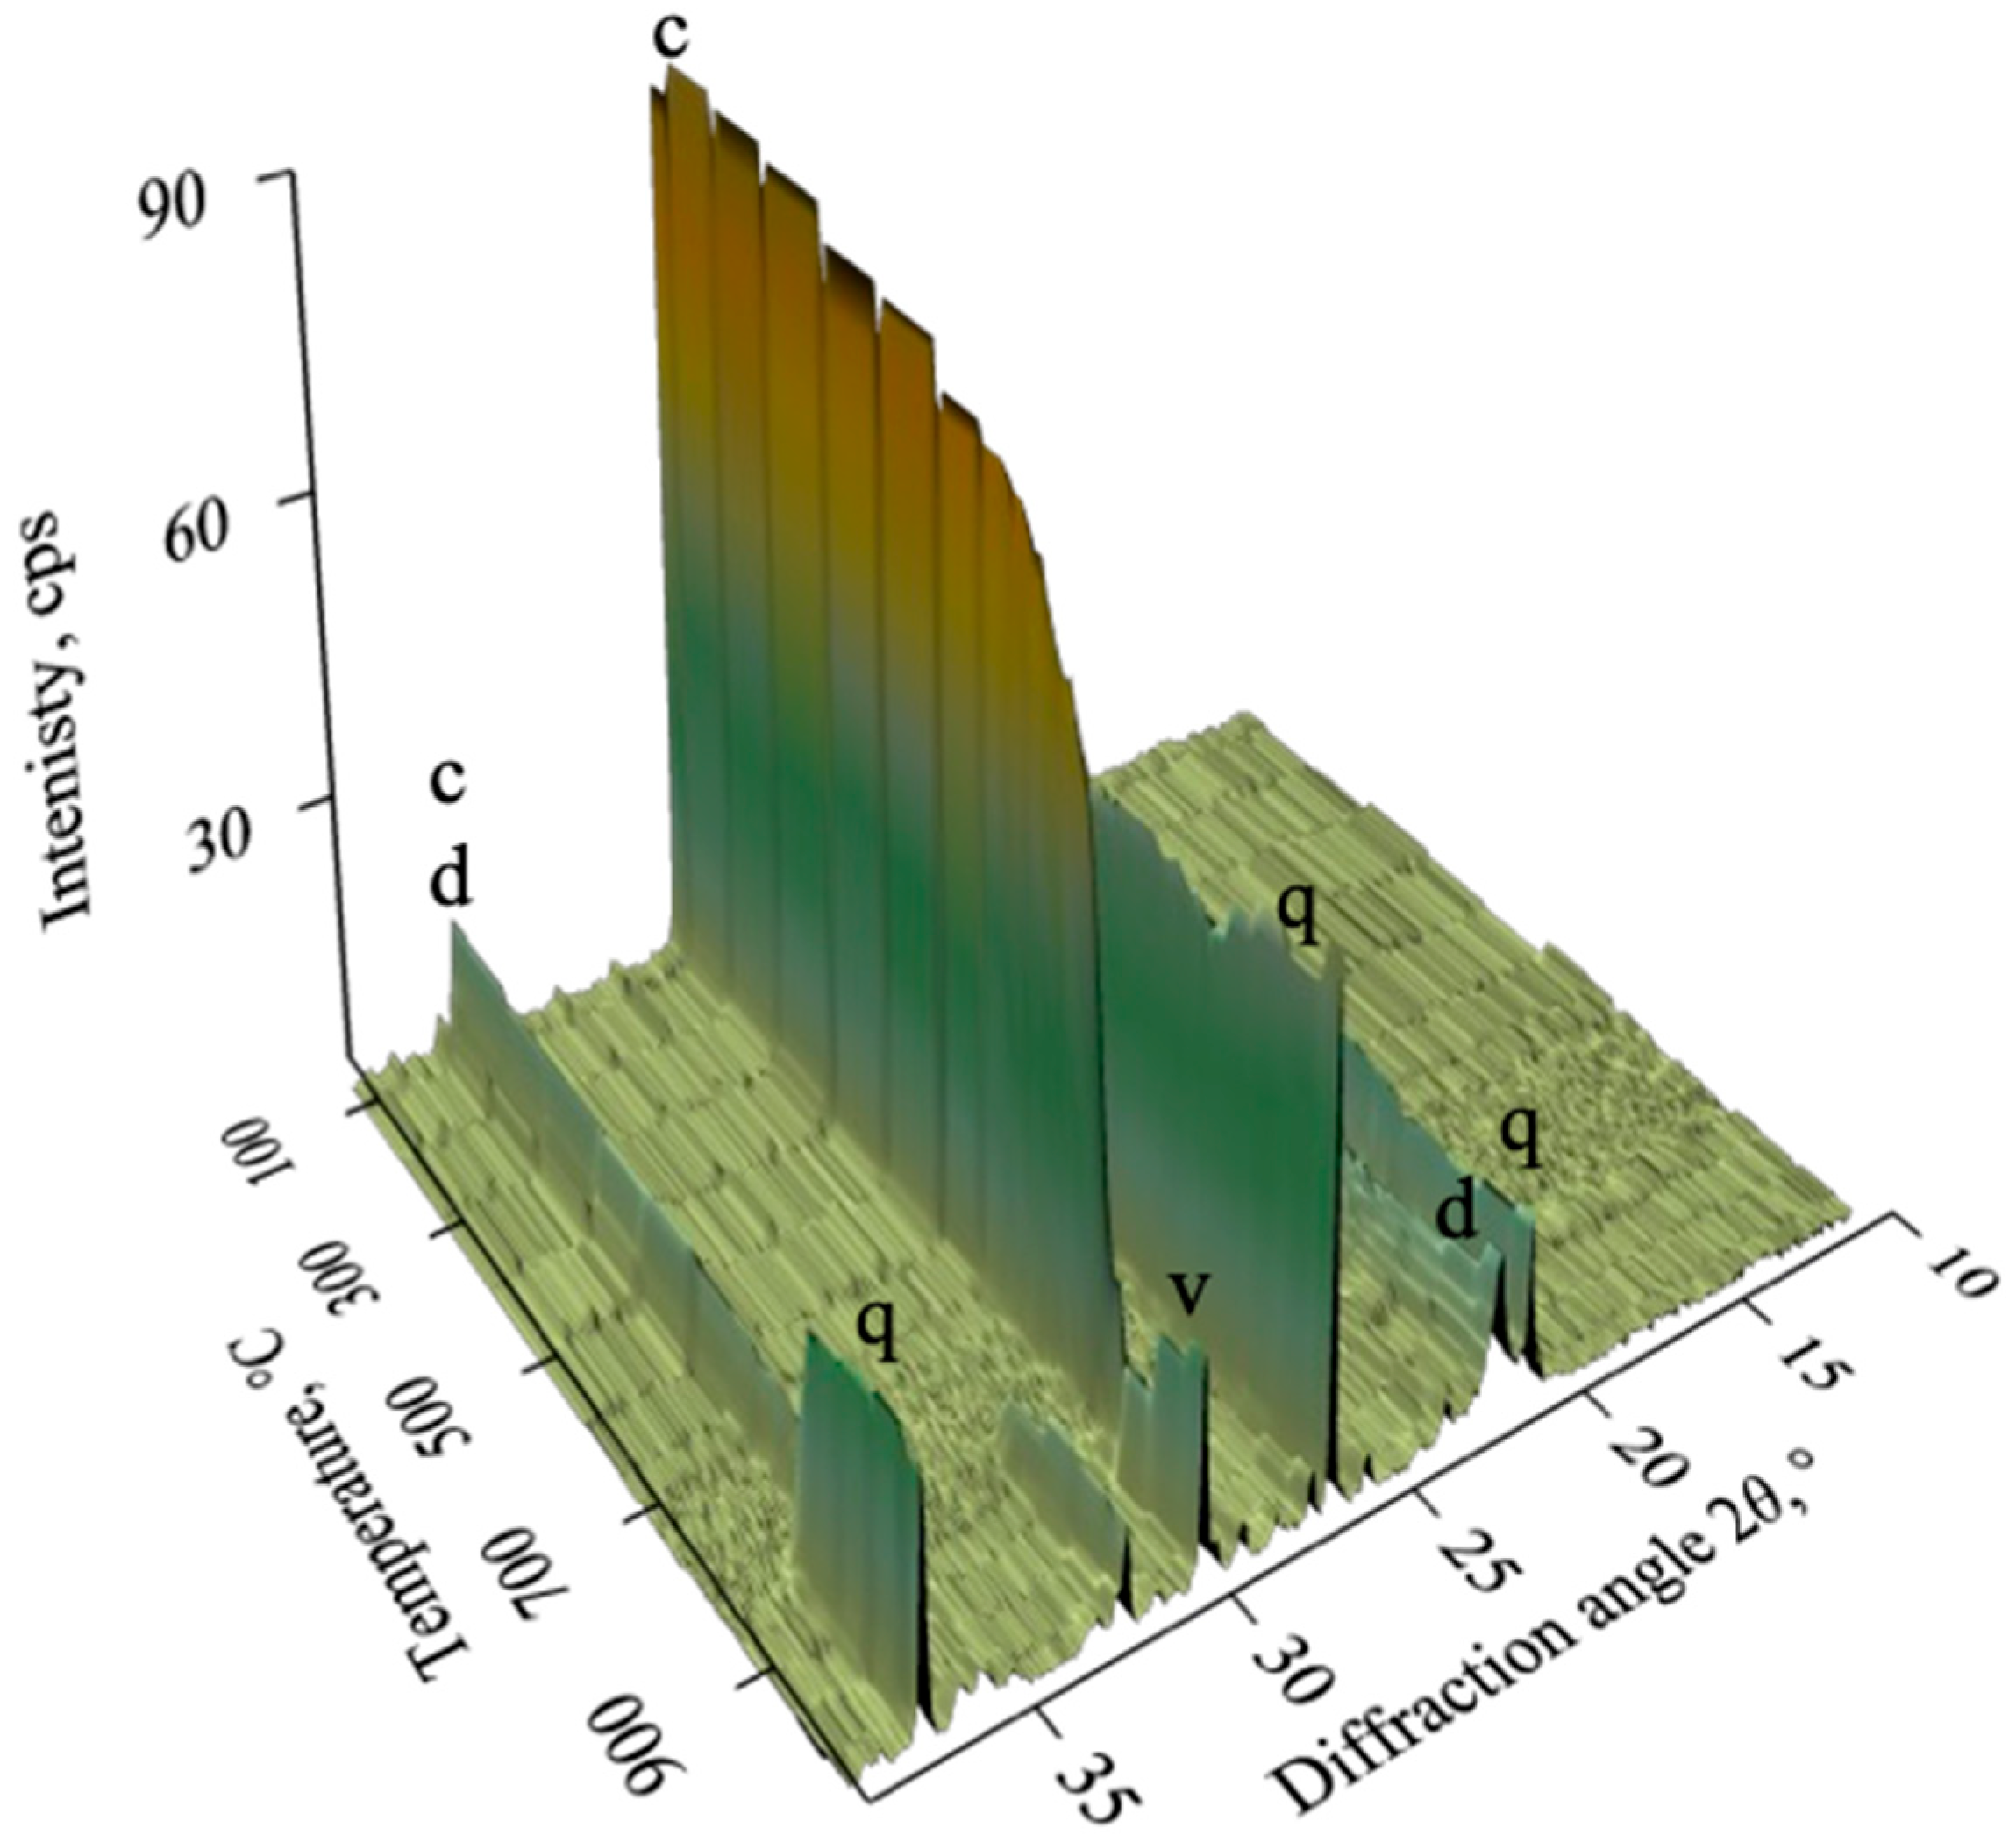
These data are in good agreement with the results of the in situ XRD analysis (Figure 3), which showed changes in the crystalline phases with increasing temperature. At temperatures below 800 °C, the diffraction patterns were dominated by characteristic calcium carbonate diffraction peaks, confirming opoka’s stability in this temperature range. Between 800 and 850 °C, the intensity of these peaks decreased, a finding consistent with the decomposition of CaCO3 observed in the thermal analysis.
Above 900 °C, new diffraction peaks appeared; they corresponded to crystalline calcium silicate (CaSiO3). Its formation indicated a reaction between calcium oxide (CaO), produced during the decomposition of CaCO3, and the silica-rich phase of the material. This sequence demonstrated that opoka undergoes a progressive transformation: persistence of CaCO3 up to about 850 °C, its decomposition in the 850–900 °C interval, and subsequent crystallization of CaSiO3 at higher temperatures.

3.3. Calcination of Natural Opoka and Formation of Reactive Phases

Natural opoka was calcinated to remove volatile components and convert the material into a more reactive form suitable for uses such as adsorption. The process was performed at 850 °C for 1 h; this temperature was chosen based on thermal analysis and in situ phase change data.
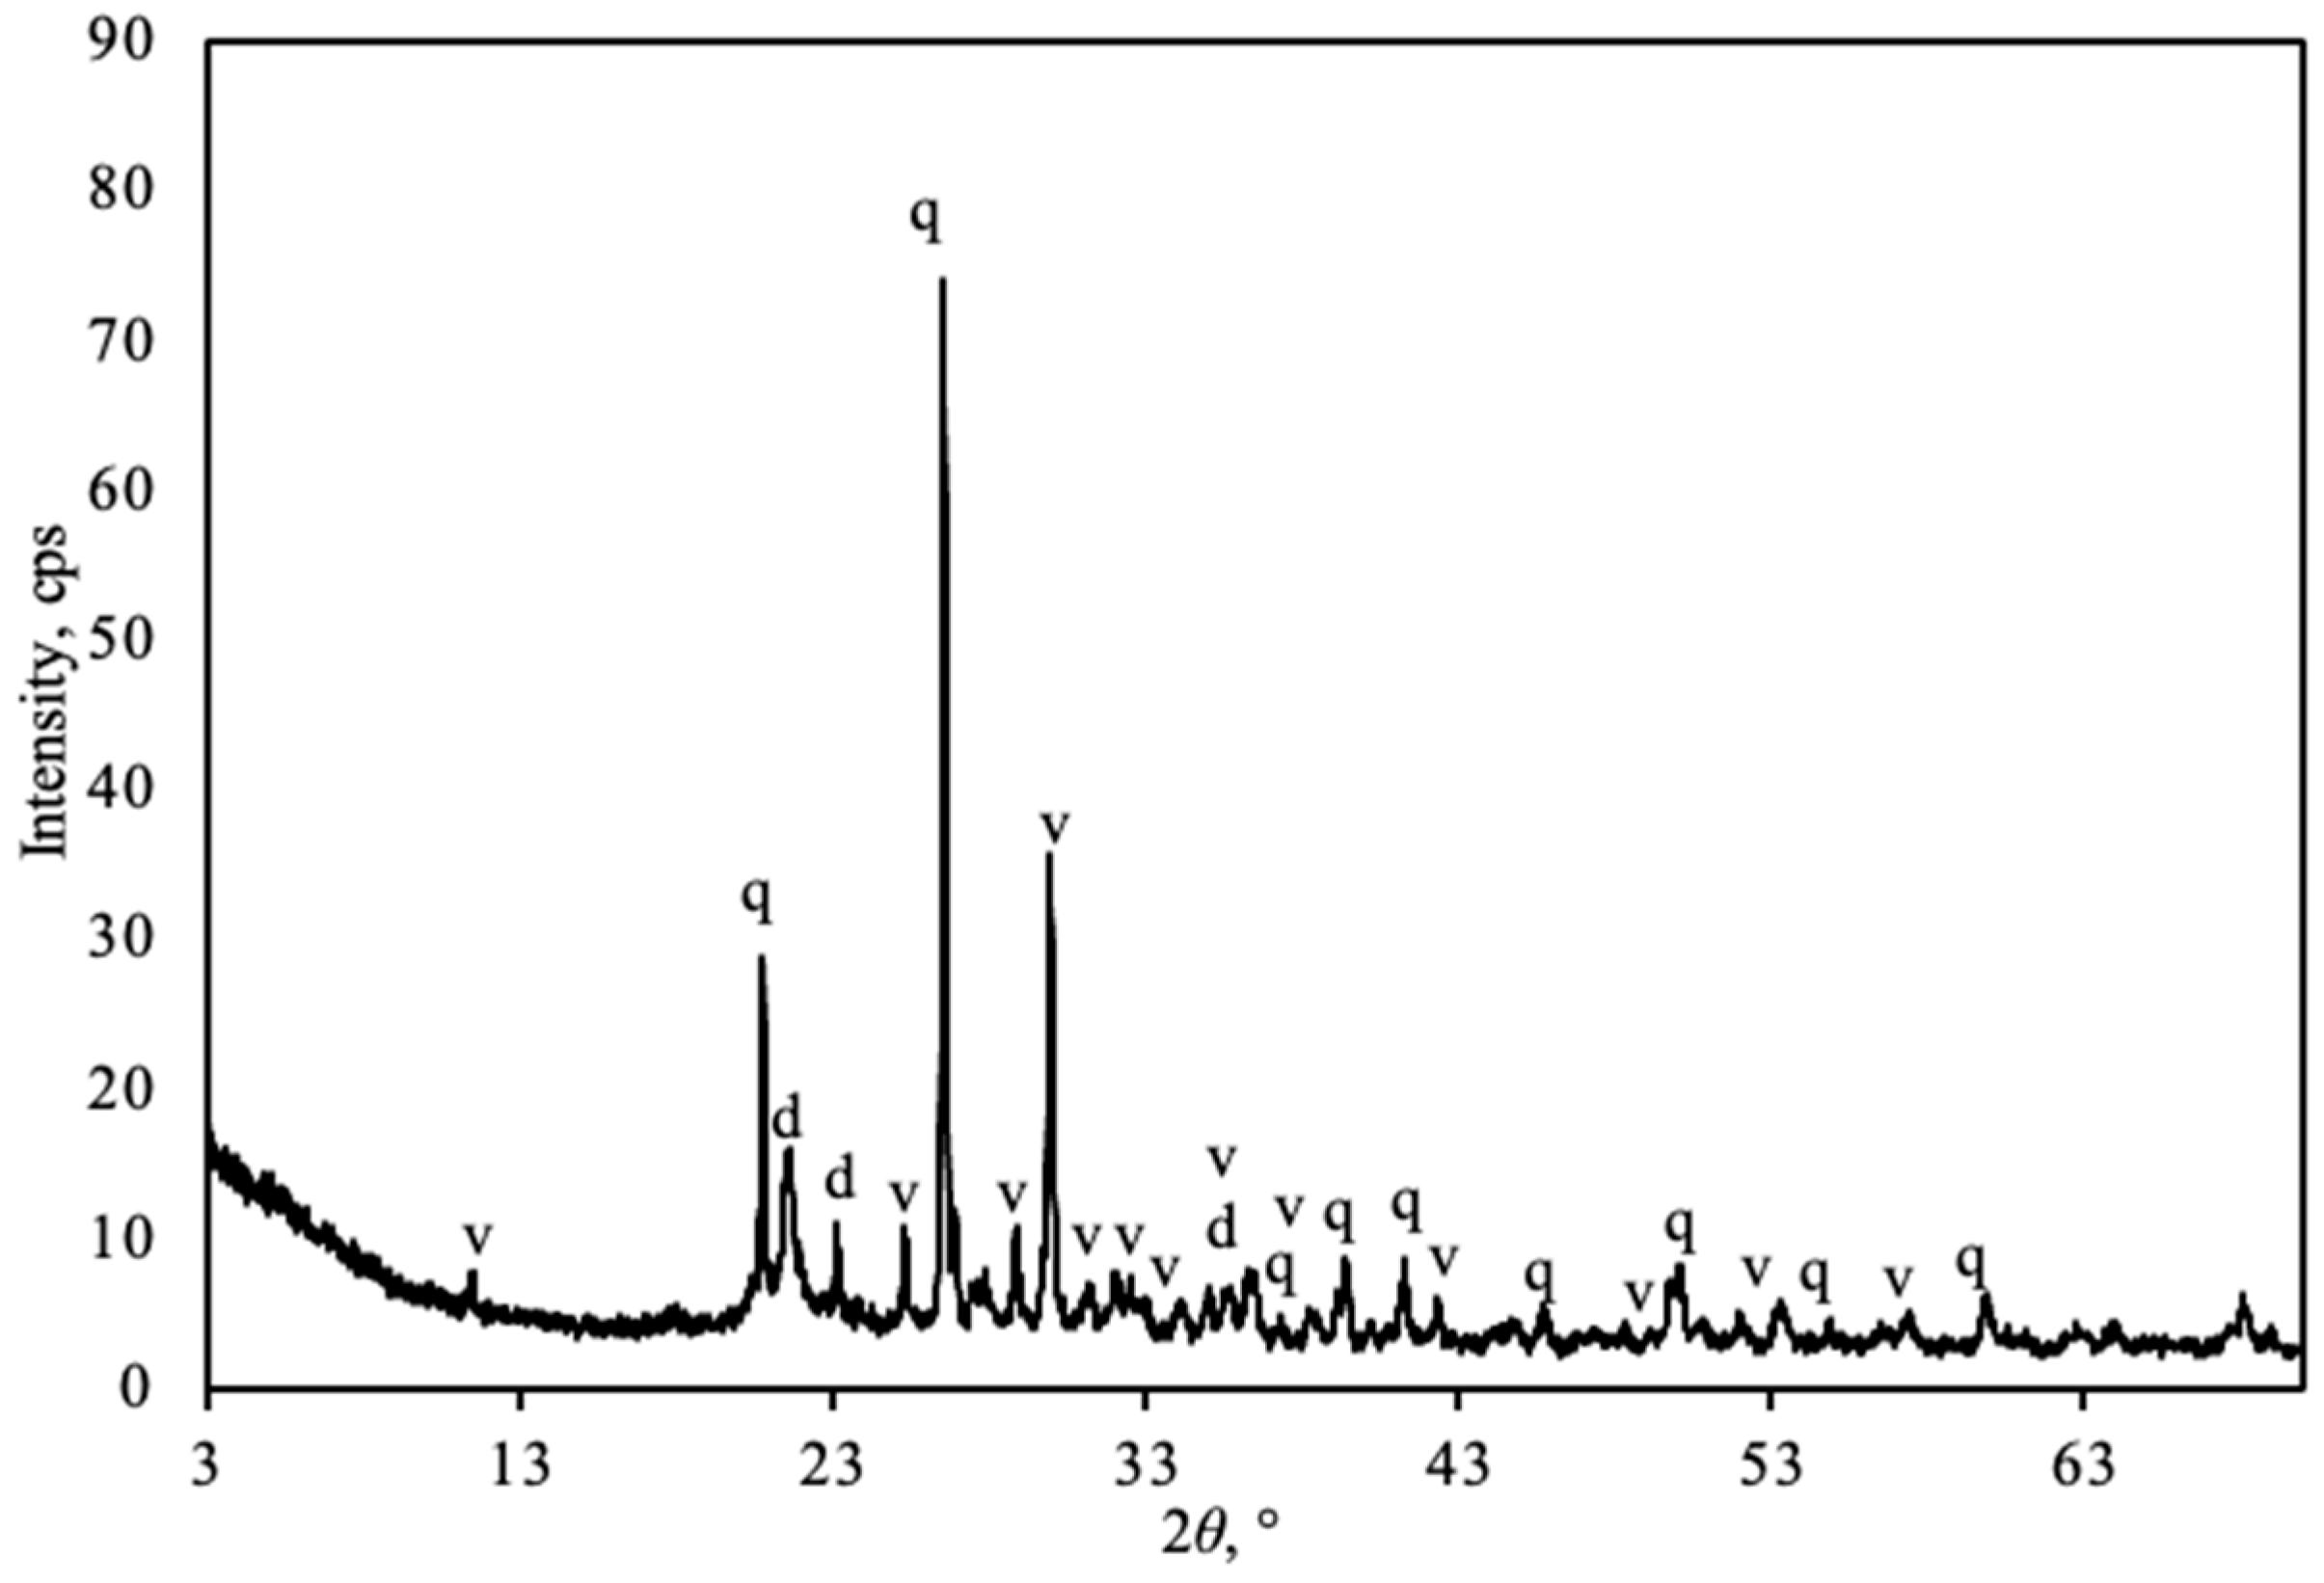
At this temperature, calcium carbonate (CaCO3) fully decomposed, releasing carbon dioxide (CO2) and forming calcium oxide (CaO). The newly produced CaO then reacted with tridymite and amorphous silica in the opoka matrix, resulting in the formation of wollastonite. This phase change was confirmed via XRD analysis, which revealed wollastonite alongside residual quartz and tridymite (Figure 4).
The oxide composition of the calcined opoka is summarized in Table 3, showing that SiO2 remained the dominant component at 62.23 wt.%, while the CaO content increased to 26.25 wt.%. Minor amounts of Al2O3 (5.46 wt.%), Fe2O3 (2.63 wt.%), and trace oxides such as K2O, MgO, P2O5, and TiO2 were also detected. Based on the XRF results (Table 3), the molar ratio of CaO to SiO2 (C/S) in calcined opoka was determined to be 0.45. This molar ratio is especially relevant for materials intended for use in adsorption processes, as it influences surface area and ion-exchange capacity [46].

3.4. Adsorption Properties of Calcinated Opoka

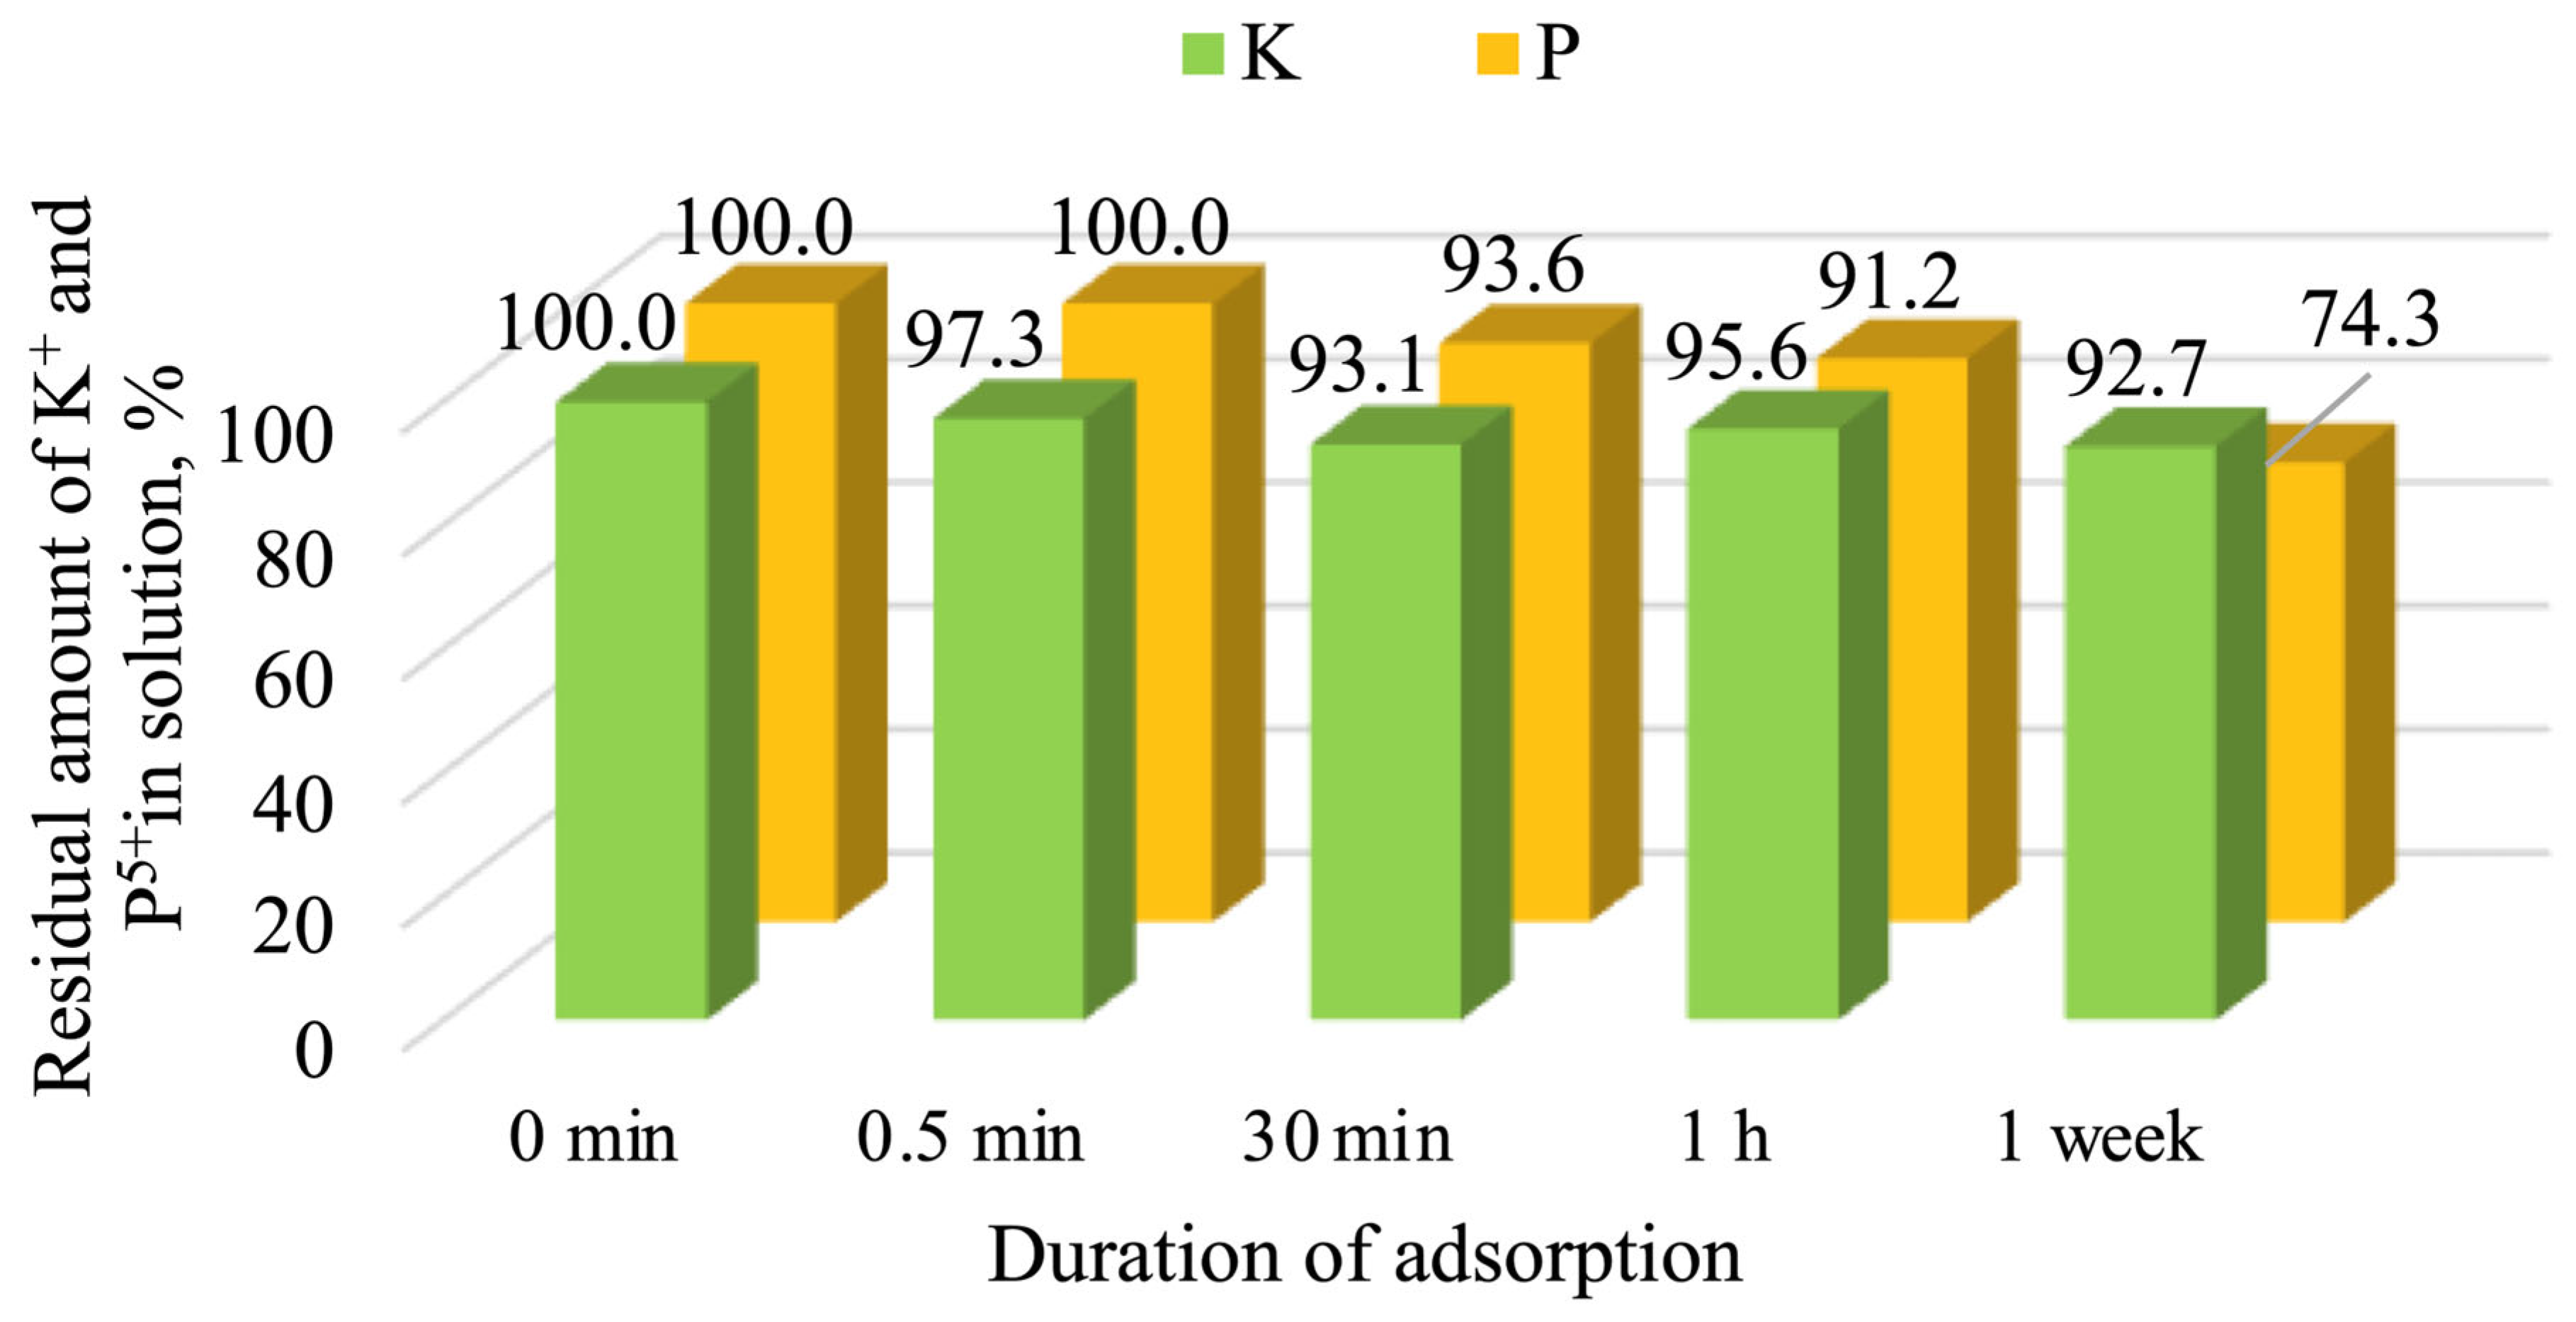
During the adsorption experiment, we found that, at the lowest solution concentration (0.2 g of P/L), the phosphorus concentration in the solution gradually decreased. After 30 min of adsorption, 93.6% of the initial phosphorus remained in solution, 91.2% remained after 1 h, and 74.3% remained after 168 h (Figure 5). The amount of adsorbed phosphorus was 7.60 mg P per gram of adsorbent at the end of the experiment. This corresponds to a total removal efficiency of 25.7% after one week.
Under these conditions, potassium ion adsorption was weak. After a slight decrease from 100% to 93.1% over 30 min, the concentration was 92.7% after one week. K+ ions do not form strong bonds with the carbonate-based structure of the adsorbent surface. It is most likely the case that potassium is briefly adsorbed through weak electrostatic interactions, but no stable complexes are formed, resulting in weak sorption. Therefore, calcined opoka is not an effective potassium adsorbent.
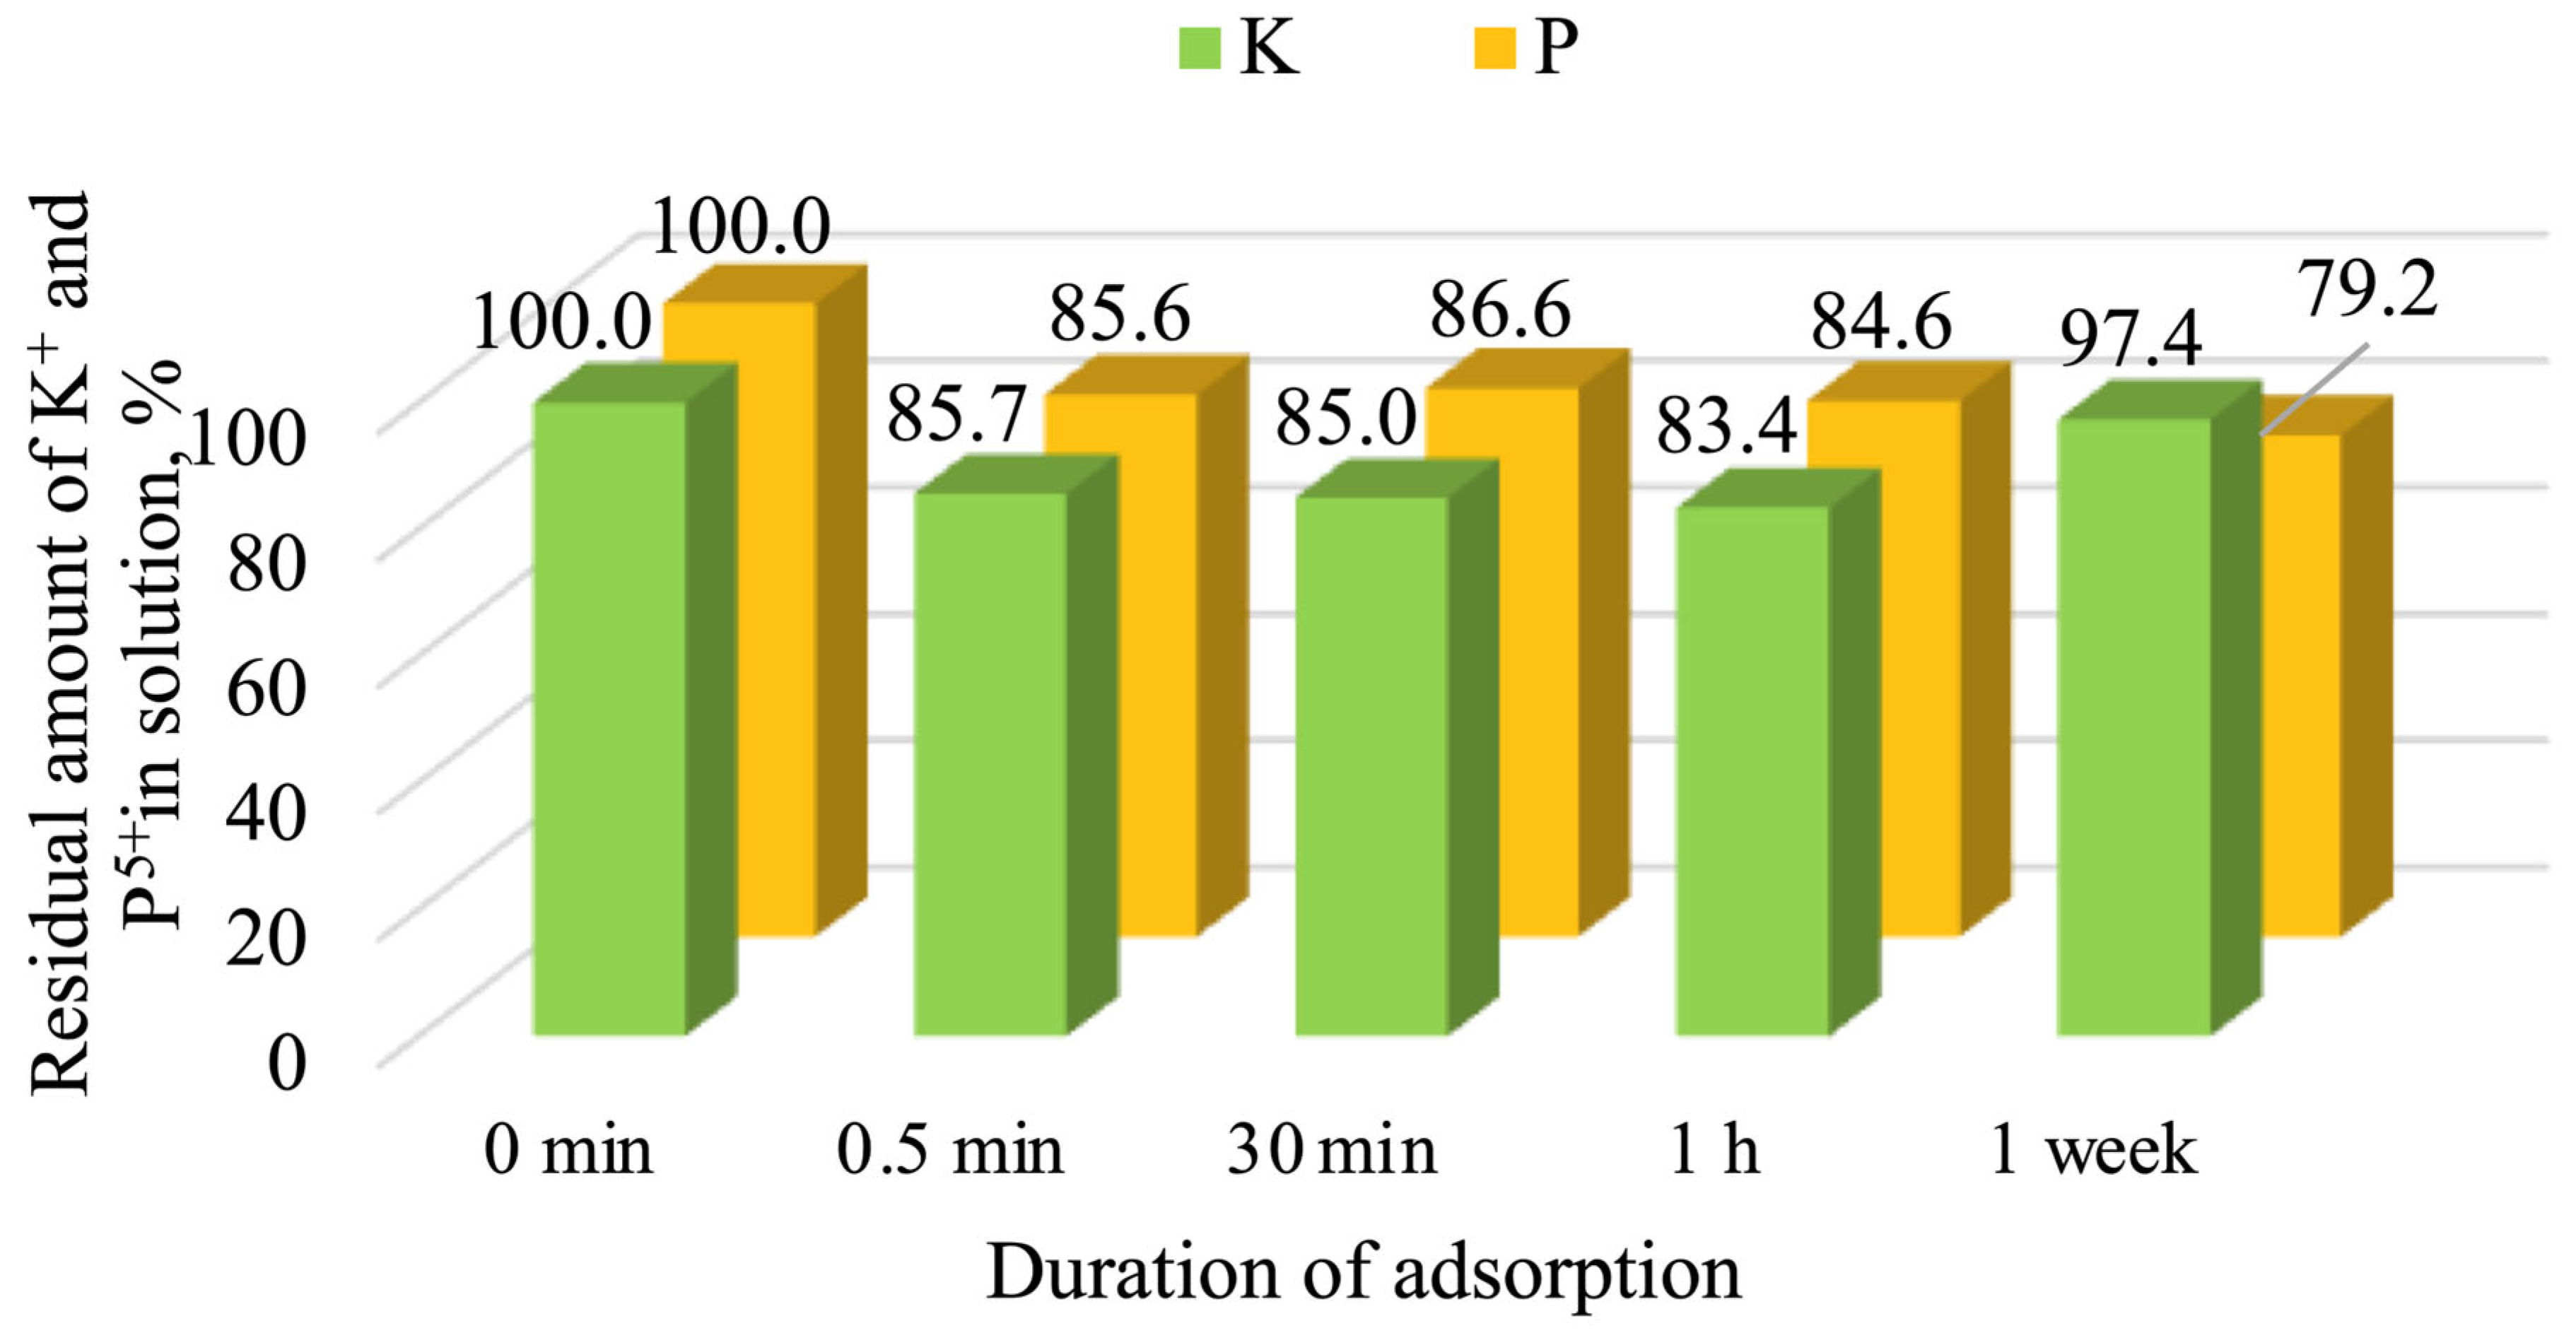
When the phosphorus concentration increased over tenfold (from 0.2 to 2.6 g of P/L), the phosphorus adsorption capacity increased significantly. Already after 0.5 min, the P concentration had decreased from 100% to 85.6%, and after one week, it reached 79.2%, corresponding to a total phosphorus removal degree of 20.8% (Figure 5).
Unlike the lower concentration, the initial adsorption rate was considerably higher, with phosphate ions rapidly binding to a greater number of active sites. The equilibrium for this process is typically reached within a few hours, after which the adsorption rate declines due to surface saturation [47].
The potassium concentration decreased from 100% to 85.7% after 0.5 min but increased to 97.4% after one week, indicating that desorption became the dominant process. Although the initial decrease was greater than that at 0.2 g of P/L, this effect was temporary. This result can be explained by the fact that, at the onset of the adsorption process, the adsorbent initially binds potassium ions; however, due to the high solubility of potassium compounds, these ions are eventually released back into the liquid medium (Figure 6).
At the highest concentration tested (5.0 g of P/L), phosphorus adsorption on calcined opoka was irregular. The phosphorus concentration decreased from 100% to 80.6% after 0.5 min; it then unexpectedly increased to 87.0% at 30 min, dropped to 71.4% at 1 h, and then rose again to 81.4% after one week (Figure 7).
It is also possible that some of the phosphorus was weakly bound initially but later released due to surface equilibrium adjustments. Generally, the removal efficiency was not directly proportional to the amount of adsorbent.
As in the previous case, the K+ concentration decreased from 100% to 84.0% after 0.5 min of adsorption but returned to 100% after one week. This evidence clearly demonstrates that the adsorption capacity is not retained in the long term, even at high potassium concentrations.
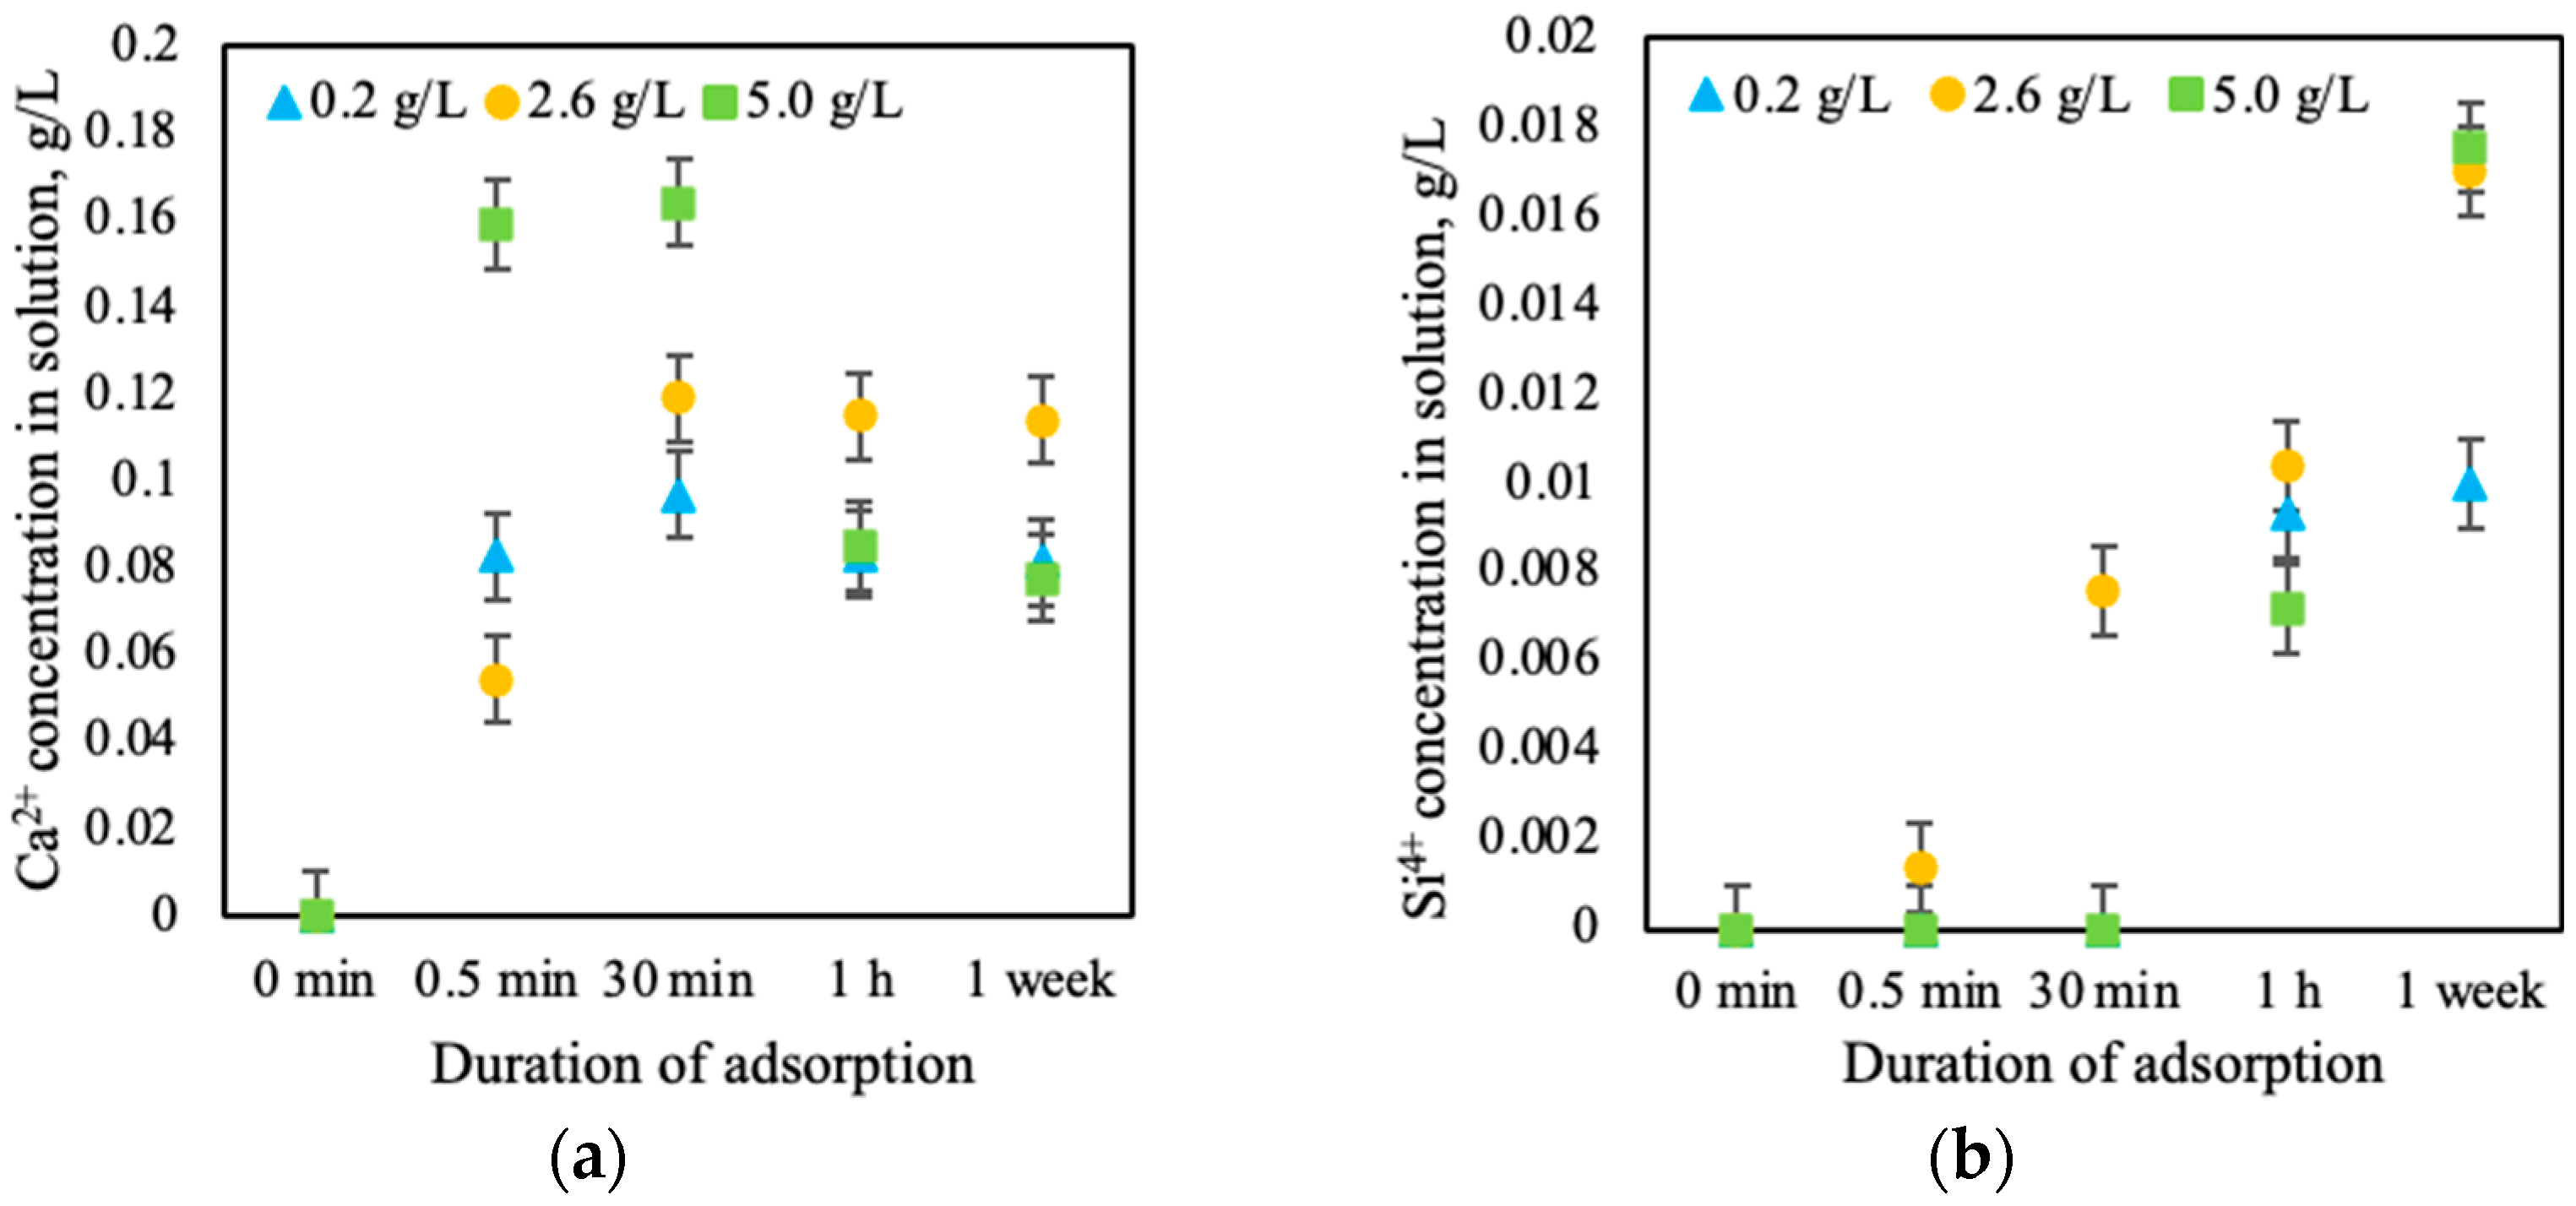
Meanwhile, a decrease in phosphorus concentrations was associated with a similar trend in changes in calcium concentration. In the first seconds of the process, calcium was released into the solution, raising the calcium concentration from 0.1 to 0.2 g/L. In particular, in line with previous research and collected data, only up to 20% of the calcium was released into the solution. After the initial 30 s, calcium exhibited phosphorus-binding properties, resulting in a decrease in its concentration. It has been demonstrated that the release of silicon ions into the solution also occurs during the adsorption process. The release described in this study is characterized by a rising concentration throughout the entire process, with the most significant rise occurring after 30 min of adsorption (Figure 8).
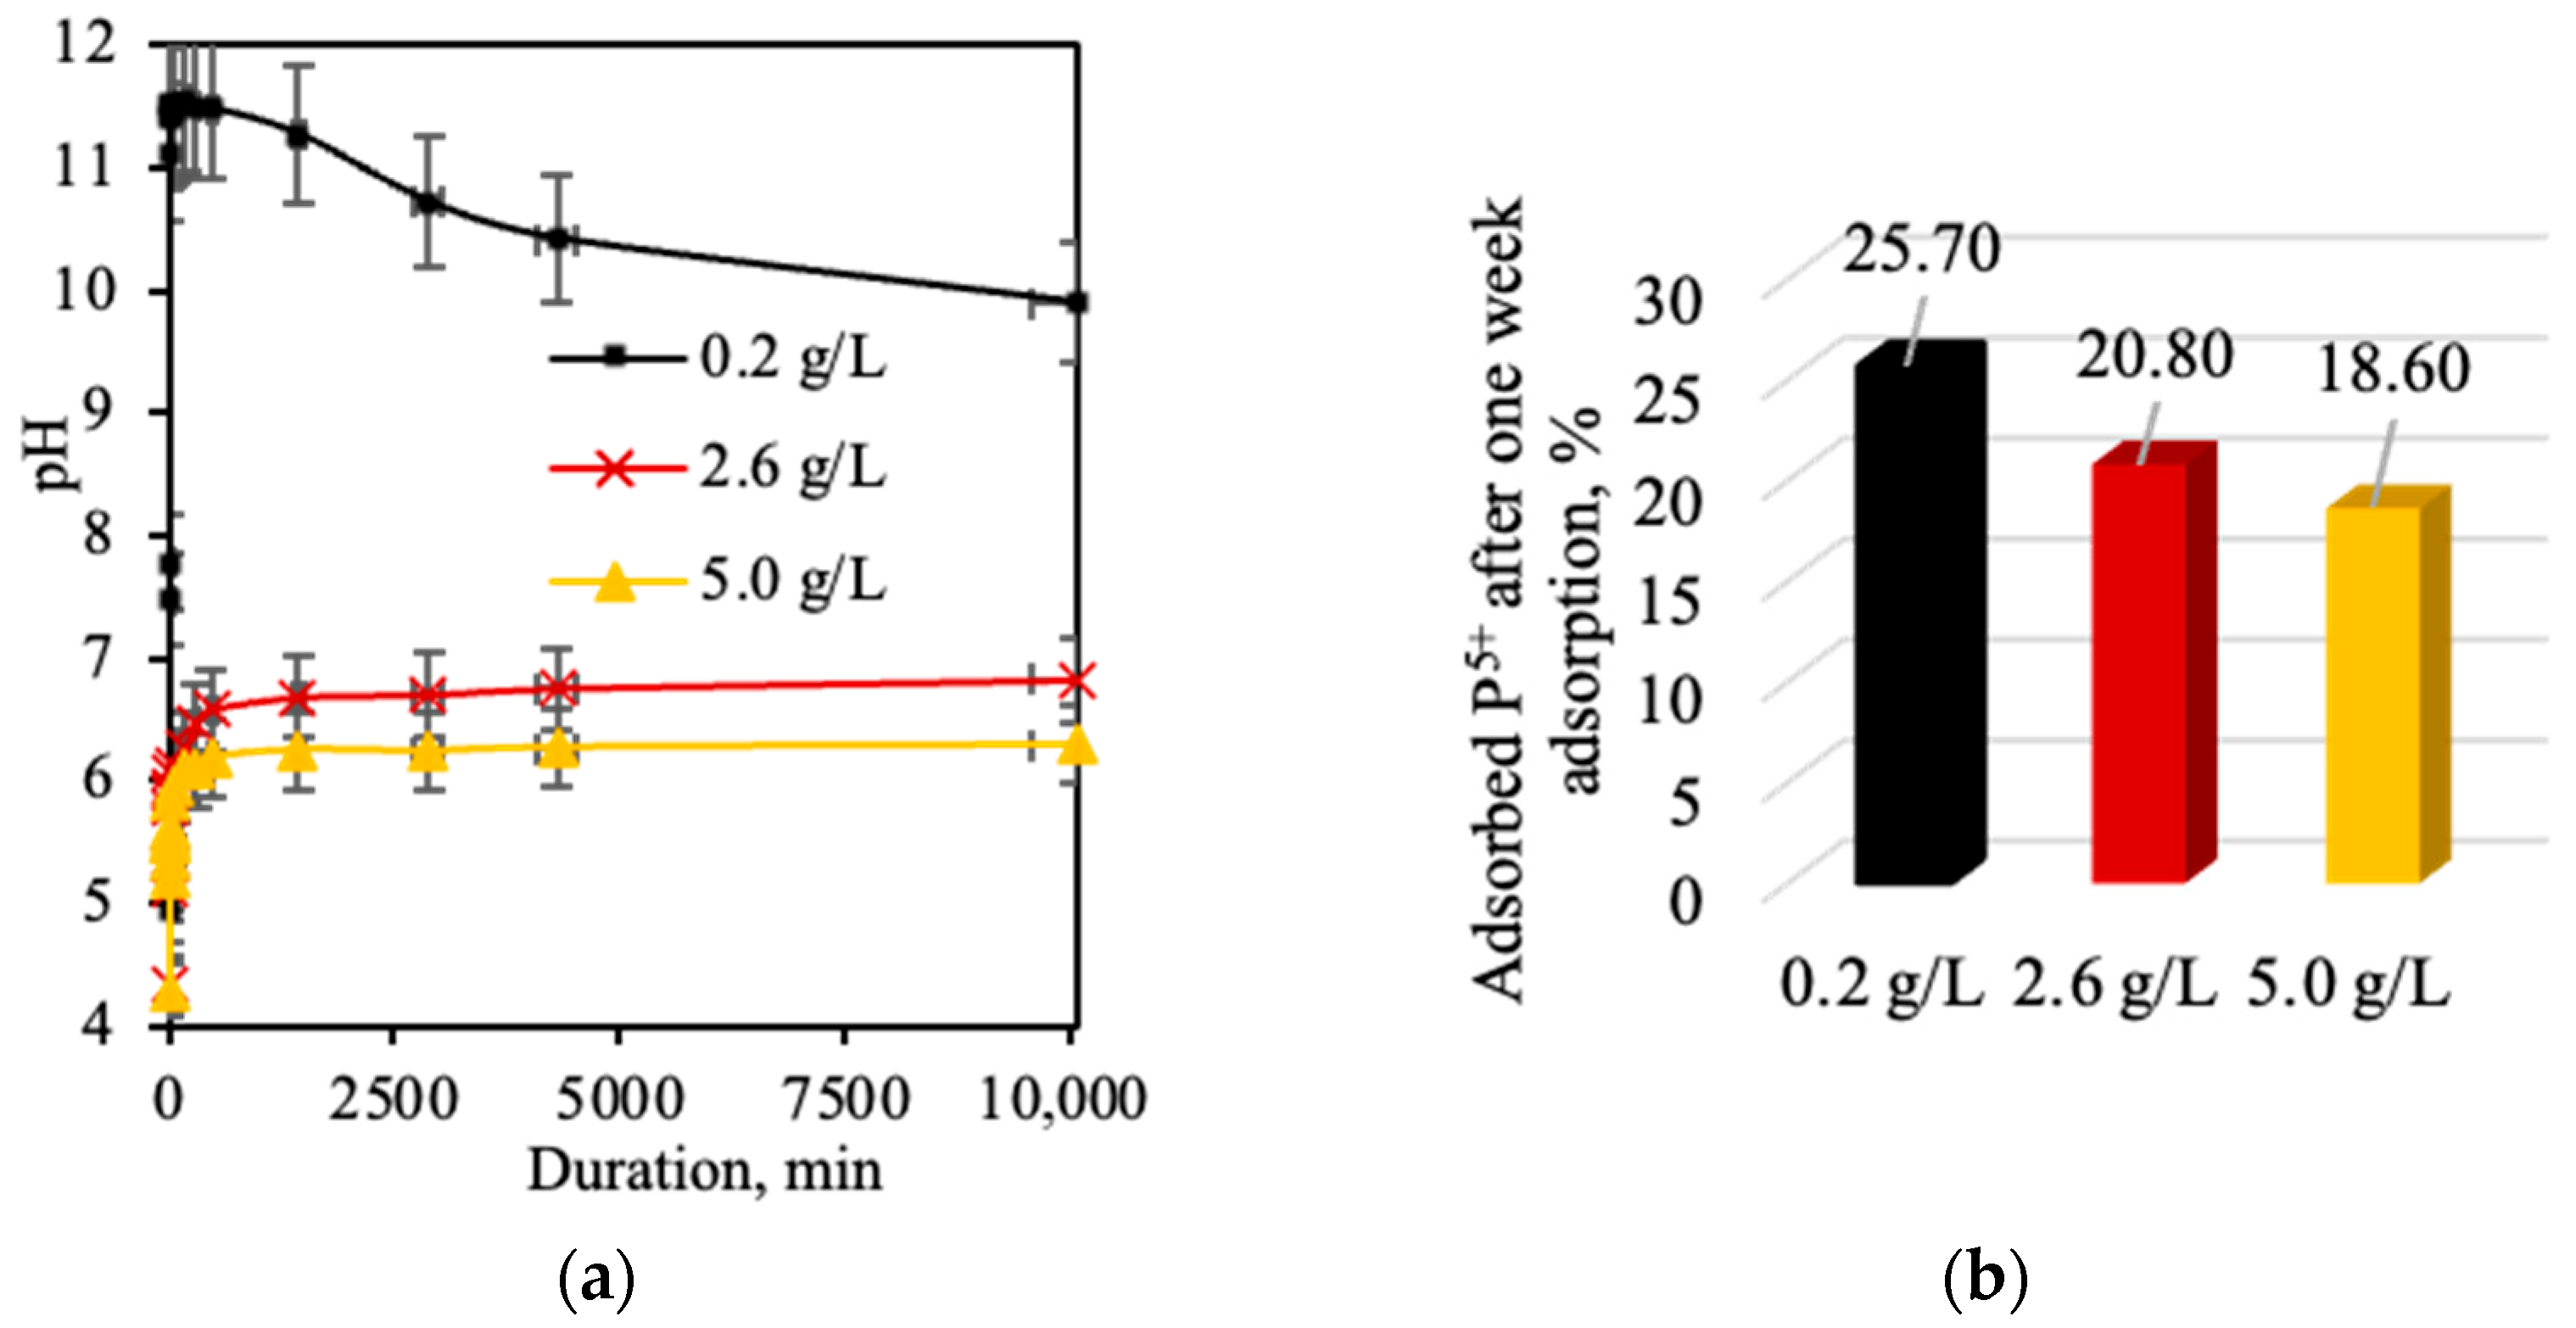
As shown by the adsorption data, opoka is characterized by its ability to adsorb phosphorus ions. The efficiency of adsorption varies with the different initial phosphorus concentrations. In initial solutions containing 0.2 g of P/L, the adsorbent shows optimal efficiency at 25.7%. However, as the initial concentration increases, the adsorption efficiency declines. For example, at a concentration of 2.6 g of P/L, only 20.8% of the phosphorus is removed, while only 18.6% is removed at 5.0 g of P/L (Figure 9b). Furthermore, it was ascertained that the adsorption capacity depends on the pH value. While the highest adsorption capacity of phosphorus was observed at pH values greater than 7, the highest removal efficiency occurred in the pH range of 4–7 (Figure 9a).
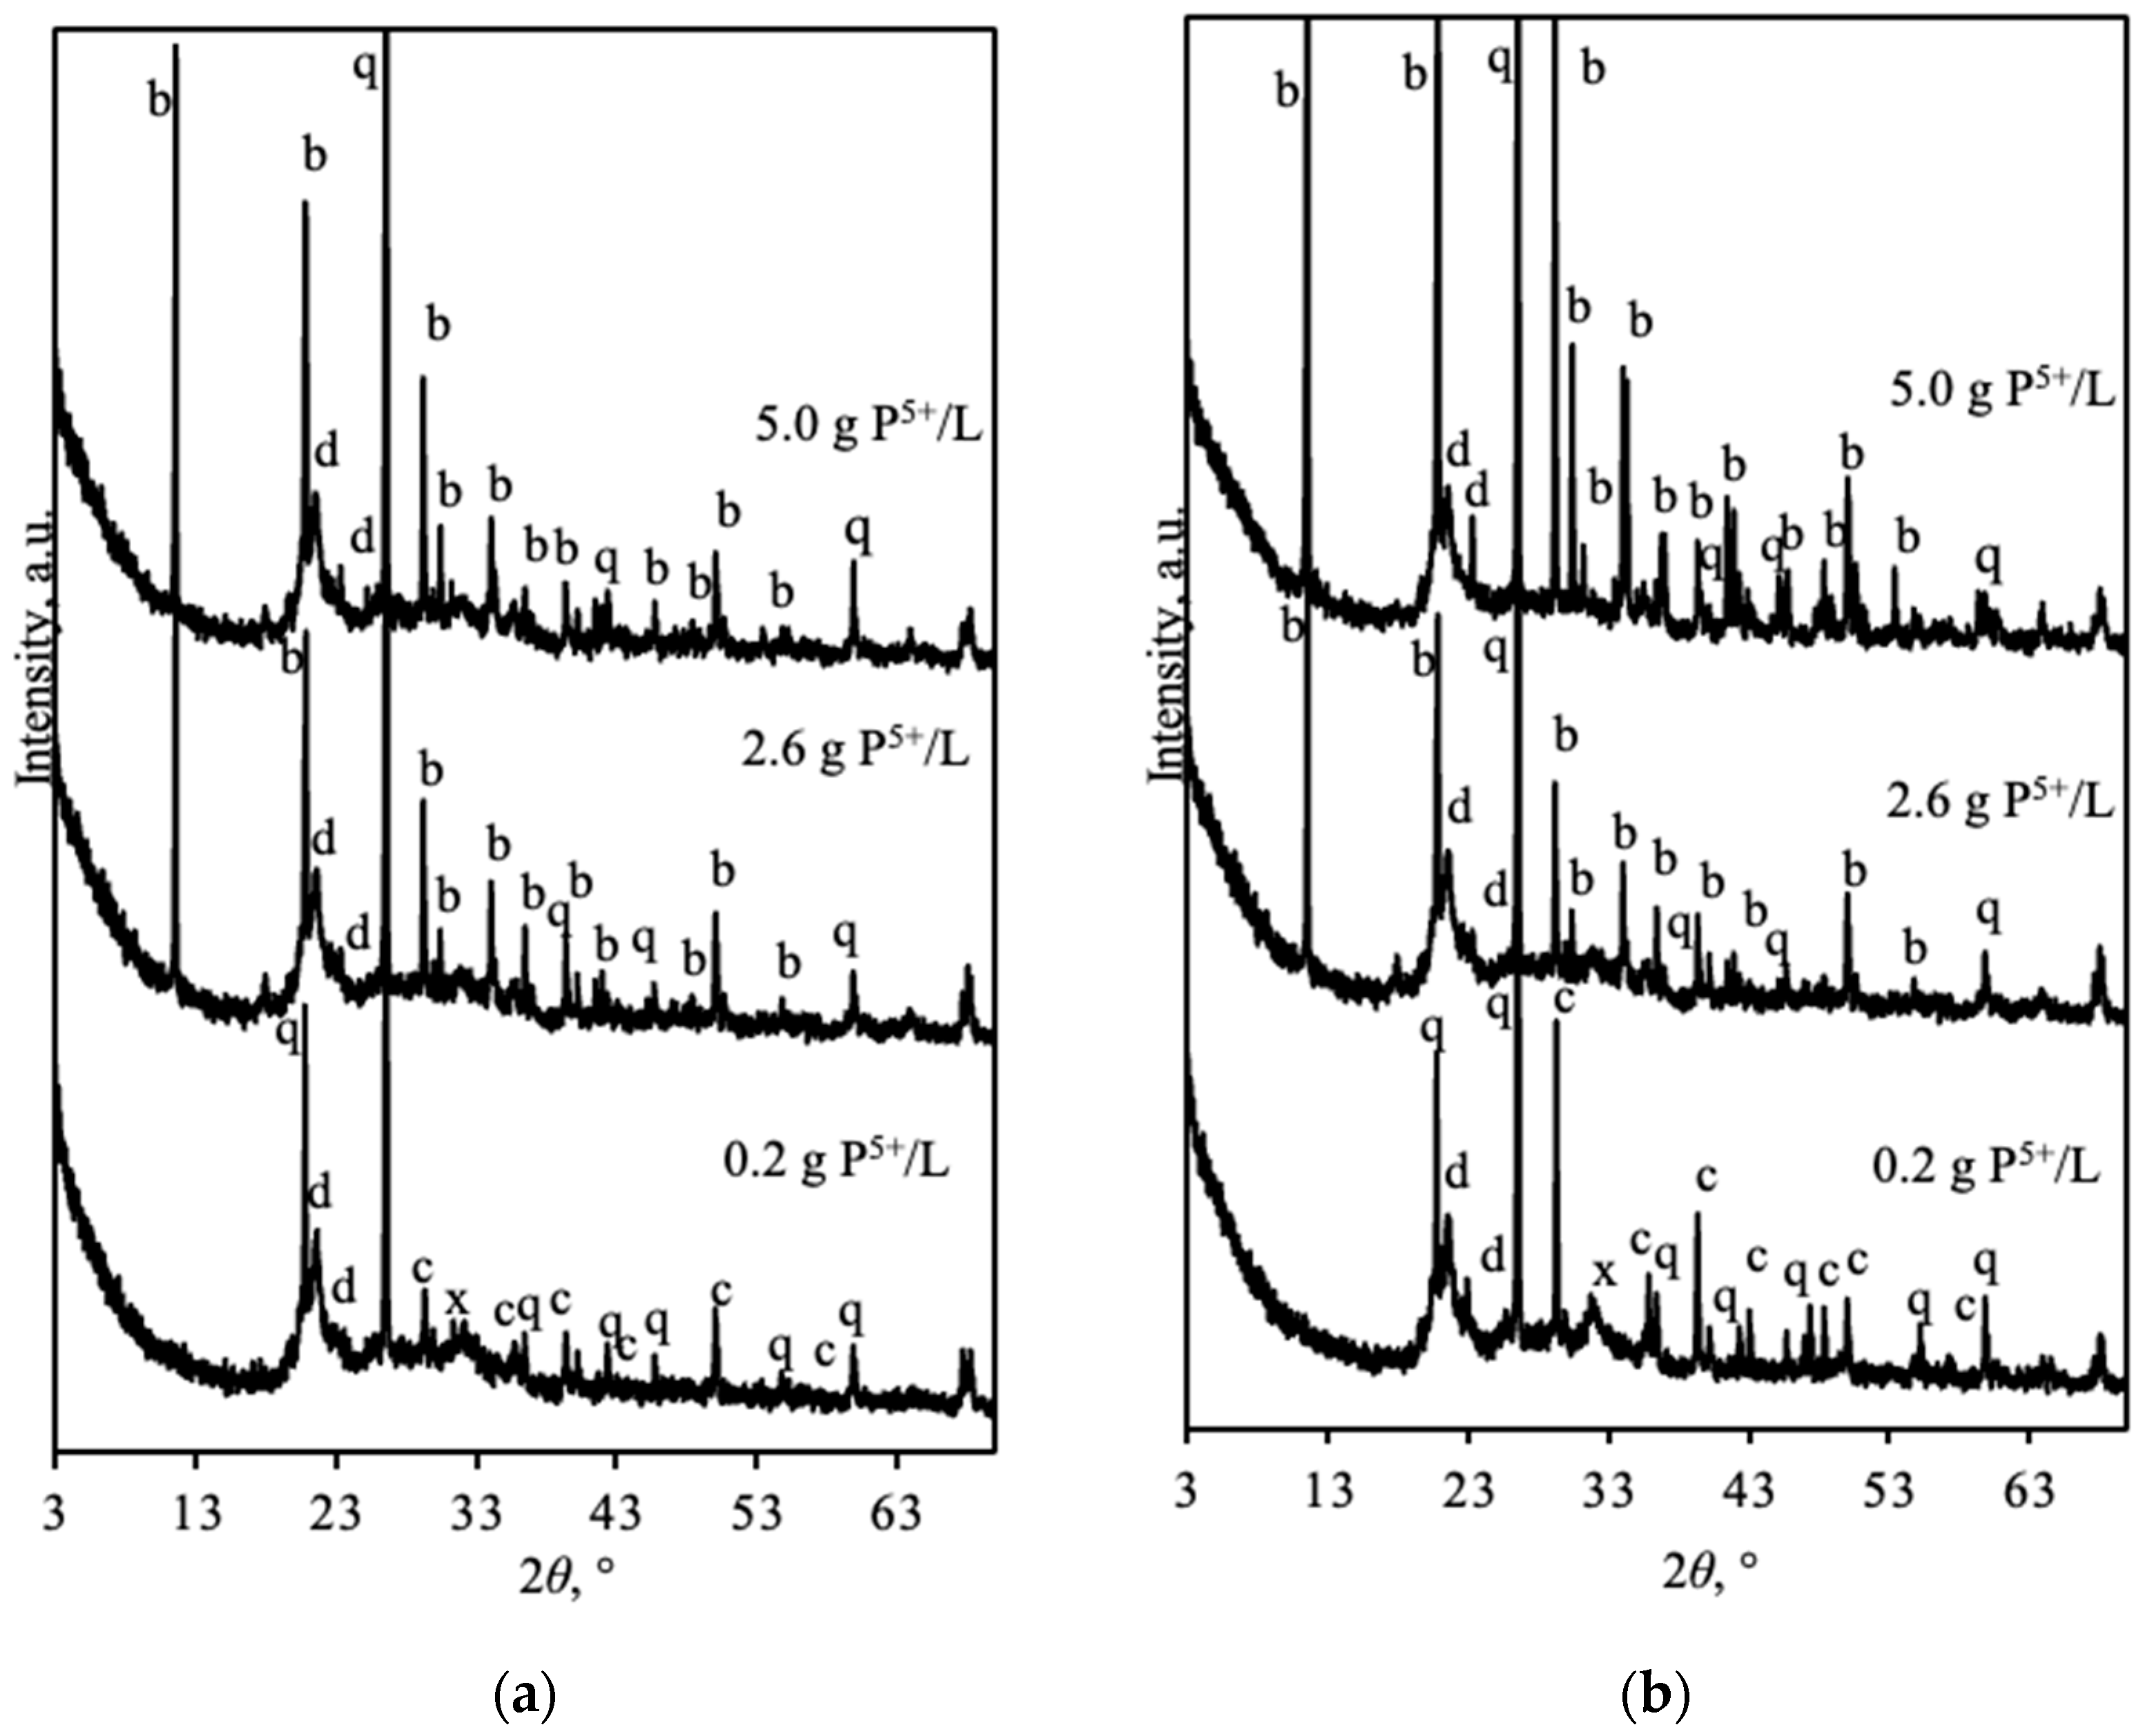
To confirm the previous results, an XRD analysis was performed (Figure 10.). However, the X-ray diffraction curves exhibit a lack of diffraction peaks attributed to calcium phosphate when the initial phosphorus concentration was 0.2 g of P/L. Wollastonite has been shown to react with phosphorus in a liquid medium, leading to the formation of calcium phosphate. This is supported by the absence of wollastonite in the XRD pattern after the adsorption experiment. Nevertheless, it can be established that there are broad and curved peaks around 2θ = 22 and 32 °C, which, according to the literature [48], mark the occurrence of the amorphous calcium phosphate phase. Thus, it can be stated that the interaction between calcium and phosphorus results in the formation of amorphous calcium phosphate (ACP), with the expected formula CaxHy(PO4)z·nH2O. ACP is often observed as a transient phase during the formation of CaP in aqueous systems. Typically, ACP is the first phase that develops from a supersaturated solution containing calcium cations and phosphate anions. The structure of ACP is still uncertain and has been reported to be more soluble than that of brushite [49]. In addition, the presence of an unreacted calcium-containing compound calcite was identified, confirming that not all Ca2+ ions were released into the solution. This compound was identified owing to the presence of a basic solution medium, as it is unstable in acidic media because of its alkaline nature. Other unreached mineral phases, such as quartz and tridymite, were also identified. The results demonstrate that an increase in the concentration of the initial solution engenders alterations in the phase composition of the adsorption product. The increase in concentration to 2.6 g of P/L resulted in the formation of brushite (CaPO3(OH)·2H2O PDF 00-009-0077, d-spacing—0.835; 0.346; 0.263 nm) after 30 min of adsorption (Figure 10.; a). The extension of the adsorption duration led to an increase in the intensity of the brushite diffraction peaks. The calcium was determined to have undergone a full reaction; however, unreacted tridymite and quartz were identified. An increase to 5.0 g of P/L resulted in a nearly identical outcome but with more intense brushite peaks (Figure 10b).

3.5. Adsorption Mechanism

The discussed results indicate that phosphorus removal occurred through the interaction between calcium-containing compounds (wollastonite and calcium carbonate), leading to the formation of amorphous calcium phosphate and brushite. It is known that the species of phosphorus compound formed depends on the pH value of the solution, the amount of reactive Ca2+, and the form in which phosphorus occurs in solution. To summarize the aforementioned data, the possible mechanism of phosphorus removal was expressed using Equations (1)–(11).
The first stage of phosphorus removal involves the dissociation of the adsorbate, in this case KH2PO4, in water (Equation (1)). When a solid phosphorus-containing compound, KH2PO4, enters the solution, it can exist in three different forms depending on the pH value: if the solution is more acidic, phosphorus exists as H3PO4; when the solution pH increases, in liquid media, it manly exists in the form of H2PO4; and when the solution becomes more alkaline, phosphorus appears in the form of phosphate (Equation (2)) [50,51].
K H 2 P O 4 K + + H 2 P O 4
H 3 P O 4 4.5 H 2 P O 4 + H + 7.2 H P O 4 2 + 2 H + 12.0 P O 4 3 + 3 H +
As shown in Figure 9, when the initial concentration of phosphorus in the experimental solution is 0.2 g of P/L, the solution is alkaline; thus, it can be stated that the dominant form of phosphorus is HPO42–. An increase in concentration leads to a decrease in pH values, making the solution more acidic and resulting in the appearance of H2PO4.
The second stage can be described by wollastonite dissociation. When calcinated opoka containing wollastonite is placed in a solution of different concentrations containing various forms of phosphorus ions, the H+ ions present in the solution react with CaSiO3, causing CaSiO3 to dissociate into Ca2+ ions and SiO2, as described in Equation (3) [52].
C a S i O 3 + H 2 O C a 2 + + 2 O H + H 4 S i O 4  
The form of silica present in water differs depending on the pH level (Equation (4)). For example, a pH level of 7 results in particulate silica, such as H4SiO4 or SiO2. In contrast, a pH level of 11 results in monoanionic H3SiO4, which is a form of dissolved silica. A higher pH determines the existence of H2SiO42–. It is worth noting that adding calcium increases the pH level and solubility of silica, and this is the reason why different forms of silica can exist because the rate at which CaSiO3 dissociates into its ions depends on the concentration of H+ ions in the solution and the maximum solubility of Ca2+ ions [53].
H 4 S i O 4 p H   7 H 3 S i O 4 + H + p H   11 H 2 S i O 4 2 + H +
These reactions are relevant across all pH levels, with slight differences caused by the carbonization of wollastonite. Wollastonite reacts in the presence of CO2 in aqueous conditions with calcium carbonate and amorphous silicon oxide:
C a S i O 3 + C O 2 H 2 O   C a C O 3 + S i O 2 a m o r p h o u s
When the pH is near neutral and CO2 is present, CO2 dissociates into HCO3, and CaCO3 precipitates, as shown in Equation (8).
C O 2 C O 2 a q
C O 2 a q + H 2 O H C O 3 + H +
H C O 3 C O 3 2 + H +
H C O 3 + C a 2 + p h < 9.4 C a C O 3 + H +
As calcium dissociates in solution, the third stage occurs rapidly, and the formation of calcium phosphates begins as follows [51]:
C a 2 + + 2 O H + H P O 4 2 12 > p h > 7 C a x H y ( P O 4 ) z · n H 2 O
C a 2 + + H 2 P O 4 p h < 7 C a H P O 4 · 2 H 2 O
The abovementioned equations and Figure 9 demonstrate that the formation of amorphous calcium phosphate and brushite formation also depend on the solution’s pH, which is influenced by hydrogen ion (H+) and hydroxyl ion (OH) concentrations. Amorphous calcium phosphate forms when calcium ions (Ca2+), phosphate ions (PO43−/HPO42−), and hydroxyl ions (OH) combine under conditions where the solution is supersaturated and the pH value is between 7 and 12. This interaction was established in a solution with an initial phosphorus concentration of 0.2 g of P/L. According to the literature, a higher Ca/P molar ratio leads to the formation of amorphous calcium phosphate. Amorphous calcium phosphate is characterized by its relatively high solubility and ability to trigger a substantial release of Ca2+ and PO42– ions. The chemical composition of ACP strongly depends on the pH value of the solution and the concentrations of calcium and phosphate ions. As described in the literature, ACP phases form with Ca/P ratios between 1.12 and 2.2. Based on the XRF results and calculated phosphorus content, this ratio should be around 8, but the results showed approximately 10–20% calcium dissolution, leading to a decrease in the Ca/P molar ratio to levels reported in the literature. When phosphorus in solution occurs at low concentrations, less H+ is released, and the solution pH becomes more alkaline, ranging from 6.6 to 11.7, resulting in the presence of PO43− and HPO42−, conditions that are suitable for amorphous calcium phosphate [48,49].
Increasing the concentration to 2.6 and 5 g of P/L causes structural changes and alters the conditions and mechanisms of calcium phosphate formation. As the initial phosphorus concentration increases, brushite tends to form. This is mainly because higher concentrations, more H+ ions from KH2PO4 are present, and the solution becomes more acidic, which means the pH value falls below 7; thus, phosphorus—in this case, in solution—occurs in the form of HPO42–. The existence of this form of phosphorus leads to the formation of brushite with the formula CaHPO4·2H2O. It is worth mentioning that H2PO4 is characterized by a weaker reaction with Ca2+, which explains the slower removal rate at these low pH levels as the pH and the concentration of HPO42− ions increase, while the concentration of PO43- ions decreases and brushite forms. Although brushite is more thermodynamically stable, amorphous calcium phosphate is favored kinetically. This understanding guided our use of adsorption kinetics equations.

3.6. Adsorption Kinetics

The adsorption kinetics and rate constants were determined using kinetic models, including the pseudo-first-order and pseudo-second-order models. The pseudo-first-order and pseudo-second-order adsorption kinetic models, which are based on equilibrium adsorption, are represented as follows:
log q e q t = log q e k 1 2.303 · t  
t q t = 1 k q e 2 + 1 q e · t  
where qe and qt are the amounts of phosphorus ions adsorbed onto the calcinated opoka adsorbent (mg/g) at equilibrium and at a given duration, t, respectively. k1 and k2 are the rate constants for the pseudo-first-order and pseudo-second-order kinetic models, respectively.
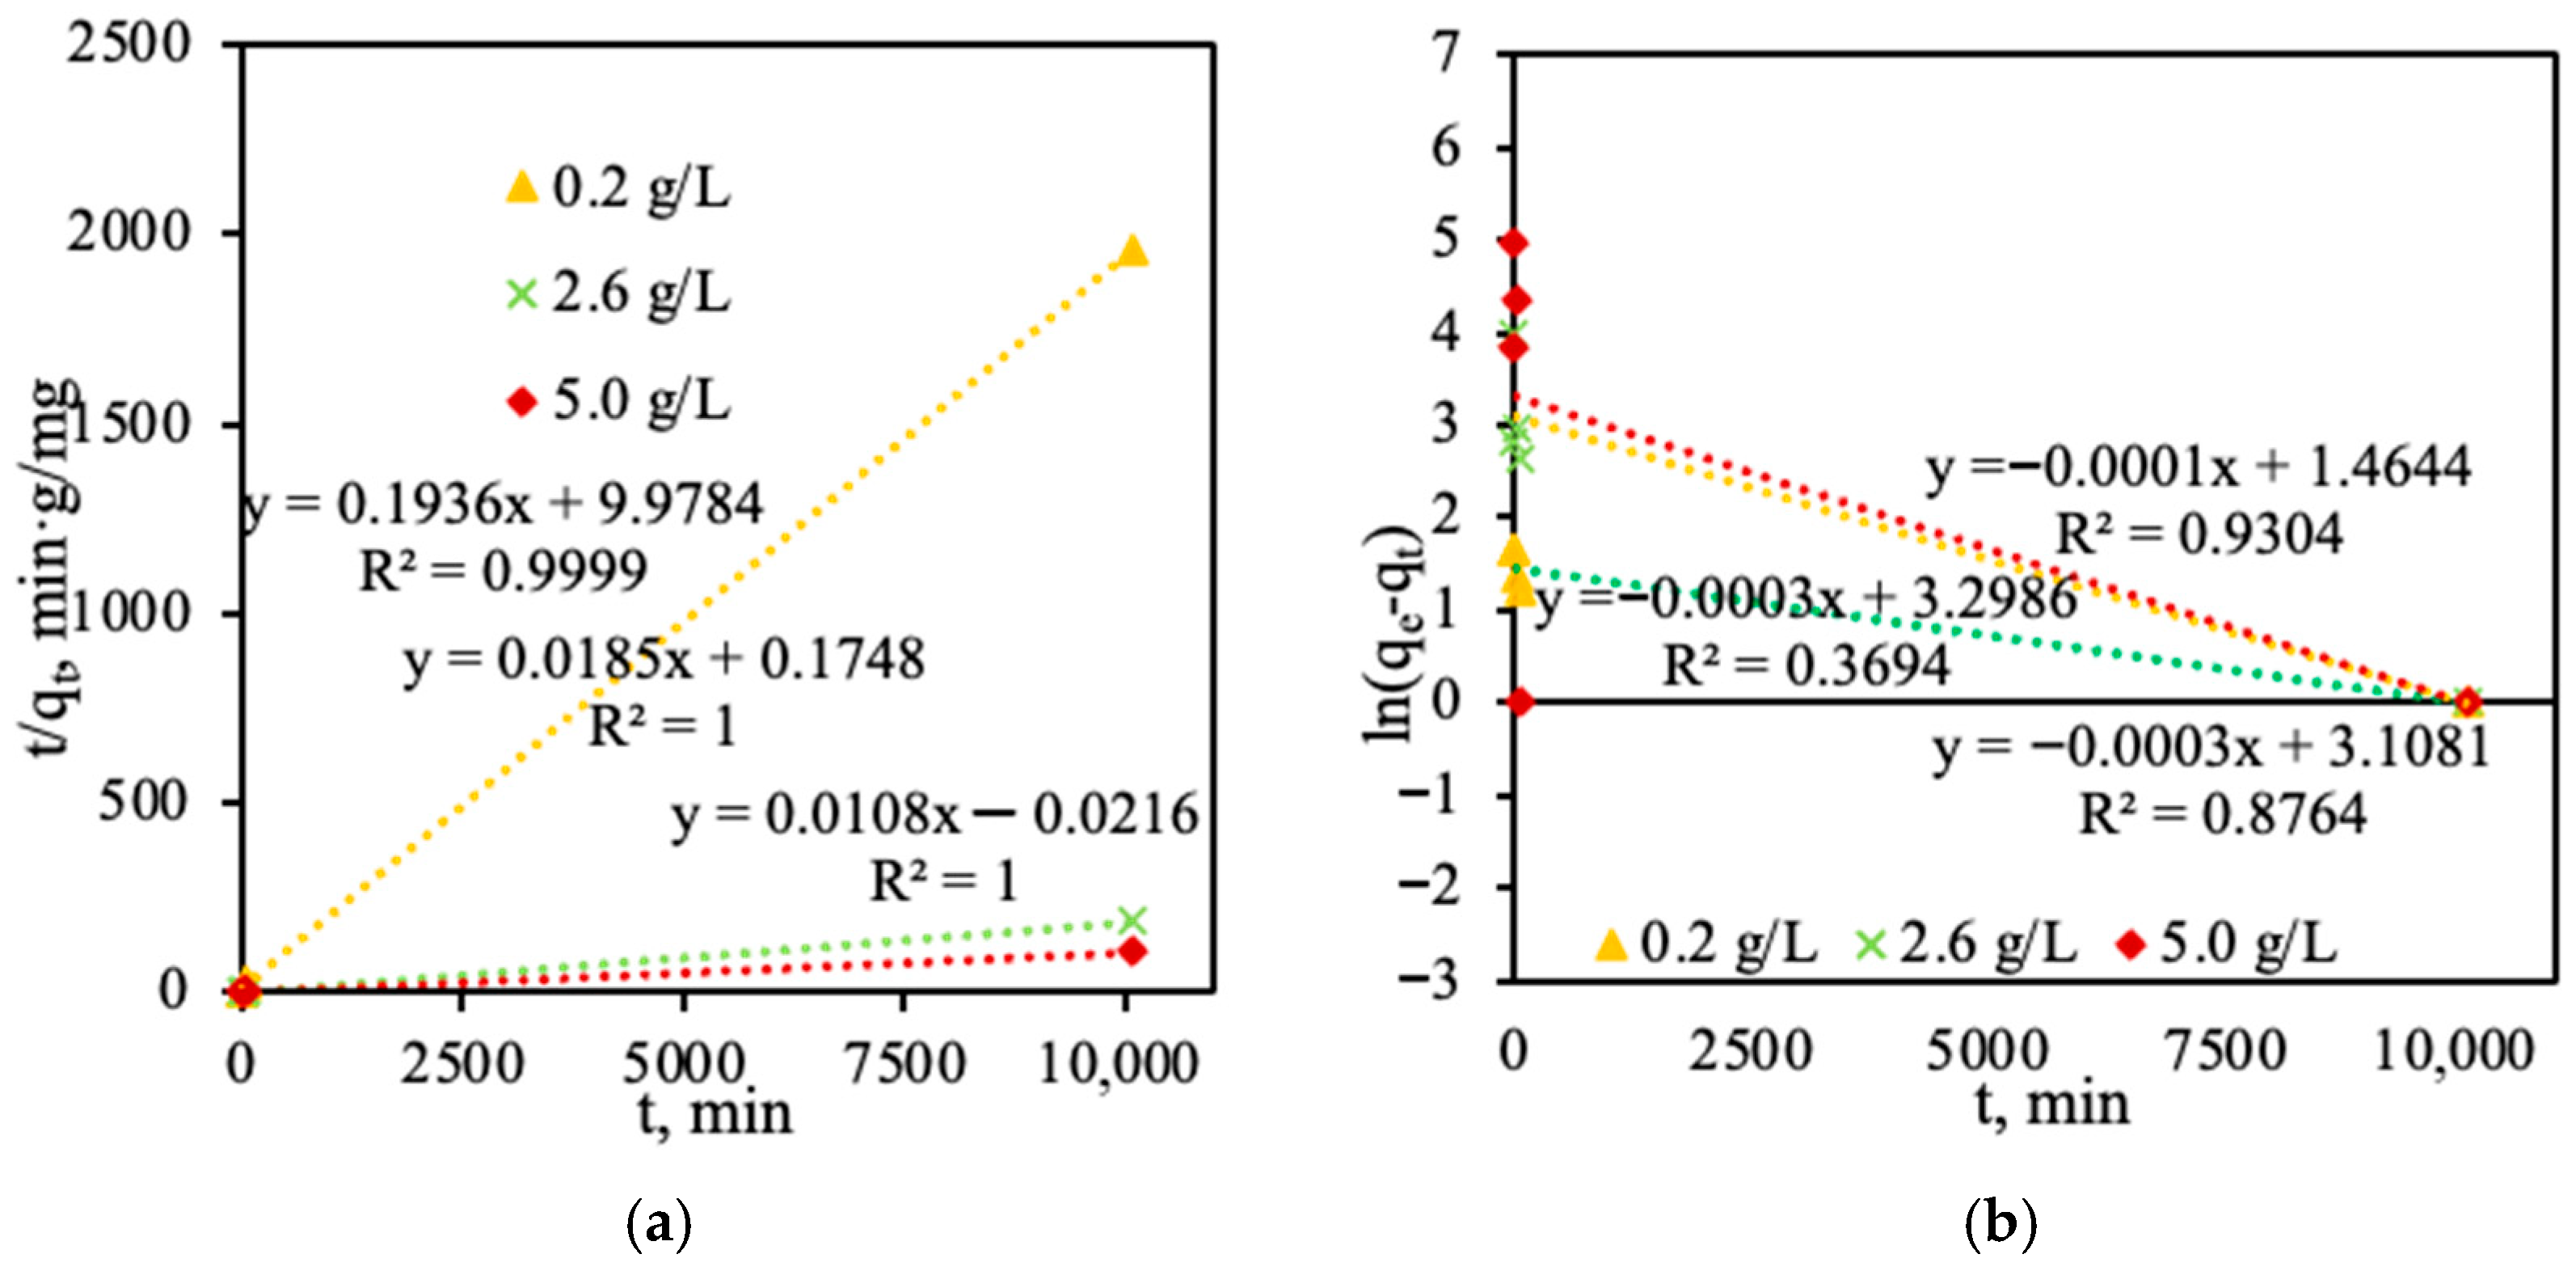
Figure 11 and Table 4 illustrate the kinetics of the adsorption of phosphorus onto the calcinated opoka in solutions with various initial phosphorus concentrations. The results of the pseudo-first-order kinetic model showed an R2 value of less than 0.9304, indicating that this model was not suitable for describing the adsorption process. In contrast, the pseudo-second-order model showed higher R2 values, exceeding 0.999, indicating it was more reliable for describing the adsorption process. This result indicates that the rate of adsorption of phosphorus onto the adsorbent was controlled by a chemical reaction, implying that the chemisorption process involves the exchange or sharing of electrons between the adsorbate and the adsorbent at equilibrium.
The calculated k2 values for phosphorus adsorption decreased with an increasing initial phosphorus concentration: 0.2 g of P/L (0.00281 g/(mg·min)) > 2.6 g of P/L (0.00195 g/(mg·min)) > 5.0 g of P/L (0.0000212 g/(mg·min)). These observations indicate that calcinated opoka exhibited suitable adsorption properties, resulting in higher efficiency and faster rate of adsorption for phosphorus ions with an initial concentration of 0.2 g of P/L. Furthermore, the adsorption capacity increased as the concentration increased to 5.0 g of P/L. Our results and findings in the literature indicate that opoka demonstrates better adsorption capacity than other adsorbents. For example, natural clay minerals and kaolinite have demonstrated low adsorption capacities for phosphorus, at 0.49 mg/g and 0.32 mg/g, respectively. Bentonite has an adsorption capacity of approximately 0.3 mg/g. Although metal oxides are characterized by faster adsorption (generally less than an hour), calcium, despite having a lower adsorption rate, achieves equilibrium after a few hours. A calcium-based adsorbent, however, achieves higher maximum capacities [54].

4. Conclusions

As mentioned above, despite its promising mineralogical features, there has been a lack of systematic studies evaluating natural opoka’s phosphorus adsorption efficiency under controlled conditions. This study examined the influence of key operational parameters, including pH, initial phosphate concentration, contact time, and adsorbent dosage, on phosphorus removal efficiency, providing the following novel insights:
1.
Natural opoka (SiO2—50.5%, CaO—23.3%, molar ratio CaO/SiO2 ~0.45), predominantly consisting of quartz, tridymite, and calcite minerals, is a suitable raw material for the synthesis of reactive calcium silicates. During thermal treatment at a temperature of 850 °C, calcite decomposed completely, and active CaO reacted with SiO2 by forming wollastonite.
2.
Calcined opoka has the capacity for phosphorus ion adsorption, but as the initial solution concentration increases, the adsorption efficiency decreases: at 0.2 g of P/L, 25.7% (5.14 mg/g) was removed; at 2.6 g of P/L, 20.8% (54.08 mg/g) was removed; and at 5.0 g of P/L, only 18.6% (93.00 mg/g) was removed. Meanwhile, potassium ion adsorption was insignificant and reversible in all cases; therefore, opoka is ineffective for removing K+ from aqueous systems.
3.
The adsorption of phosphorus ions follows a pseudo-second-order kinetic model (R2 > 0.999), indicating chemisorption is the dominant mechanism. The adsorption rate constant (k2) decreases with increasing phosphorus concentration, whereas the adsorption capacity increases.
4.
pH is a critical factor controlling both the efficiency and mechanism of the adsorption of phosphorus on calcined opoka. In an alkaline solution (pH > 7), phosphate ions (PO43− and HPO42−) react with Ca2+ to form amorphous calcium phosphate, allowing faster kinetics and higher removal efficiency. Under acidic conditions (pH < 7), adsorption occurs through brushite (CaHPO4·2H2O) crystallization, a slower and less efficient process (~18–21%).

Author Contributions

Investigation, E.S.; methodology, E.S. and T.D.; formal analysis, E.S.; validation, E.S. and T.D.; visualization, E.S. and T.D.; software, E.S. and T.D.; writing—original draft, E.S. and K.B.; data curation, E.S.; writing—review and editing, E.S.; T.D. and K.B.; conceptualization, K.B.; supervision, K.B. All authors have read and agreed to the published version of the manuscript.

Funding

This research was funded by the Doctoral Fund of Kaunas University of Technology.

Data Availability Statement

The data supporting the findings of this study are available upon request from the corresponding author.

Conflicts of Interest

The authors declare there are no conflicts of interest.

References

  1. Kacprzak, M.J.; Sobik-Szołtysek, J. The opoka-rock in N and P of poultry manure management according to circular economy. J. Environ. Manag. 2022, 316, 115262. [Google Scholar] [CrossRef]
  2. Dragomir, V.D.; Dumitru, M. The state of the research on circular economy in the European Union: A bibliometric review. Clean. Waste Syst. 2023, 7, 100127. [Google Scholar] [CrossRef]
  3. Loganathan, P.; Vigneswaran, S.; Kandasamy, J.; Bolan, N.S. Removal and Recovery of Phosphate From Water Using Sorption. Crit. Rev. Environ. Sci. Technol. 2014, 44, 847–907. [Google Scholar] [CrossRef]
  4. Regulation (EU) 2024/1252 of the European Parliament and of the Council of 11 April 2024 Establishing a Framework for Ensuring a Secure and Sustainable Supply of Critical Raw materials and Amending Regulations (EU) No 168/2013, (EU) 2018/858, (EU) 2018/1724 and (EU) 2019/1020 (Text with EEA relevance). Available online: http://data.europa.eu/eli/reg/2024/1252/oj (accessed on 1 August 2025).
  5. Kelly, A. Towards sustainable phosphorus use in the European Union: Evaluating resource cap scenarios. J. Clean. Prod. 2025, 516, 145849. [Google Scholar] [CrossRef]
  6. Withers, P.; Rothwell, S.; Ross, K. Managing phosphorus input pressures for improving water quality at the catchment scale. J. Environ. Manag. 2024, 370, 122792. [Google Scholar] [CrossRef] [PubMed]
  7. Kowalczewska-Madura, K.; Dondajewska, R.; Gołdyn, R.; Podsiadłowski, S. The influence of restoration measures on phosphorus internal loading from the sediments of a hypereutrophic lake. Environ. Sci. Pollut. Res. 2017, 24, 14417–14429. [Google Scholar] [CrossRef] [PubMed]
  8. Luo, Q.; Wei, J.; Guo, Z.; Song, Y. Adsorption and immobilization of phosphorus from water and sediments using a lanthanum-modified natural zeolite: Performance, mechanism and effect. Sep. Purif. Technol. 2023, 329, 125187. [Google Scholar] [CrossRef]
  9. Forsius, M.; Posch, M.; Holmberg, M.; Vuorenmaa, J.; Kleemola, S.; Augustaitis, A.; Beudert, B.; Bochenek, W.; Clarke, N.; de Wit, H.A.; et al. Assessing critical load exceedances and ecosystem impacts of anthropogenic nitrogen and sulphur deposition at unmanaged forested catchments in Europe. Sci. Total. Environ. 2021, 753, 141791. [Google Scholar] [CrossRef]
  10. Akinnawo, S.O. Eutrophication: Causes, consequences, physical, chemical and biological techniques for mitigation strategies. Environ. Chall. 2023, 12, 100733. [Google Scholar] [CrossRef]
  11. Sun, X.; Bol, R.; Klumpp, E.; Li, M. Organic phosphorus leaching risk from agricultural soils across China. Chem. Biol. Technol. Agric. 2022, 9, 35. [Google Scholar] [CrossRef]
  12. Flint, E.M.; Ascott, M.J.; Gooddy, D.C.; Stahl, M.O.; Surridge, B.W.J. Watermains Leakage and Outdoor Water Use Are Responsible for Significant Phosphorus Fluxes to the Environment Across the United States. Glob. Biogeochem. Cycles 2023, 37, e2022GB007614. [Google Scholar] [CrossRef]
  13. Lisi, P.J.; Hein, C.L. Eutrophication drives divergent water clarity responses to decadal variation in lake level. Limnol. Oceanogr. 2018, 64, S49–S59. [Google Scholar] [CrossRef]
  14. Hupfer, M.; Lewandowski, J. Oxygen Controls the Phosphorus Release from Lake Sediments—A Long-Lasting Paradigm in Limnology. Int. Rev. Hydrobiol. 2008, 93, 415–432. [Google Scholar] [CrossRef]
  15. Ogwu, M.C.; Patterson, M.E.; Senchak, P.A. Phosphorus mining and bioavailability for plant acquisition: Environmental sustainability perspectives. Environ. Monit. Assess. 2025, 197, 572. [Google Scholar] [CrossRef]
  16. Tahraoui, H.; Toumi, S.; Boudoukhani, M.; Touzout, N.; Sid, A.N.E.H.; Amrane, A.; Belhadj, A.-E.; Hadjadj, M.; Laichi, Y.; Aboumustapha, M.; et al. Evaluating the Effectiveness of Coagulation–Flocculation Treatment Using Aluminum Sulfate on a Polluted Surface Water Source: A Year-Long Study. Water 2024, 16, 400. [Google Scholar] [CrossRef]
  17. Karunanithi, R.; Szogi, A.A.; Bolan, N.; Naidu, R.; Loganathan, P.; Hunt, P.G.; Vanotti, M.B.; Saint, C.P.; Ok, Y.S.; Krishnamoorthy, S. Phosphorus Recovery and Reuse from Waste Streams. In Advances in Agronomy; Elsevier: Amsterdam, The Netherlands, 2015; pp. 173–250. [Google Scholar] [CrossRef]
  18. Salkunić, A.; Vuković, J.; Smiljanić, S. Review of Technologies for the Recovery of Phosphorus from Waste Streams. Chem. Biochem. Eng. Q 2022, 36, 91–116. [Google Scholar] [CrossRef]
  19. Usman, M.O.; Aturagaba, G.; Ntale, M.; Nyakairu, G.W. A review of adsorption techniques for removal of phosphates from wastewater. Water Sci. Technol. 2022, 86, 3113–3132. [Google Scholar] [CrossRef] [PubMed]
  20. Satyam, S.; Patra, S. Innovations and challenges in adsorption-based wastewater remediation: A comprehensive review. Heliyon 2024, 10, e29573. [Google Scholar] [CrossRef]
  21. Vu, M.T.; Duong, H.C.; Wang, Q.; Ansari, A.; Cai, Z.; Hoang, N.B.; Nghiem, L.D. Recent technological developments and challenges for phosphorus removal and recovery toward a circular economy. Environ. Technol. Innov. 2023, 30, 103114. [Google Scholar] [CrossRef]
  22. Abdoli, S.; Lajayer, B.A.; Dehghanian, Z.; Bagheri, N.; Vafaei, A.H.; Chamani, M.; Rani, S.; Lin, Z.; Shu, W.; Price, G.W. A Review of the Efficiency of Phosphorus Removal and Recovery from Wastewater by Physicochemical and Biological Processes: Challenges and Opportunities. Water 2024, 16, 2507. [Google Scholar] [CrossRef]
  23. Bacelo, H.; Pintor, A.M.; Santos, S.C.; Boaventura, R.A.; Botelho, C.M. Performance and prospects of different adsorbents for phosphorus uptake and recovery from water. Chem. Eng. J. 2020, 381, 122566. [Google Scholar] [CrossRef]
  24. Mohanrasu, K.; Manivannan, A.C.; Rengarajan, H.J.R.; Kandaiah, R.; Ravindran, A.; Panneerselvan, L.; Palanisami, T.; Sathish, C.I. Eco-friendly biopolymers and composites: A sustainable development of adsorbents for the removal of pollutants from wastewater. npj Mater. Sustain. 2025, 3, 13. [Google Scholar] [CrossRef]
  25. Krstić, V. Role of zeolite adsorbent in water treatment. In Handbook of Nanomaterials for Wastewater Treatment; Elsevier: Amsterdam, The Netherlands, 2021; pp. 417–481. [Google Scholar] [CrossRef]
  26. Du, M.; Zhang, Y.; Wang, Z.; Lv, M.; Tang, A.; Yu, Y.; Qu, X.; Chen, Z.; Wen, Q.; Li, A. Insight into the synthesis and adsorption mechanism of adsorbents for efficient phosphate removal: Exploration from synthesis to modification. Chem. Eng. J. 2022, 442, 136147. [Google Scholar] [CrossRef]
  27. Awual, R.; Jyo, A.; Ihara, T.; Seko, N.; Tamada, M.; Lim, K.T. Enhanced trace phosphate removal from water by zirconium(IV) loaded fibrous adsorbent. Water Res. 2011, 45, 4592–4600. [Google Scholar] [CrossRef]
  28. Wang, J.; Wei, X.; Shen, Y.; Kong, H.; Wang, W.; Jr, R.L.S.; Guo, H. Mitigation of phosphorus contamination from livestock farms with La-containing hydrochar adsorbent. Sep. Purif. Technol. 2024, 359, 130465. [Google Scholar] [CrossRef]
  29. Rahutomo, S.; Kovar, J.L.; Thompson, M.L. Varying redox potential affects P release from stream bank sediments. PLoS ONE 2018, 13, e0209208. [Google Scholar] [CrossRef] [PubMed]
  30. Chong, Z.T.; Soh, L.S.; Yong, W.F. Valorization of agriculture wastes as biosorbents for adsorption of emerging pollutants: Modification, remediation and industry application. Results Eng. 2023, 17, 100960. [Google Scholar] [CrossRef]
  31. Luo, X.; Wu, X.; Reng, Z.; Min, X.; Xiao, X.; Luo, J. Enhancement of Phosphate Adsorption on Zirconium Hydroxide by Ammonium Modification. Ind. Eng. Chem. Res. 2017, 56, 9419–9428. [Google Scholar] [CrossRef]
  32. Brogowski, Z.; Renman, G. Characterization of Opoka as a Basis for Its Use in Wastewater Treatment. Pol. J. Environ. Stud. 2004, 13, 15–20. [Google Scholar]
  33. Johansson, L.; Gustafsson, J.P. Phosphate removal using blast furnace slags and opoka-mechanisms. Water Res. 2000, 34, 259–265. [Google Scholar] [CrossRef]
  34. Kacprzak, M.; Malińska, K.; Grosser, A.; Sobik-Szołtysek, J.; Wystalska, K.; Dróżdż, D.; Jasińska, A.; Meers, E. Cycles of carbon, nitrogen and phosphorus in poultry manure management technologies – environmental aspects. Crit. Rev. Environ. Sci. Technol. 2023, 53, 914–938. [Google Scholar] [CrossRef]
  35. Zawadzka, B.; Siwiec, T.; Marzec, M.; Jóźwiakowski, K.; Listosz, A. Meandering Flow Filter for Phosphorus Removal as a Component of Small Wastewater Treatment Plants—A Case Study. Water 2023, 15, 2703. [Google Scholar] [CrossRef]
  36. Bus, A.; Karczmarczyk, A. Properties of lime-siliceous rock opoka as reactive material to remove phosphorous from water and wastewater. Infrastrukt. Ekol. Teren. Wiej. 2014, 1, 227–238. [Google Scholar]
  37. Montayev, S.; Ongayev, M.; Begalieva, R.; Ryskaliev, M.; Denizbayev, S. Sorption Treatment and Desalination of Mineralized Water Using Opoka to Reduce Hardness and Chloride Content. Int. J. Des. Nat. Ecodynamics 2024, 19, 1733–1740. [Google Scholar] [CrossRef]
  38. Kalenik, M.; Chalecki, M. Investigations on the effectiveness of wastewater purification in medium sand with assisting opoka rock layer. Environ. Prot. Eng. 2021, 47, 53–65. [Google Scholar] [CrossRef]
  39. Bobrowska, A.; Jagoda, E.; Domonik, A.; Żurawicka, W. Conservation Treatment in the Process of Strengthening the Stone Architecture of Kazimierz Dolny (Poland). Int. J. Archit. Herit 2025, 19, 1311–1325. [Google Scholar] [CrossRef]
  40. Gubernat, S.; Czarnota, J.; Masłoń, A.; Koszelnik, P.; Pękala, A.; Skwarczyńska-Wojsa, A. Efficiency of phosphorus removal and recovery from wastewater using marl and travertine and their thermally treated forms. J. Water Process Eng 2023, 53, 103642. [Google Scholar] [CrossRef]
  41. Siauciunas, R.; Smalakys, G.; Dambrauskas, T. Porosity of Calcium Silicate Hydrates Synthesized from Natural Rocks. Materials 2021, 14, 5592. [Google Scholar] [CrossRef]
  42. Smalakys, G.; Siauciunas, R. Peculiarities of xonotlite synthesis from the raw materials with different SiO2 activities. J. Therm. Anal. Calorim. 2020, 142, 1671–1679. [Google Scholar] [CrossRef]
  43. Pekala, A. Research on Temporal Leachability of Trace Elements from Opoka-Rocks in The Aspect of Geochemical Environmental Indicators. IOP Conf. Ser. Earth Environ. Sci. 2019, 221, 012125. [Google Scholar] [CrossRef]
  44. Pękala, A.; Musiał, M. Modelling the Leachability of Strontium and Barium from Stone Building Materials. Materials 2021, 14, 3403. [Google Scholar] [CrossRef]
  45. Siauciunas, R.; Mikaliunaite, J.; Urbonas, L.; Baltakys, K. Tribochemical and thermal activation of α-c2s hydrate as precursor for cementitious binders. J. Therm. Anal. Calorim. 2014, 118, 817–823. [Google Scholar] [CrossRef]
  46. Duque-Redondo, E.; Yamada, K.; Arbeloa, I.L.; Manzano, H. Cs-137 immobilization in C-S-H gel nanopores. Phys. Chem. Chem. Phys. 2018, 20, 9289–9297. [Google Scholar] [CrossRef] [PubMed]
  47. Wang, Y.; Zhao, Z.; Wang, J.; Jiang, S.; Ma, X.; Gao, L.; Liu, H. Study on the dynamics of phosphorus adsorption and the risk of release in black soils by conservation tillage. Sci. Rep. 2025, 15, 18417. [Google Scholar] [CrossRef] [PubMed]
  48. Beigoli, S.; Hekmat, A.; Farzanegan, F.; Darroudi, M. Sol-gel synthesis of amorphous calcium phosphate nanoparticles in brown rice substrate and assessment of their cytotoxicity and antimicrobial activities. Avicenna J. Phytomed. 2022, 12, 77–88. [Google Scholar] [CrossRef] [PubMed]
  49. Ta, K.M.; Symington, A.R.; Flitcroft, J.M.; Gillie, L.J.; Cooke, D.J.; Zhu, R.; Gonçalves, M.A.; Parker, S.C.; Molinari, M. Modelling phosphate and arsenate adsorption on cerium dioxide: A density functional theory study. Appl. Surf. Sci. 2025, 708, 163619. [Google Scholar] [CrossRef]
  50. Kashim, M.Z.; Tsegab, H.; Rahmani, O.; Abu Bakar, Z.A.; Aminpour, S.M. Reaction Mechanism of Wollastonite In Situ Mineral Carbonation for CO2 Sequestration: Effects of Saline Conditions, Temperature, and Pressure. ACS Omega 2020, 5, 28942–28954. [Google Scholar] [CrossRef]
  51. Okano, K.; Miyamaru, S.; Kitao, A.; Takano, H.; Aketo, T.; Toda, M.; Honda, K.; Ohtake, H. Amorphous calcium silicate hydrates and their possible mechanism for recovering phosphate from wastewater. Sep. Purif. Technol. 2015, 144, 63–69. [Google Scholar] [CrossRef]
  52. Di Lorenzo, F.; Ruiz-Agudo, C.; Ibañez-Velasco, A.; Millán, R.G.-S.; Navarro, J.A.R.; Ruiz-Agudo, E.; Rodriguez-Navarro, C. The Carbonation of Wollastonite: A Model Reaction to Test Natural and Biomimetic Catalysts for Enhanced CO2 Sequestration. Minerals 2018, 8, 209. [Google Scholar] [CrossRef]
  53. Grinys, A.; Bocullo, V.; Gumuliauskas, A. Research of Alkali Silica Reaction in Concrete With Active Mineral Additives. J. Sustain. Arch. Civ. Eng. 2014, 6, 34–41. [Google Scholar] [CrossRef]
  54. Yan, L.; Xu, Y.; Yu, H.; Xin, X.; Wei, Q.; Du, B. Adsorption of phosphate from aqueous solution by hydroxy-aluminum, hydroxy-iron and hydroxy-iron–aluminum pillared bentonites. J. Hazard. Mater. 2010, 179, 244–250. [Google Scholar] [CrossRef] [PubMed]
Figure 1. XRD pattern of the natural opoka sample. Indexes: c—calcite, q—quartz, and d—tridymite.
Water 17 03017 g001
Figure 2. Natural opoka STA curve: 1—mass loss and 2—heat flow.
Water 17 03017 g002
Figure 3. In situ XRD patterns of natural opoka. Indexes: c—calcite, q—quartz, d—tridymite, and v—wollastonite.
Water 17 03017 g003
Figure 4. XRD pattern of natural opoka calcinated at 850 °C. Indexes: q—quartz, d—tridymite, and v—wollastonite.
Water 17 03017 g004
Figure 5. Residual amounts of phosphorus and potassium after adsorption in a solution containing 0.2 g of P/L.
Water 17 03017 g005
Figure 6. Residual amounts of phosphorus and potassium after adsorption in a solution containing 2.6 g of P/L.
Water 17 03017 g006
Figure 7. Residual amounts of phosphorus and potassium after adsorption in a solution containing 5.0 g of P/L.
Water 17 03017 g007
Figure 8. Concentrations of Ca2+ (a) and silicon Si4+ (b) ions over time at different initial phosphorus concentrations.
Water 17 03017 g008
Figure 9. Variation in pH values of the reaction medium during the adsorption process (a) and adsorption efficiency after one week of adsorption (b).
Water 17 03017 g009
Figure 10. XRD patterns adsorbent after 30 min (a) and 1 week (b) of adsorption. Symbols: q—quartz, d—tridymite, c—calcite, x—amorphous calcium phosphate, and b—brushite.
Water 17 03017 g010
Figure 11. Pseudo-second-order (a) and pseudo-first-order (b) kinetic plots for phosphorus ion adsorption at different temperatures.
Water 17 03017 g011
Table 1. Oxide composition of natural opoka.
Oxides, %
SiO2CaOAl2O3Fe2O3K2OMgOTiO2
53.5824.724.892.551.080.570.36
Oxides, %
SO3SrOP2O5Na2OZrO2OtherLoss on ignition
0.100.080.070.070.030.0311.86
Table 2. Opoka oxide composition based on the literature ([42,43,44,45]).
OxideSiO2Al2O3Fe2O3CaOMgOSO3CO2H2OLoss on Ignition
Range (wt.%)24.55–73.181.01–3.330.32–1.950.80–37.980.35–0.870.23–0.996.84–29.341.48–2.909.14–31.12
Average (wt.%)55.842.001.1020.710.510.4816.191.8118.72
Table 3. Composition of calcinated natural opoka at 850 °C.
Oxides, %
SiO2CaOAl2O3Fe2O3K2OMgOP2O5
62.2326.255.462.631.150.700.53
Oxides, %
TiO2SO3ZrO2SrONa2OOtherTotal
0.380.110.030.090.070.03100.00
Table 4. Kinetic parameters of pseudo-first- and pseudo-second-order kinetic models of P ion adsorption on a synthetic adsorbent.
TemperatureR2qe(exp) (mg/g)qe(cal) (mg/g)k1 (g/(mg·min))k2 (g/(mg·min))
Pseudo-first-order kinetic model
0.2 g of P/L0.935.144.33
2.6 g of P/L0.87654.0822.38
5.0 g of P/L0.36914390.97
Pseudo-second-order kinetic model
0.2 g of P/L0.9995.145.170.00281
2.6 g of P/L154.0854.130.00195
5.0 g of P/L193.0093.240.00000212
Disclaimer/Publisher’s Note: The statements, opinions and data contained in all publications are solely those of the individual author(s) and contributor(s) and not of MDPI and/or the editor(s). MDPI and/or the editor(s) disclaim responsibility for any injury to people or property resulting from any ideas, methods, instructions or products referred to in the content.