Article

Genetic Mechanism of Geothermal Water in Typical Structural Belts from the Altay and Tianshan to the Kunlun Mountains in Xinjiang: Evidence from Hydrogeochemistry and δ2H–δ18O Isotopes

1
Key Laboratory of Xinjiang Coal Resources Green Mining, Ministry of Education, Xinjiang Institute of Engineering, Urumqi 830023, China
2
School of Mining Engineering and Geology, Xinjiang Institute of Engineering, Urumqi 830023, China
3
School of Earth Resources, China University of Geosciences, Wuhan 430074, China
4
First Brigade of Hydrological Engineering Geology, Xinjiang Bureau of Geo-Exploration & Mineral Development, Urumqi 830011, China
*
Author to whom correspondence should be addressed.
Water 2025, 17(20), 2946; https://doi.org/10.3390/w17202946 (registering DOI)
Submission received: 3 September 2025 / Revised: 6 October 2025 / Accepted: 9 October 2025 / Published: 13 October 2025
(This article belongs to the Special Issue Groundwater Thermal Monitoring and Modeling)

Abstract

This study investigates geothermal waters in the Xinjiang region through hydrogeochemical methods, including cluster analysis, ionic ratios, and isotopic analysis. Cluster analysis categorized the geothermal water samples into three distinct groups (G1, G2, and G3). The predominant hydrochemical facies are SO4-HCO3-Na, SO4-Cl-Na, and Cl-Na types, whose formation is controlled by multiple factors. Evidence from molar ratios of major ions suggests that geothermal waters in Group G1 are predominantly governed by water–rock interactions, whereas Groups G2 and G3 are mainly influenced by evaporative concentration. Hydrogen and oxygen isotopic signatures confirm that meteoric water serves as the primary recharge source for these geothermal waters. The spatial correlation between regional tectonic features and most geothermal discharge points demonstrates a consistent relationship between geothermal water occurrence and structural distribution in Xinjiang. Additionally, a conceptual circulation model is proposed wherein meteoric water undergoes deep circulation following local recharge, ascends along fault zones under tectonic pressure, and mixes with shallow groundwater. This research primarily elucidates the hydrogeochemical characteristics and recharge mechanisms of geothermal resources in Xinjiang, thereby providing a scientific basis for their future development and utilization.

1. Introduction

Geothermal resources represent renewable heat energy stored in the Earth’s subsurface (such as in molten magma and radioactive decay processes), with predominant occurrence at tectonic plate margins. This clean, stable, and resource-rich eco-friendly energy source offers considerable benefits for mitigating climate change, optimizing energy mixes, and minimizing environmental contamination [1,2,3,4]. It is globally employed for electricity production, heating services, and high-value applications spanning medical therapeutics and tourism industries. Therefore, the substantial exploitation and utilization potential of geothermal resources is attracting growing global interest. According to their origin, geothermal heat sources may be classified into two primary categories: crust-derived heat sources and mantle-derived heat sources. These crustal heat sources can be further classified as partial melts, tectonothermal events, and radiogenic heat generation from radioactive elements. Notably, the Nesjavellir geothermal field in southwest Iceland derives its thermal energy from magmatic contributions [5]. Similarly, the Coso and Beowawe geothermal fields in the western U.S. are thermally affected by magmatic processes and mantle-sourced fluids [6]. In contrast, geothermal manifestations in Kansas (midwestern United States) correlate with radiogenic heat from uranium within shale-carbonate strata [7].
Being a nation with substantial geothermal reserves, China has progressively intensified its related scientific investigations. Notably, Guo conducted a systematic review of the hydrogeochemical features characterizing China’s high-temperature geothermal reservoirs. This facilitates comprehension of the processes controlling distinctive constituents (ionic species, isotopes, and trace elements) in geothermal fluids [8]. Li et al. employed hydrochemical and isotopic data to conduct a comparative investigation of hydrogeochemical characteristics across diverse high-temperature geothermal systems [9]. Additionally, Liu et al. applied integrated methodologies (saturation indices, isotopic analyses, and PHREEQC modeling) to examine the origin and governing reaction pathways of principal elements. This provided evidence for the principal recharge sources of geothermal fluids [10].
The distinctive geological framework of Xinjiang hosts substantial geothermal resources. Serving as the heat-transporting medium, groundwater commonly expresses itself through geothermal springs and hydrothermal alteration features [8]. More than 90% of the thermal springs within the region occur in the Tianshan, Kunlun, and Altai mountain ranges, primarily representing low-medium enthalpy geothermal mineral water resources. Enhanced geological investigations and advanced research efforts in recent years led to the identification of the Quman medium-high enthalpy geothermal field in Taxkorgan County, Xinjiang, during geothermal reconnaissance at the Pamir Plateau’s northeastern edge [11]. This redefined the distribution framework of the Himalayan high-enthalpy geothermal belt, emerging as a new focal point of interest for geothermal researchers. Elucidating the hydrogeochemical characteristics of representative geothermal fluids in Xinjiang holds considerable importance for advancing their local exploitation. Following the initiation of integrated scientific expeditions in Xinjiang, earlier studies concentrated on the comprehensive exploitation, inventory assessment, classification, and hydrochemical analysis of geothermal resources. Zhao and colleagues performed hydrogeochemical and isotopic investigations on geothermal fluids from Yanqi Hui Autonomous Prefecture, Xinjiang [12]. Their work analyzed the principal controls on geothermal well distribution and the underlying thermal mechanisms, while also assessing the geothermal resource capacity.
Researchers globally have conducted comprehensive studies on the sources, water–rock interactions, and hydrogeochemical features of geothermal fluids across diverse regions [13,14,15,16,17]. Integrating isotopic techniques with the Global Meteoric Water Line (GMWL) has resolved fundamental questions regarding the origin of geothermal fluids. As an example, Liu et al. utilized δ2H–δ18O isotopic signatures to identify meteoric water as the recharge source for karst-hosted geothermal reservoirs [10]. Likewise, Zhang et al. employed this approach to elucidate the formation mechanism of high-enthalpy sedimentary geothermal systems in western Sichuan, China, identifying snowmelt and juvenile magmatic water as recharge sources [18]. Consequently, combining hydrochemical analysis with δ2H–δ18O isotopic systematics provides a robust approach for investigating geothermal fluids. Additionally, researchers have characterized stable and radiogenic elements in geothermal fluids to assess heat contributions from enhanced geothermal systems (dry hot rocks) and magmatic fluid influxes [19]. Water–rock interactions constitute the dominant process controlling the chemical evolution of groundwater systems. Multivariate statistical methods, ionic activity ratios, and mineral saturation indices provide critical tools for studying water–rock interaction processes [20].
Nevertheless, Xinjiang—with its intricate geological framework and varied geothermal system types—still lacks comprehensive studies on the hydrogeochemical features, formation mechanisms, and cyclic evolution processes of its geothermal fluids. This limitation impedes accurate assessment and sustainable exploitation of the region’s geothermal resources. To address this, our research systematically compiled hydrochemical datasets from numerous geothermal fluid samples in Xinjiang, incorporating multi-parameter analyses such as stable hydrogen-oxygen isotopes (δ2H, δ18O). Through cluster analysis, we elucidated the spatial distribution patterns and classification features of the hydrochemical composition across regional geothermal systems. This enabled systematic clarification of key formation mechanisms governing diverse geothermal systems, encompassing water–rock interactions, recharge origins, reservoir temperatures, and fluid circulation pathways. The study advances scientific knowledge on hydrogeochemical processes within Xinjiang’s heterogeneous geothermal systems. Moreover, it delivers vital theoretical frameworks and empirical data to support evaluation of regional geothermal exploration potential and environmental impact management.

2. Geothermal Geological Setting

Figure 1 displays the location map of the study area. Xinjiang Uygur Autonomous Region lies in the heartland of Eurasia (China’s northwestern frontier), positioned at a key structural node of the India-Eurasia collisional orogen. Multiple geological units develop here, such as the Tianshan orogenic belt, Tarim cratonic basin, and Altai orogen, characterized by vigorous tectonic movements and extensive deep-crustal fault networks [11,12,20,21,22,23]. Figure 1 depicts the principal structural systems in the research region. Being a key segment of the Central Asian Orogenic System, its intricate lithospheric structure provides optimal geological prerequisites for geothermal endowment [3,23,24,25]. Northern Junggar Basin contains moderate-to-low enthalpy sedimentary geothermal systems. Southern Tarim Basin margins and Tianshan range are enriched with medium-high enthalpy fault-related geothermal systems in uplifted terrains. Surface expressions encompass boiling springs (>80 °C), moderate-temperature fumaroles, and thermal-mineral water discharges. Pronounced tectono-thermal episodes (including Cenozoic intraplate subduction and crustal thickening) coupled with remnant magmatic heat sources power dynamic geothermal fluid convection. Rendering Xinjiang a prime strategic territory with exceptional geothermal exploration prospects in China.
Documented sources indicate Xinjiang’s geothermal resources are chiefly concentrated in orogenic belts, with the southern Altai slope, western Tianshan, and western Kunlun areas representing principal occurrences [26]. Critically, these regions occupy complex structural intersections where multiple tectonic regimes interact. In the Fuyun-Koktokay sector of the southern Altai, the geology lies at the structural convergence between the Mongolian Orocline and Hexi Corridor tectonic systems. This zone exhibits intense faulting with high neotectonic activity. Western Tianshan displays exceptional structural intricacy, notably within the Urumqi–Usu corridor and Yili-Baluntai zone [27]. The Urumqi–Usu sector sits at the tripartite junction of the Western China, Central Asian, and E-W trending tectonic domains. The Yili–Baluntai area occupies the western Yili–Hami depression belt, where the Altyn Tagh fault system converges with the E-W trending Tianshan orogenic complex. These areas record polyphase deformation and exhibit exceptionally vigorous tectonic activity during the Late Cenozoic. Within the western Kunlun, especially along the apex of the Pamir–Himalayan sinistral transcurrent structural system. Reactivated by subsequent Central Asian tectonic movements, this zone demonstrates extreme neotectonic deformation.
Thus, limited by extensive geographic coverage, extreme environmental conditions, and intricate geological contexts, current systematic investigations into the hydrogeochemical signatures of geothermal systems across this region are still inadequate. A critical gap exists in the quantitative characterization of fluid provenance across heterogeneous reservoir types, water–rock reaction pathways, and deep-seated thermodynamic driving mechanisms. These limitations constrain precise evaluation of exploitable potential and hinder optimal strategic deployment for resource development.

3. Materials and Methods

3.1. Sampling and Laboratory Analysis

Based on field surveys, we systematically collected exposed geothermal water samples. Specifically, a total of 69 samples were collected using a dedicated water sample collector (Bailer Water Sampler, Changsha, China). According to the hydrogeological conditions of the study area and the on-site sampling conditions, most of the water samples were distributed near the fault zone. The specific locations are shown in Figure 1. All samples underwent filtration through 0.45 μm acid-washed cellulose filters, then preserved in pre-washed PVC bottles under refrigeration (4 °C). Each sampling point has 3 parallel samples, 50 mL per bottle [28]. These samples are specifically used for the testing of cations, anions and isotopes. Among them, the temperature, pH and TDS are all tested on-site by a portable water quality analyzer (multi2620,WTW, Xylem Analytics, Munich, Germany). In cationic analysis, the samples were acidified to pH < 2 using high purity concentrated nitric acid and stored in a 50 mL polyethylene bottle. The cation content was measured by an inductively coupled plasma emission spectrometer (ICP-OESiCAP7600, Thermo Scientific, Waltham, MA, USA), and the measurement accuracy was 0.1%. The anions were measured using an ion chromatograph (ICS-2100, Thermo Scientific, Waltham, MA, USA). The bicarbonate content was determined by titrating alkalinity using 0.025 mol/L dilute hydrochloric acid. Before hydroxgen isotope analysis, groundwater samples were filtered using a 0.22 μm filter head. LGRIWA-45EP water isotope analyzer (Los Gatos Research, San Jose, CA, USA) was used to analyze the hydrogen (δ2H) and oxygen (δ18O) isotopes, and the measurement accuracy was δ2H = 0.5‰ and δ18O = 0.1‰. Test results were standardized using international standard average seawater (VSMOW) [26,29].

3.2. Processing and Analysis of Data

In this study, a multivariate statistical method of hierarchical clustering analysis (HCA) was used because it easily categorizes and simplifies complex multivariate data in geothermal water samples [30]. It initially treats each sample as a separate category and then gradually merges it. By calculating the similarity between clusters, it can analyze different levels of data to form a tree-like clustering structure, a bottom-up clustering algorithm. We reasonably used Ward’s method to perform clustering analysis on water samples, which is very correct and effective in hydrogeochemistry research. The experimental data were analyzed using Excel 2019 (Microsoft Corp., Redmond, WA, USA) and SPSS software version 27.00 (IBM, Armonk, NY, USA), while graphs were drawn using Origin 2024 (Origin Lab Corporation, Northampton, MA, USA).

4. Results and Discussion

4.1. Hydrogeochemical Characteristics and HCA of Geothermal Water

To provide a clearer representation of the conventional physicochemical parameters of the geothermal water in Xinjiang, a statistical analysis of the hydrochemical data was performed. Detailed results are presented in Table 1. For specific data, please refer to Supplementary Materials. The geothermal waters in Xinjiang exhibit temperatures ranging from 3.8 to 162.0 °C and pH values between 7.27 and 9.95, indicating a neutral to slightly alkaline nature. The total dissolved solids (TDS) concentration varies from 111.2 to 29,094.2 mg/L, with a spatial coefficient of variation as high as 213%, indicating the presence of geothermal waters ranging from low to high mineralization. With the exception of pH, which shows a relatively stable spatial coefficient of variation, the other measured parameters exhibit significant variability. Overall, these results reflect the complex nature of the hydrochemical composition of the geothermal waters.
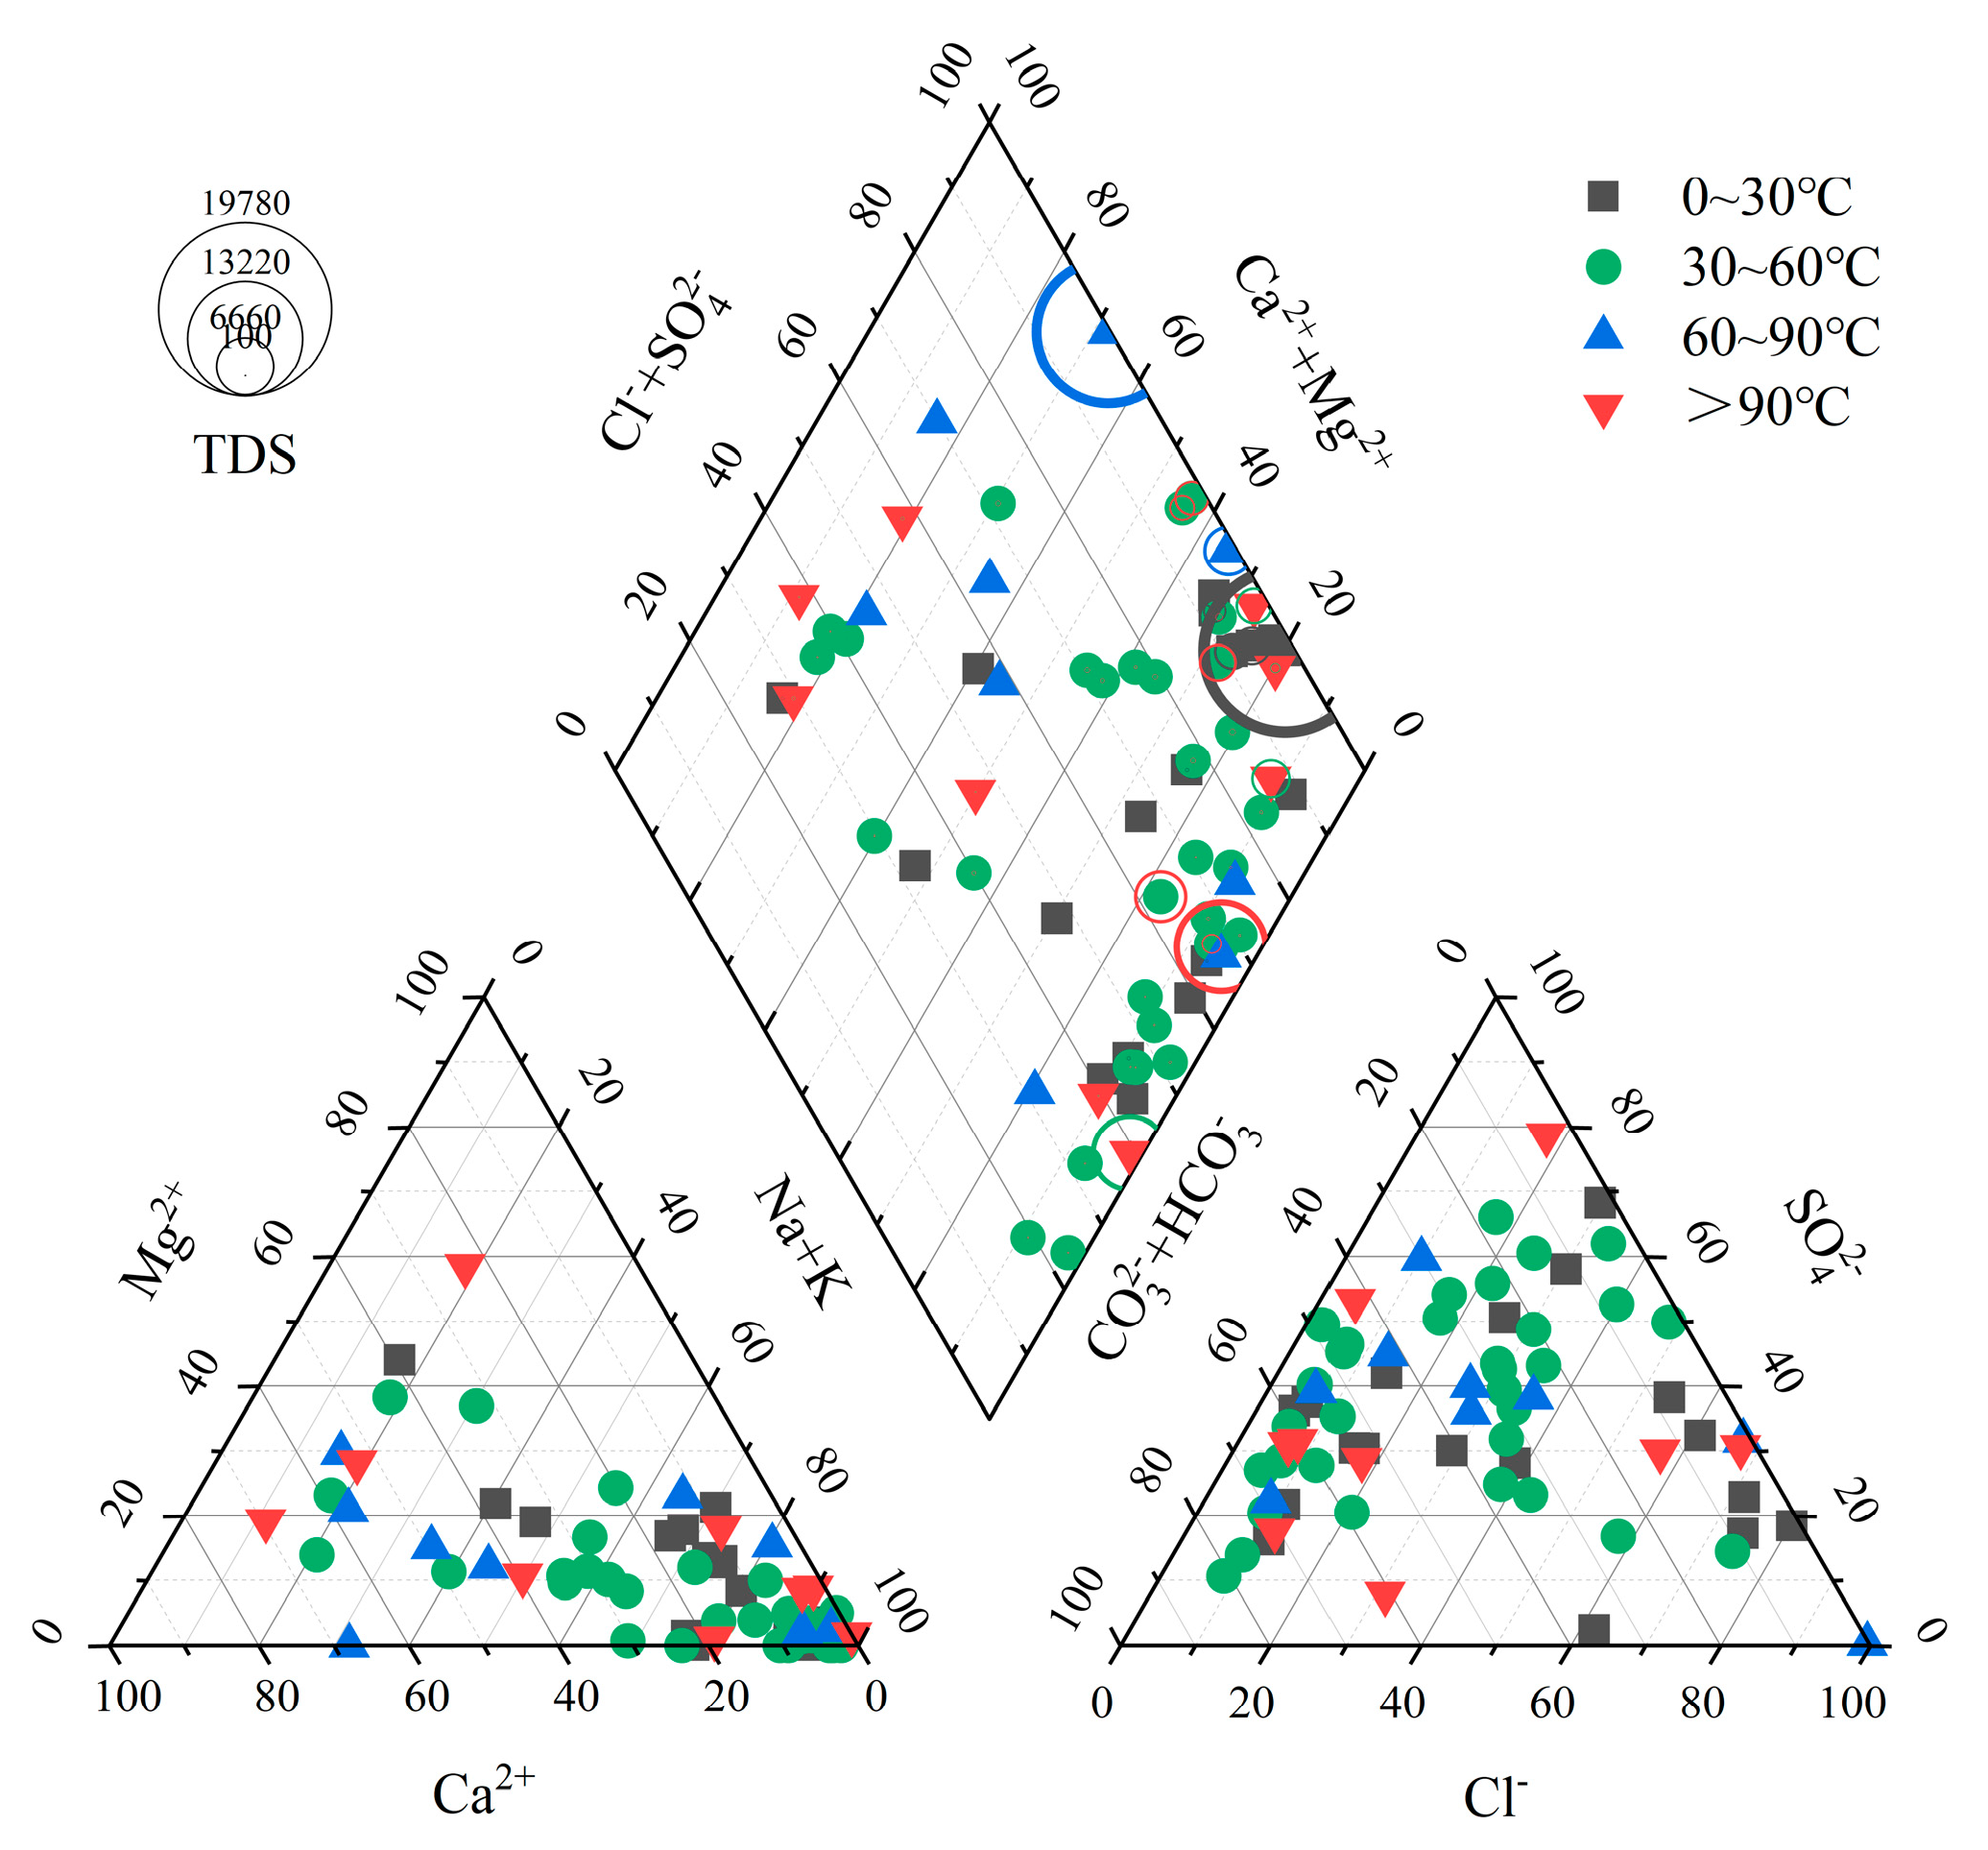
Piper diagrams provide a basis for analyzing groundwater chemical evolution processes [31]. Therefore, we projected the water sample data onto Piper charts (as shown in Figure 2). The primary cations in collected samples are Na+ and Ca2+, while the main anions are SO42− and Cl. The predominant hydrochemical types are SO4-HCO3-Na, SO4-Cl-Na, and Cl-Na. This also demonstrates that dissolved minerals vary among geothermal waters exposed in different regions, resulting in complex hydrochemical compositions and significant variations in hydrochemical types.
Furthermore, geothermal water samples were categorized into four temperature ranges: 0–30 °C, 30–60 °C, 60–90 °C, and >90 °C. Nearly half of the Xinjiang geothermal waters fall within the 30–60 °C range and are characterized by the Cl–Na type, with Na+ as the dominant cation. High-temperature geothermal waters (>90 °C) exhibit more scattered distribution, with hydrochemical types predominantly HCO3–Ca and HCO3–Na. This suggests that most high-temperature geothermal waters are derived from circulation through deep carbonate strata.
Combined with information on the source of the water samples. Partial hydrochemical characteristics of typical regions in Xinjiang were obtained, as shown in Table 2. The main water chemical type in the Yili region is SO4·HCO3·Cl-Na·Ca, with the main anions being SO42− and Cl, and the main cations being Na+ and Ca2+. In the Altay region, the main types are SO4·HCO3-Na and HCO3-Na·Ca, with the main anions being SO42− and HCO3, and the main cations being Na+ and Ca2+. In the Tacheng region, the main water chemical types of geothermal water are SO4·Cl-Na, SO4-Na, HCO3·SO4-Ca, and CO3-Na. The main anions are SO42−, with the main cations being Na+ and Ca2+. In the Bozhou region, the water chemical types of each spring are different, with anions including SO42−, HCO3, and Cl, and the main cations being Ca2+ and Na+. In Urumqi, there is only one water sample, with a water chemical type of HCO3·Cl·CO3-Na. From the regional distribution perspective, the types are diverse and lack uniformity. This is mainly related to the complex geological structure conditions, heat sources, and differences in water sources in Xinjiang.
Additionally, Pearson correlation coefficients were employed to quantify the relationships among the hydrochemical parameters. Figure 3 demonstrates that TDS exhibits positive correlations with all major ions in the geothermal waters. Specifically, it shows strong positive correlations with K++Na+, Cl, Mg2+, and SO42− ions, while demonstrating a relatively weak correlation with HCO3+CO32−. pH values generally exhibit weak negative correlations with the conventional ions. Overall positive correlations are observed among the conventional ions, with the exception of a very weak negative correlation between Ca2+ and HCO3+CO32−. In summary, among cations, Ca2+ concentration correlates poorly with other ions, while among anions, HCO3+CO32− concentration shows weak correlations with other ionic species.
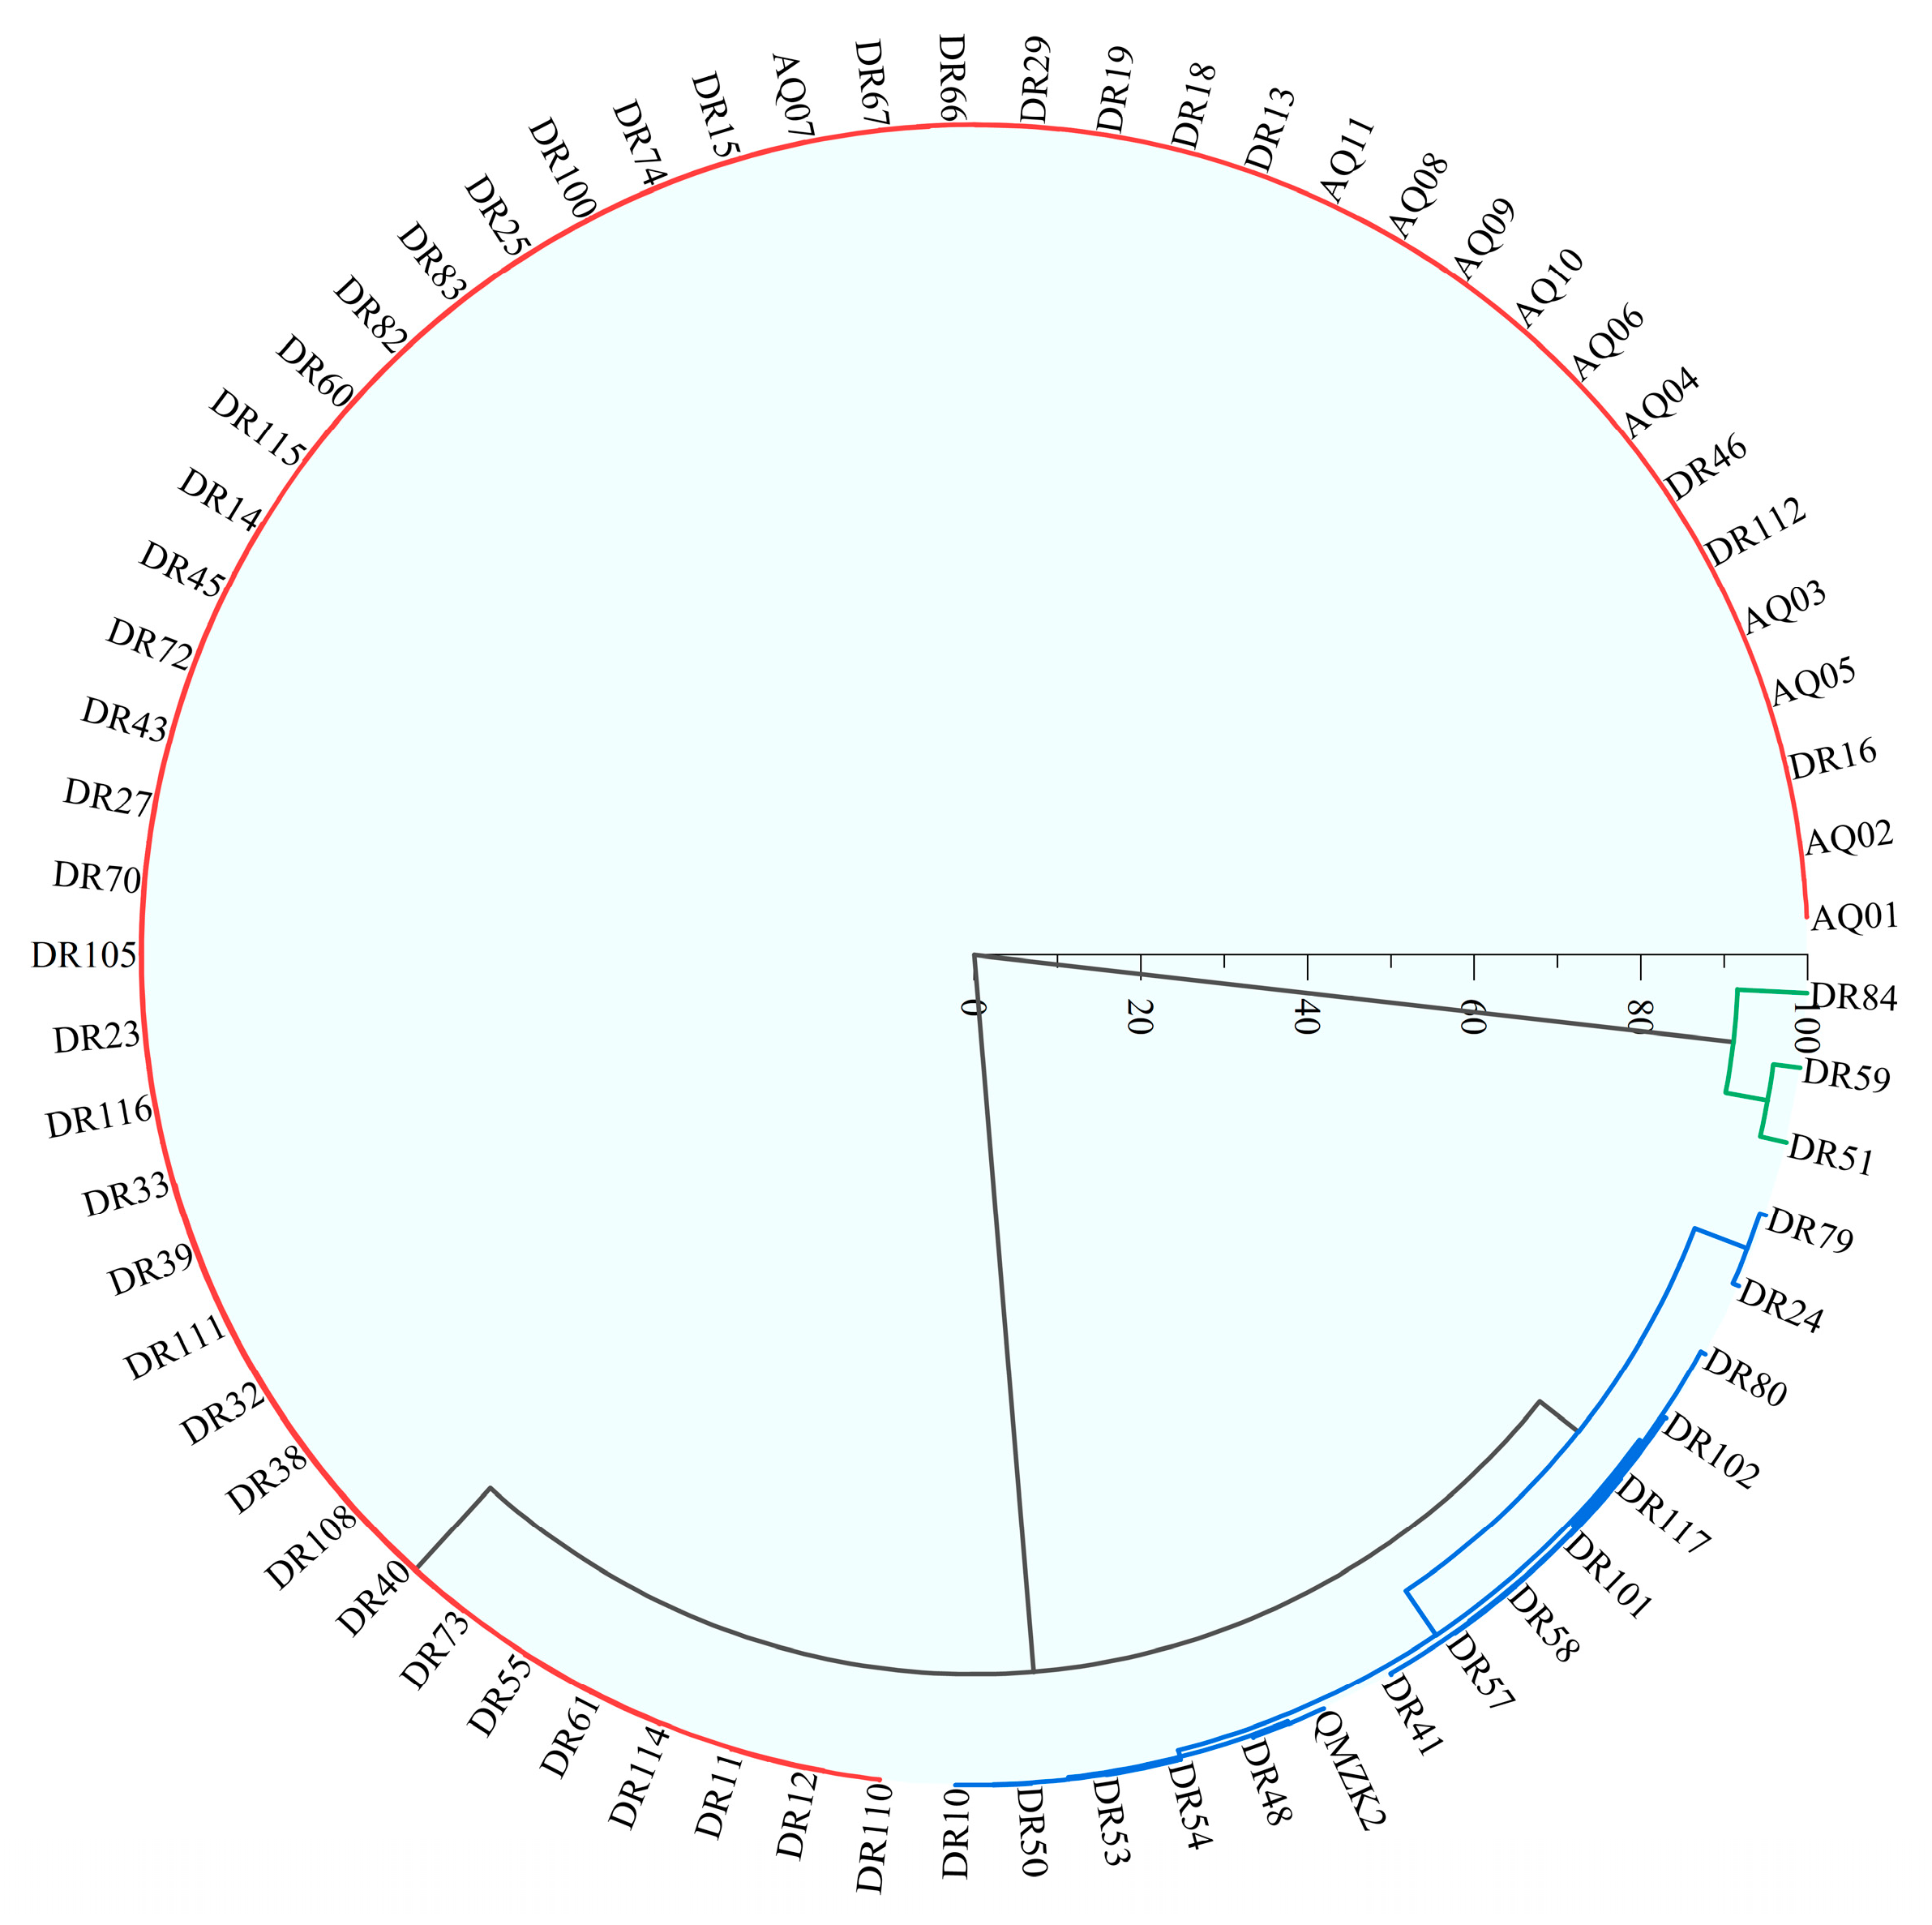
To facilitate the analysis of the extensive dataset, the 69 geothermal water samples were clustered according to their conventional hydrochemical ion concentrations. The results of the hierarchical cluster analysis are presented in Figure 4. We use these six conventional ion components as variables and consider all possible rules to find the best cluster. The Ward’s method was proposed in 1963 and now is proved more successful than other linkage rules, particularly in hydrogeochemistry studies. particularly in hydrogeochemistry studies. The clustering was performed employing “Ward’s method” with squared Euclidean distance, grouping samples exhibiting a similarity greater than 90%. Accordingly, the 69 geothermal samples were classified into three distinct groups: Group 1 (51 samples), Group 2 (15 samples), and Group 3 (3 samples). These three sets of water samples are abbreviated as G1, G2, and G3.
Statistical analysis was conducted on the three groups of water samples after cluster analysis, with the results shown in Table 3. G1 samples accounted for 73.9% of the total samples, G2 samples accounted for 21.7%, and G3 samples accounted for 4.4%. Among them, the coefficient of variation (CV value) is a key parameter for measuring the dispersion of elements, and it can effectively reflect the variation characteristics of chemical components in the temporal and spatial scales. When the CV value is low, it indicates that the chemical components remain relatively stable and are less affected by external environmental disturbances; while a higher CV value means that the chemical components are more sensitive to changes in external conditions. For the water chemical parameters of the geothermal water samples in the three groups, except for pH, the coefficient of variation indicators were generally > 36%. According to the classification of the variability index proposed by Wilding, these water chemical parameters belong to a relatively high variability level (CV > 36%). Among them, the coefficient of variation in K++Na+ and Cl is relatively small, indicating that these ions are relatively stable. The spatial differences in other ions are relatively large, which indirectly proves that the chemical mechanism of these geothermal waters is relatively complex. We will analyze the specific reasons separately in the next section.

4.2. Analysis of the Hydrochemical Genesis of Geothermal Water

Throughout its circulation cycle, groundwater undergoes continuous reactions with the surrounding environment, leading to alterations in its chemical composition, the most significant of which is the variation in ionic concentrations. For instance, as groundwater percolates through soils or rocks, leaching processes may occur, facilitating ion exchange with certain chemical constituents and subsequently altering the original ionic composition of the water [32]. Consequently, the hydrogeochemical processes affecting groundwater can be inferred from its chemical composition, with a common analytical approach being the utilization of ionic ratios.
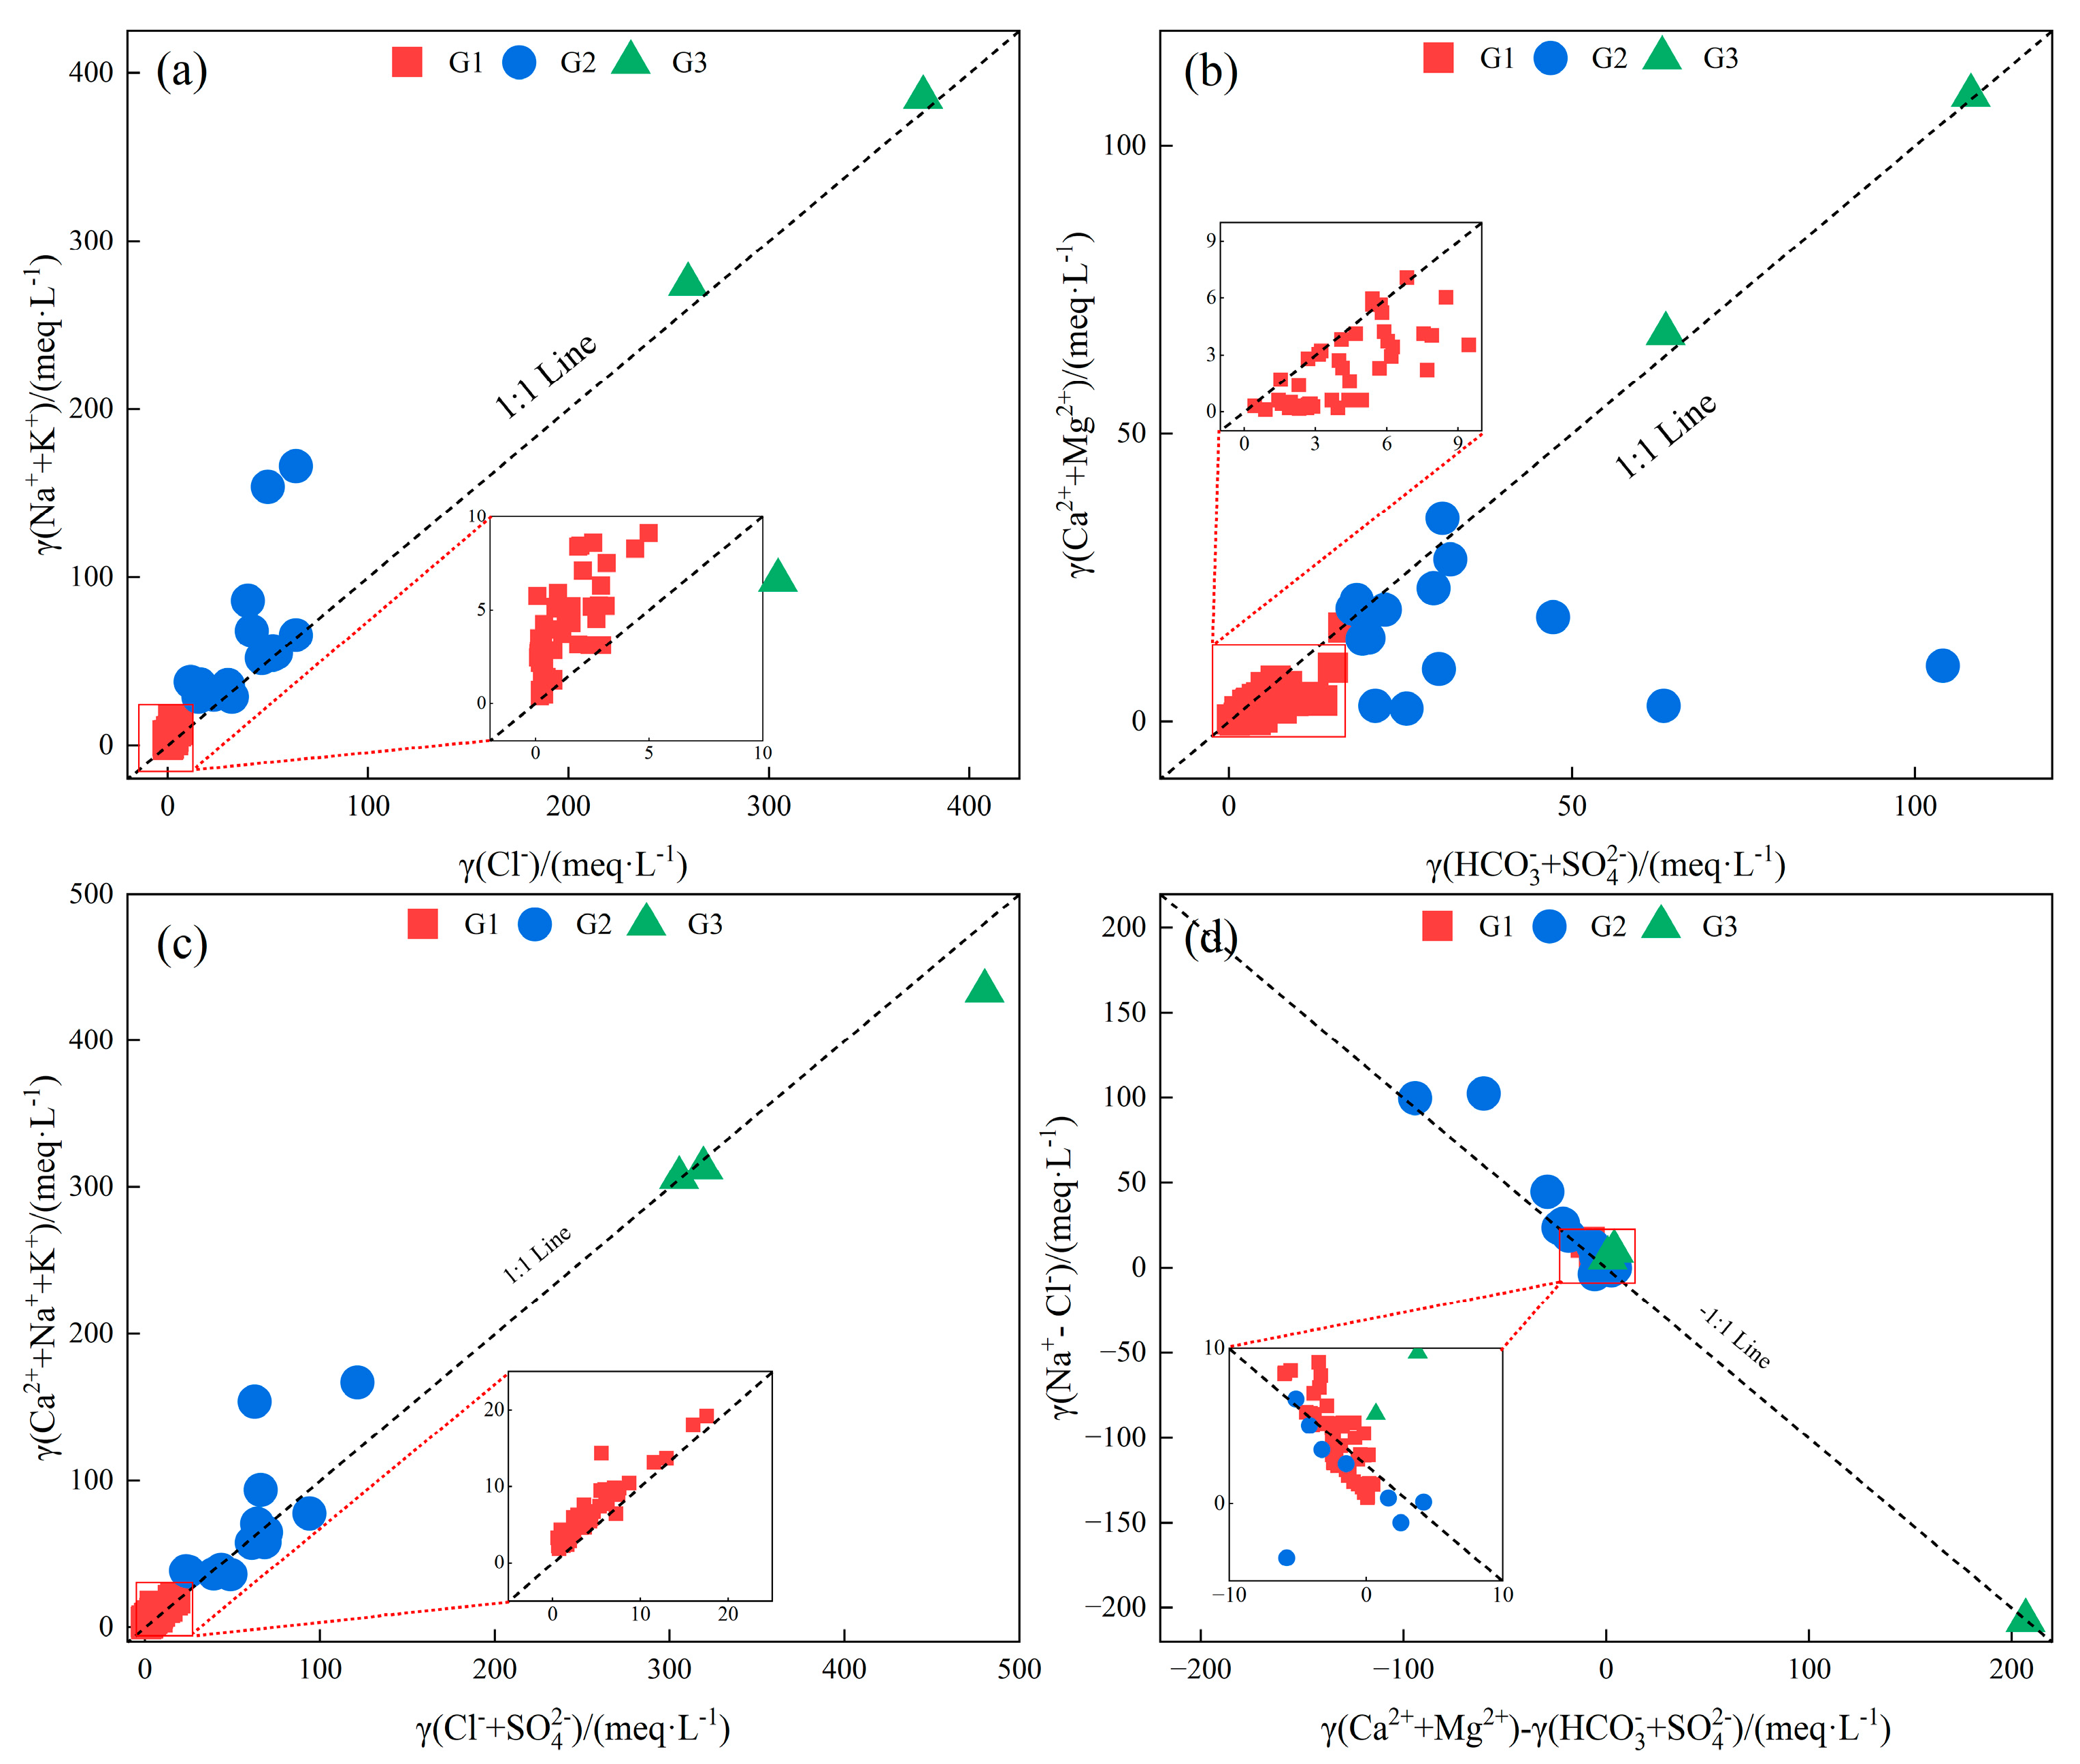
Figure 5 presents the ionic ratio plots for the geothermal water samples. The Na++K+ and Cl in groundwater are primarily derived from halite dissolution; consequently, the equivalent ratio γ(Na++K+)/γ(Cl) typically approximates 1 under natural conditions [33,34]. A γ(Na++K+)/γ(Cl) ratio less than 1 suggests the occurrence of silicate rock dissolution. Conversely, a ratio exceeding 1 signifies the weathering of rock-forming minerals within the aquifer system. Figure 5a displays the γ(Na++K+)/γ(Cl) bivariate plot. The results indicate that most data points from the three geothermal water groups plot above the 1:1 line (y = x), demonstrating that γ(Na++K+)/γ(Cl) > 1. This implies that the genesis of Na+, K+, and Cl in the aquifer is influenced by weathering and dissolution processes affecting halite. This ratio further indicates that cation exchange processes have taken place during groundwater transport. As groundwater percolates through geological formations, hydraulic action promotes weathering dissolution, facilitating an exchange process where Ca2+ and Mg2+ ions in the water replace Na+ and K+ ions on mineral surfaces. This leading to a relative enrichment of Na+ and K+ ions compared to Cl ions.
Furthermore, the milliequivalent ratio between (Ca2++Mg2+) and (HCO3+SO42−) was analyzed (Figure 5b). A γ(Ca2++Mg2+)/γ(HCO3+SO42−) ratio less than 1 indicates that Ca2+ and Mg2+ ions are primarily derived from the dissolution of silicate and evaporite minerals [35,36]. Conversely, a ratio greater than 1 suggests that these ions predominantly originate from carbonate rock dissolution. The results demonstrate that the Ca2+ and Mg2+ in geothermal water samples from groups G1 and G3 are predominantly sourced from carbonate dissolution. In contrast, these ions in the G2 group samples are mainly derived from the dissolution of silicate and evaporite minerals.
Figure 5c displays the γ(Ca2++Na++K+)/γ(Cl+SO42−) ratio for the three sample groups [37,38]. The Na+ and K+ ions in Group G1 geothermal waters are likely derived from silicate dissolution; whereas the data points for Groups G2 and G3 plot close to the 1:1 line, suggesting their composition is influenced by halite and gypsum dissolution. Additionally, the ratio of γ(Na+-Cl) to [γ(Ca2++Mg2+)-γ(HCO3+SO42−)] was employed to identify the occurrence of cation exchange adsorption in the groundwater. Figure 5d demonstrates that the samples from all three geothermal water groups are distributed nearly uniformly along the y = −x line, with calculated slopes of −1.0282 for G1, −1.2188 for G2, and −1.0521 for G3, all approximating −1, providing further evidence that cation exchange adsorption has significantly influenced all three geothermal water groups.

4.3. Geothermal Water H-O Isotope Characteristics and Identification of Recharge Sources

Isotopes exhibit characteristic fingerprint effects and are commonly employed as tracers to reconstruct fluid evolution processes [26,29,39]. Hydrogen and oxygen isotopes in water serve as crucial tracers, playing a vital role in tracking the origins and evolutionary pathways of precipitation, surface water, and groundwater. In geothermal systems, hydrogen and oxygen isotopic compositions may deviate from the meteoric water line due to water–rock interaction and mixing with fluids from other sources, exhibiting distinct characteristics. Consequently, investigating these isotopic signatures aids in identifying the origin of geothermal waters and elucidating their evolutionary history [13,14,40].
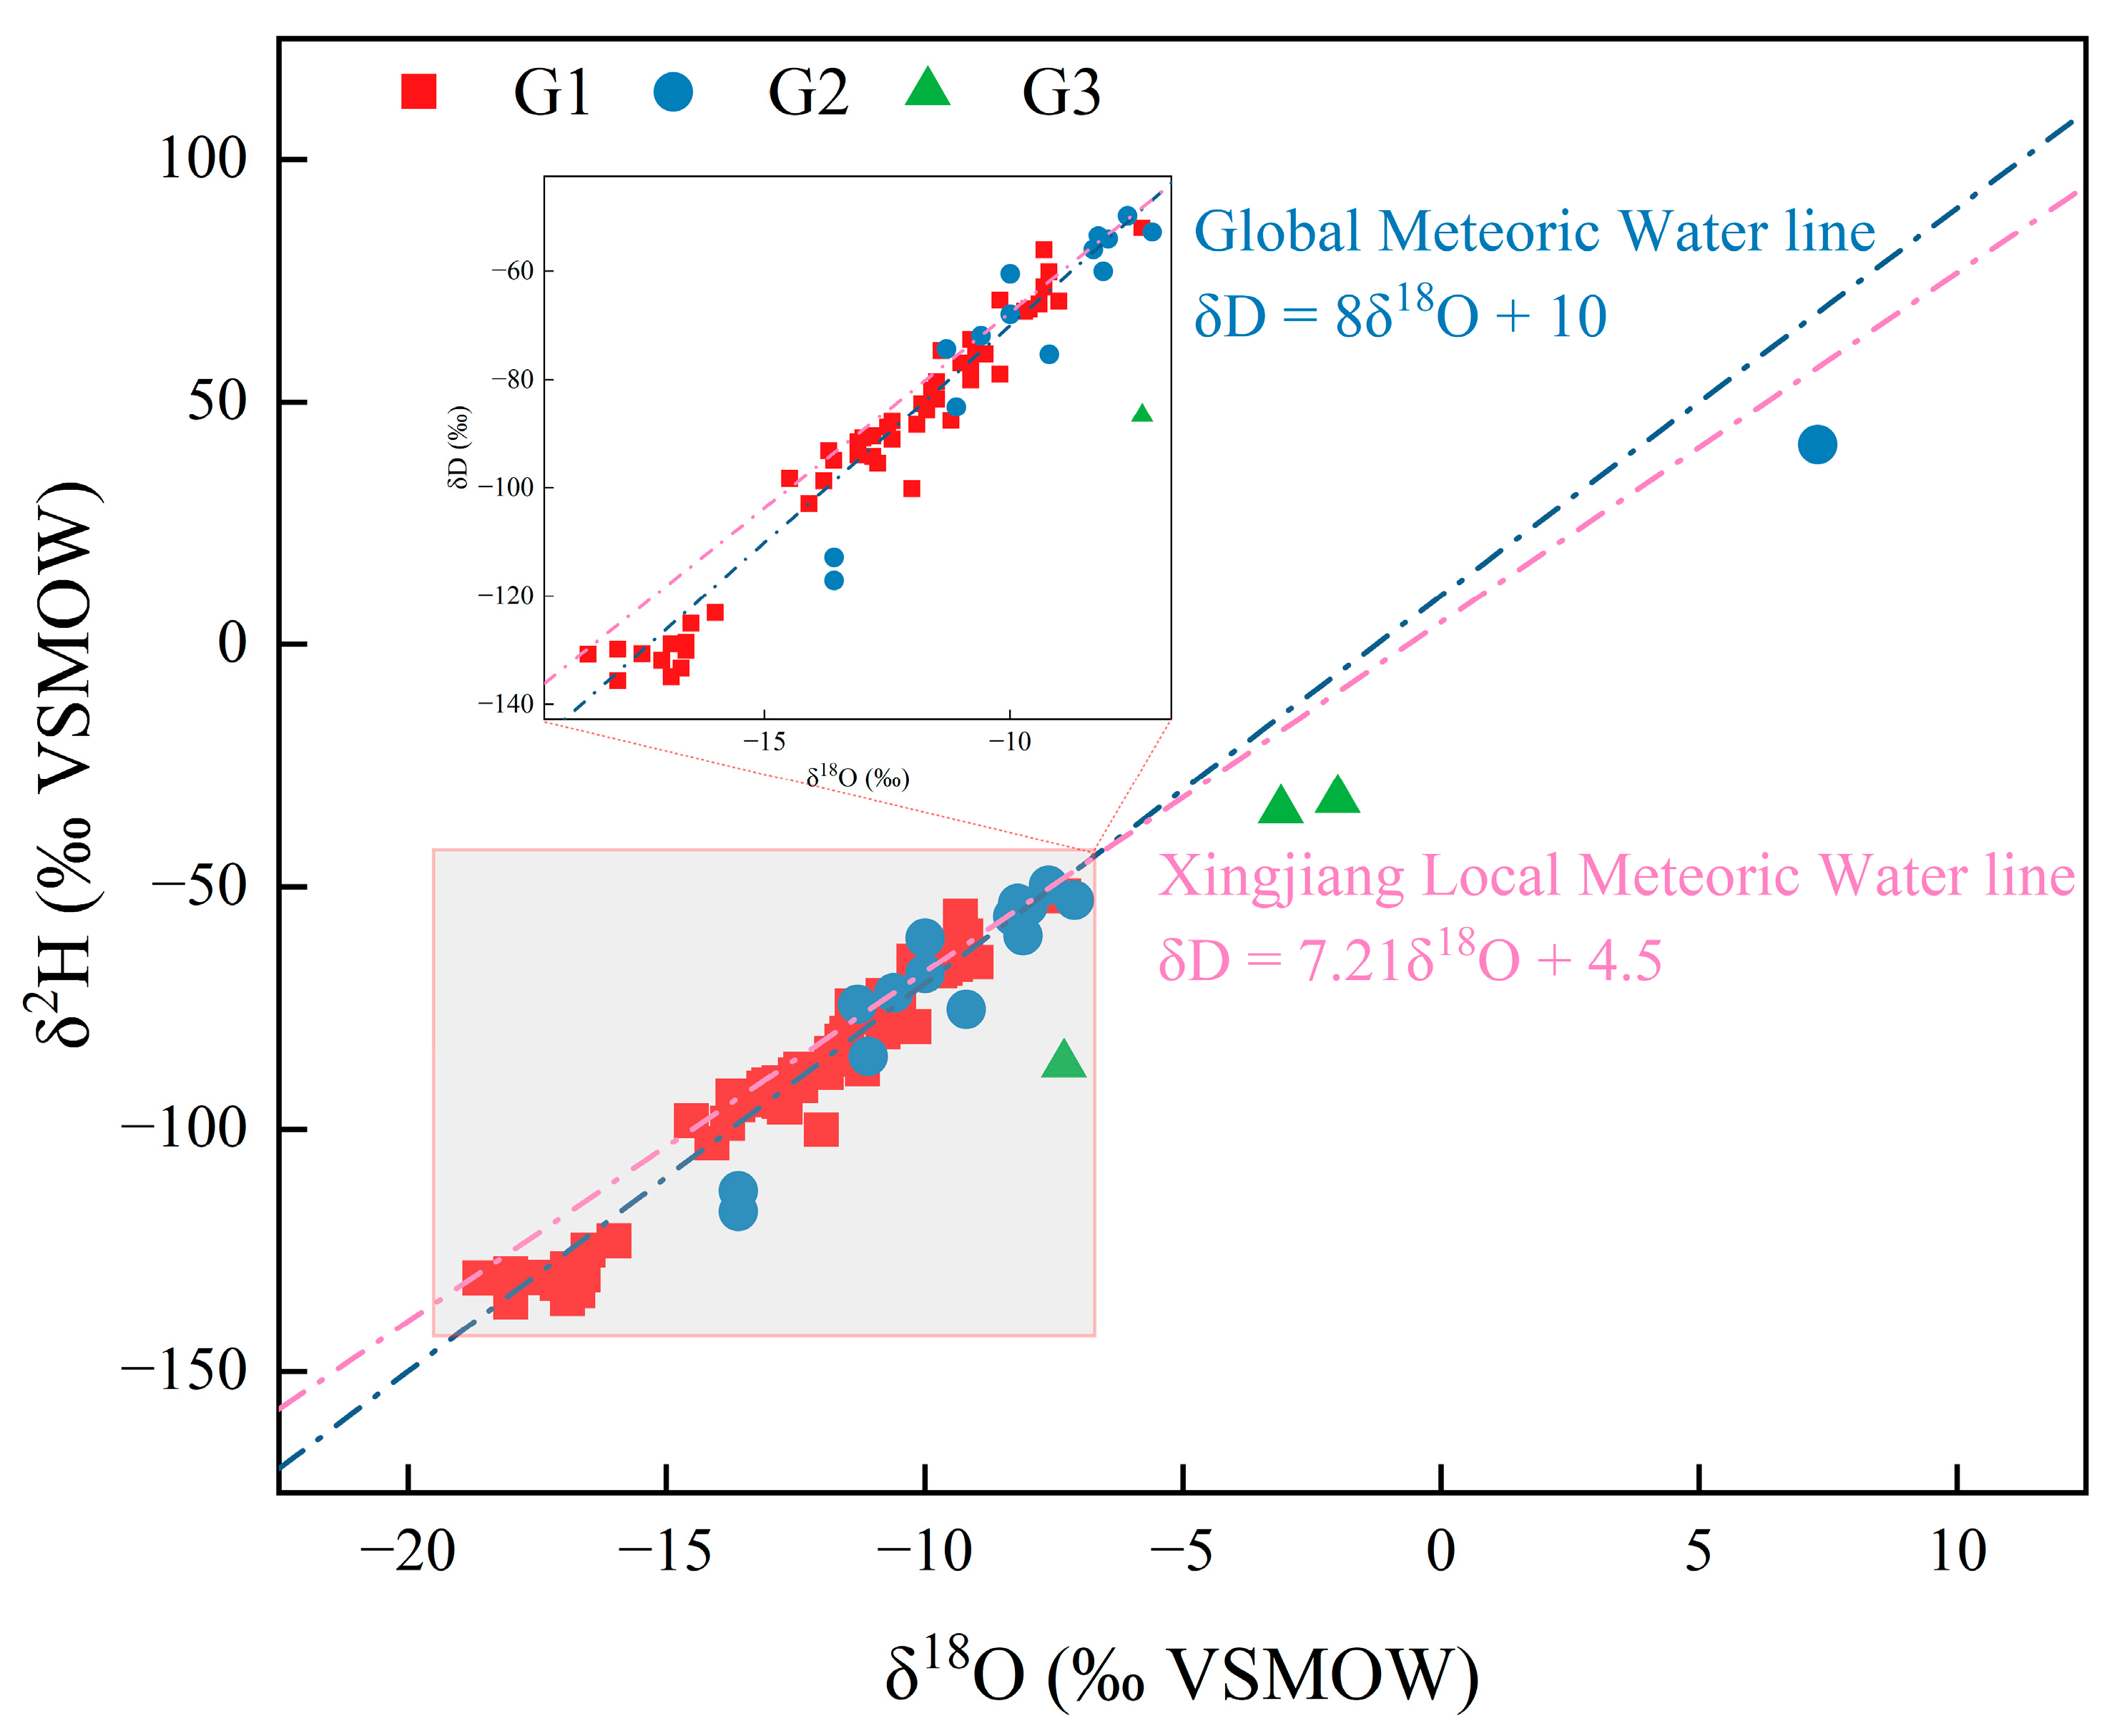
Figure 6 presents the δ2H vs. δ18O plot for the geothermal water samples. The data indicate that most samples fall on or near the Global Meteoric Water Line (GMWL) and the Xinjiang Local Meteoric Water Line (LMWL), with only a few outliers exhibiting noticeable deviations [41]. G1 exhibits δ2H values ranging from −135.7‰ to −52‰ and δ18O values from −18.6‰ to −7.3‰. G2 shows δ2H values between −117‰ and −41.2‰ and δ18O values between −13.6‰ and 7.3‰. For Group G3, the δ2H values vary from −86.6‰ to −32.1‰, while the δ18O values range from −7.3‰ to −2‰ [20]. Owing to the significant topographic relief within the study area, a pronounced altitude effect is observed in the hydrogen and oxygen isotopic compositions. Based on the statistical relationship between oxygen isotope composition and elevation in western China (δ18O (‰) = −0.0024 h − 4.98), the altitudinal gradient for δ18O is calculated to be −0.24‰ per 100 m [23]. Thus, across the vast territory of Xinjiang, isotopic compositions are inevitably strongly influenced by elevation.
Integrated with the hydrochemical clustering analysis, the results indicate that the majority of geothermal waters in Xinjiang (Group G1) are likely recharged by meteoric water and exhibit relatively rapid circulation. This implies a limited extent of isotopic exchange between the geothermal waters and their host rocks, suggesting an open hydrological environment for water–rock interactions. From a structural perspective, most geothermal discharges occur at the intersections of fault zones. Following local precipitation, these waters undergo deep circulation before ascending along fault conduits under tectonic pressure, ultimately mixing with shallower groundwater. Consequently, the observed “oxygen shift” in a minority of samples from Groups G2 and G3 may be attributed to altitudinal effects or to intense water–rock interaction processes within sedimentary basins.

4.4. Heat Source and Geothermal Gradient Characteristics

Heat in the crust and upper mantle is transmitted outward primarily through conduction and convection, with radiation playing a minor role. In shallow crustal zones, vigorous fluid circulation facilitates convective heat transfer, whereas in deeper sections, compaction reduces porosity and permeability, and conduction becomes the dominant process. Terrestrial heat flow, a key parameter for characterizing the regional geothermal regime, can be expressed as
q = K d T d Z
Here, q denotes terrestrial heat flow (mW/m2), K is the thermal conductivity of rocks (W/m·K), dT/dZ is the geothermal gradient (°C/100 m), T is temperature (°C), and Z is depth (m). Heat flow data provide insights into the regional geothermal field, serving as a basis for evaluating tectonic activity, constraining the nature of geothermal systems, and estimating both fluid circulation depth and reservoir temperature.
Based on calculation results and the geothermal water temperature distribution (Figure 1), the study area is generally characterized by a low heat flow regime, with most regions exhibiting values below 55 mW/m2. High heat flow anomalies are primarily concentrated in tectonically active regions. In the Pamir Plateau, intense compression and uplift facilitate rapid transfer of deep-seated heat to shallow levels. This area records the highest heat flow values and hot spring temperatures, suggesting the presence of elevated temperatures in shallow reservoirs. The Altyn Tagh Fault Zone also shows elevated heat flow values. Despite the scarcity of surface hot springs, the data suggest the likely presence of concealed high-temperature geothermal systems at depth. By contrast, the Tianshan region exhibits moderate heat flow, accompanied by relatively low hot spring temperatures. The Altay Mountains, characterized by weak neotectonic activity, display the lowest heat flow values, consistent with the lowest hot spring temperatures across the region.
Heat flow in the basins is generally low, with maximum values not exceeding ~75 mW/m2. The central uplift of the Tarim Basin exhibits the highest heat flow (~75 mW/m2), whereas the Junggar and Turpan–Hami basins are generally below 55 mW/m2, displaying the features of classic “cold basins.” Such a low heat flow regime suppresses large-scale convective circulation within the basins, thereby constraining reservoir temperatures and geothermal potential.
In summary, high heat flow anomalies in Xinjiang are concentrated in the western Kunlun, southern Tianshan, and Altay regions, where intense tectonic activity promotes deep fluid circulation and the development of high-temperature reservoirs. Conversely, most basins are characterized by low heat flow, which limits favorable conditions for geothermal resource accumulation. These findings demonstrate that the formation and evolution of geothermal systems in Xinjiang are jointly governed by regional heat flow distribution and tectonic activity.

4.5. Geothermal Reservoir Characteristics and Conceptual Model

Based on the key components of the geothermal system, an analysis of reservoir characteristics and the development of a conceptual reservoir model were conducted for representative geothermal fields. The primary components of the geothermal system are the heat source, the reservoir rock, and the permeable pathways for heat and fluid. Integrating data from sampling locations (Figure 1) and geological boreholes, the primary heat sources in the study area are identified as: deep-seated acidic intrusions and their country rocks, where both magmatic activity associated with acidic granitoids and radiogenic heat production contribute to the thermal energy of the springs. The lithologies identified as reservoir rocks within the survey area are as follows: (1) a succession of Carboniferous volcanic ash tuffs, crystal-lithic tuffs, and breccia-bearing lithic tuffs; (2) the country rocks surrounding the reservoir comprise Proterozoic schists, gneisses, quartzites, marbles, and intrusive rocks emplaced during the Himalayan orogeny; (3) reservoir units are recognized in the Cambrian, Ordovician, Devonian, and Carboniferous strata. Heat-conducting structures are closely linked to heat sources, acting as direct thermal pathways between them and hot springs. Most high-temperature hot springs or geothermal wells are located near deep, large fault zones.
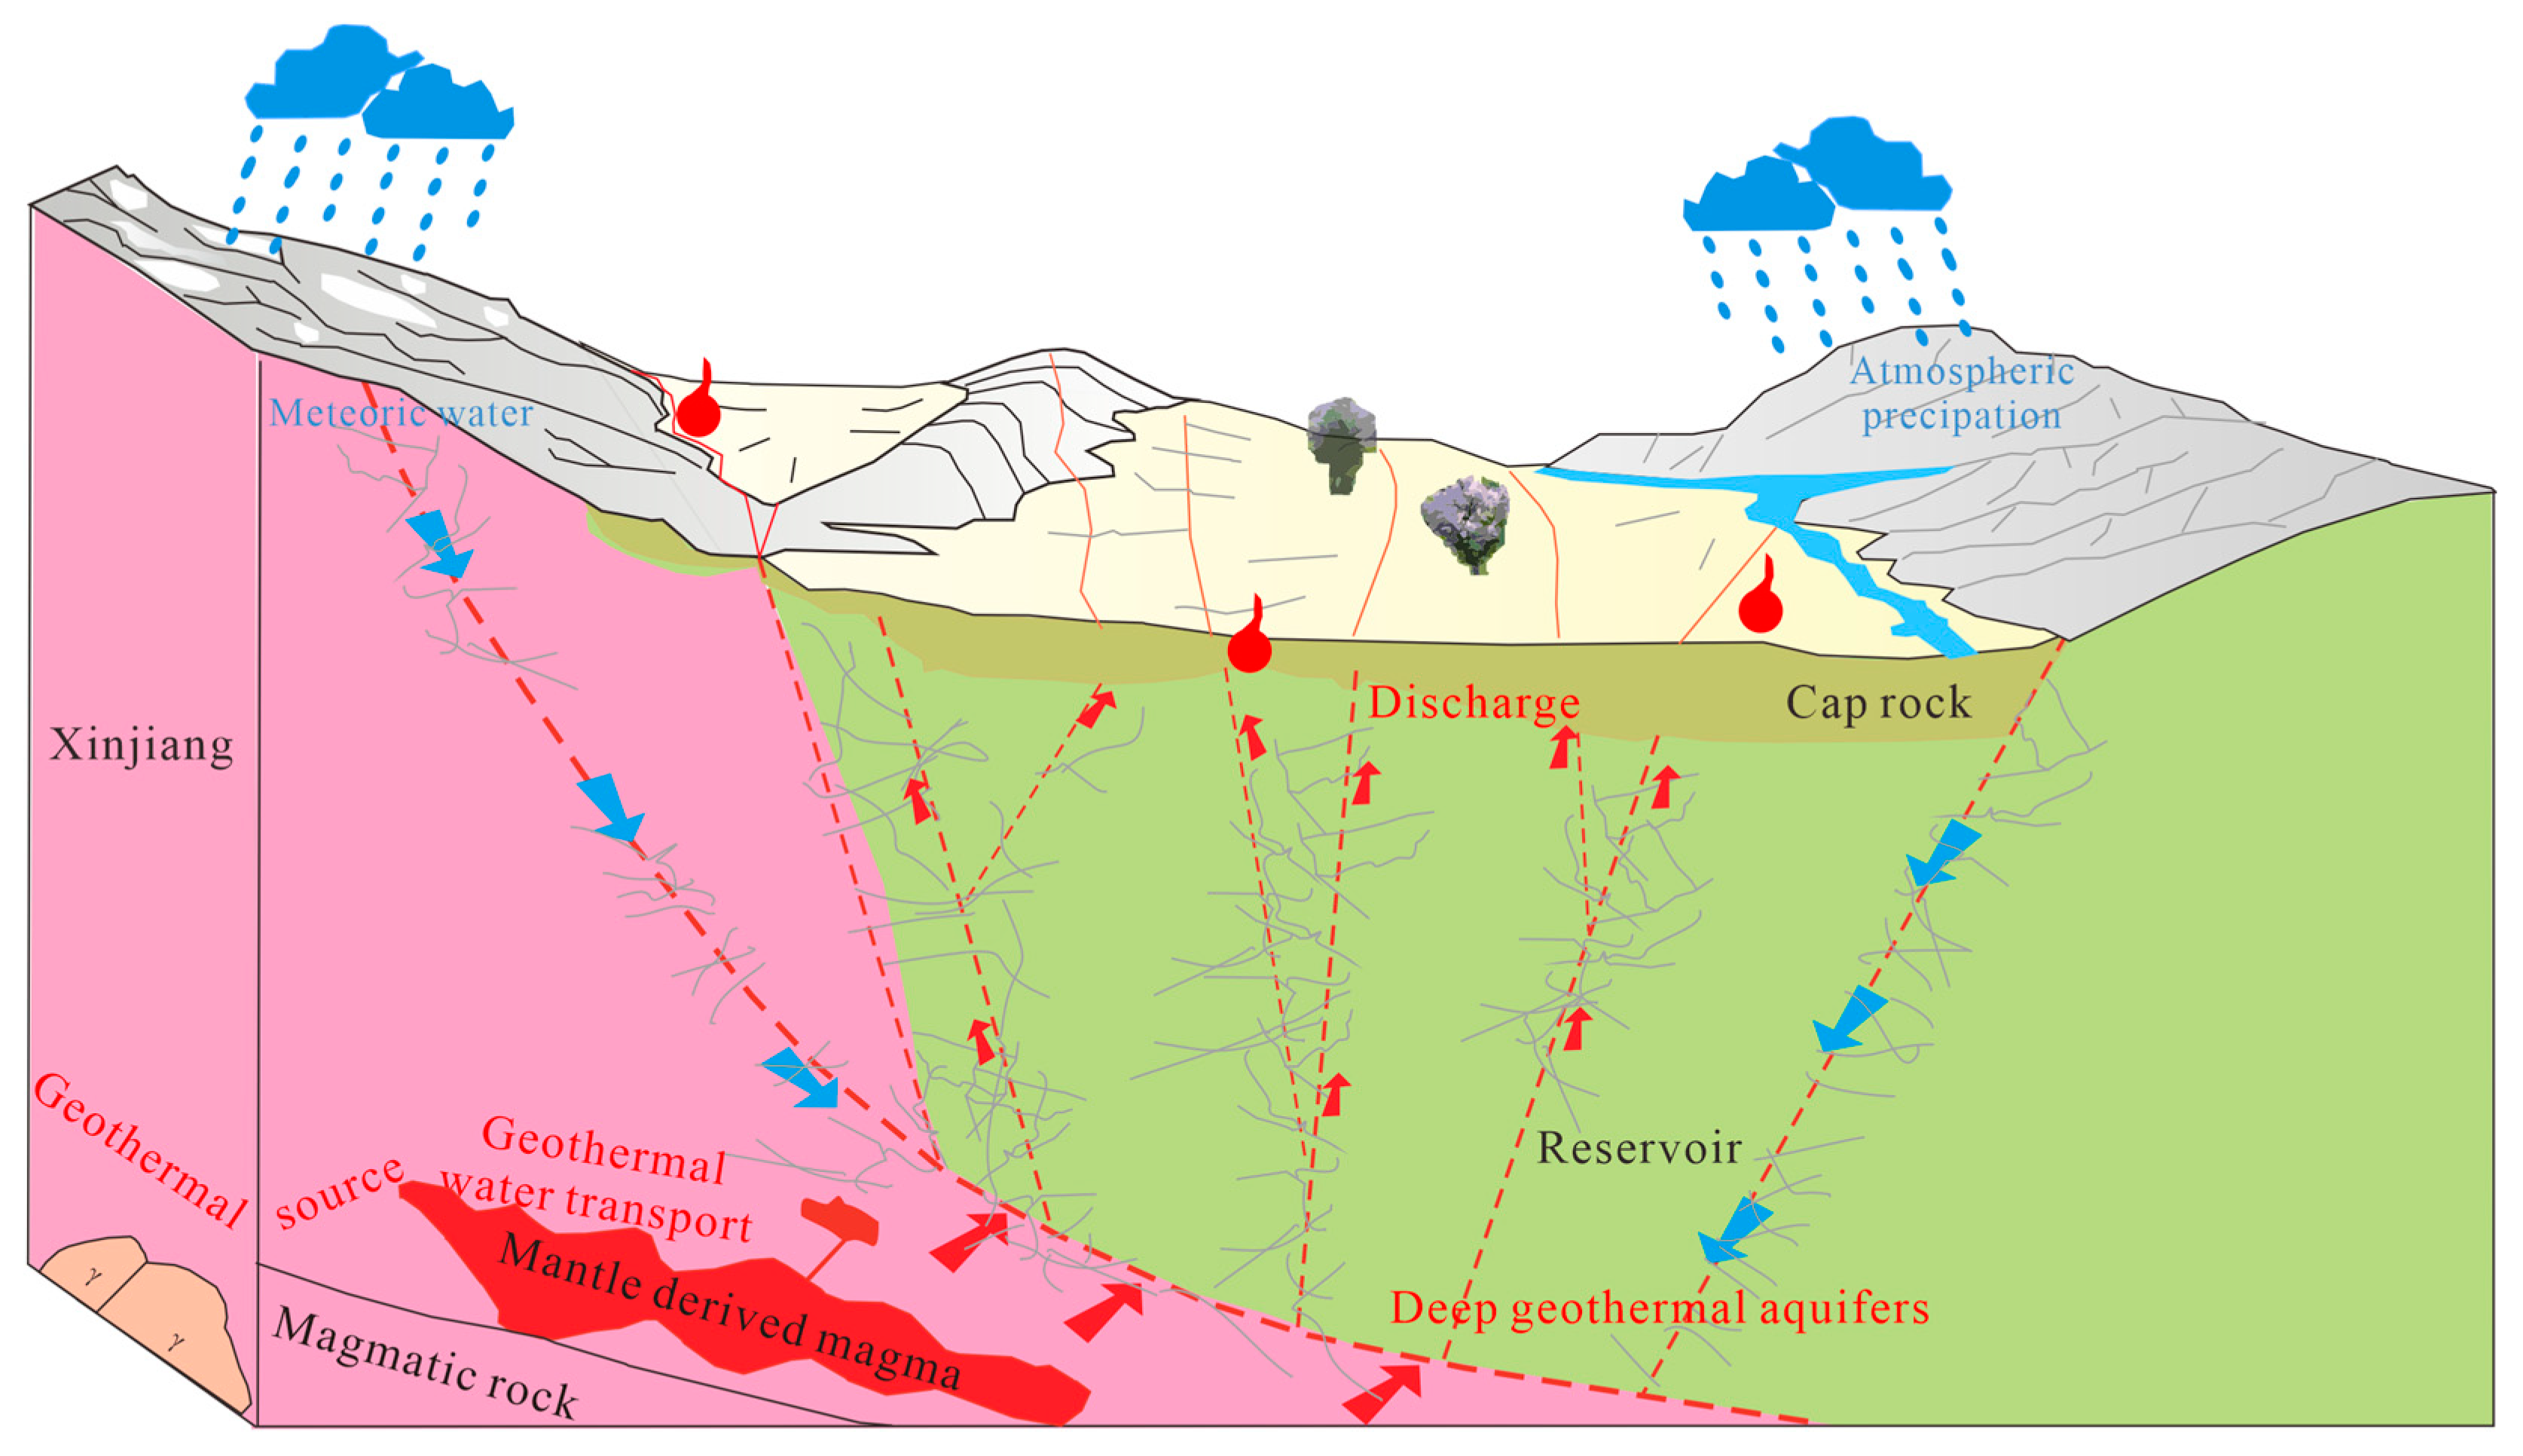
When a heat reservoir within a region primarily utilizes convection for heat transfer, extending in a strip-like pattern, and consisting of fracture zones with effective porosity and permeability, it is called a zonal heat reservoir. Through analysis of the geothermal field’s stratigraphic structure, fault structure development, geothermal field distribution, and geothermal fluid chemistry, the study area’s heat reservoir type is a deep-circulation, convection-type zonal heat reservoir, as shown in Figure 7. A conceptual model of the heat reservoir has been constructed. Specifically, atmospheric precipitation (cold water) infiltrates and subsides, deep circulation heats groundwater (terrestrial heat flow), reducing its density, and the geothermal fluid rises along deep, large structures, concentrating in specific areas above the surface.

5. Conclusions

Based on the chemical characteristics of 69 groups of geothermal waters in Xinjiang, including water chemical characteristics, isotopes, heat storage temperature and circulation depth, a conceptual model of geothermal genesis in Xinjiang was proposed. The following conclusions were drawn.
(1)
The temperature of geothermal springs and geothermal wells in Xinjiang ranges from 3.8 to 162 °C. Deep acidic rock masses and surrounding rocks are the heat sources. Magmatic activity or radioactive elements in acidic granite bodies provide heat sources for hot springs. The hydrochemical types of geothermal waters are mainly SO4·Cl-Na and SO4-Na, showing weak alkalinity. Hierarchical cluster analysis simplifies the complexity of water sample analysis. Ion ratio analysis shows that these geothermal waters are affected by alternating water–rock interaction and cation adsorption.
(2)
Combining isotopic characteristics and exploration data, it is determined that the source of geothermal water recharge is meteoric water. High-temperature geothermal waters are mostly distributed near deep fault tectonic zones. The heat storage type in the study area is determined to be a deep circulation convection-type zonal heat storage.
(3)
The geothermal genesis model in the study area is that atmospheric precipitation recharges groundwater along deep faults. Groundwater, through deep circulation, transports heat energy from the deep crust and upper mantle to shallow heat reservoirs, forming a zonal distribution of geothermal fields. The development and utilization of geothermal resources in this area is promising, and it is expected that higher-quality medium-temperature geothermal resources will be discovered.
Despite certain limitations of this study—such as relying on single-sample measurements that may fail to fully capture seasonal or multi-year variations in geothermal water chemistry, spatial constraints in sampling point distribution, and the influence of regional elevation on hydrogen and oxygen isotope discrimination—it nonetheless offers valuable insights for future research directions. We therefore hope to deepen scientific understanding of the hydrogeochemical behavior within Xinjiang’s complex geothermal systems.
In summary, this study will further guide the direction of geothermal exploration in the study area and is of great significance for deepening the understanding of regional geothermal water and promoting the development and utilization of geothermal resources.

Supplementary Materials

The following supporting information can be downloaded at: https://www.mdpi.com/article/10.3390/w17202946/s1, Table S1: Field indicators and water chemical composition units of geothermal water samples (mg/L).

Author Contributions

Conceptualization, D.H. and Y.L.; validation, X.Q.; writing—original draft preparation, D.H.; writing—review and editing, X.Q.; investigation, Z.Q.; formal analysis, C.M.; resources, Y.L.; project administration, Y.L.; data curation, C.M.; visualization, X.Q.; supervision, D.H. All authors have read and agreed to the published version of the manuscript.

Funding

This research received no external funding.

Data Availability Statement

The original contributions presented in this study are included in the Supplementary Materials. Further inquiries can be directed to the corresponding author.

Conflicts of Interest

The authors declare no conflicts of interest.

References

  1. Zhang, Y.; Yao, R.; Deng, C.; Huang, X.; Lv, G.; Li, X.; Wang, Y. Genetic mechanism of geothermal water in the sandstone reservoir of western Sichuan, SW China: Evidence from hydrochemistry and δD–δ18O isotopes. Ore Geol. Rev. 2024, 167, 105994. [Google Scholar] [CrossRef]
  2. Liu, J.; Ren, Z.; Yu, Q.; Yan, X.; Qi, K.; Wang, Z.; Lan, H.; Jia, M.; Liu, Y.; Wu, H. Hydrogeochemistry and genetic mechanisms of the geothermal system in the Xi’an depression of the southern Weihe Basin, China. Geothermics 2024, 122, 103090. [Google Scholar] [CrossRef]
  3. Zhang, X.L.; Liu, H.Z.; Chen, K. Geothermal Geology Characteristic and Origin Analysis of Shilin Basin in Yunnan Province. Adv. Mater. Res. 2013, 779–780, 1449–1452. [Google Scholar] [CrossRef]
  4. Şanliyüksel Yücel, D.; Özden, S.; Marmara, H. Hydrogeochemical and isotopic monitoring of the Kestanbol geothermal field (Northwestern Turkey) and its relationship with seismic activity. Turk. J. Earth Sci. 2021, 30, 1112–1133. [Google Scholar] [CrossRef]
  5. Banerjee, A.; Person, M.; Hofstra, A.; Sweetkind, D.; Cohen, D.; Sabin, A.; Unruh, J.; Zyvoloski, G.; Gable, C.W.; Crossey, L.; et al. Deep permeable fault—Controlled helium transport and limited mantle flux in two extensional geothermal systems in the Great Basin, United States. Geol. Soc. Am. 2011, 39, 195–198. [Google Scholar] [CrossRef]
  6. Toro Vivanco, D.I.; Kleine-Marshall, B.I.; Smit, M.J.; Gunnarsdóttir, S.H.; Franzson, H.; Stefánsson, A. Lithogeochemistry of the Nesjavellir geothermal field, SW Iceland—Implications for elemental mass movement in active geothermal systems. Geothermics 2024, 120, 103013. [Google Scholar] [CrossRef]
  7. Abdel Hafeez, T.; Abdelwahhab, M.; Elmahdy, M. Geothermal application of spectral gamma ray logging in the South Kansas Subsurface, USA. Appl. Radiat. Isot. 2019, 154, 108904. [Google Scholar] [CrossRef]
  8. Guo, Q. Hydrogeochemistry of high-temperature geothermal systems in China: A review. Appl. Geochem. 2012, 27, 1887–1898. [Google Scholar] [CrossRef]
  9. Li, Q.; Hao, Y.; Liu, C.; Huang, J.; Yuan, X. Representative High-Temperature Hydrothermal Activities in the Himalaya Geothermal Belt (HGB): A Review and Future Perspectives. Water 2024, 16, 1378. [Google Scholar] [CrossRef]
  10. Liu, P.; Chen, Z.; Wang, G.; Mao, T.; Li, C.; Zhou, Y.; Xie, H.; Xiang, T. Hydrogeochemical signatures origin of a karst geothermal reservoir–the Sinian Dengying Formation in northern Guizhou, China. Geosci. J. 2024, 28, 107–123. [Google Scholar] [CrossRef]
  11. Zhang, J.; Kong, Y. Rheological characteristics of lithospheric mantle in the Pamir Plateau and temperature structure of its northeastern margin: Results of the Third Xinjiang Comprehensive Scientific Expedition on Geothermal Science. Chin. J. Geophys. 2025, 68, 199–212. [Google Scholar] [CrossRef]
  12. Zhao, M.; Chen, K.; Chang, J.; He, G.; Chen, F.; Chen, L.; Liu, Z.; Huang, Y. Formation mechanism and evaluation of geothermal resources in Yanqi Qikexing town, Xinjiang. Sci. Rep. 2025, 15, 7006. [Google Scholar] [CrossRef] [PubMed]
  13. Duan, R.; Li, P.; Wang, L.; He, X.; Zhang, L. Hydrochemical characteristics, hydrochemical processes and recharge sources of the geothermal systems in Lanzhou City, northwestern China. Urban Clim. 2022, 43, 101152. [Google Scholar] [CrossRef]
  14. Han, S.; Nan, D.; Liu, Z.; Gesang, N.; Bianma, C.; Zhao, H.; Zheng, Y.; Xiao, P. Hydrochemical Characteristics and Formation Mechanism of Geothermal Fluids in Zuogong County, Southeastern Tibet. Water 2024, 16, 2852. [Google Scholar] [CrossRef]
  15. Shang, J.; Liu, M.; Cao, Y.; Shi, H.; Wei, X. Trace element geochemistry of high-temperature geothermal waters in the Yunnan-Tibet geothermal province, Southwest China. Appl. Geochem. 2024, 162, 105910. [Google Scholar] [CrossRef]
  16. Wang, Y.; Li, B.; Chen, A. The Geochemical Characteristics and Genesis Mechanisms of the Zaozigou Geothermal Field. Sustainability 2024, 16, 6790. [Google Scholar] [CrossRef]
  17. Yan, X.; Wei, S.; Zhang, W.; Liu, F.; Liao, Y. Reservoirs and Hydrogeochemical Characterizations of the Yanggao Geothermal Field in Shanxi Province, China. Water 2024, 16, 669. [Google Scholar] [CrossRef]
  18. Wang, M.; Zhang, H.; Liang, L.; Zhu, Z.; Zhang, A. Constraining the properties of the heat sources of high-temperature hydrogeothermal systems: Evidence from the lithium concentrations of geothermal waters. J. Hydrol. 2024, 640, 131696. [Google Scholar] [CrossRef]
  19. Chen, W.; Liu, P.; Luo, Y.; Li, B.; Peng, J.; Jin, X. Behavior of Sb and As in the hydrogeochemistry of adjacent karst underground river systems and the responses of such systems to mining activities. Sci. Total Environ. 2023, 857, 159411. [Google Scholar] [CrossRef]
  20. Ding, Z.; Zhou, X.; Wang, C.; Li, J.; He, M.; Tian, J.; Saimaiernaji, K.; Zhu, C.; Yan, W.; Ma, R.; et al. Hydrogeochemical characterization and precursor anomalies of hot springs in the North Tianshan orogen. Appl. Geochem. 2023, 158, 105813. [Google Scholar] [CrossRef]
  21. Peng, Y.W.; Gu, X.X.; Su, J.; Zhang, Y.; Wang, J.; Wang, X.; Chen, X.; Song, M.; Shu, Z. Geology, geochemistry and genesis of Tabei: A newly identified intermediate-sulphidation epithermalPb–Zn deposit adjacent to low-sulphidation Au deposit in the Tulasu Basin, Chinese Western Tianshan. Geol. J. 2023, 58, 583–604. [Google Scholar] [CrossRef]
  22. Li, Y.; Pang, Z.; Yang, F.; Yuan, L.; Tang, P. Hydrogeochemical characteristics and genesis of the high-temperature geothermal system in the Tashkorgan basin of the Pamir syntax, western China. J. Asian Earth Sci. 2017, 149, 134–144. [Google Scholar] [CrossRef]
  23. Li, X.; Huang, X.; Liao, X.; Zhang, Y. Hydrogeochemical Characteristics and Conceptual Model of the Geothermal Waters in the Xianshuihe Fault Zone, Southwestern China. Int. J. Environ. Res. Public Health 2020, 17, 500. [Google Scholar] [CrossRef]
  24. Yin, Z.; Li, X.; Huang, C.; Chen, W.; Hou, B.; Li, X.; Han, W.; Hou, P.; Han, J.; Ren, C.; et al. Analysis of the Formation Mechanism of Medium and Low-Temperature Geothermal Water in Wuhan Based on Hydrochemical Characteristics. Water 2023, 15, 227. [Google Scholar] [CrossRef]
  25. Zhang, H.; Wang, G.; Zhang, W.; Ma, F.; Zhu, X.; Yue, G.; Yu, M. Characteristics of the Rongcheng Bulge Geothermal Field and the Evolution of Geothermal Fluids, Xiong’an New Area, China. Water 2022, 14, 2468. [Google Scholar] [CrossRef]
  26. Gao, G.; Kang, G.; Bai, C.; Li, G. Distribution of the crustal magnetic anomaly and geological structure in Xinjiang, China. J. Asian Earth Sci. 2013, 77, 12–20. [Google Scholar] [CrossRef]
  27. Laurent Charvet, S.; Charvet, J.; Shu, L.; Ma, R.; Lu, H. Palaeozoic late collisional strike-slip deformations in Tianshan and Altay, Eastern Xinjiang, NW China. Terra Nova 2002, 14, 249–256. [Google Scholar] [CrossRef]
  28. Chen, W.; Liu, P.; Xu, Z.; Luo, Y.; Zhang, Y.; Wang, Y. Heavy metals’ release behavior in antimony tailings dump and its response to different rainfall conditions. J. Geochem. Explor. 2025, 278, 107846. [Google Scholar] [CrossRef]
  29. Li, Y.; Zhao, P.; Dor, J.; Zhang, H. Multi-isotopes (H, O, Sr, and Li) and element geochemistry constrain the formation of Kongchutso helium-rich geothermal field in western Tibet, China. Geothermics 2024, 120, 102986. [Google Scholar] [CrossRef]
  30. Liu, P.; Hoth, N.; Drebenstedt, C.; Sun, Y.; Xu, Z. Hydro-geochemical paths of multi-layer groundwater system in coal mining regions—Using multivariate statistics and geochemical modeling approaches. Sci. Total Environ. 2017, 601–602, 1–14. [Google Scholar] [CrossRef]
  31. Piper, A.M. A graphic procedure in the geochemical interpretation of water-analyses. Eos Trans. Am. Geophys. Union 1944, 25, 914–928. [Google Scholar] [CrossRef]
  32. Fang, L.; Zhou, A.; Li, X.; Zhou, J.; Pan, G.; He, N. Response of antimony and arsenic in karst aquifers and groundwater geochemistry to the influence of mine activities at the world’s largest antimony mine, central China. J. Hydrol. 2021, 603, 127131. [Google Scholar] [CrossRef]
  33. Bahrami, M.; Khaksar, E.; Khaksar, E. Spatial variation assessment of groundwater quality using multivariate statistical analysis(Case Study: Fasa Plain, Iran). J. Groundw. Sci. Eng. 2020, 8, 230–243. [Google Scholar] [CrossRef]
  34. Ali, S.; Shekhar, S.; Bhattacharya, P.; Verma, G.; Chandrasekhar, T.; Chandrashekhar, A. Elevated fluoride in groundwater of Siwani Block, Western Haryana, India: A potential concern for sustainable water supplies for drinking and irrigation. Groundw. Sustain. Dev. 2018, 7, 410–420. [Google Scholar] [CrossRef]
  35. Chen, J.; Qian, H.; Gao, Y.; Wang, H.; Zhang, M. Insights into hydrological and hydrochemical processes in response to water replenishment for lakes in arid regions. J. Hydrol. 2020, 581, 124386. [Google Scholar] [CrossRef]
  36. Palmer, M.J.; Chételat, J.; Richardson, M.; Jamieson, H.E.; Galloway, J.M. Seasonal variation of arsenic and antimony in surface waters of small subarctic lakes impacted by legacy mining pollution near Yellowknife, NT, Canada. Sci. Total Environ. 2019, 684, 326–339. [Google Scholar] [CrossRef] [PubMed]
  37. Guo, W.; Fu, Z.; Zhang, Z.; Wang, H.; Liu, S.; Feng, W.; Zhao, X.; Giesy, J.P. Synthesis of Fe3O4 magnetic nanoparticles coated with cationic surfactants and their applications in Sb(V) removal from water. Sci. Total Environ. 2020, 710, 136302. [Google Scholar] [CrossRef] [PubMed]
  38. Das, N.; Das, A.; Sarma, K.P.; Kumar, M. Provenance, prevalence and health perspective of co-occurrences of arsenic, fluoride and uranium in the aquifers of the Brahmaputra River floodplain. Chemosphere 2018, 194, 755–772. [Google Scholar] [CrossRef]
  39. Zhang, Z.; Hu, Y.; Ren, T.; Han, X.; Wu, X. Hydrochemical Characteristics and Formation Mechanism of Neogene Geothermal Water in the Zhangye–Minle Basin. Water 2025, 17, 2641. [Google Scholar] [CrossRef]
  40. Duan, R.; Chang, L.; Gu, X.; Li, X.; You, X.; Zhang, Q.; Wang, Q. The Hydrogeochemical Processes of Groundwater in the Bieletan Area, the Western Potash Production Region in China. Water 2024, 16, 1833. [Google Scholar] [CrossRef]
  41. Craig, H. Isotopic Variations in Meteoric Waters. Science 1961, 133, 1702–1703. [Google Scholar] [CrossRef] [PubMed]
Figure 1. Location map of the study area.
Water 17 02946 g001
Figure 2. Geothermal water sample Piper diagram.
Water 17 02946 g002
Figure 3. Correlation coefficient diagram of hydrochemical parameters in geothermal water samples.
Water 17 02946 g003
Figure 4. Cluster analysis of geothermal water samples.
Water 17 02946 g004
Figure 5. Ion ratio relationship in geothermal water: (a) γ(Na++K+)/γ(Cl), (b) γ(Ca2++Mg2+)/γ(HCO3+SO42−), (c) γ(Ca2++Na++K+)/γ(Cl+SO42−), (d) γ(Na+-Cl) vs. [γ(Ca2++Mg2+)-γ(HCO3+SO42−)].
Water 17 02946 g005
Figure 6. δ2H–δ18O correlation plot of the geothermal waters.
Water 17 02946 g006
Figure 7. Conceptual model diagram of geothermal genesis in Xinjiang.
Water 17 02946 g007
Table 1. Descriptive statistics of conventional physical and chemical indicators of geothermal water.
Statistical ValuepHK++Na+Ca2+Mg2+ClSO42−HCO3+CO32−TDS
Max9.958919.74168.3729.013,382.44947.14485.629,094.2
Min7.278.61.203.54.815.2111.2
Mean8.53652.9143.753.2825.7436.6308.12279.0
CV/%5.81222357209282180220213
Note: pH: dimensionless; other indicators are in units of mg/L.
Table 2. Statistics on the chemical types of geothermal springs in certain regions of Xinjiang.
RegionDominant Water Chemistry Type (*n = Number of Samples)
IliSO4·HCO3·Cl-Na·Ca*4, SO4·Cl-Na·Ca*2, SO4·Cl-Na*2, SO4·Cl-Na*2, HCO3-Na, SO4-Na·Ca, SO4·HCO3-Na, SO4·HCO3-Ca·Mg
AltaySO4·HCO3-Na*4, HCO3-Na·Ca
TachengSO4·Cl-Na, SO4-Na, HCO3·SO4-Ca, CO3-Na
BozhouSO4-Na*2, SO4·HCO3-Na
ChangjiSO4·HCO3·Cl-Na·Ca, Cl·CO3-Na, Cl-Na, SO4·HCO3-Ca, Cl-Ca·Na, SO4·HCO3-Ca, SO4·HCO3-Na
UrumqiHCO3·Cl·CO3-Na
TurpanHCO3·SO4-Na·Ca
BazhouSO4·Cl-Na·Ca*2, Cl·SO4-Na*2, Cl-Na
AksuHCO3-Ca, HCO3·Cl-Na, SO4·HCO3-Na·Ca·Mg, SO4·Cl-Na, SO4·Cl-Na
KezhouCl-Na*4, SO4·HCO3-Na*2, SO4·HCO3-Na·Ca, Cl·SO4·HCO3-Na, HCO3·Na·Ca, Cl·SO4-Na, Cl·SO4·HCO3-Na, HCO3-Ca·Mg
KashgarSO4·HCO3-Na*3, SO4·HCO3-Na·Ca*2, Cl·SO4·HCO3-Na, Cl·SO4-Na, SO4-Na·Ca, SO4-Na, HCO3-Mg, HCO3-Na
HotanCl·SO4·HCO3-Na, Cl-Na, SO4·HCO3-Ca·Mg
Table 3. Distribution Characteristics of Geothermal Water Chemical Parameters.
Grouping DetailsK++Na+Ca2+Mg2+ClSO42−HCO3 + CO32−TDSpH
Group 1Min8.601.200.003.504.8015.20111.207.67
Max349.10210.4069.30189.70629.20701.701219.609.95
Mean102.14356810.1049.13134.21138.85405.928.48
CV (%)711091489610082675
Group 2Min669.300.009.70407.70417.9067.102266.757.34
Max3859.70438.90279.402268.802761.704485.6010,802.609.34
Mean1481.42145.36103.601403.821029.13904.234695.748.09
CV (%)6680634458144516
Group 3Min2275.10781.600.009217.0038.4051.9017,319.957.27
Max8919.704168.30729.0013,382.404947.10308.2029,094.207.76
Mean5858.001970.60356.4011,137.202614.43203.4322,038.357.52
CV (%)5797102199466283
Note: pH: dimensionless; other indicators are in units of mg/L.
Disclaimer/Publisher’s Note: The statements, opinions and data contained in all publications are solely those of the individual author(s) and contributor(s) and not of MDPI and/or the editor(s). MDPI and/or the editor(s) disclaim responsibility for any injury to people or property resulting from any ideas, methods, instructions or products referred to in the content.