1. Introduction
Groundwater resources play a fundamental role in supplying drinking water to rural populations in many developing countries, especially in Latin America, where access to centralized water treatment systems is often limited [
1]. In Panama, rural communities with fewer than 1500 inhabitants often rely on community-managed aqueduct systems coordinated by the Ministry of Health through Rural Aqueduct Administrative Boards, which typically extract water from unmonitored groundwater wells and natural springs [
2]. Despite its importance, groundwater quality in these regions is poorly characterized, and systematic monitoring is largely absent.
Groundwater contamination with heavy metals, resulting from natural processes and human actions, presents a serious global danger because of its lasting nature and harmful impacts on ecosystems and human well-being [
3,
4]. Among the most encountered heavy metals in human exposure are arsenic (As), iron (Fe), manganese (Mn), zinc (Zn), and copper (Cu). Nonetheless, prolonged exposure to trace elements like chromium (Cr), copper (Cu), nickel (Ni), and lead (Pb)—even in minimal amounts—can result in combined health hazards and environmental harm [
5,
6]. Heavy metals infiltrate aquatic systems through multiple routes, including natural terrestrial origins like volcanic activity, soil and rock erosion, forest fires, atmospheric deposition, and surface runoff, in addition to human-induced contributions such as agricultural runoff, industrial discharges, and urban wastewater. In rural tropical catchments, particularly in Central America, the mobilization of these metals is further influenced by hydrological dynamics linked to rainfall patterns, soil characteristics, and land use changes—yet these processes remain insufficiently studied in the region [
7].
To address this data gap, this exploratory and cross-sectional study aims to assess the presence and potential ecological risk of heavy metals in groundwater from the rural district of Tonosí, Los Santos province, Panama. Tonosí features a variety of geological substrates and growing agricultural development, potentially affecting aquifer characteristics.
In addition, the study compares metal concentrations with international sediment and water quality guidelines, including the Threshold Effect Level (TEL) and Probable Effect Level (PEL), and evaluates enrichment patterns using the Enrichment Factor (EF) method and stable isotope regression analysis to identify potential contamination sources.
This study seeks to establish a baseline assessment of heavy metal contamination in rural aquifers of Tonosí, employing geochemical and isotopic approaches to characterize contamination sources, trace geochemical pathways, and assess potential environmental and human health risks.
2. Materials and Methods
2.1. Study Area
The research took place in the Tonosí district, situated in the Los Santos Province on the Pacific side of Panama. This mainly rural area supports its residents via small-scale farming and animal husbandry. The geology of Tonosí features sedimentary and volcanic formations, with alluvial deposits found in the low-lying regions. According to Dr. Alberto McKay’s climatic classification, which is based on Emmanuel de Martonne’s typology, the Tonosí River basin includes three climate types with unique spatial distributions [
8]: (i) Subequatorial Climate with Dry Season, mainly found in the basin’s western and northern parts; (ii) Tropical Climate with Extended Dry Season, spreading throughout the eastern area; and (iii) Oceanic Climate of Lower Mountain Regions, situated in the western section, especially close to Cerro Cambutal [
8]. The area has distinct wet and dry periods, with average yearly rainfall between 1800 and 2300 mm (see
Supplementary Table S1 for meteorological data).
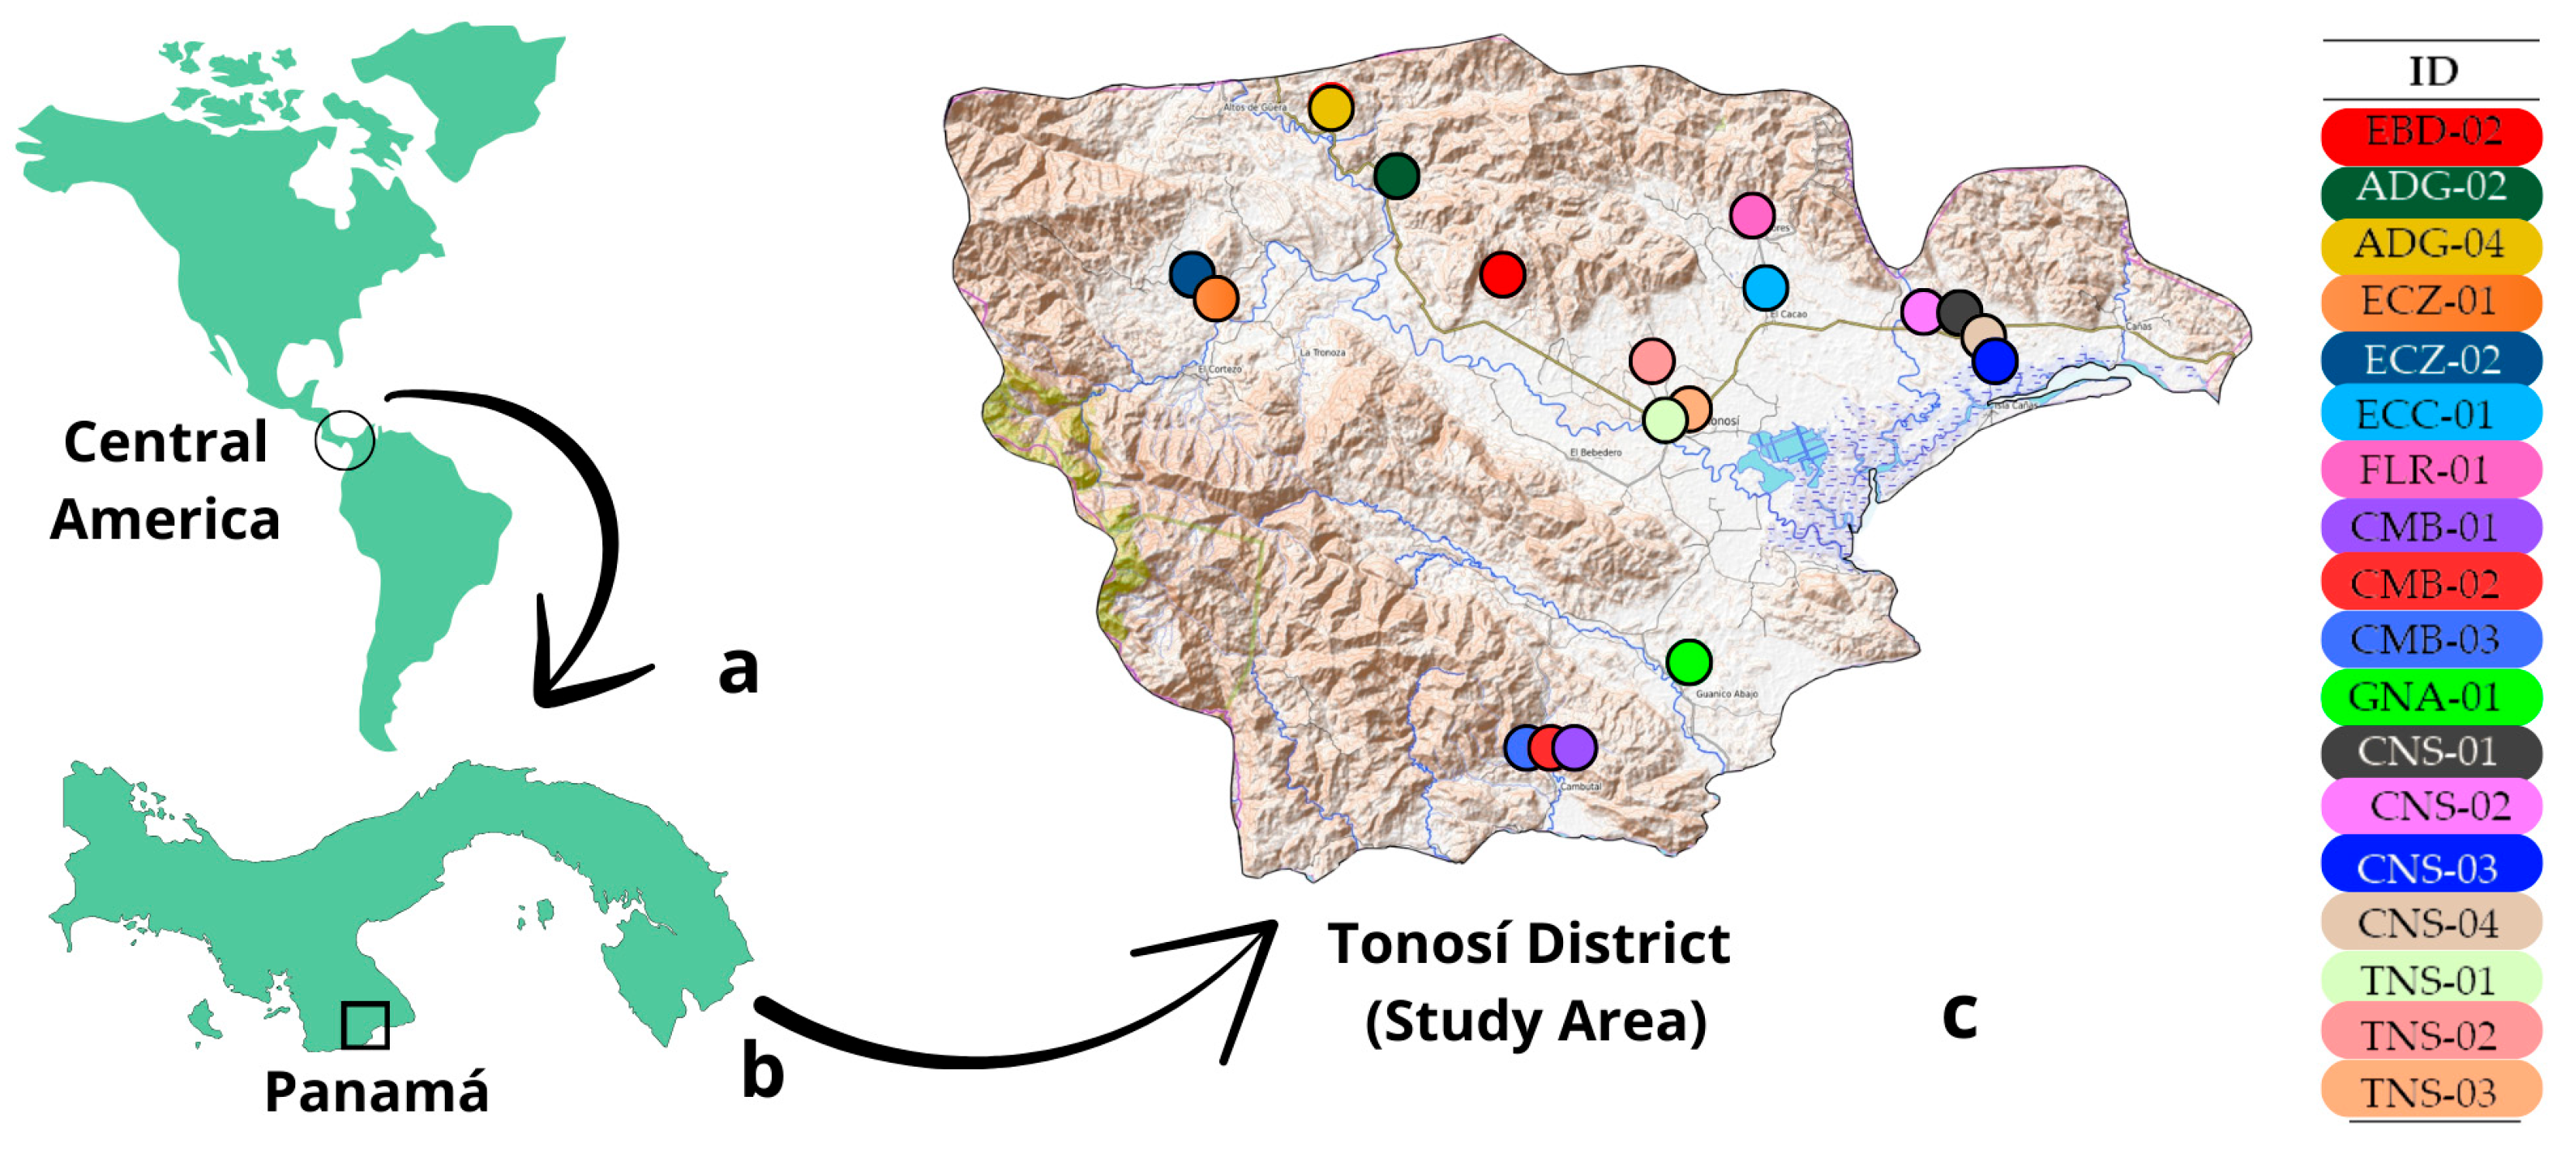
Groundwater in Tonosí is accessed through hand-dug wells and boreholes supplying rural aqueducts. Eighteen sampling locations were chosen
Figure 1 and
Figure 2, comprising springs and shallow wells utilized for households. Geographic coordinates for each sampling location were obtained using a GPS device, and the locations were georeferenced within a GIS for spatial analysis (see
Supplementary Table S2 for coordinates).
2.2. Sample Collection
Water and soil samples were collected during the dry season to minimize dilution effects and ensure comparability across sites. Groundwater samples were obtained from each well or spring after purging for a minimum of 10 min to eliminate stagnant water, using acid-washed polyethylene bottles. Field tests indicated that a 10-min pumping period was sufficient to remove the stored water from each well, considering the pumping rate and well dimensions, as reported by Salceda-Gonzalez et al., 2025 [
9].
Soil samples were gathered at four groundwater recharge locations using a manual auger (soil corer), driven to depths of 10–30 cm to reach recent depositional layers. Samples were placed in sterile polyethylene bags, kept in coolers at 4 °C, and swiftly transported to the laboratory for analysis. All tools were sanitized between locations to prevent cross-contamination.
2.3. Physico-Chemical and Heavy Metal Analysis
Physicochemical parameters of water samples, such as pH, temperature, electrical conductivity, and dissolved oxygen, were analyzed in the field with a multiparameter probe (YSI ProDSS, Yellow Springs, OH, USA) (see
Supplementary Table S3). Trace metals (Cr, Cu, Zn, Ni, Pb, Mn, Fe, Ag, Sb) were analyzed through Total Reflection X-ray Fluorescence (TXRF) utilizing a S2 PICOFOX spectrometer (Bruker AXS, Karlsruhe, Germany). Sample preparation was carried out according to the manufacturer’s protocol [
10], as shown in
Figure 3. Calibration and method validation were performed using certified multi-element standards, in accordance with ISO 20289:2018 [
11].
Elemental concentrations in both water and soil samples were determined using the same TXRF instrumentation. Results are expressed in mg/L for water (see
Supplementary Table S4 for detailed groundwater chemistry) and mg/kg for soil, and complete dataset of soil concentrations is provided in
Supplementary Table S5.
These values were subsequently used to calculate Enrichment Factors (EF) for selected metals (Cr, Cu, Zn, Pb, Ni, Mn), based on background concentrations from Coiba and Montijo. This allowed for an evaluation of potential anthropogenic influence in the Tonosí region.
2.4. Geochemical Background and Enrichment Factor (EF) Calculation
To evaluate potential anthropogenic enrichment, Enrichment Factors (EFs) were calculated for each element using iron (Fe) as a conservative normalizing reference. EF was computed as:
where
Cx is the concentration of the metal of interest and
Cref is the concentration of a conservative element.
Background concentrations were derived from sediment cores obtained in pristine marine environments of the Gulf of Montijo and Coiba Island, as reported by Broce et al. (2022) [
12]. Enrichment Factor (EF) values greater than 1.5 were considered indicative of possible anthropogenic input.
2.5. Threshold Effect and Probable Effect Levels (TEL and PEL)
To evaluate possible ecological hazards in soils and sediments, observed metal levels were contrasted with sediment quality standards derived from the Threshold Effect Level (TEL) and Probable Effect Level (PEL) thresholds established by the Canadian Council of Ministers of the Environment (CCME). These thresholds indicate cautious estimates of contaminant concentrations below which adverse biological effects are expected to occur rarely (TEL) or frequently (PEL). Given their derivation from benthic toxicity tests and sediment bioassays, TEL and PEL values were applied exclusively to soil data in this study.
2.6. Regulatory Benchmarks for Groundwater Quality (EPA and WHO Guidelines)
To evaluate the potential risks associated with groundwater quality, the concentrations of heavy metals measured in this study were compared with the U.S. Environmental Protection Agency (EPA) Maximum Contaminant Levels (MCLs) and secondary drinking water standards
Table 1, as [
6].
The EPA MCLs provide legally enforceable limits for contaminants in public water systems, designed to protect human health, while secondary standards establish non-mandatory thresholds related to aesthetic and technical aspects such as taste, odor, or staining. This dual reference framework allowed us to distinguish between exceedances that may represent a direct health concern and those that primarily affect water acceptability or distribution infrastructure. By integrating these international benchmarks, we ensured that the interpretation of groundwater results was consistent with regulatory standards applied for human consumption and environmental protection.
MCL (Maximum Contaminant Level) values correspond to maximum contaminant limits with regulatory force for public drinking water systems. EPA’s secondary standards are not mandatory and address aesthetic or technical aspects (e.g., taste, color, scale).
2.7. Stable Isotope Analysis
Isotope ratios of δ
18O and δ
2H in groundwater were examined to identify recharge sources and determine potential evaporation processes. Samples were analyzed with a Picarro L2130-i (Picarro Inc., Santa Clara, CA, USA) cavity ring-down spectroscopy system at the Zuckerberg Institute for Water Research, Ben-Gurion University of the Negev, Israel. Results are reported in relation to the Vienna Standard Mean Ocean Water (V-SMOW) standard, exhibiting analytical precision of ±0.1‰ δ
18O and ±0.5‰ for δ
2H. The complete isotopic dataset (δ
18O and δ
2H) for all ground-water samples is provided in
Supplementary Table S6.
Historical rainfall data from the Global Network of Isotopes in Precipitation (GNIP) [
13] at Howard Station, Panama, were utilized to develop the Local Meteoric Water Line (LMWL) for comparative studies. Linear regression and ANCOVA were performed to evaluate isotopic trends and statistical differences among water sources.
2.8. Grain Size Analysis
Grain size distribution of soil samples was determined using a Microtrac MRB SYNC Laser Diffraction Particle Size Analyzer (Microtrac MRB, Haan, Germany). Prior to analysis, samples were treated with hydrogen peroxide (30%) to remove organic matter and dispersed in sodium hexametaphosphate (5%) solution. The instrument provided measurements of median particle size (D
50), mean grain size (Mz), sorting (σ), skewness (Ski), and classification following Folk and Ward (1957) criteria [
14].
These sedimentological factors were utilized to analyze depositional environments and sediment transport dynamics, which may affect metal mobility and adsorption.
3. Results
3.1. Heavy Metal Concentrations in Soil Samples
The levels of heavy metals in soil samples from Tonosí exhibited significant spatial variability, mainly driven by lithological factors, land usage, and closeness to possible human-induced sources.
Table 2 presents the concentrations (mg/kg) of nine metals, which include Cr, Cu, Zn, Pb, Ni, Mn, Fe, Sr, and Ca.
Chromium (Cr), copper (Cu), and zinc (Zn) were reliably found at various locations, with Cr levels between 0.03 to 4.19 mg/kg, Cu levels from 0.01 to 0.16 mg/kg, and Zn levels from 0.03 to 0.20 mg/kg. Despite these levels being typically low, increased concentrations of Cr were noted at site GNA-01, indicating possible localized geogenic enrichment.
3.2. Enrichment Factors
To assess possible anthropogenic enrichment, Enrichment Factors (EF) were calculated for each metal using iron (Fe) as a conservative normalizing element. Background concentrations were obtained from pristine marine sediments of the Gulf of Montijo, following the work of Broce et al. (2022) [
12].
The EF values (
Table 3) showed slight enrichment for the majority of trace metals, with the exception of chromium at site GNA-01 (EF = 503.32), suggesting either a local lithogenic anomaly or historical contamination. All remaining elements, such as Mn, Ni, Cu, Zn, and Pb, showed EF < 2, deemed to be within the range of natural variability.
These findings indicate the dominance of geogenic sources in the area studied, though the localized Cr enrichment may require additional investigation at specific sites.
3.3. Comparison of Groundwater Quality with Regulatory Benchmarks (EPA and WHO Guidelines)
The specific regulatory thresholds applied in this study are summarized in
Table 1.
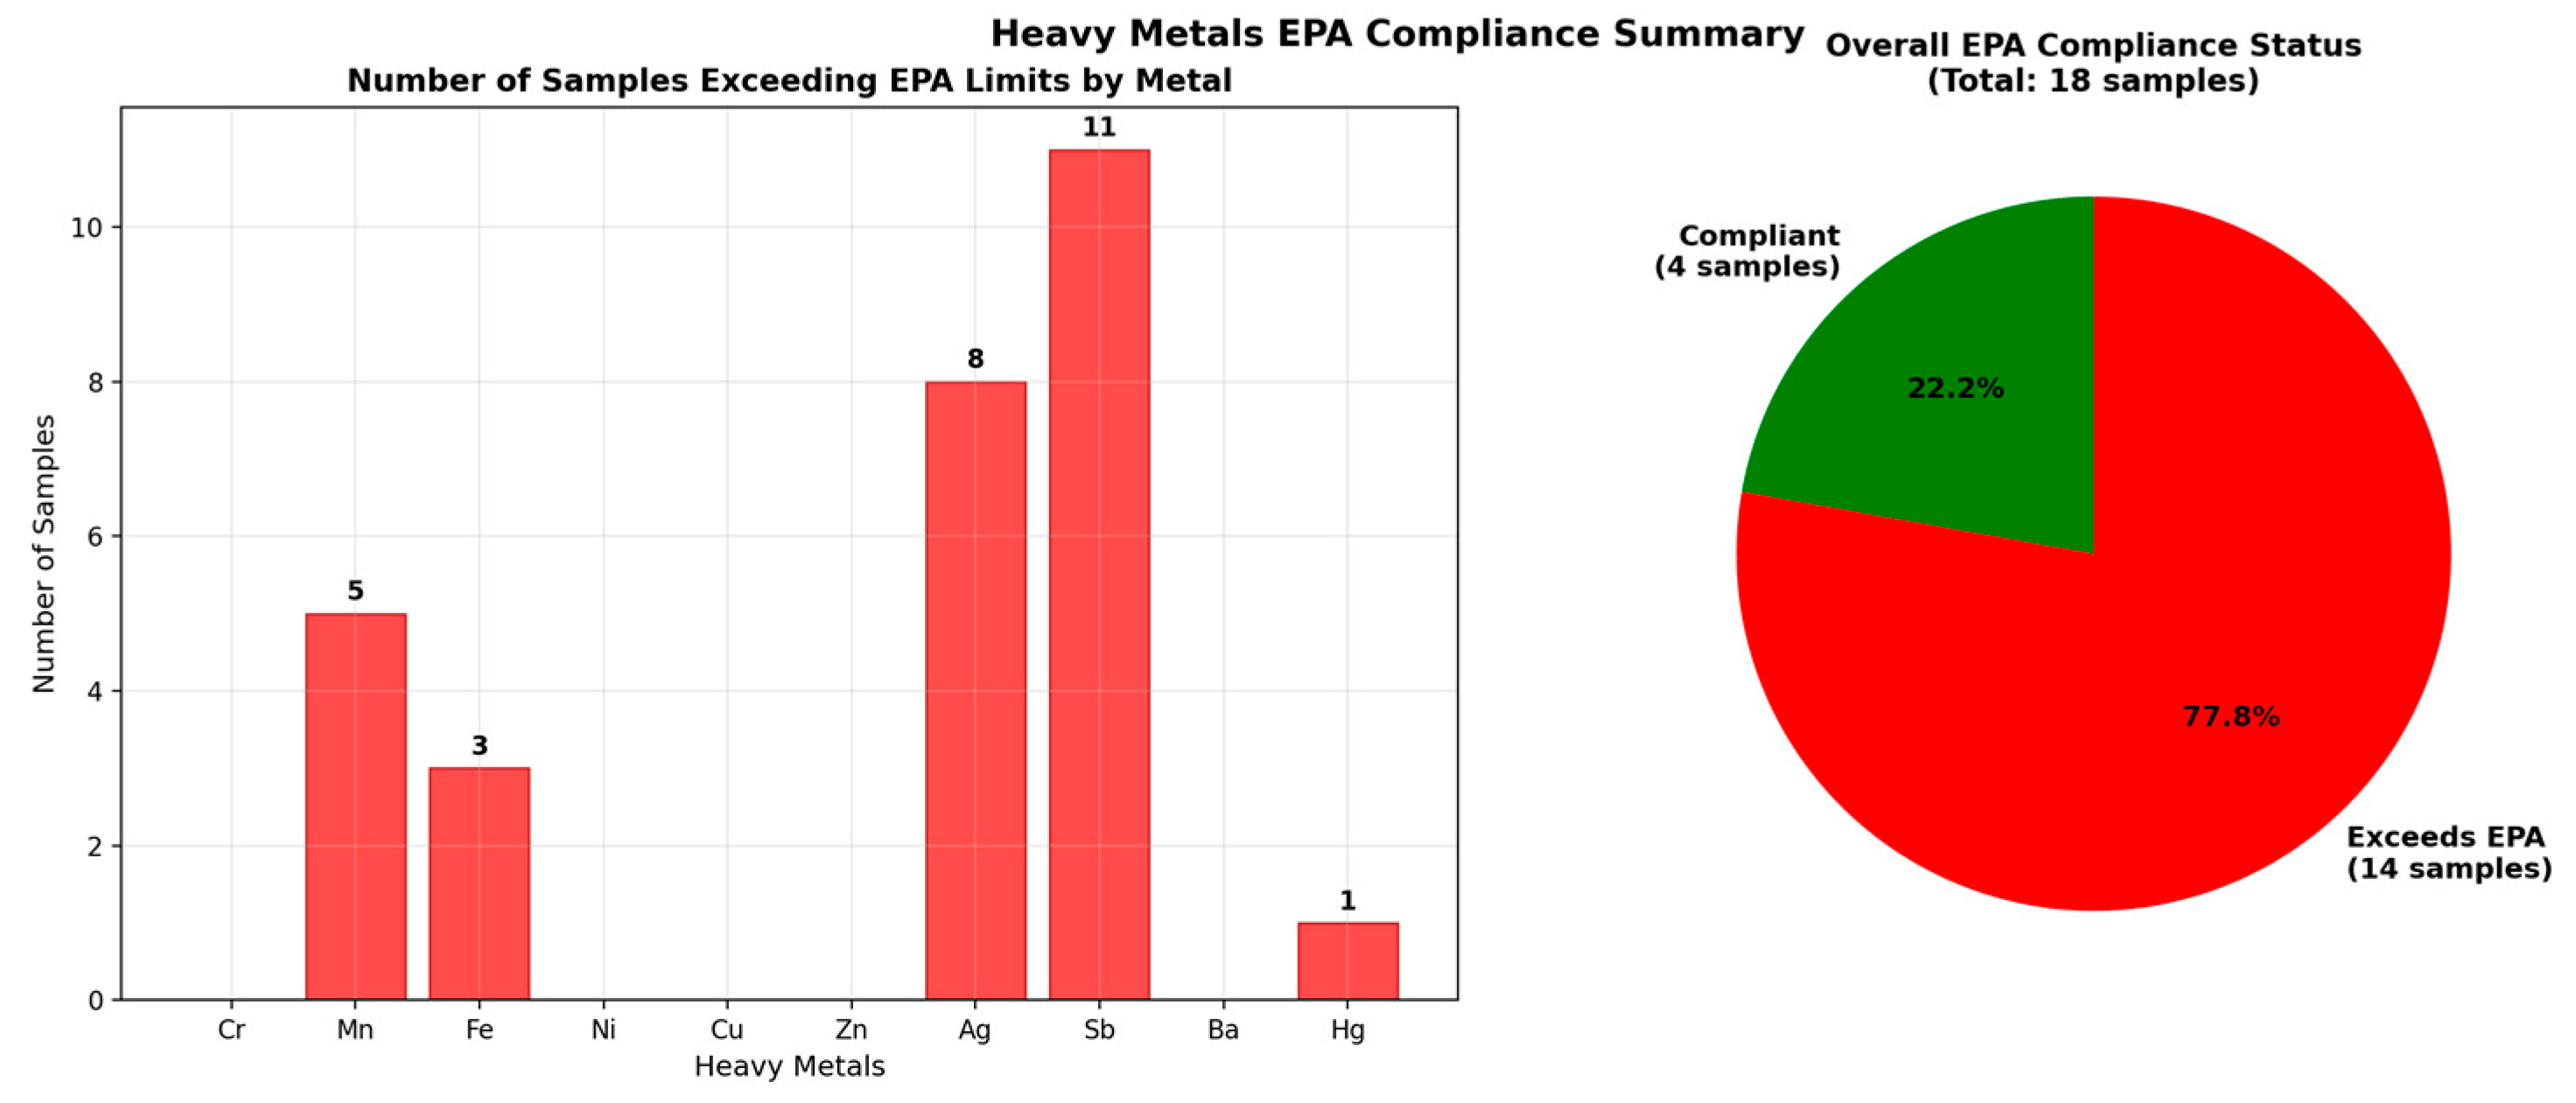
Figure 4,
Figure 5 and
Figure 6 illustrate the comparison of metal concentrations with EPA standards, highlighting exceedances for Mn, Fe, Sb, Ag, and Hg in selected sites, and provide an overall compliance summary across all samples.
The comparison of groundwater concentrations with international benchmarks indicated that most metals complied with the limits established by the U.S. Environ-mental Protection Agency (EPA) Maximum Contaminant Levels (MCLs) and the World Health Organization (WHO [
6]) drinking water guidelines. The specific regulatory thresholds applied in this study are summarized in
Table 1. Sporadic exceedances were observed for Mn, Fe, Sb, and Ag at certain sites, highlighting the importance of site-specific monitoring to ensure compliance with drinking water standards.
3.4. Risk Assessment Using TEL and PEL Thresholds
To assess possible ecological risks, metal levels in soil samples were compared with the Threshold Effect Level (TEL) and Probable Effect Level (PEL) standards, as shown in
Table 4.
TEL (Threshold Effect Level) and PEL (Probable Effect Level) values are based on the Canadian Council of Ministers of the Environment (CCME) sediment quality guidelines.
Cu and Zn exceeded TEL values in multiple sites, and Pb was found near or slightly above TEL in one site. Cr and Ni remained mostly below TEL across the board. PEL exceedances were rare but present for Cr and Zn at isolated sites.
3.5. Stable Isotope Results and Interpretation
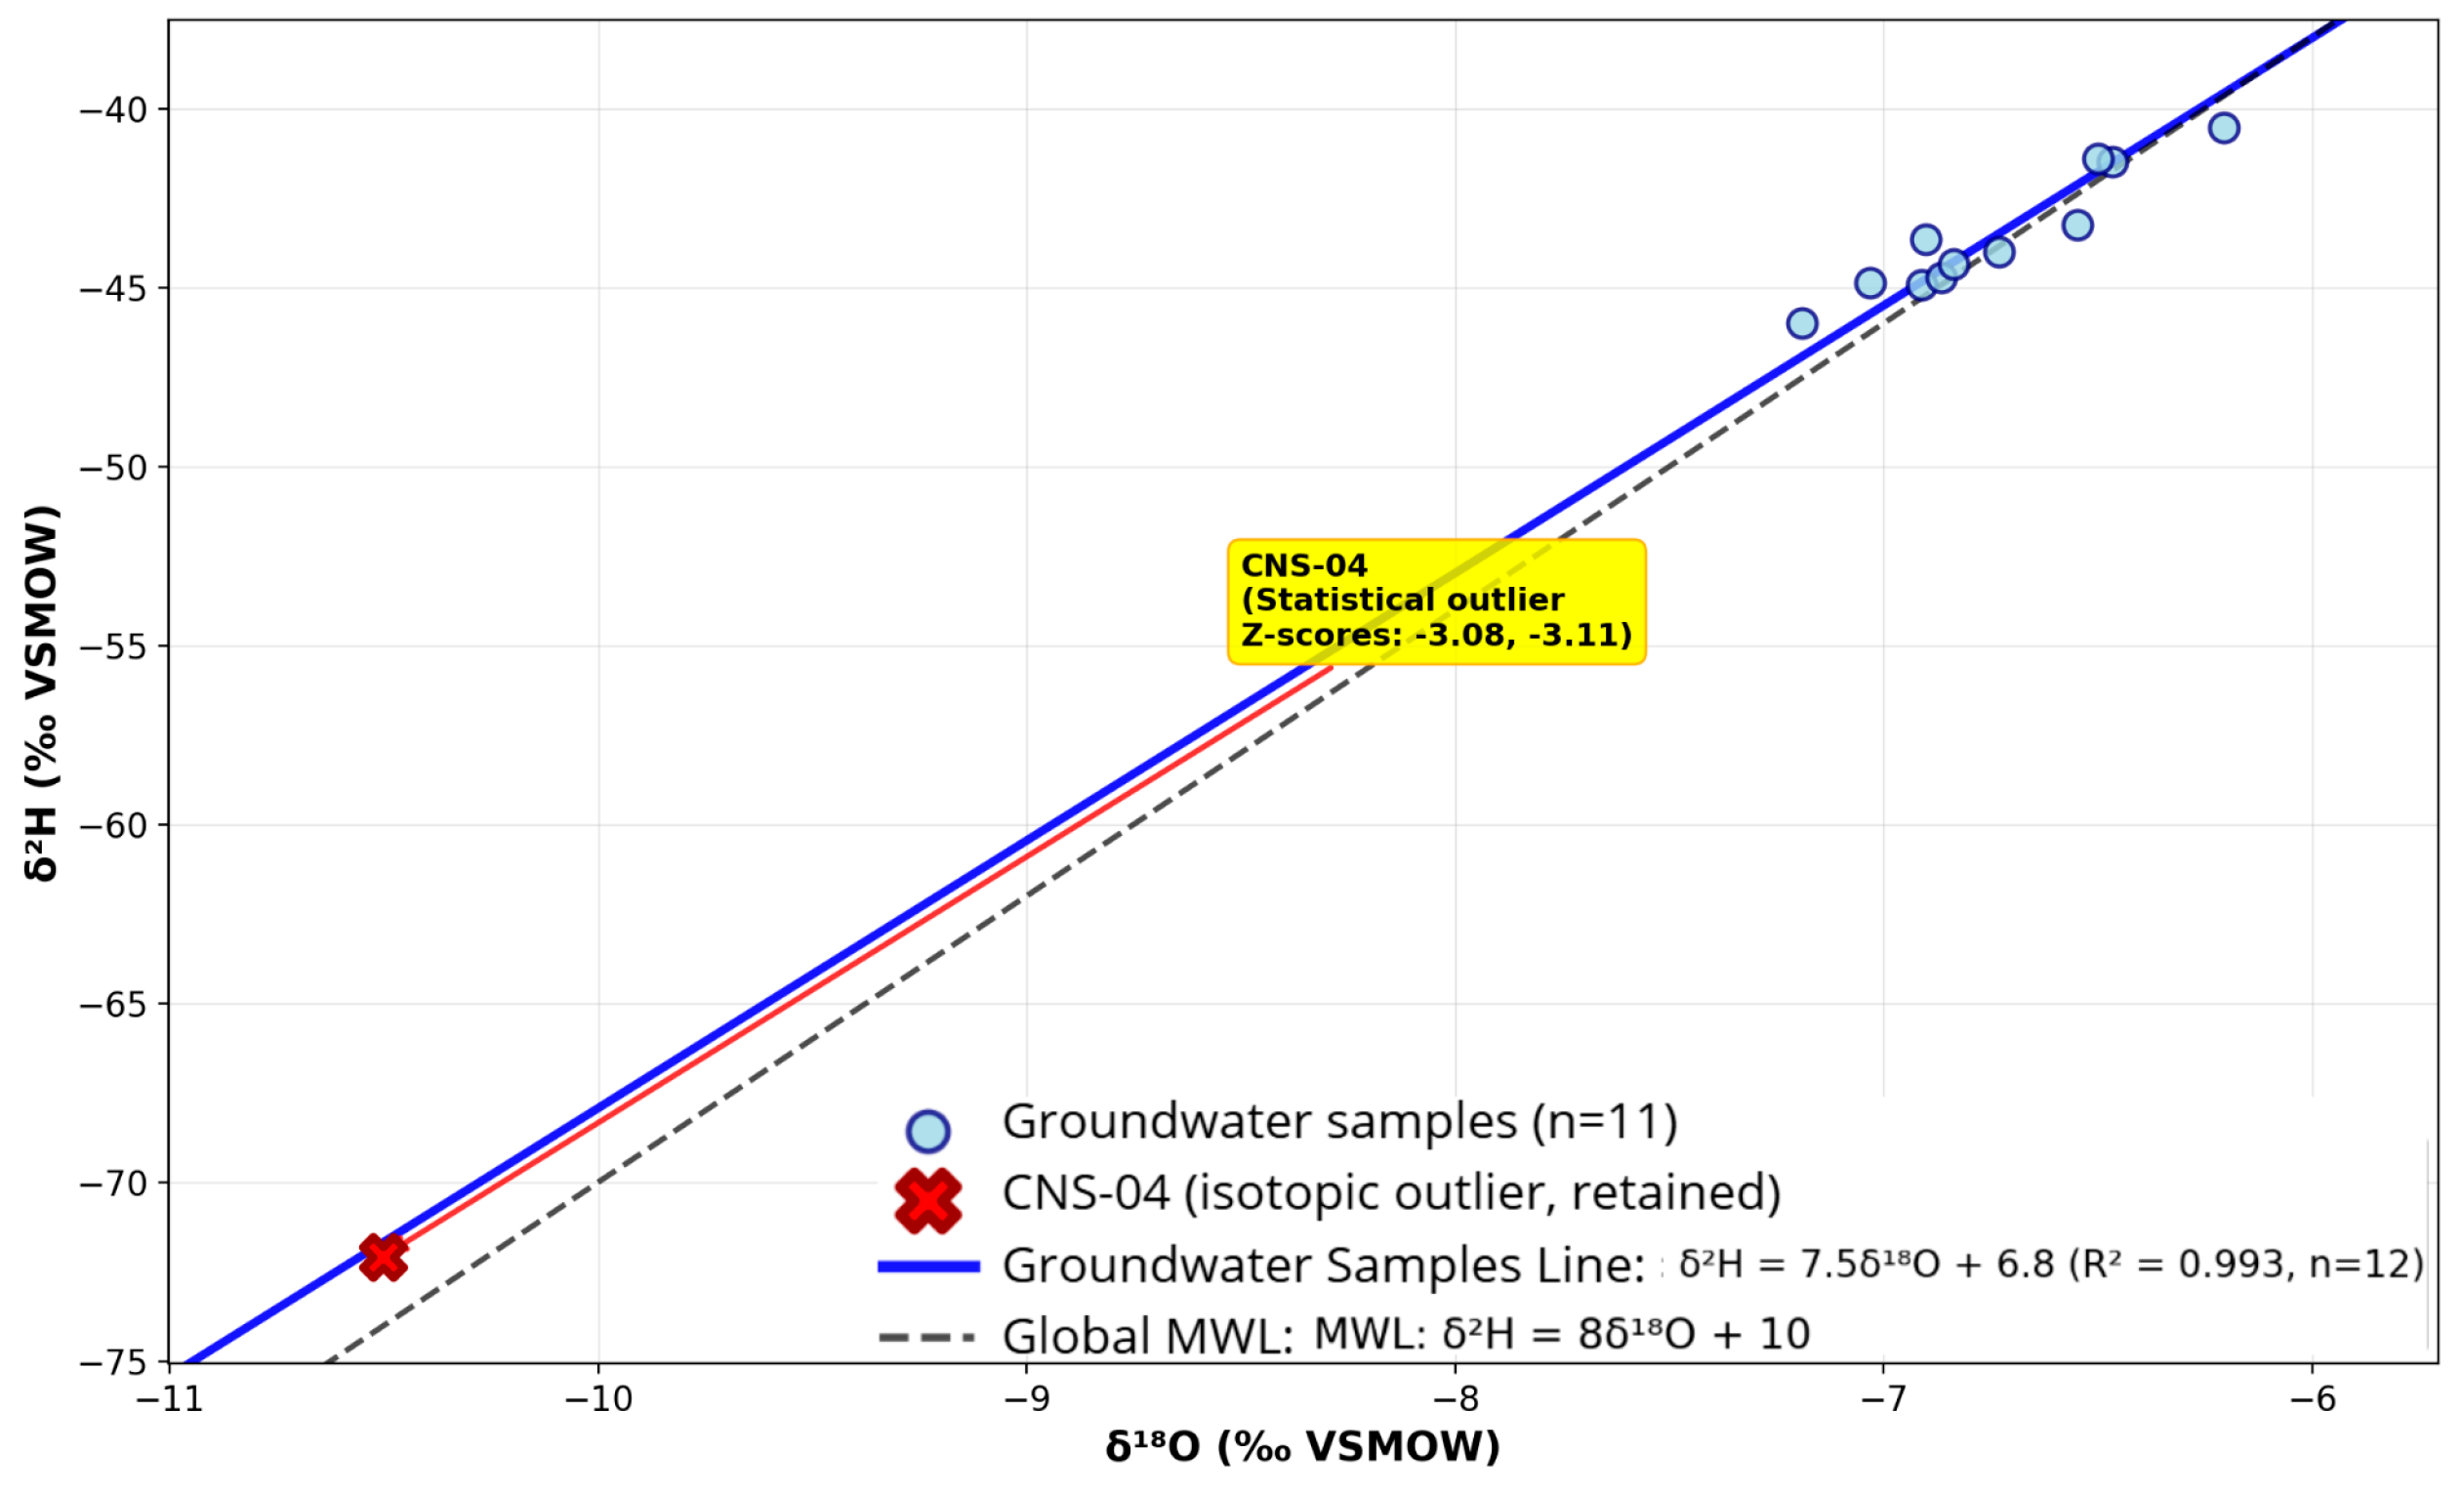
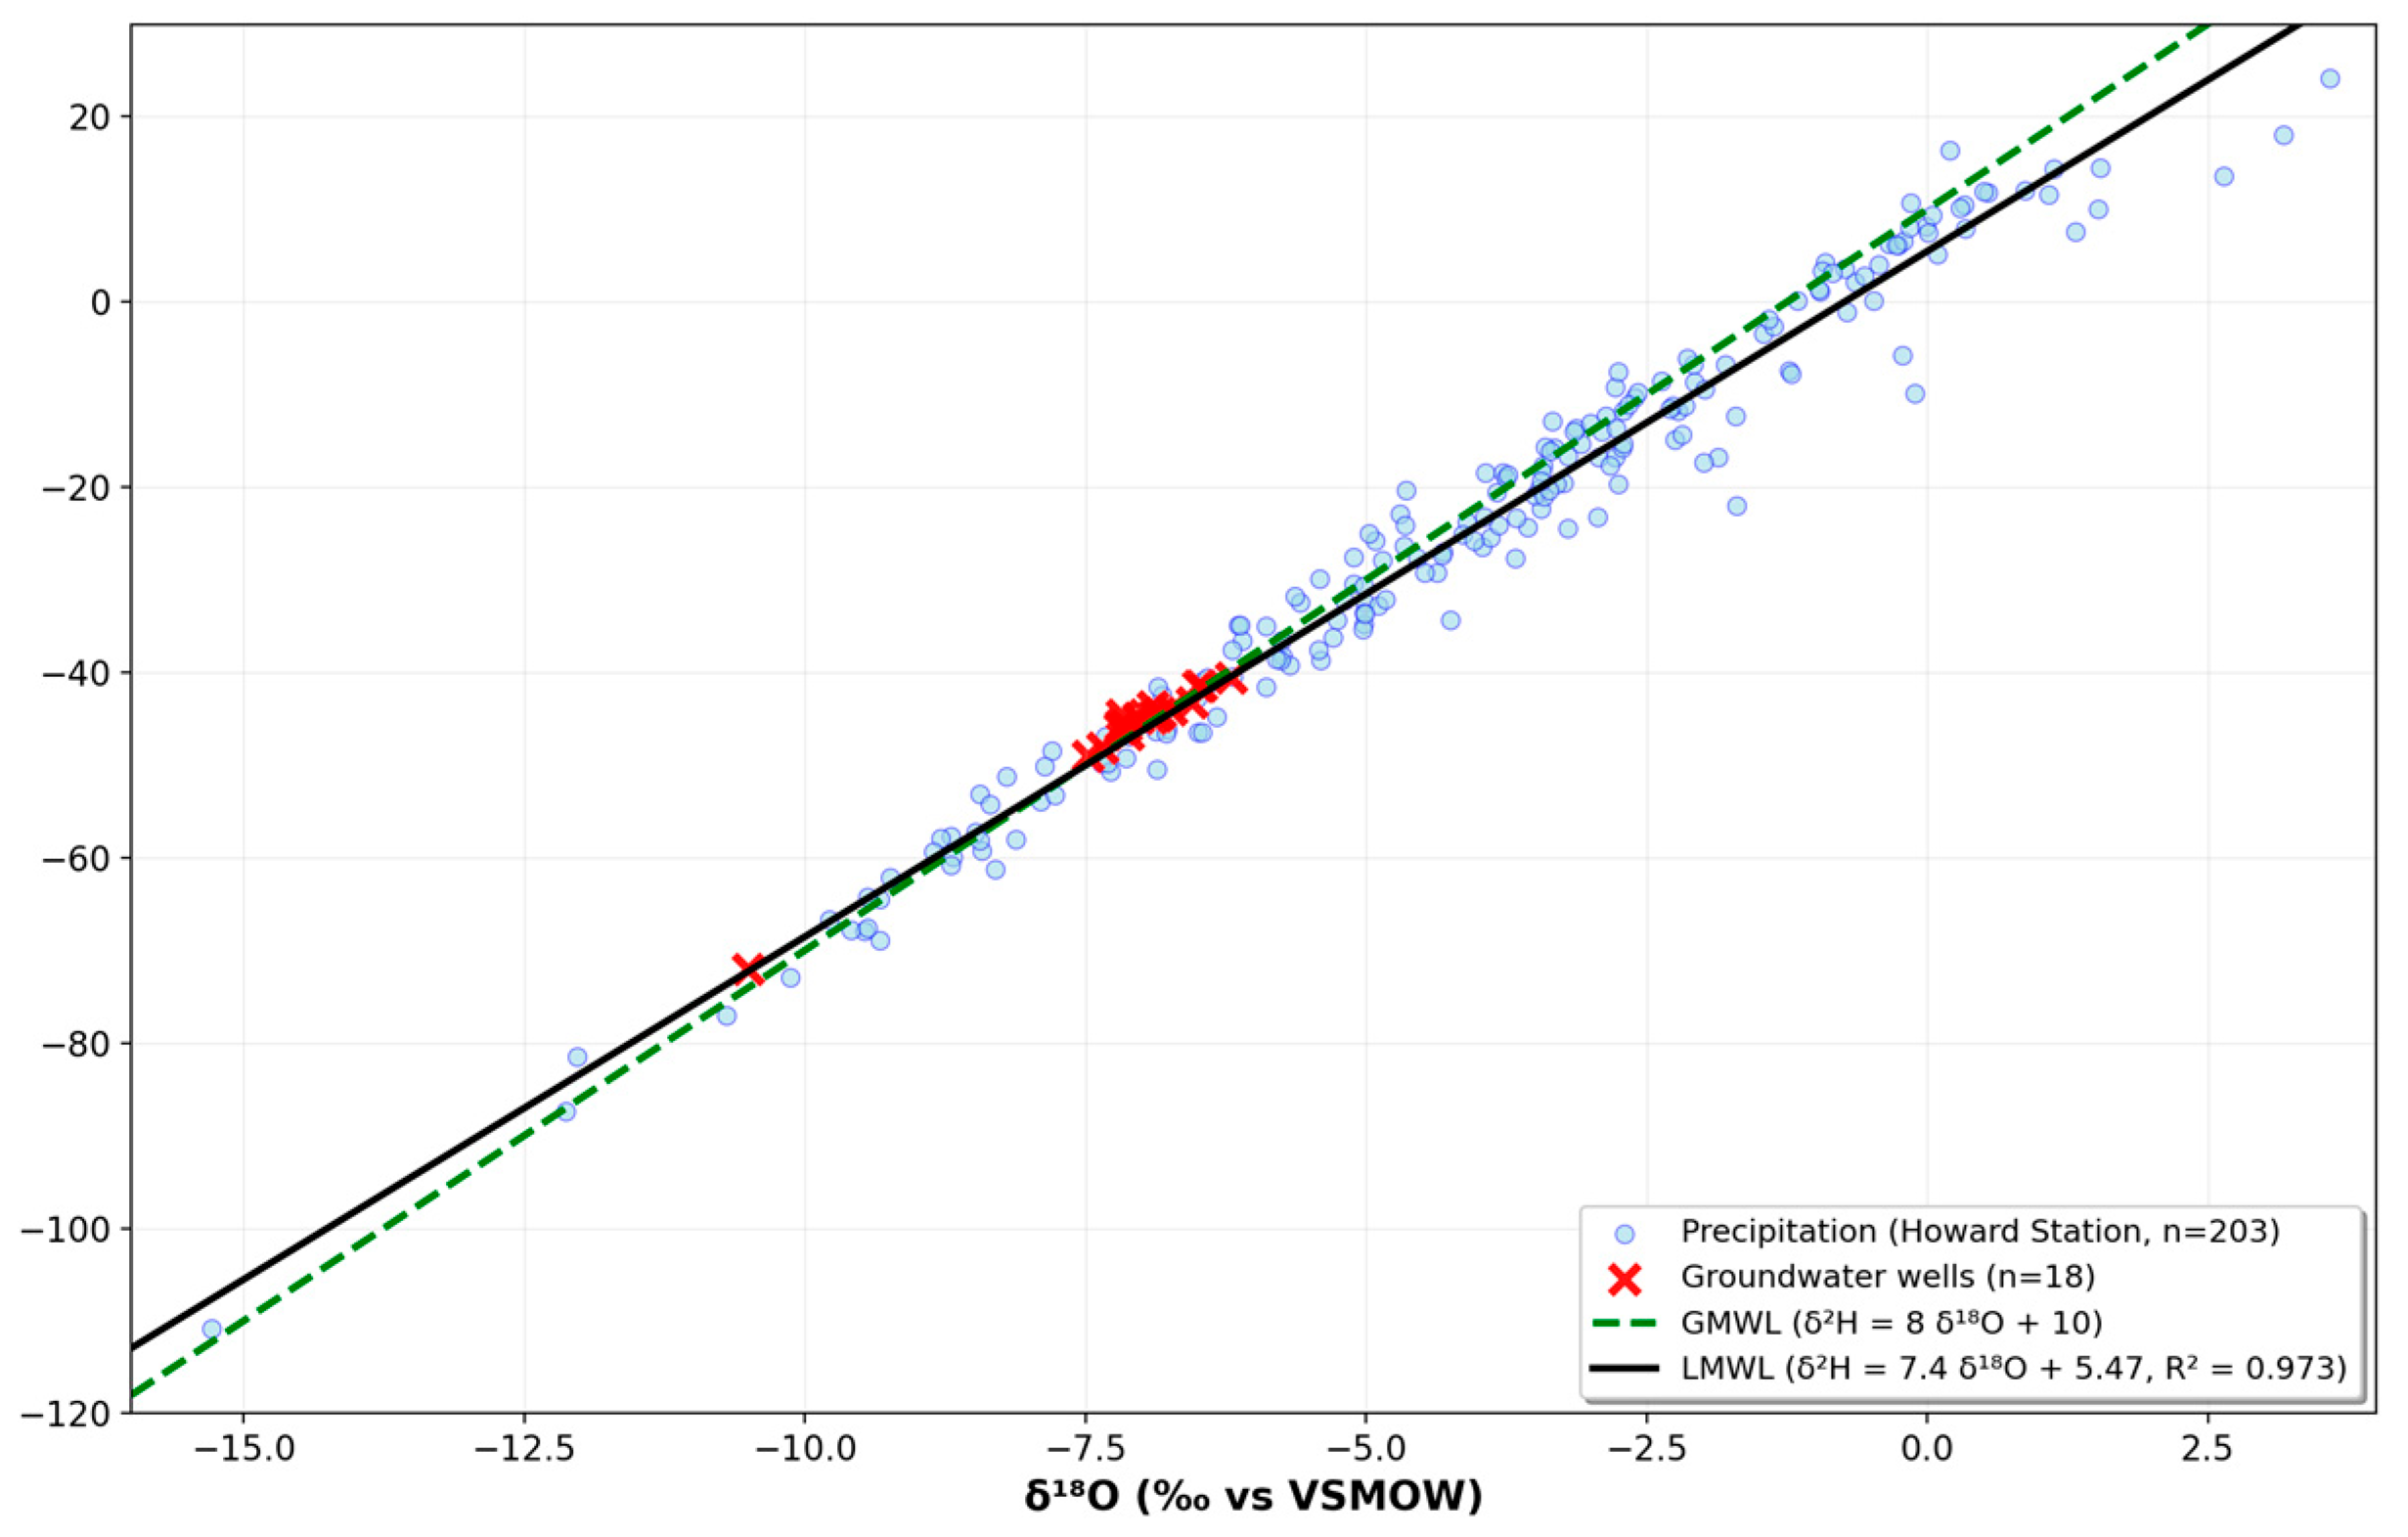
Groundwater samples were analyzed for their isotopic composition to identify the source of recharge and evaluate possible evaporation processes. δ
18O values varied between –10.5‰ and −6.21‰, whereas δ
2H values spanned from −72.08‰ to −40.53‰ (
Figure 7) (see
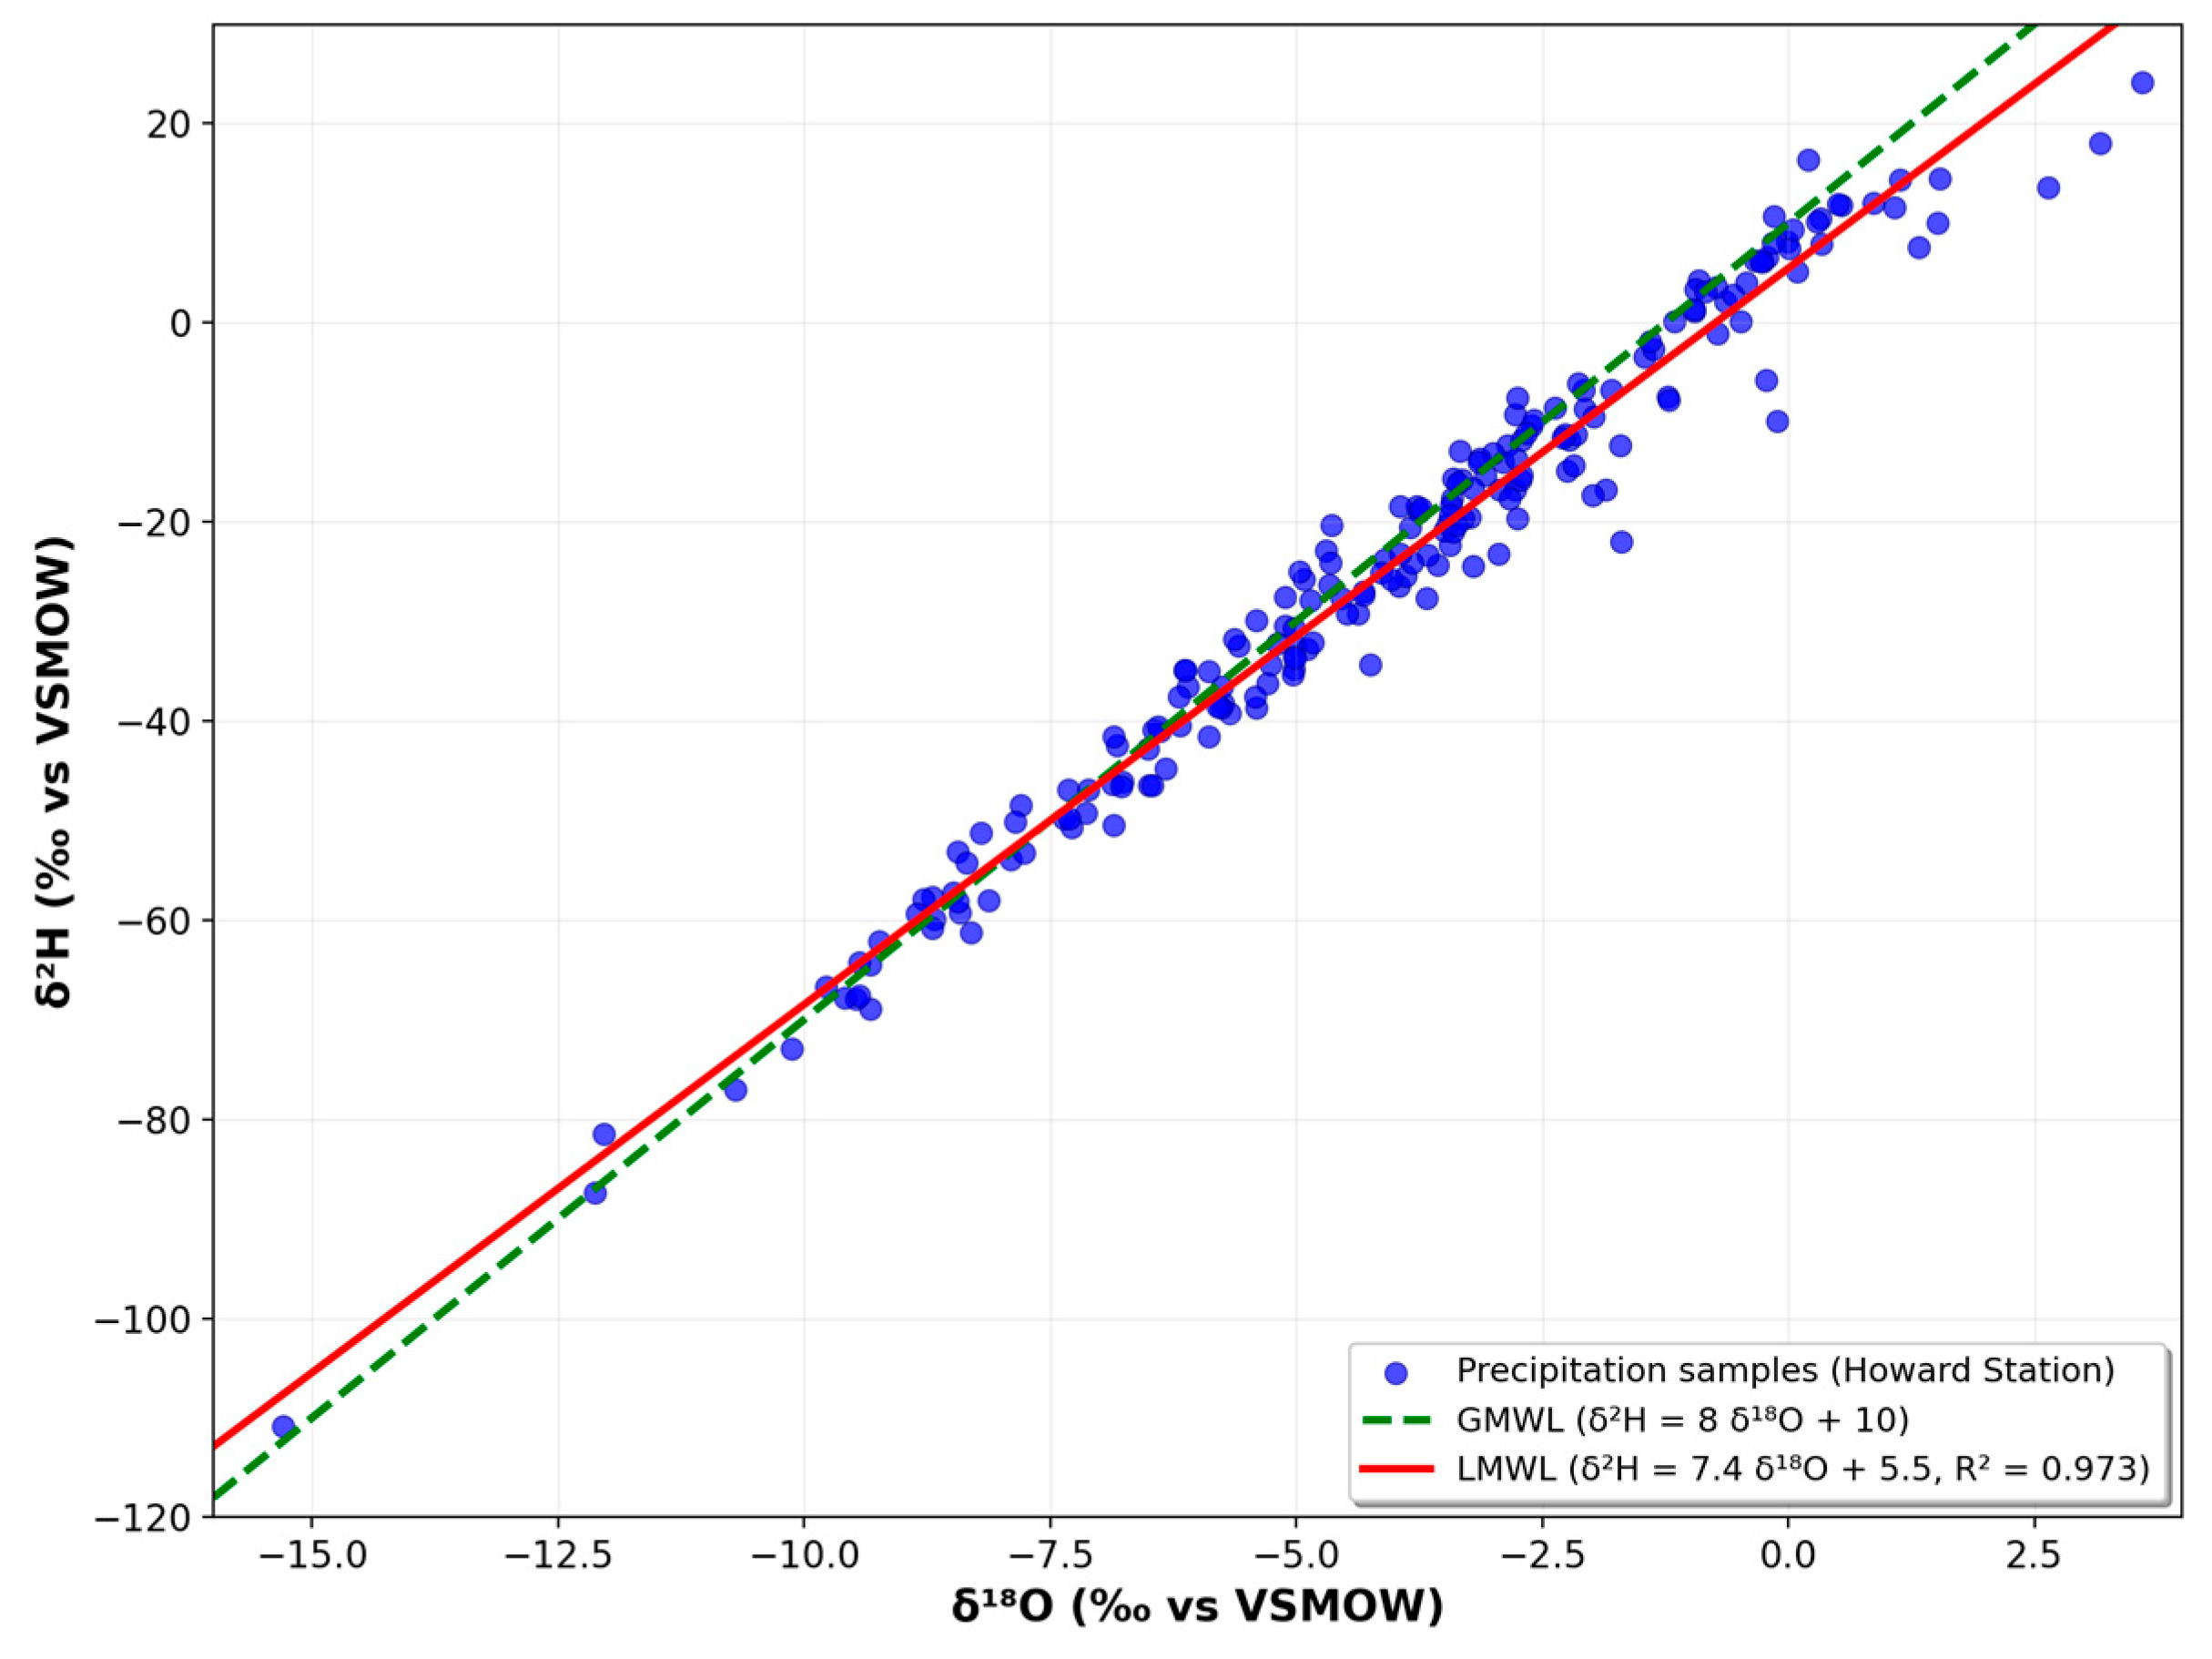
Supplementary Table S6 for isotopic data). These findings align with recharge from precipitation in tropical humid areas, where there is little evaporative enrichment before infiltration. Additional isotopic patterns are illustrated in
Figure 8 and
Figure 9, showing precipitation and groundwater sources relative to the Local Meteoric Water Line.
The Local Meteoric Water Line (LMWL) was constructed using historical data from the Global Network of Isotopes in Precipitation (GNIP) for the Howard station in Panama. Linear regression models of δ2H vs. δ18O were generated separately for precipitation, groundwater wells, and spring discharge points.
All three linear models showed statistical significance (p < 0.05), suggesting that the δ2H–δ18O connection effectively represents the isotopic makeup of each water type. Additionally, the analysis of covariance (ANCOVA) showed no significant differences in the slopes and intercepts among the three groups at the 95% confidence level (α = 0.05). This indicates a shared meteoric source for both wells and springs, suggesting that rainwater infiltrated and recharged the aquifers without suffering any major isotopic change. The groundwater isotopic line (n = 12) and LMWL (n = 202) had determination coefficients of 0.99 and 0.97, respectively.
For the isotopic analysis, 12 groundwater samples with complete isotopic measurements were analyzed. Sample CNS-04 shows the most depleted isotopic values (δ18O = −10.50‰, δ2H = −72.08‰) and represents a statistical outlier (Z-scores > 3.0). However, CNS-04 was retained in the groundwater isotopic line regression as it follows the same isotopic trend and significantly improves the overall correlation (R2 = 0.993 with CNS-04 vs. R2 = 0.902 without). This sample likely represents deeper or older groundwater with distinct recharge conditions.
Owing to insufficient data, isotopic comparison with surface water bodies was not conducted. Nonetheless, the resemblance between the isotopic signatures of precipitation and groundwater strongly suggests that direct rainfall infiltration mainly drives recharge in the study region.
3.6. Granulometric Characterization of Soil Samples
Grain size distribution analysis was performed on soil samples from four different sites in the Tonosí region to characterize sedimentary environments and assess their influence on metal mobility and retention. Parameters including mean grain size (Mz), sorting (σ), skewness (Ski), and kurtosis (Kg) were assessed using the Folk and Ward approach.
The findings showed a dominance of silt and sandy silt textures throughout the locations, with average grain size measurements varying between 6.89 µm and 29.7 µm (
Table 5).
Values varied from moderately to poorly sorted, indicating fluctuations in transport energy and sediment availability. The majority of samples showed positive skewness, indicating a prevalence of finer particles (coarse tail), which increases the likelihood of trace metal adsorption. Kurtosis values suggested primarily mesokurtic to leptokurtic distributions, characteristic of natural river systems.
These granulometric properties are essential for understanding trace metal dynamics in soil, since smaller particles with greater surface area are more likely to attach heavy metals via adsorption and complexation mechanisms. The variation seen among sites highlights the importance of factoring in soil texture when evaluating contaminant movement and ecological risk.
4. Discussion
The comprehensive examination of groundwater and soil samples from Tonosí indicates that the heavy metals found in the study area mainly originate from geogenic sources, showing little indication of extensive human-caused pollution. This conclusion is backed by various lines of evidence, such as elemental levels, enrichment factor (EF) values, comparison with international sediment quality standards (TEL and PEL), stable isotope ratios, and granulometric analysis.
Even though trace elements like Cr, Cu, and Zn were found in both groundwater and soil, their levels typically stayed beneath ecological risk limits. The soil EF assessment showed just one case of moderate to high enrichment—chromium at site GNA-01 (EF = 503.32)—with all other values falling within natural limits (EF < 1.5). This indicates that lithological and geochemical processes predominantly regulate metal inputs instead of human activities.
Comparable conclusions have been reached in tropical watersheds with minimal industrial engagement, where metal levels are influenced mainly by rock weathering and soil erosion [
15]. The geochemical signatures observed in groundwater are consistent with the local geology of Tonosí, which includes Cretaceous volcanic and ophiolitic units (K-Ve, K-CHAo) and Eocene-Oligocene tonalitic and rhyolitic intrusions (TEO-TO, TEO-RIQ). These lithologies naturally contribute elements such as Cr, Ni, Fe, and Mn, supporting the interpretation of predominantly geogenic metal sources in the study area.
In addition to the major elements discussed, calcium (Ca) and strontium (Sr), which were detected in soil samples (
Table 2), are interpreted as naturally occurring constituents of local lithologies and do not represent ecological or health concerns. Likewise, trace exceedances of mercury (Hg) observed in groundwater (
Figure 5) were rare and isolated, and should be interpreted with caution given the analytical detection limits. These findings reinforce the conclusion that the overall geochemical patterns are dominated by geogenic inputs, with only sporadic anomalies that warrant continued monitoring.
Stable isotope analysis of groundwater (δ
2H and δ
18O) additionally confirms a meteoric source for recharge, showing no notable isotopic variation that would suggest evaporation or mixing. This discovery indicates that rainfall infiltration is the primary force behind groundwater recharge, which is a crucial part of the global water cycle and essential for sustainably managing groundwater resources. Overall, well samples were more enriched than spring samples. This pattern is likely explained by the fact that most wells were in lowland areas, whereas most spring samples were collected at higher elevations. The dataset included one well with isotopically depleted water relative to the others. This well, located near the coast, is thought to tap a confined aquifer containing paleowater, likely recharged under colder climatic conditions. As a result, the groundwater from this well shows more depleted isotope values compared to the current LMWL. Similar observations have been reported in other studies, where groundwater identified as paleowater exhibited significantly more negative stable isotope values than those of recently recharged water from un-confined aquifers [
16,
17]. In one study, tritium dating confirmed that the strongly depleted groundwater was indeed paleowater [
16].
In humid tropical areas with porous soils and minimal surface runoff, the infiltration of rainfall is a key factor in facilitating this recharge process. The comparable slopes of regression for precipitation, wells, and springs, validated through ANCOVA, reinforce the hypothesis of isotopic equilibrium and limited change from human activities.
Risk evaluation using TEL and PEL standards for soil indicated localized exceedances for Cu and Zn, especially in regions with agricultural practices or interactions between shallow aquifers and surface water. Nonetheless, the restricted scale and geographic spread of these exceedances indicate that these risks are more isolated than systemic.
It is important to emphasize that ecological risk benchmarks based on TEL and PEL thresholds were restricted to soil data only, in accordance with their intended use for sediment matrices. For groundwater, regulatory comparisons were made exclusively against EPA Maximum Contaminant Levels (MCLs), secondary standards, and WHO ([
6]) drinking water guidelines (
Table 1). This distinction ensures that the interpretation of water quality is based on health-related regulatory frameworks and avoids the misapplication of sediment thresholds to aquifer systems. These regulatory benchmarks, summarized in
Table 1, provided the framework for interpreting groundwater quality results and identifying exceedances of Mn, Fe, Sb, and Ag in specific sites, as shown in
Figure 4,
Figure 5 and
Figure 6.
The granulometric examination adds an essential aspect to understanding soil quality. Samples with finer textures demonstrated somewhat increased metal retention, a result that aligns with the established attraction of clay and silt fractions for trace metals because of their large surface area and ion exchange capability. In contrast, inadequately sorted sandy soil showed reduced concentrations, indicating restricted adsorption and a higher potential for mobility.
This research highlights the importance of combining various environmental data sources to evaluate contamination risks in rural groundwater systems. The integration of TXRF elemental quantification, stable isotope analysis, EF and TEL/PEL comparison, along with soil texture profiling, offers a strong framework for comprehending metal dynamics in areas with low population density and significant geological variability.
Crucially, the research highlights the necessity for ongoing observation at critical sites like GNA-01 and areas where Cu or Zn neared risk limits. Considering the possible effects on drinking water safety and the health of aquatic ecosystems, these results provide a scientific foundation for focused monitoring and community involvement in the protection of water resources.
5. Conclusions
This research presents the first integrated hydrogeochemical and isotopic evaluation of rural groundwater and soil in Tonosí, Panama, emphasizing not only heavy metal presence but also stable isotope signatures (δ2H and δ18O) that confirmed meteoric recharge and limited evaporative influence in groundwater and soil samples from Tonosí, Panama—a locality with scarce previous environmental oversight. Employing a multidisciplinary approach that integrates TXRF elemental analysis, stable isotope profiling, soil enrichment indices (EF), TEL/PEL risk thresholds, and granulometric characterization, the study produced several important findings:
Mainly Natural Metal Source: The levels of Cr, Cu, Zn, and additional metals in groundwater and soil were primarily within natural limits, showing EF values under 1.5 in all but one site. This indicates that the presence of metals is mostly geogenic, probably arising from the natural weathering of nearby lithologies instead of human influence.
Localized Enrichment of Chromium: One location (GNA-01) demonstrated a significantly elevated EF for Cr (503.32), suggesting possible lithological irregularities or localized pollution. Even though this seems to be a singular incident, additional examination is advised to determine its source and possible dangers.
Soil Ecological Risk Based on TEL/PEL: The evaluation of soil samples against TEL and PEL thresholds indicated localized exceedances for Cu and Zn, especially in agricultural areas or sites with interaction between shallow aquifers and surface water. However, the restricted scale and distribution of these exceedances suggests that ecological risks are isolated rather than systemic.
Groundwater Compliance with EPA/WHO Guidelines: Most groundwater samples complied with EPA Maximum Contaminant Levels (MCLs) and WHO ([
6]) drinking water standards, although sporadic anomalies were observed for Mn, Fe, Sb, and Ag in specific sites. These exceedances underline the importance of site-specific monitoring to safeguard human health.
Isotopic Signatures Confirm Meteoric Recharge: Groundwater sample δ2H and δ18O values closely align with the Local Meteoric Water Line, suggesting recharge from direct rainfall infiltration and limited evaporative enrichment. This validates that groundwater mainly originates from precipitation, reinforcing the understanding of limited human impact.
Granulometry Affects Metal Retention: Soils with finer texture showed marginally elevated levels of specific metals, aligning with enhanced adsorption capability. This emphasizes the significance of soil texture in understanding contaminant behavior and indicates that soil makeup must be included in upcoming risk evaluations.
TXRF as a Quick, Precise Method for Rural Monitoring: The application of Total Reflection X-ray Fluorescence (TXRF) facilitated the simultaneous detection of multiple elements in water and soil with minimal sample preparation, highlighting its potential as an economical approach for environmental monitoring in resource-constrained environments.
Results indicate that heavy metal concentrations are predominantly of geogenic origin, with only localized anomalies (e.g., Cr at GNA-01, sporadic exceedances of Mn, Fe, Sb, Ag, and Hg) that require targeted monitoring. Soil risk evaluation using TEL/PEL revealed isolated Cu and Zn exceedances, while groundwater quality generally complied with EPA and WHO drinking-water standards. Stable isotope analysis confirmed meteoric recharge with minimal evaporative influence, and granulometric data emphasized the role of fine textures in metal retention. Overall, these findings highlight the need for continued site-specific monitoring and provide a scientific basis for sustainable rural water management.
